Article

Removal of Low-Molecular Weight Aldehydes by Selected Houseplants under Different Light Intensities and CO2 Concentrations

1
Key Laboratory of Jiangxi Province for Persistant Pollutants Control and Resources Recycle, School of Environmental and Chemical Engineering, Nanchang Hangkong University, Nanchang 330063, China
2
Department of Biomedical, Chemical and Environmental Engineering, University of Cincinnati, Cincinnati, OH 45221, USA
3
School of Basic Science Departments, East China Jiaotong University, Nanchang 330013, China
*
Authors to whom correspondence should be addressed.
Atmosphere 2016, 7(11), 144; https://doi.org/10.3390/atmos7110144
Submission received: 11 October 2016 / Revised: 5 November 2016 / Accepted: 9 November 2016 / Published: 11 November 2016

Abstract

:
The removal of five low-molecular weight aldehydes by two houseplants (Schefflera octophylla (Lour.) Harms and Chamaedorea elegans) were investigated in a laboratory simulation environment with short-term exposure to different low light intensities and CO2 concentrations. Under normal circumstances, the C1–C5 aldehyde removal rates of Schefflera octophylla (Lour.) Harms and Chamaedorea elegans (Lour.) Harms ranged from 0.311 μmol/m2/h for valeraldehyde to 0.677 μmol/m2/h for formaldehyde, and 0.526 μmol/m2/h for propionaldehyde to 1.440 μmol/m2/h for formaldehyde, respectively. However, when the light intensities varied from 0 to 600 lx, a significant correlation between the aldehyde removal rate and the light intensity was found. Moreover, the CO2 experiments showed that the total aldehyde removal rates of Schefflera octophylla (Lour.) Harms and Chamaedorea elegans (Lour.) Harms decreased 32.0% and 43.2%, respectively, with increasing CO2 concentrations from 350 ppmv to 1400 ppmv. This might be explained by the fact that the excessive CO2 concentration decreased the stomatal conductance which limited the carbonyl uptake from the stomata.

1. Introduction

The adverse effect of indoor air pollution has become an issue of international concern since most people spend a large percentage (more than 80%) of their time in indoor environments [1,2,3,4,5]. Among various indoor air pollutants, low molecular weight aldehydes (≤C5) are an important class of volatile organic compounds not only because some are classified as known or probable human carcinogens (e.g., formaldehyde and acetaldehyde), but also for their high concentrations and reactivity in urban atmospheres [6,7]. The indoor sources of these low molecular weight carbonyls include off gas from building materials, incense burning, cigarette smoke, and cooking [8,9]. Outdoor sources, such as fuel combustion, vehicle exhaust, industrial exhaust gas, and photochemical reactions (US National Research Council, 1981), can also enter indoors adding to indoor pollution. Therefore, many researchers have investigated carbonyl concentrations in indoor air [10,11,12,13,14]. Weng et al. reported that the total mean concentration of low molecular weight aldehydes (C1–C5) were even higher than 200 μg/m3 in indoor residential air in Hangzhou, China, in summer months [15].
In order to improve indoor air quality, various studies have been performed using houseplants to absorb the indoor air pollutants [16,17,18,19]. Previous studies reported that plants can absorb inorganic pollutants such as SO2, CO, O3, and NOx [20,21], and also eliminate volatile organic compounds as well, such as formaldehyde, benzene, polycyclic aromatic hydrocarbon(PAHs) and polychlonnated biphenyl (PCBs) [4,16,22,23,24]. Plants can remove gaseous pollutants by absorption through the stomata, and adsorption on the cuticle or epidermis of the leaf.
The uptake of contaminants by plants occurs via many different kinds of pathways [25], with stomatal and cuticular pathways being the two most common pathways for pollutants entering into the plant body [22,26]. Plant leaves with a larger uptake surface area than other tissues are expected to absorb contaminants in a considerable quantity from air via the stomata and the cuticle, and passing through the stomata or traversing the epidermis covered with wax cuticles seem to be effective actions for a contaminant to penetrate into a leaf [27,28,29,30]. The majority of pollutants can be absorbed and on penetrating into plant cells undergo enzymatic transformations to decrease the toxicity to plants, while their fate depends on their chemical nature, variety of plant, and phase of vegetation, etc. [31].
Light is known to induce plant stomatal movement, which in turn can affect pollutant removal [32]. It is known that formaldehyde and acetaldehyde can be taken up through stomata by plants and then participate in the plants metabolism [16,33]. However, the impact of light intensity on other low-molecular weight aldehydes (e.g., C3-C5 aldehydes) is still unknown.
In addition, CO2 concentration is another factor that can affect plant physiological activities. Nowadays, the Earth’s atmospheric CO2 concentration increase has resulted in a great concern for global warming. The CO2 level increased from about 300 μmol/mol in 1900 to about 390 μmol/mol in 2009, with nearly a 2 μmol/mol annual rate of CO2 increase [34,35,36]. Rising CO2 may cause significant variation to the ecosystem, especially for terrestrial plants, and it may be expected to have a profound impact on photosynthesis, growth, and nutritional quality [37,38,39]. It has been reported that high CO2 concentrations can induce stomatal closure, which is a response of plants facing environmental changes, and consequently impacts on the ability to absorb air pollutants [40,41,42]. Broadmeadow et al. reported that increased CO2 concentrations may lead to a reduction in stomatal conductance limiting O3 uptake by trees [43]. Moreover, exposure to elevated CO2 may alter the votatile organic compound (VOCs) exchange balance between the leaf and the atmosphere, for example, the limitation of C6–C10 aldehydes emission via its internal control mechanism [44]. However, the effects of elevated CO2 concentration on the absorption of carbonyls has been rarely reported. The overall aim of this paper is to investigate the removal characteristics of low molecular weight aldehydes (≤C5) by houseplants under different environmental conditions to provide basic data for future plant removal mechanism research.

2. Materials and Methods

2.1. Plant Materials and Growing Conditions

Two houseplant species were selected, including Schefflera octophylla (Lour.) Harms and Chamaedorea elegans (Lour.) Harms in pots (the pot diameter was about 16 cm, and the houseplant about 30 cm height). These species were selected for their widespread use in the indoor environment in Chinese homes. They were kept in their initial pots and potting soil, exactly as they were purchased from the market. The plants were watered and supplied with nutrient solution as needed during an acclimatization period in the lightness laboratory, and acclimatized for more than three months. All flowerpot walls and soils were packaged during the experiment period with silver paper previously baked for 4 h at 550 °C.

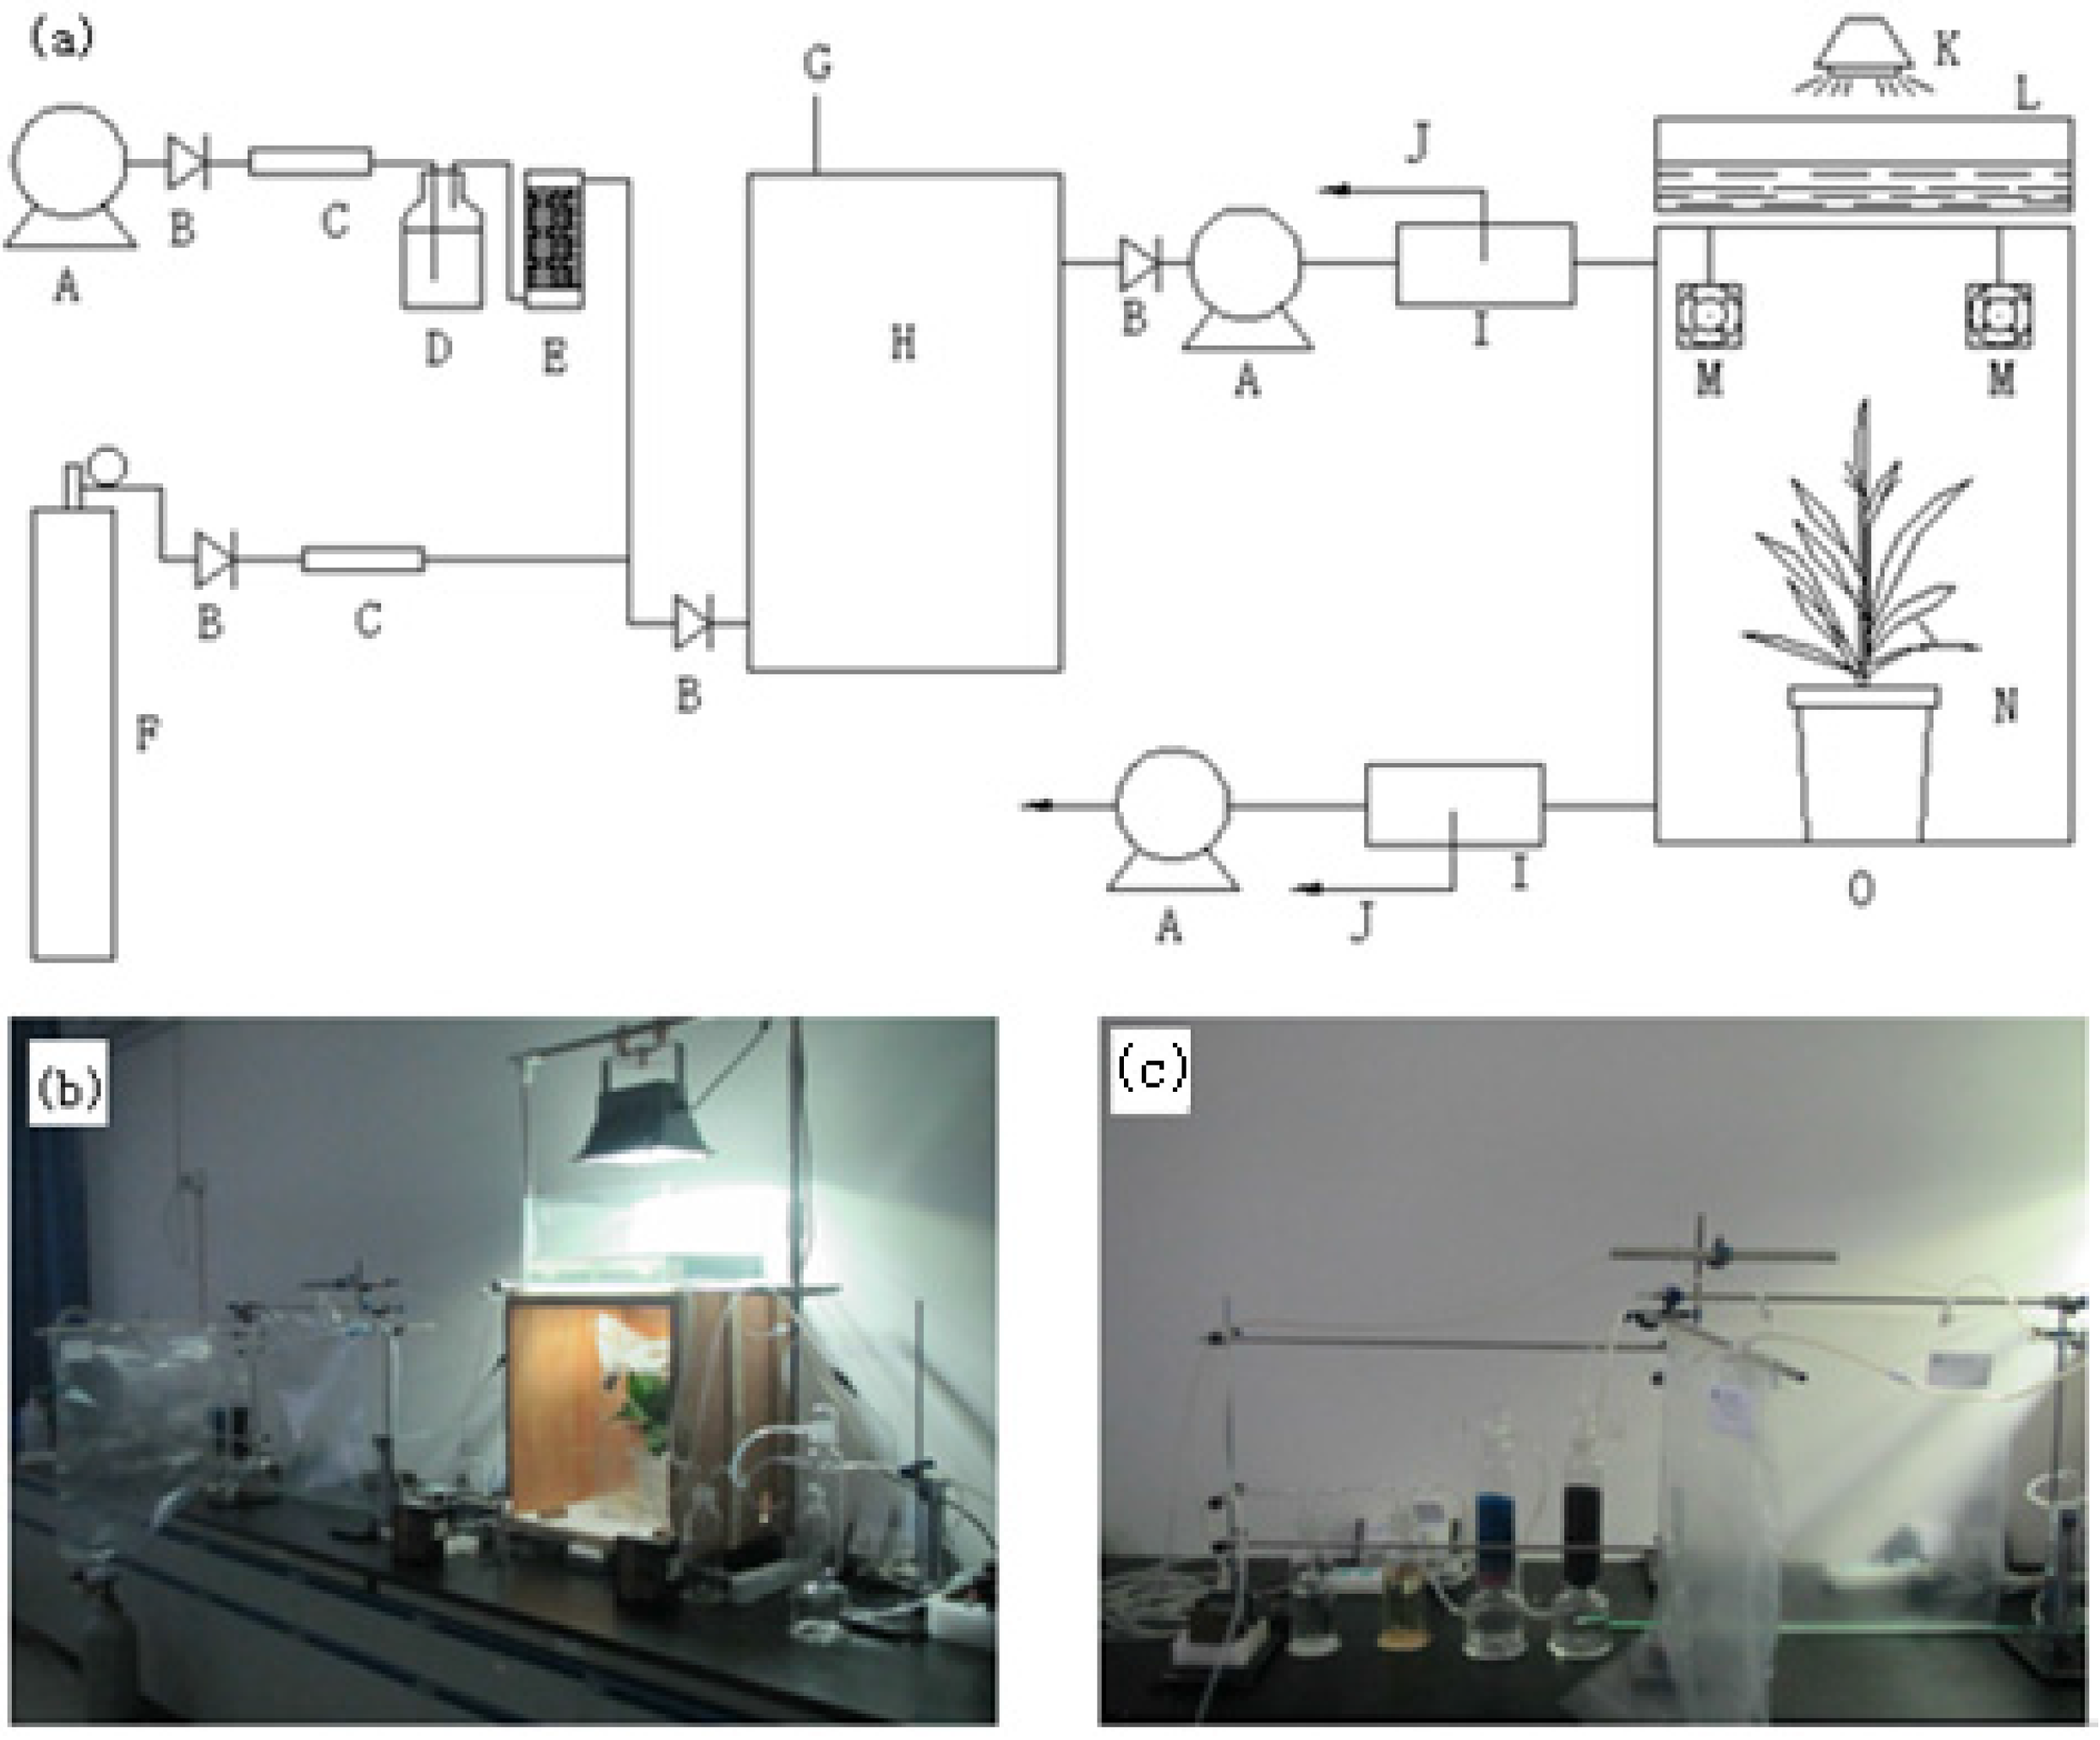
2.2. Reagents and Apparatus

Aldehydes including formaldehyde (37% in water), acetaldehyde (99.5%), propionaldehyde (99.3%), n-butyraldehyde (99.5%), and valeraldehyde (99.3%) were purchased from Chemservice Corporation (West Chester, PA, USA). Hexane (Absolv grade) was from TEDIA Corporation (Fairfield, OH, USA). Pentafluorophenyl hydrazine (PFPH, 97%, acting as a derivitization agent) and 4-fluorobenzaldehyde (98%, acting as an internal standard) were from Sigma-Aldrich (Munich, Germany). Tenax TA (60/80 mesh) was from CNW Technologies GmbH (Düsseldorf, Germany). High purity nitrogen (99.999%) and quantitative CO2 (99.999%) were also used in the experiments.
Figure 1 shows the apparatus for measuring the removal rates of carbonyls by plants. The apparatus includes two main parts: a gaseous aldehyde generation system and a dynamic exposure chamber of plant removal. The exposure chamber (O) was a clear Tedlar bag (40 L volume, Dupont, Wilmington, DE, USA, in accordance with To-9 standard, EPA) with two valves made of Teflon PTFE materials, and its interior was supported by a rigid Teflon tube. The open side of the bag at the bottom of the chamber was sealed with Teflon sellotape, and the enclosed volume except for the plant materials was 15–20 L. Two 0.5 L buffer vessels (I) were equipped at its inlet and outlet for sampling. These apparatus were connected by a Teflon flexible tube.
Dinitrophenylhydrazine (DNPH)-Acid aqueous solution (D) and activated carbon (E) were used to remove objective carbonyls and other VOCs from the outside air. The recycle gas flow was about 1 L/min with mean temperature and relative humidity of 25 ± 1.0 °C and 50% ± 5%, respectively. In order to balance the mixture of aldehyde concentration and water vapor, two small fans (M) were equipped internally in the Tedlar bag (O). However, the fans of the chamber could interfere with gas exchange and the physiological processes of the plants, and contribute to unrealistic results. Plants were illuminated with a metal halide lamp, and the light intensity was controlled by a water filter on the exposure chamber by adjusting the depth of the water and the distance from the light source. The light intensity was measured by a portable light meter (TES-1332A, TES-Electronic Industrial Corp., Taipei, Taiwan).
Gaseous aldehyde standards were prepared in the other Tedlar bag (acting as a gas mixing bag (H)). The liquid standards of C1–C5 aldehydes were injected quantitatively into the gas mixing bag (H) through the injection port (G) with a microsyringe, then, the pure air and quantitative CO2 were introduced into the bag simultaneously. The different carbon dioxide concentrations required were obtained by controlling the high purity CO2 (99.999%) gas flow and the charge time.

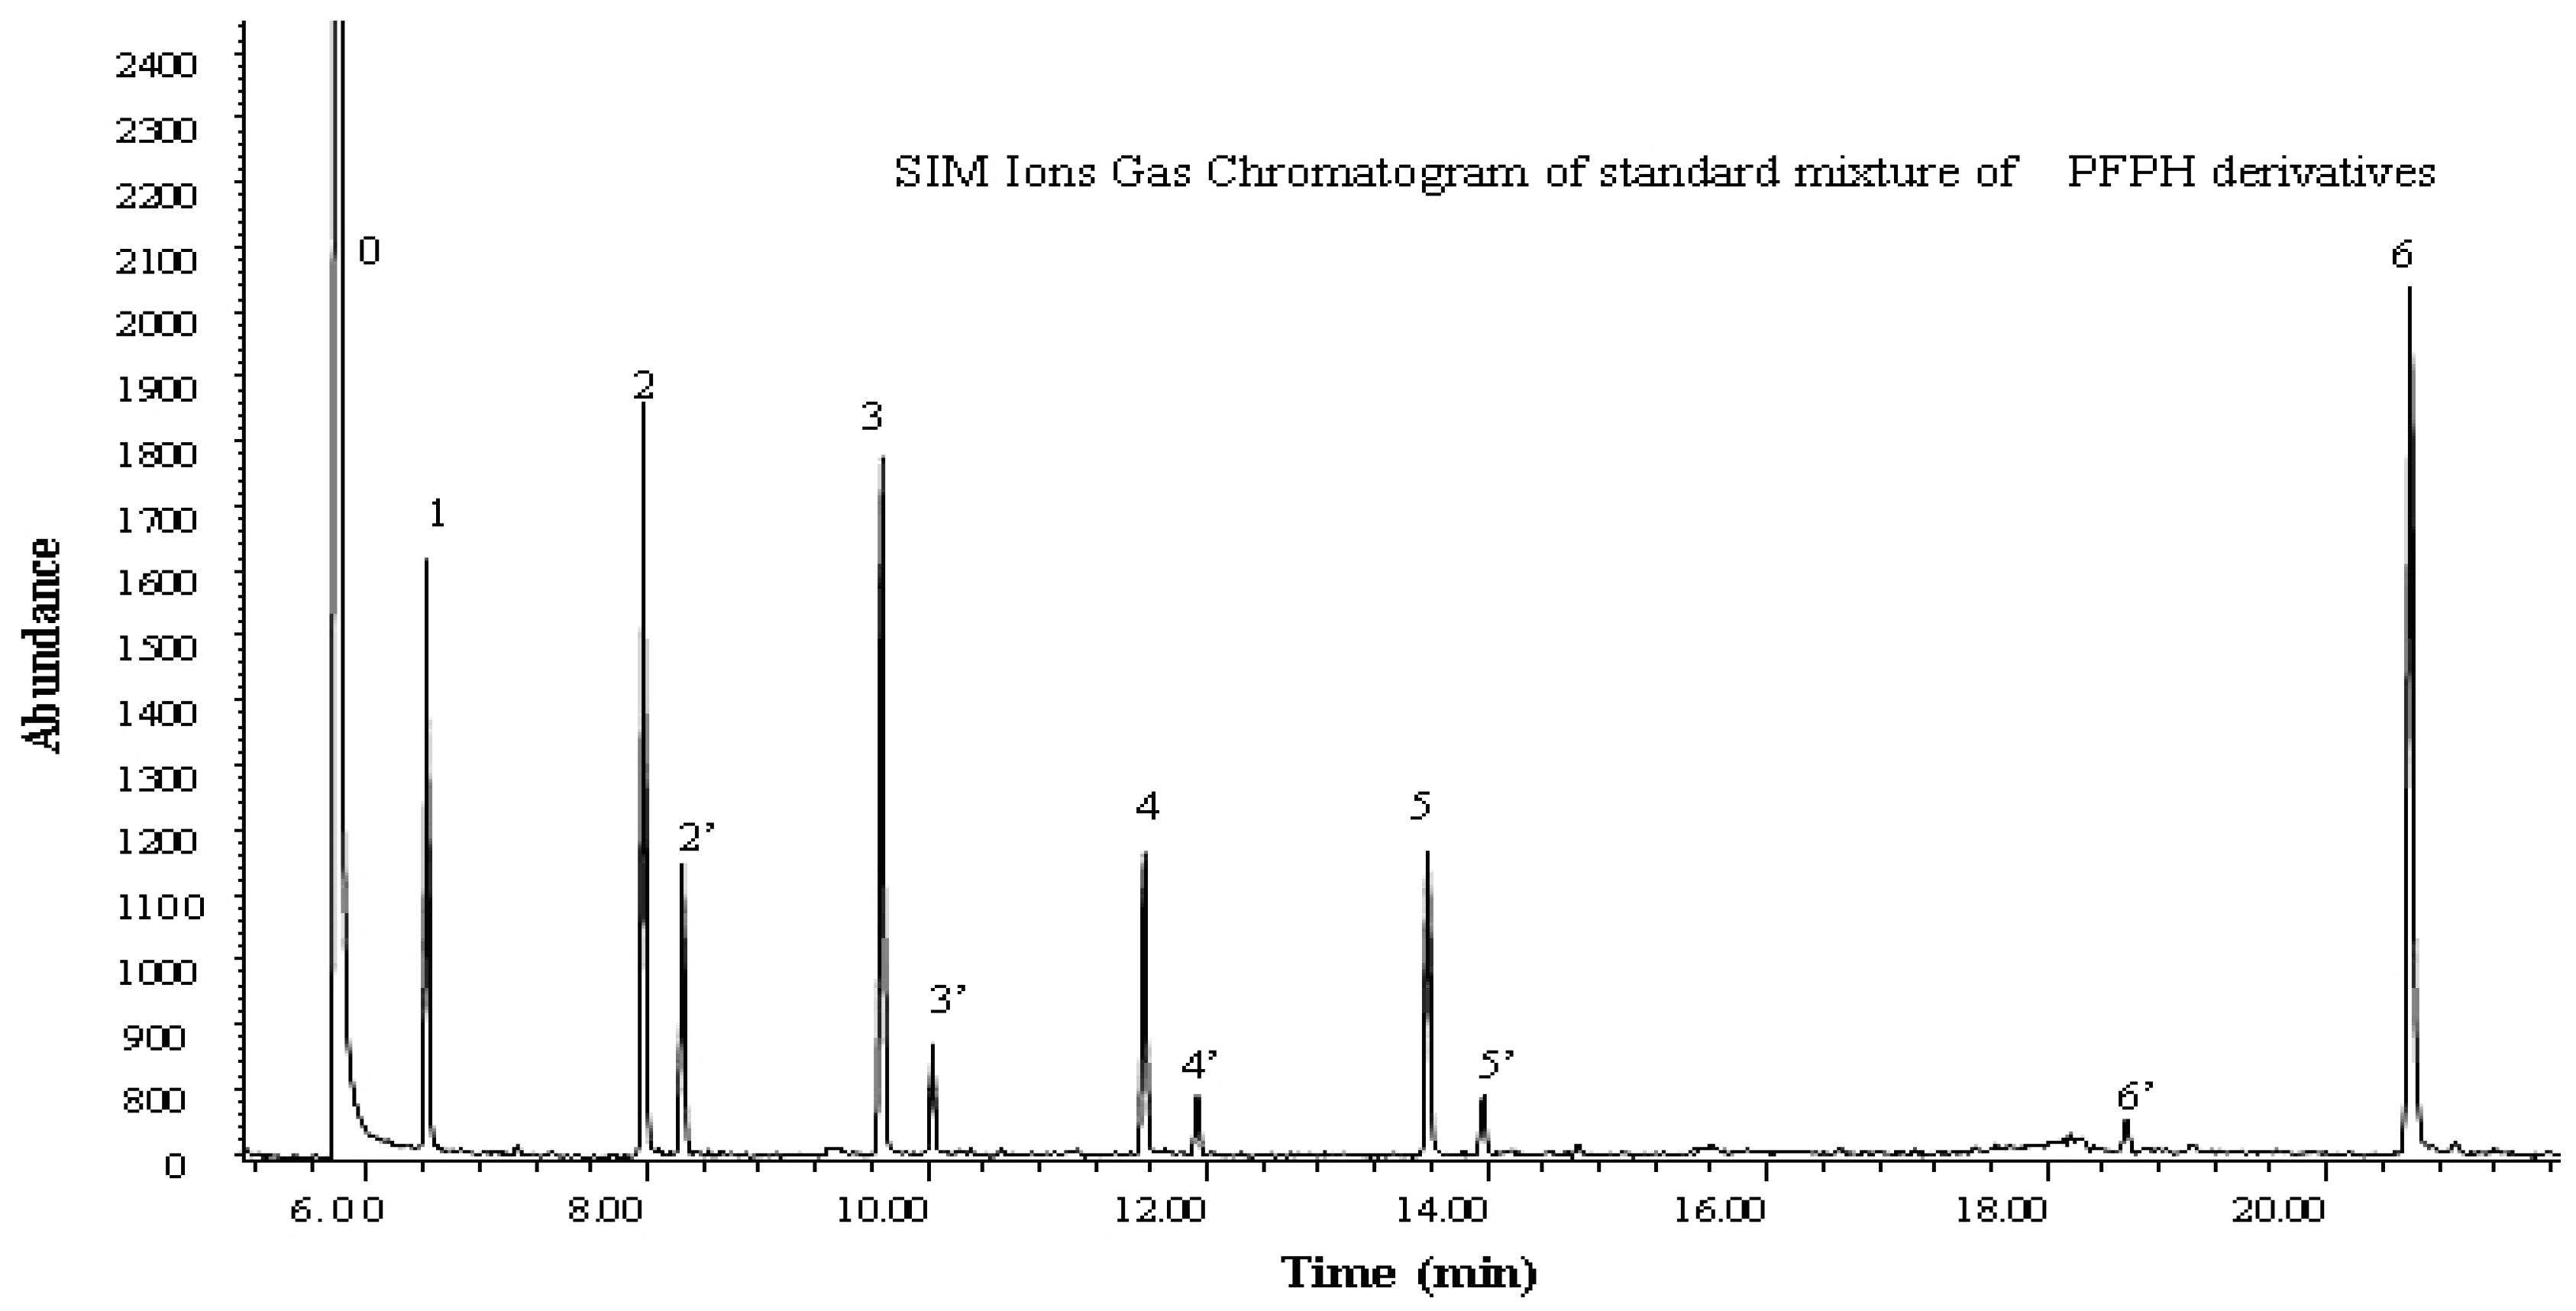
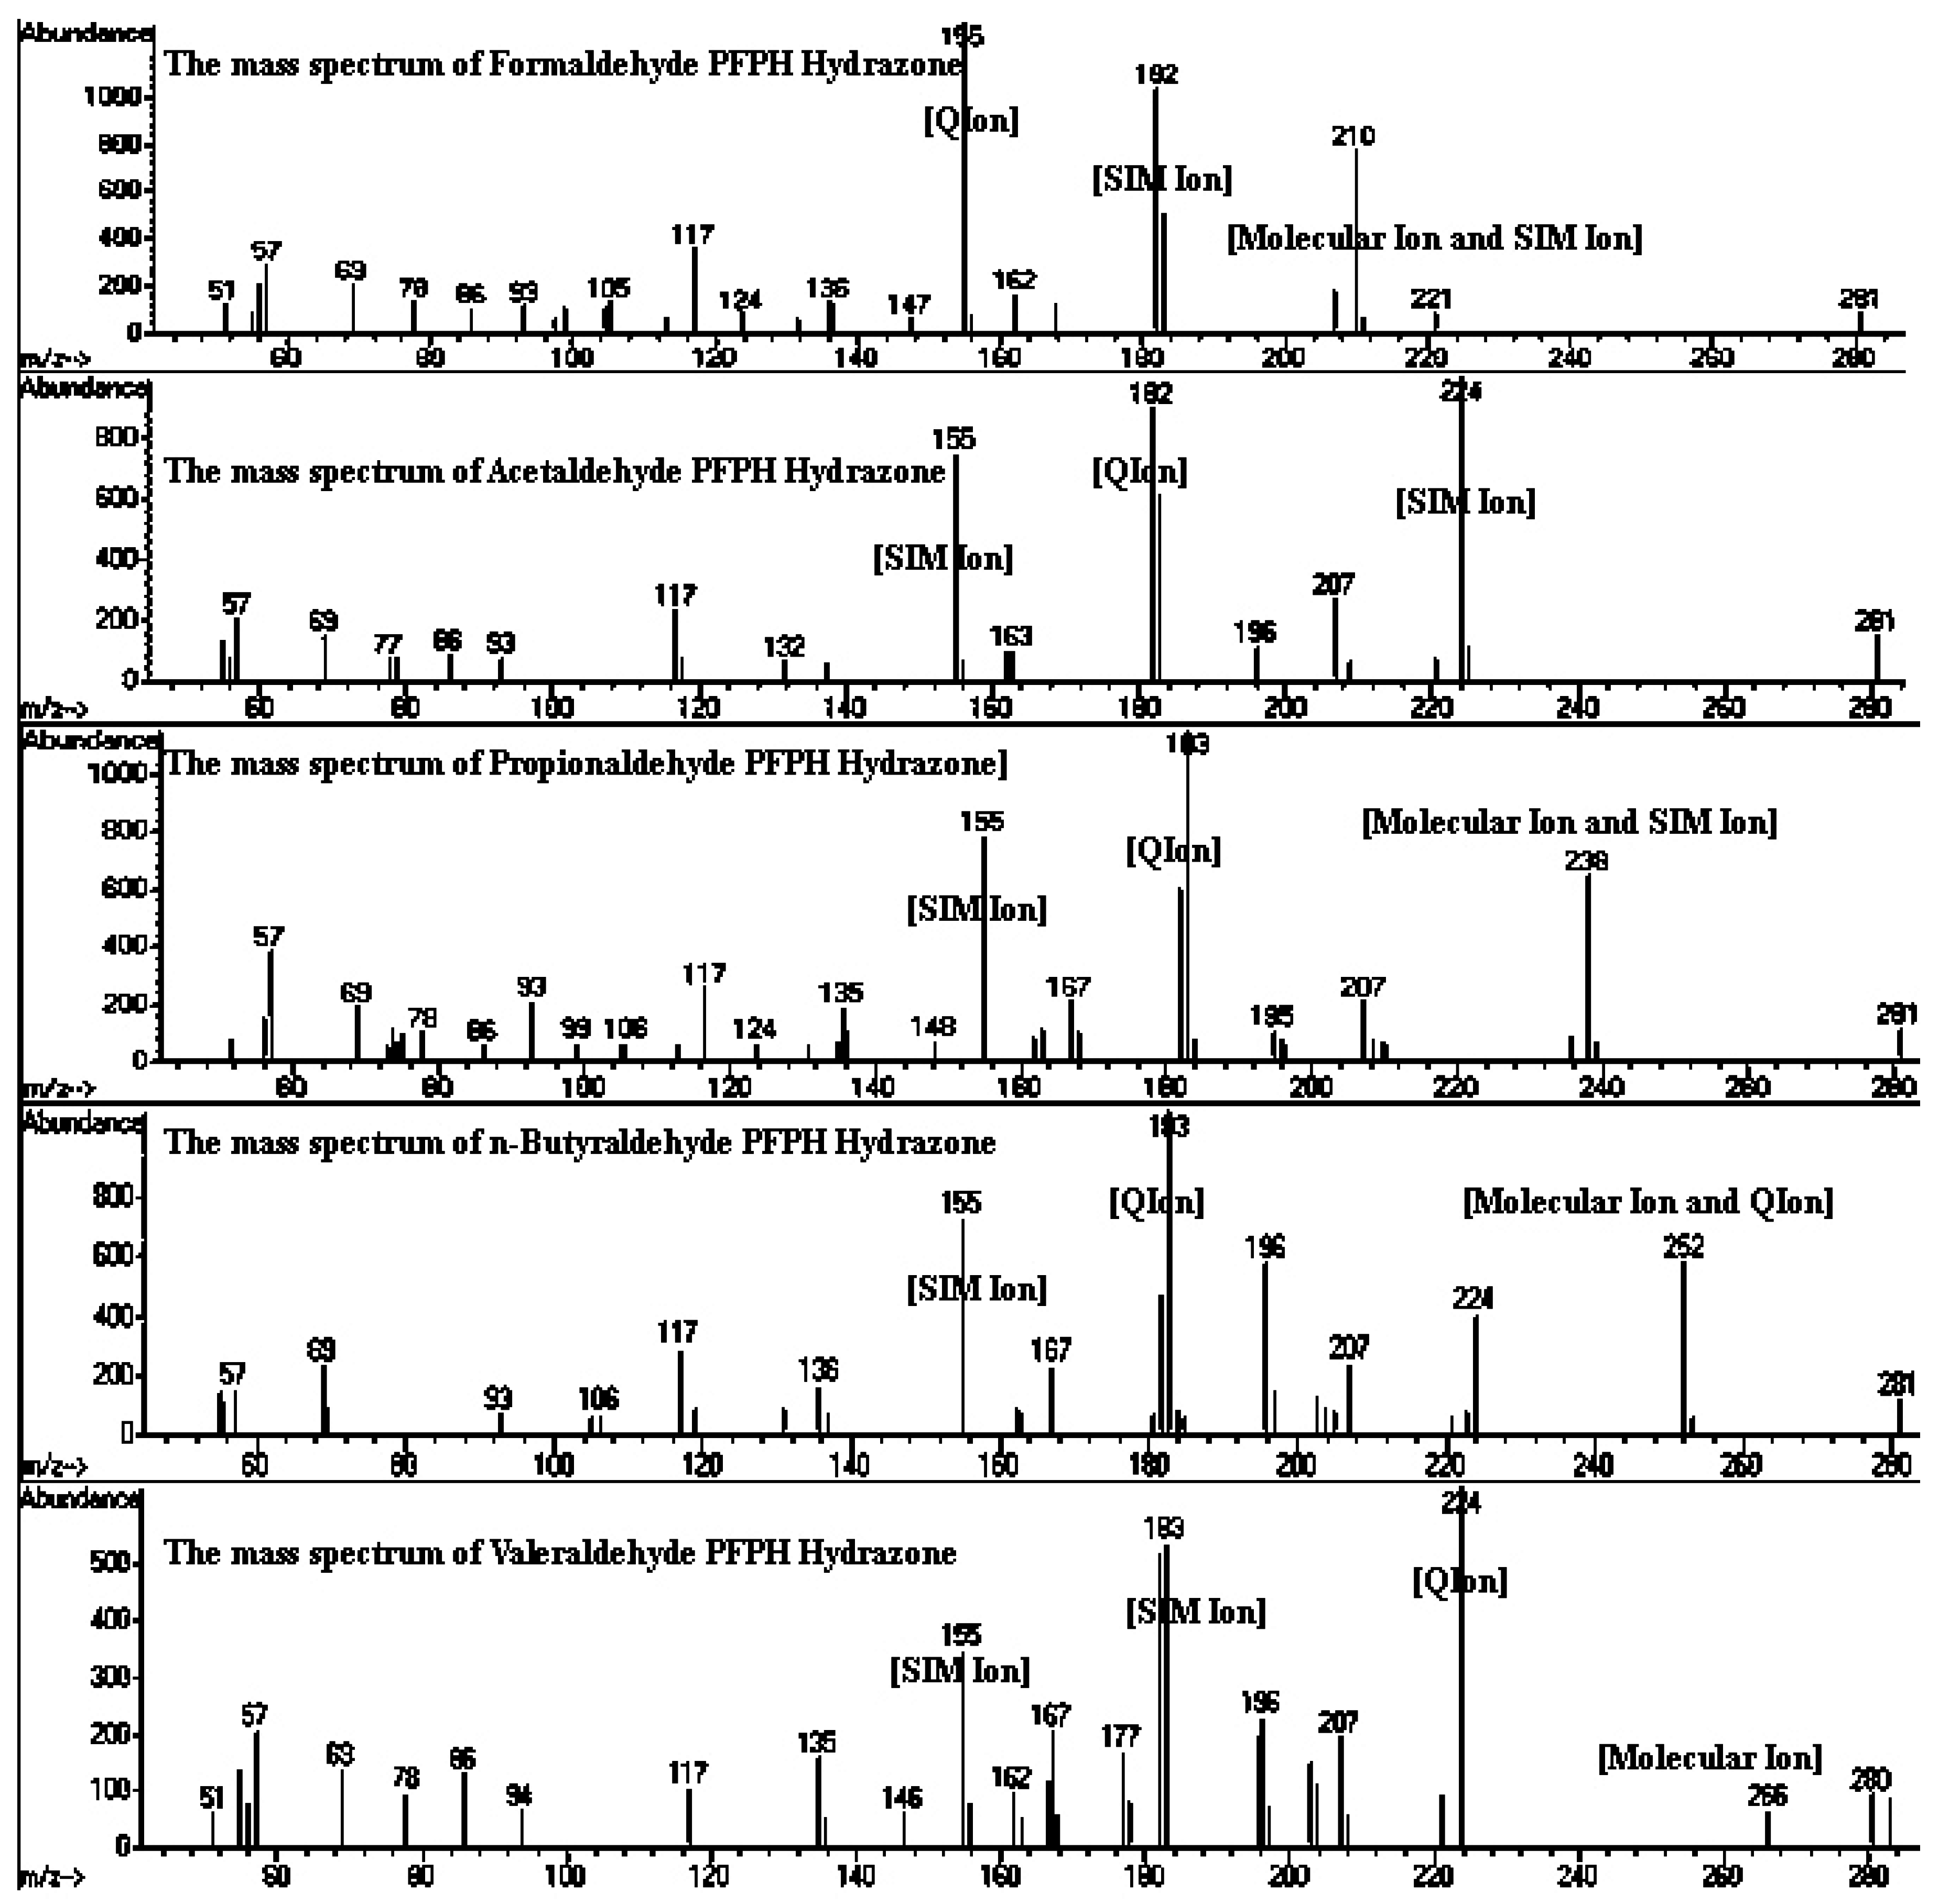
2.3. Sample Collection and Analysis

Carbonyls were collected by drawing air through the sampling tube (6 mm outer diameter, 4 mm inner diameter and 8 cm long) with a personal sampling pump (SKC, Lowell, MA, USA) at a flow rate of ~80 mL/min. The sampling tube was design with two-sections. In each sampling tube, 100 mg coated Tenax TA particles were packed into the front part and 30 mg into the back part with the aid of a microfunnel. With the two-section design, it was easy and convenient to obtain the collection efficiency of the sampling tube [45]. The sampling time was 1 h for each plant sample. The exact flow rate was monitored by a portable digital flow meter (DC-Lite, Bios Corp., Butler, NJ, USA) before and after each sample collection.
Carbonyls were separated by GC (Agilent 7890N, Palo Alto, CA, USA) equipped with an HP-5MSI column (5% phenyl Methyl Siloxane, 30 m × 250 µm × 0.25 µm film thickness). The inlet temperature of the column was set at 275 °C. The column temperature was maintained at 72 °C for 1 min after sample injection, then programmed to 110 °C at a rate of 8 °C/min, and then to 200 °C at 5.5 °C/min, kept at 200 °C for 2 min, and finally heated to 300 °C. The GC chromatogram and the mass spectrum of the PFPH hydrazone derivatives for a standard mixture of the C1–C5 aldehydes are shown in Figure 2 and Figure 3. The MSD (5975MSD, Palo Alto, CA, USA) was regulated in electron ionization (EI) mode at 70 eV and initially operated in scan mode to identify the most abundant ions and the molecular ion for each compound. The mass spectrometer was initially operated in scan mode with a mass range of 50 to 400 to identify the most abundant ions and the molecular ion of each compound. These characteristic ions were then used to identify and quantify the carbonyl compounds present in filed samples in selective ion monitoring (SIM) mode. The peak areas of both E- and Z-isomers of each carbonyl-PFPH derivative were utilized for quantitative analysis [45].

2.4. Determination of Aldehyde Removal Rate by Houseplants

The experiments under a light intensity of approximately 300 lx were conducted, and the inlet concentration of each aldehyde (C1–C5) was approximately 100 ppbv. The gas flow through the chamber was controlled at a rate of 1 L/min. Gas samples were collected from the inlet and outlet buffer vessels, and the sampling flow rate maintained at 80 mL/min with a sampling time lasting for 1 h for each sample. The effects of various C1–C5 aldehyde concentrations on the removal efficiency of Schefflera octophylla (Lour.) Harms and Chamaedorea elegans (Lour.) Harms were also investigated while changing the inlet concentration of each aldehyde from approximately 20 to approximately 160 ppbv under a light intensity level of approximately 300 lx. To avoid possible plant stress resulting from long-term enclosure, plants were repositioned in the chamber with care before and after sample collection.
In order to investigate the short-term effect of changing the levels of light intensity on the removal efficiency of C1–C5 aldehydes, four additional levels of light intensity, 100, 300, 600 lx, and in the dark (0 lx) were used, with the inlet concentration of each aldehyde (C1–C5) remaining at approximately 100 ppbv. The transpiration rate was calculated by the weight decrease of the potted-plant covered with Tedlar bags.
While in the CO2 impact study, each potted plant species placed into the dynamic chamber was subjected to CO2 concentrations of 350, 700, and 1400 ppmv under a light intensity of 300 lx, respectively. Carbonyl removal rate (including the absorption by plant and settlement on the epidermis), E (µmol/m2/h), in each case was evaluated using the inlet and outlet gas concentrations of the plant chamber and was calculated by Equation (1) [46].
(Cin − Cout)Q = E × A + Mb
The corrected removal rate was corrected by a blank experiment performed with an empty chamber and was calculated by Equation (2),
E = (Cin − Cout)Q/A
where Cin, Cout are the inlet and outlet aldehyde gas concentration of the exposure chamber, Q is the flow rate through the plant chamber, E is the removal rate of aldehydes (µmol/m2/h), A is total leaf area (m2), and Mb is aldehyde loss in the exposure chamber (µmol/h).

2.5. Quality Assurance/Quality Control (QA/QC)

The solvents used were Absolv grade and always tested for purities when a new lot number was used. The portable analyzers were sent back to the vendor for calibration once every 6 months. At least one field blank sample was collected for each set of samples. The calibration curves were prepared by using five standard concentrations (from 0.1 to 10 µg/mL) covering the concentration of interest for each work and correlation coefficients (R2) ranging from 0.996 to 0.999 were obtained for the five carbonyl compounds. The solvent extraction efficiencies were in the range of 95.8% ± 1.0% to 99.6% ± 0.8%. Recovery tests were performed (with the same conditions and known amounts of the standard solution of PFPH-carbonyl derivatives, but without plant) and the results showed values ranging from 96% ± 3% to 106% ± 8%. Method precision was assessed by analyzing six replicate ambient samples collected simultaneously under the same sampling conditions and the relative standard deviations (RSDs) of the targeted five carbonyl compounds were all below 14%. The limits of detection (LODs) were determined by analyzing seven blank PFPH sampling tubes and were in the range of 4.8–9.5 ng/tube for the various carbonyls. Two blank sampling tubes were connected in tandem to test the collection efficiency before the formal experiment, and the results showed more than 96% of the detected carbonyls were collected in the front section of the first sampling tube.
Plant emission experiments were conducted before removal experiments performed under different light intensities. Clean air (the target aldehyde concentration <10 ppbv) was introduced to the chamber enclosing potted-plants. Figure 4 shows that no emissions of the objective aldehydes from both selected houseplants were observed even at the highest light intensity.

3. Results and Discussion

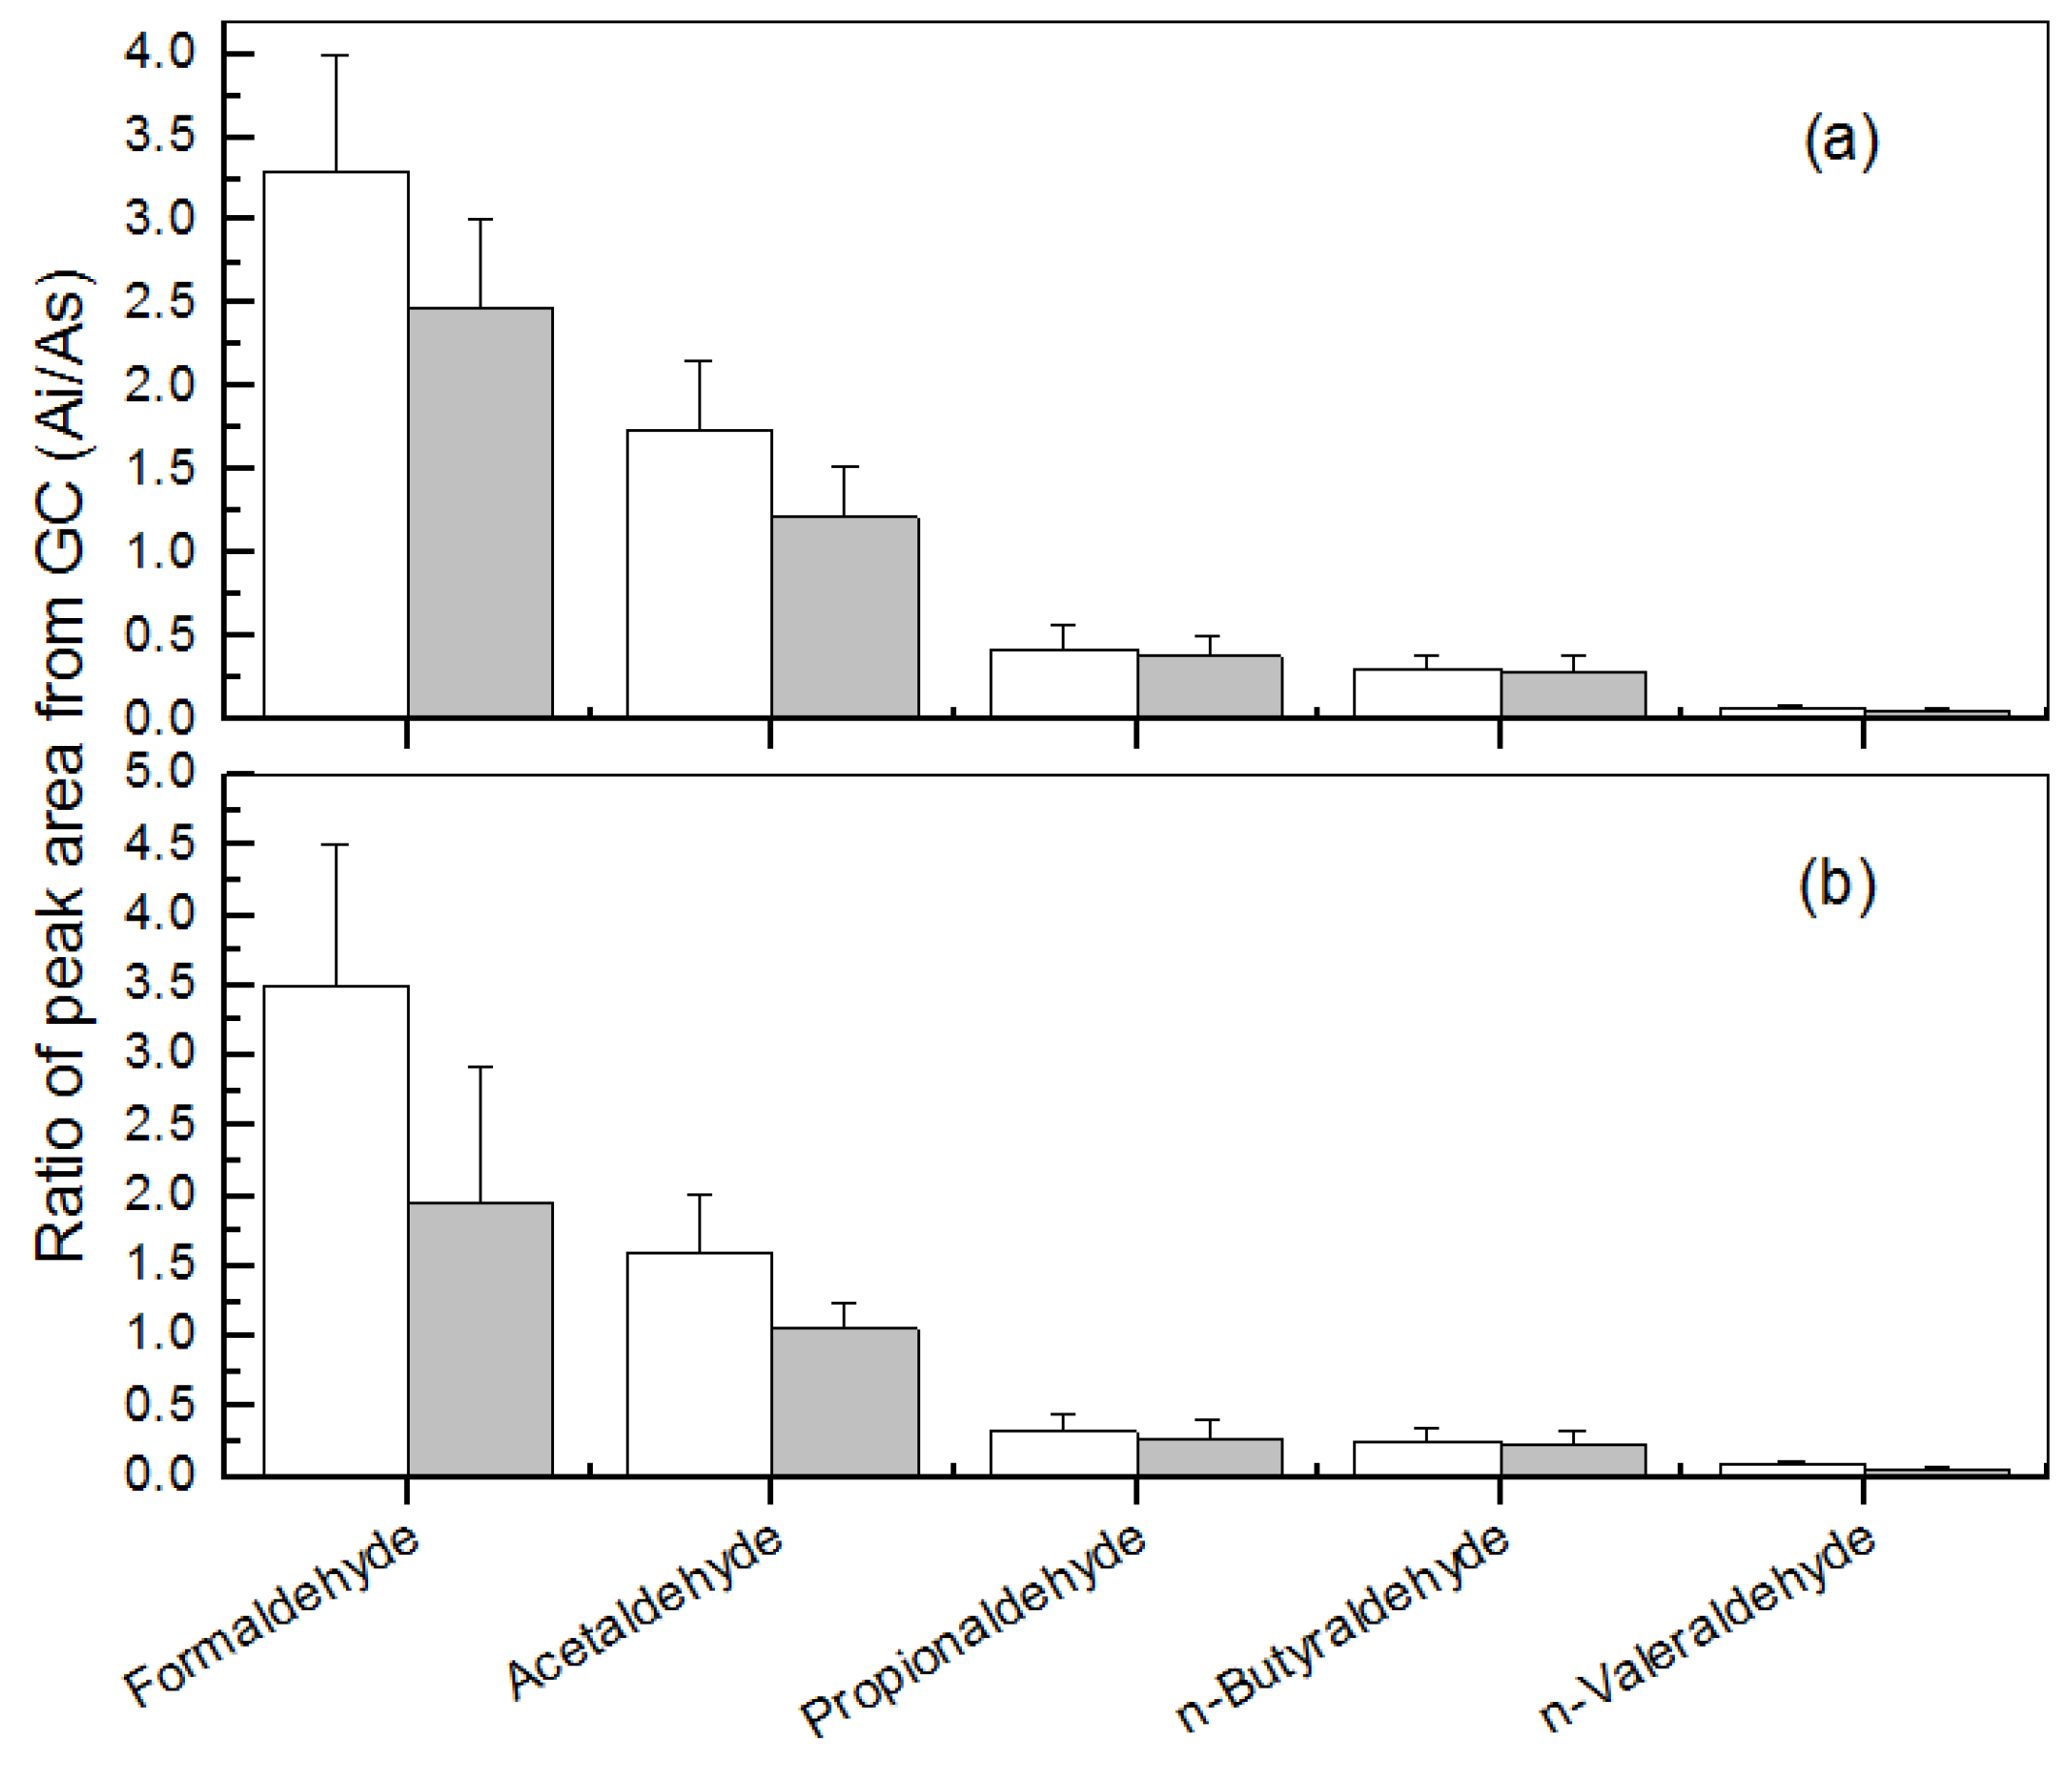
3.1. Removal of Low-Molecular Mass Aldehydes by the Plants under a Normal Indoor Environment

Table 1 shows the removal rate of low-molecular mass aldehydes (C1–C5) by the two houseplant species (Schefflera octophylla (Lour.) Harms and Chamaedorea elegans (Lour.) Harms) under a normal indoor environment (light intensity of about 300 lx and CO2 concentration of about 350 ppmv). The removal rates by Schefflera octophylla (Lour.) Harms and Chamaedorea elegans (Lour.) Harms ranged from 0.311 μmol/m2/h for valeraldehyde to 0.677 μmol/m2/h for formaldehyde, and 0.526 μmol/m2/h for propionaldehyde to 1.440 μmol/m2/h for formaldehyde, respectively. The two plants tested exhibited a higher ability on formaldehyde removal than other aldehydes, and their removal rates of the lower aldehydes (formaldehyde and acetaldehyde) were higher than other aldehydes (C3–C5) for all plants in the experiments. Chamaedorea elegans exhibited higher aldehyde removal rates from C1 to C5 than Schefflera octophylla.
Figure 5 showed the relationship between the removal rate of C1–C5 aldehydes and the inlet C1–C5 aldehyde concentration under a normal light intensity of approximately 300 lx. The removal rates exhibited a positive linear relation with the increased pollutant concentrations from approximately 20 to approximately 160 ppbv. Removing gaseous pollutants by the plant may mainly include absorption through the stomata, adsorption on the cuticle and epidermis of the leaf, with the stomata and the cuticle being the two most common uptake pathways. It is known that formaldehyde and acetaldehyde can be taken up by plants and then participate in the metabolism of the plants [47]. Formaldehyde, for example, can be taken up through the stomata and cuticles of the plant leaf, and then be converted into organic acids, amino acids, free sugars or CO2 [48]. Light can affect the removal efficiency of the plant as a result of induced stomatal movements [32,46]. However, how carbonyls can be metabolized inside the leaf and affected by light intensity is still unknown.

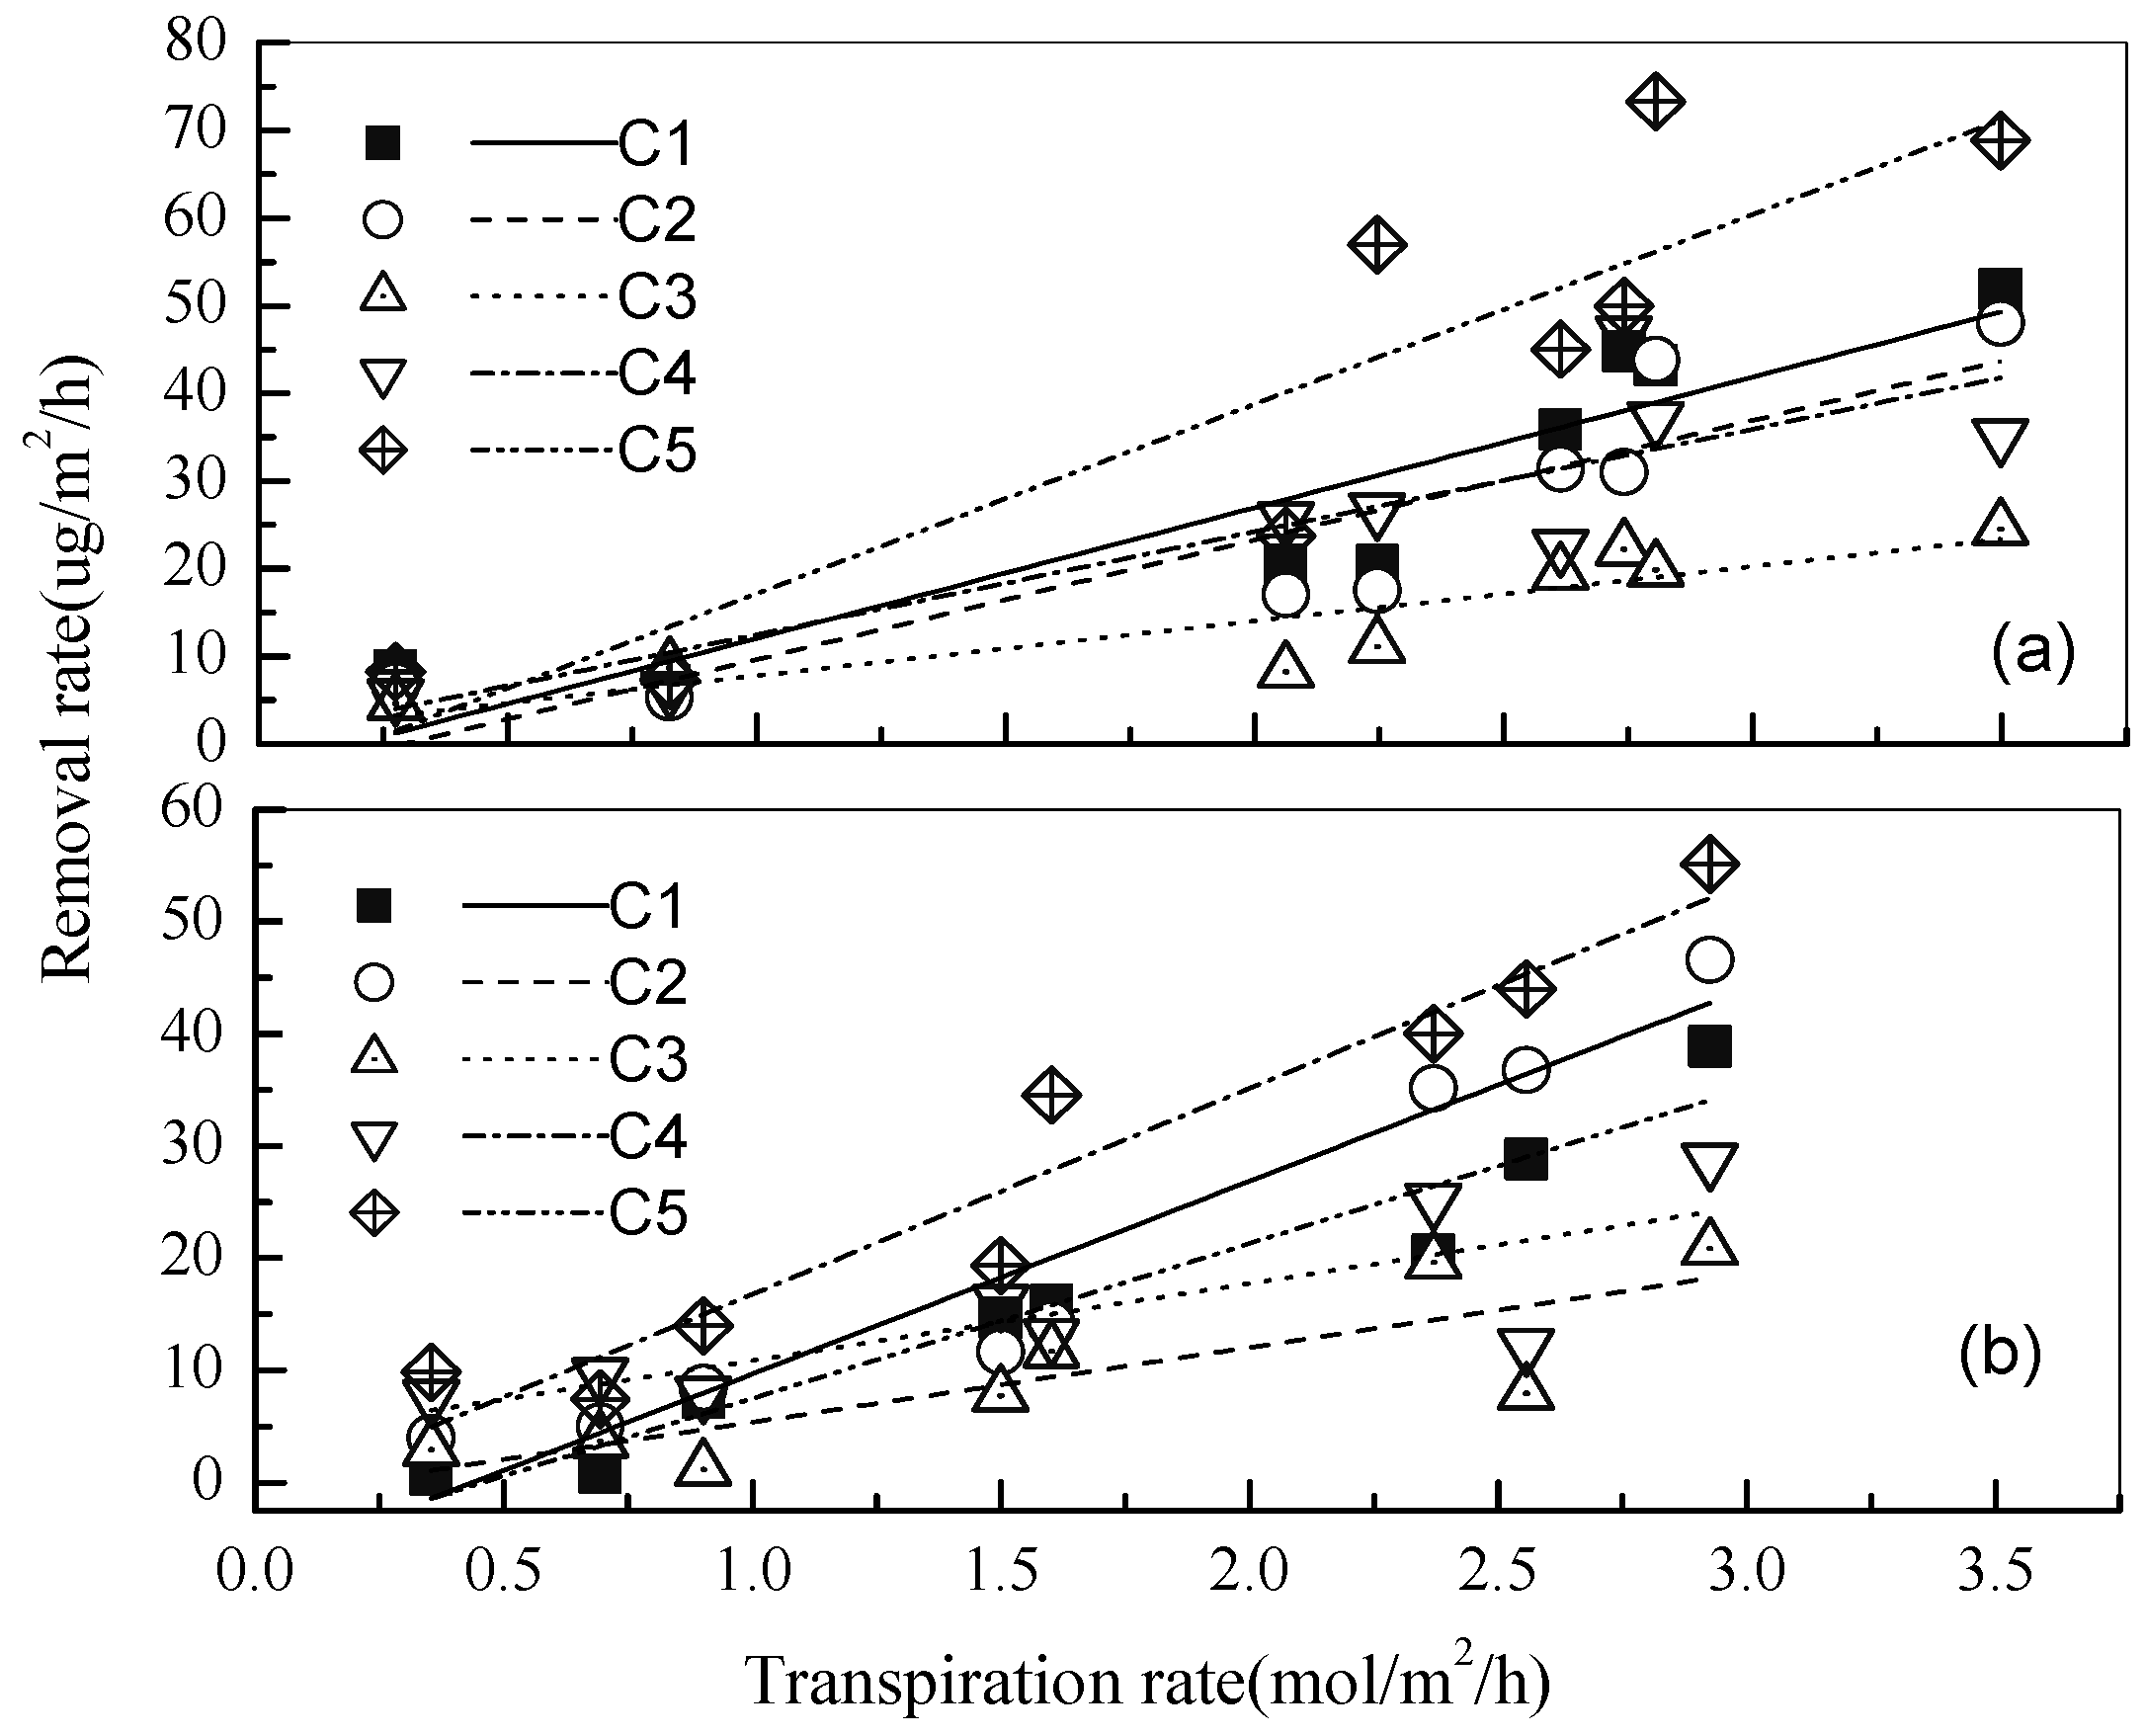
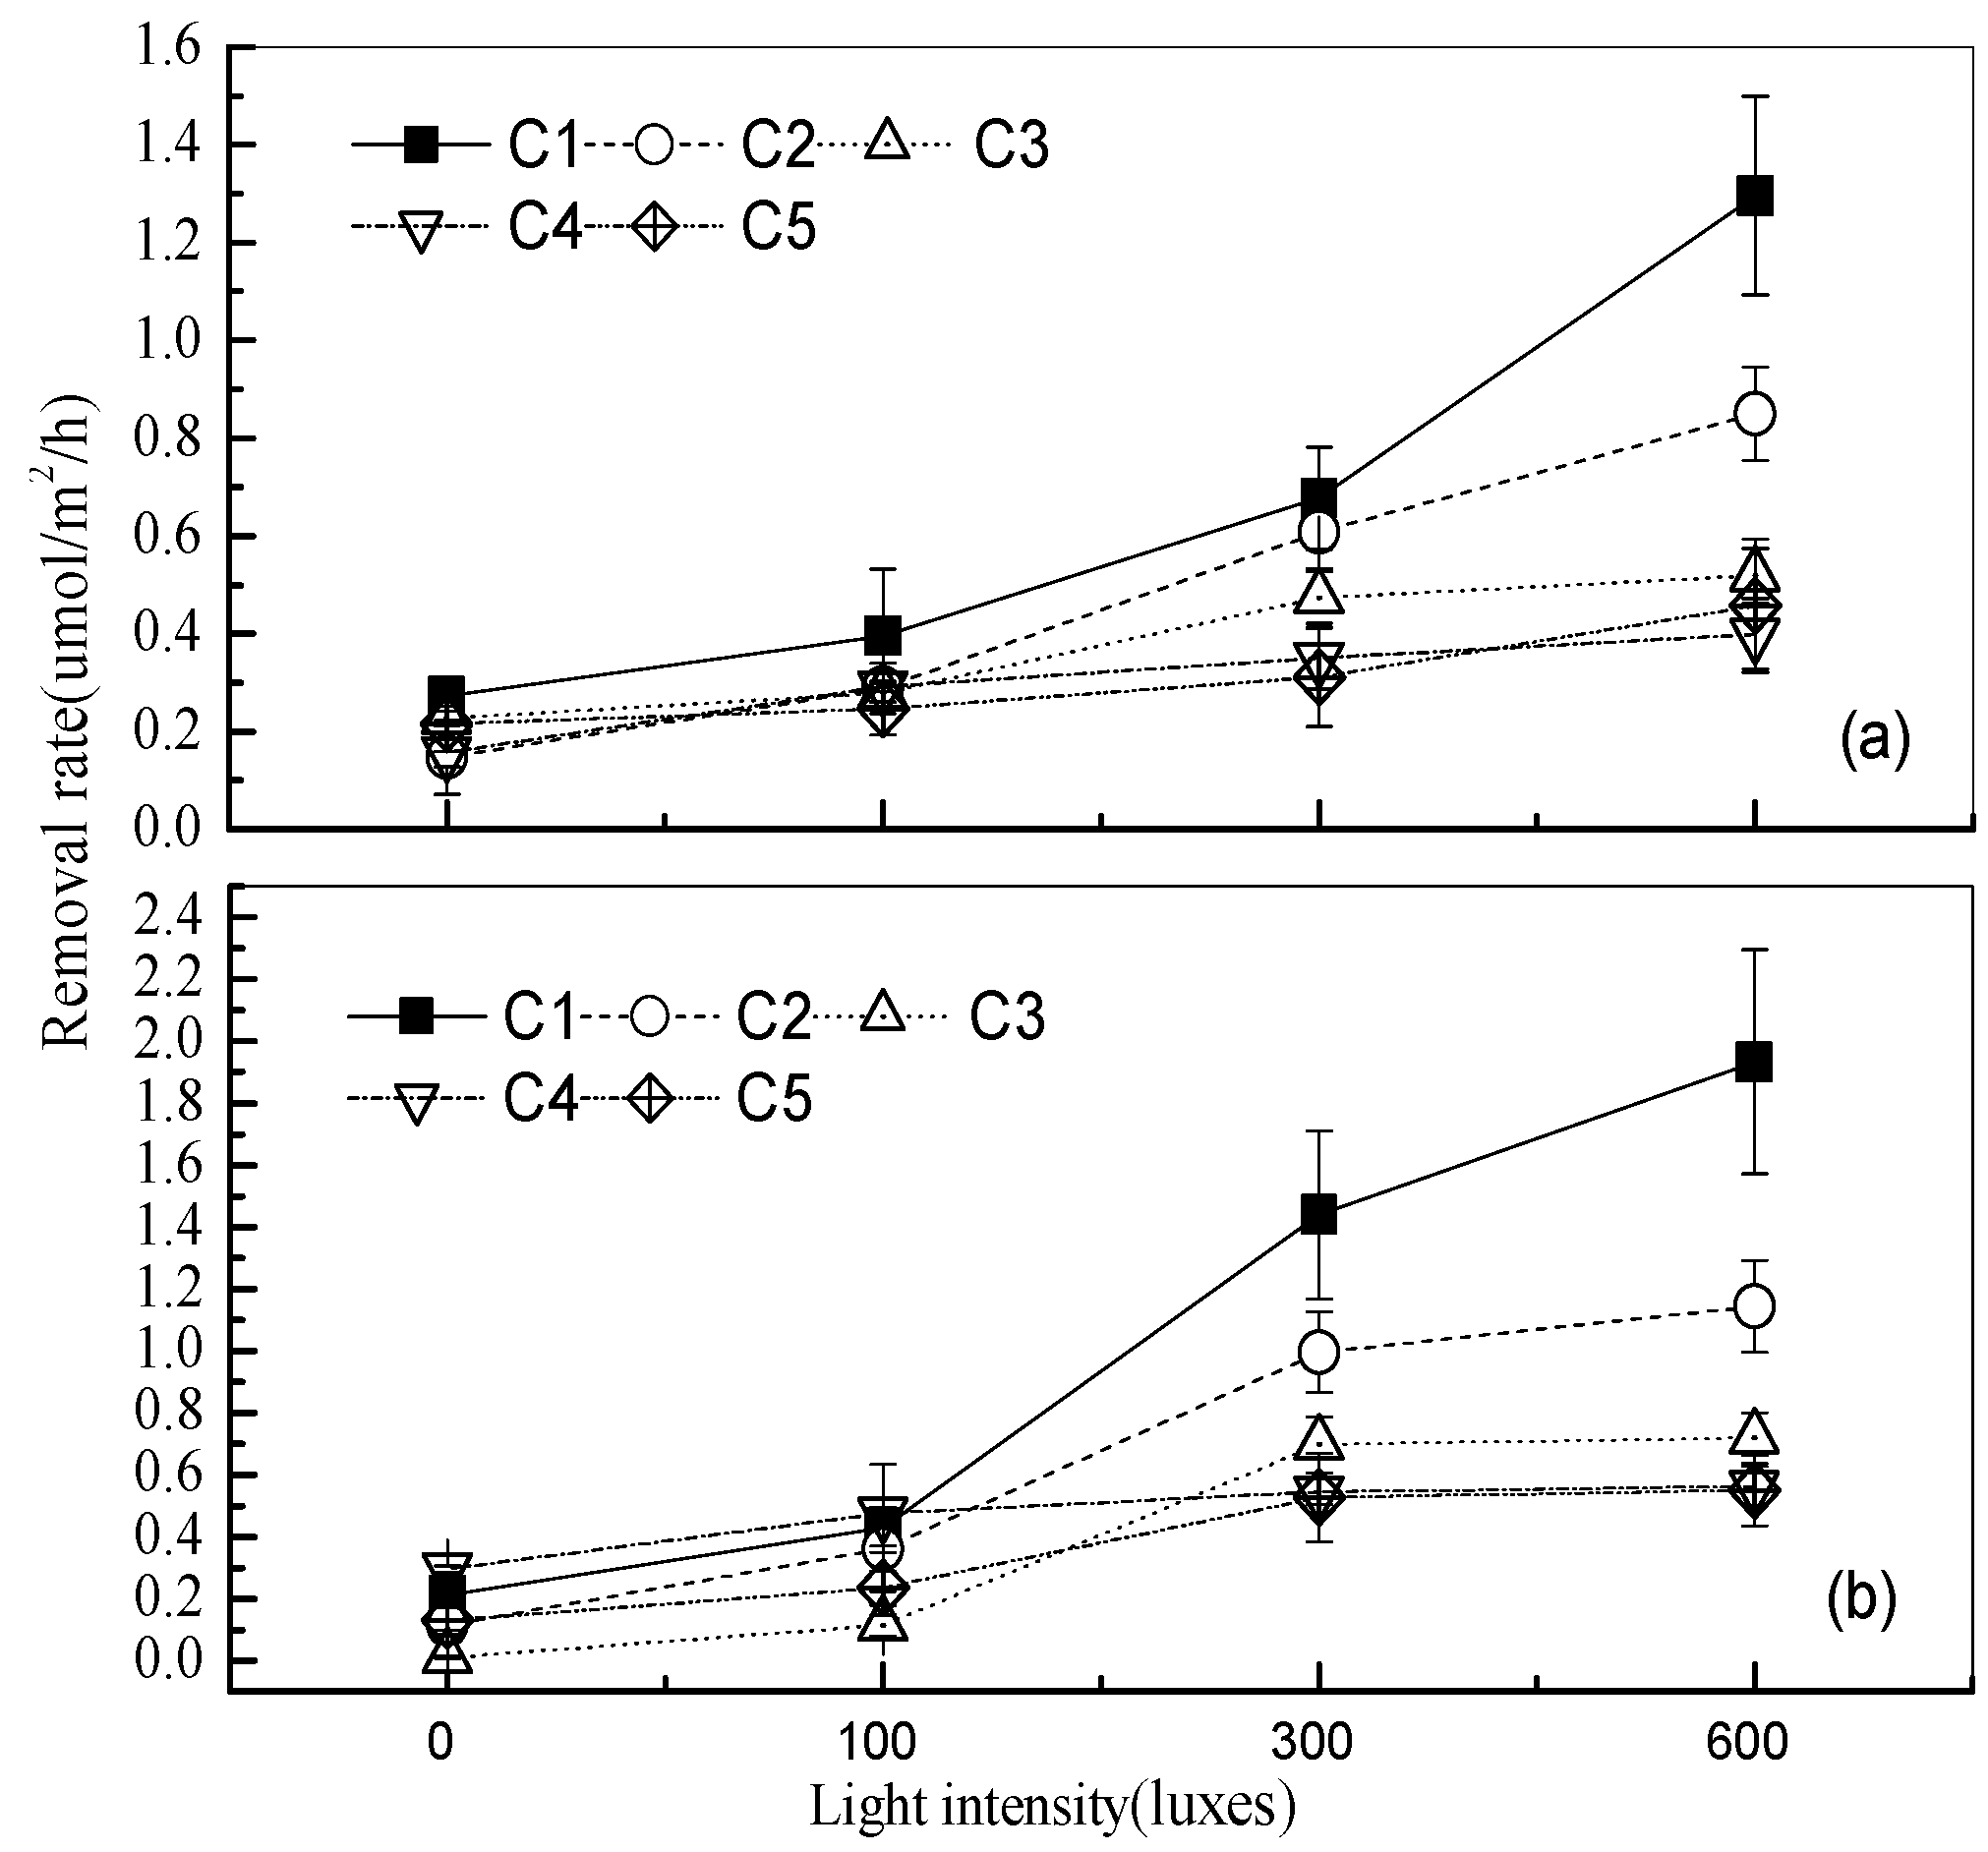
3.2. Effects of Different Light Intensities

Samplings under different light intensities (0, 100, 300, and 600 lx) were performed both in the day and the night time (07:30 to 22:00) at the normal CO2 concentration of the indoor environment (about 350 ppmv). Figure 6 presents the removal rates of C1–C5 aldehydes under different light intensities. It clearly indicates that all the aldehyde removal ratios increased with the increase of light intensity. Removal rates for formaldehyde and acetaldehyde were much higher than for other aldehydes (C3–C5) when the light intensity increased from 0 to 600 lx. The formaldehyde removal efficiency was highest among these aldehydes, and its removal rates ranged from 0.211 to 1.933 μmol/m2/h for Chamaedorea elegans (Lour.) Harms and from 0.073 to 1.296 μmol/m2/h for Schefflera octophylla (Lour.) Harms, respectively. While n-butyraldehyde and valeraldehyde exhibited lower removal ratios (with a maximum value of 0.564 and 0.549 μmol/m2/h under a light intensity of 600 lx) compared with the other three aldehydes (C1–C3).
Figure 7 showed the relationship between the removal rates of aldehydes (≤C5) and the transpiration rate of the two houseplants. The removal rates exhibited strong positive correlations to the transpiration rates (R2 = 0.720–0.837 for Schefflera octophylla (Lour.) Harms; R2 = 0.607–0.932 for Chamaedorea elegans (Lour.) Harms). The result confirms that the removal rates were in positive correlation with the light intensity and were consistent with previous studies [46], which reported that plants have a significantly higher removal rate of aldehyde in the light than in the dark. Various other studies have indicated that variations of light intensity could change the open sizes of leaf stomatal conductance and then impact on the absorption effect of the air pollutant molecules [48].
Apart from the stomatal conductance, the solubility of a substance was also considered to be an important factor affecting VOCs absorption. Formaldehyde and acetaldehyde were more soluble than the other three aldehydes. Higher removal rates of C1–C2 than C3–C5 aldehydes found in our experiments supported this statement. It also seemed that low molecular weight aldehydes were easier to remove than other higher weight aldehydes.

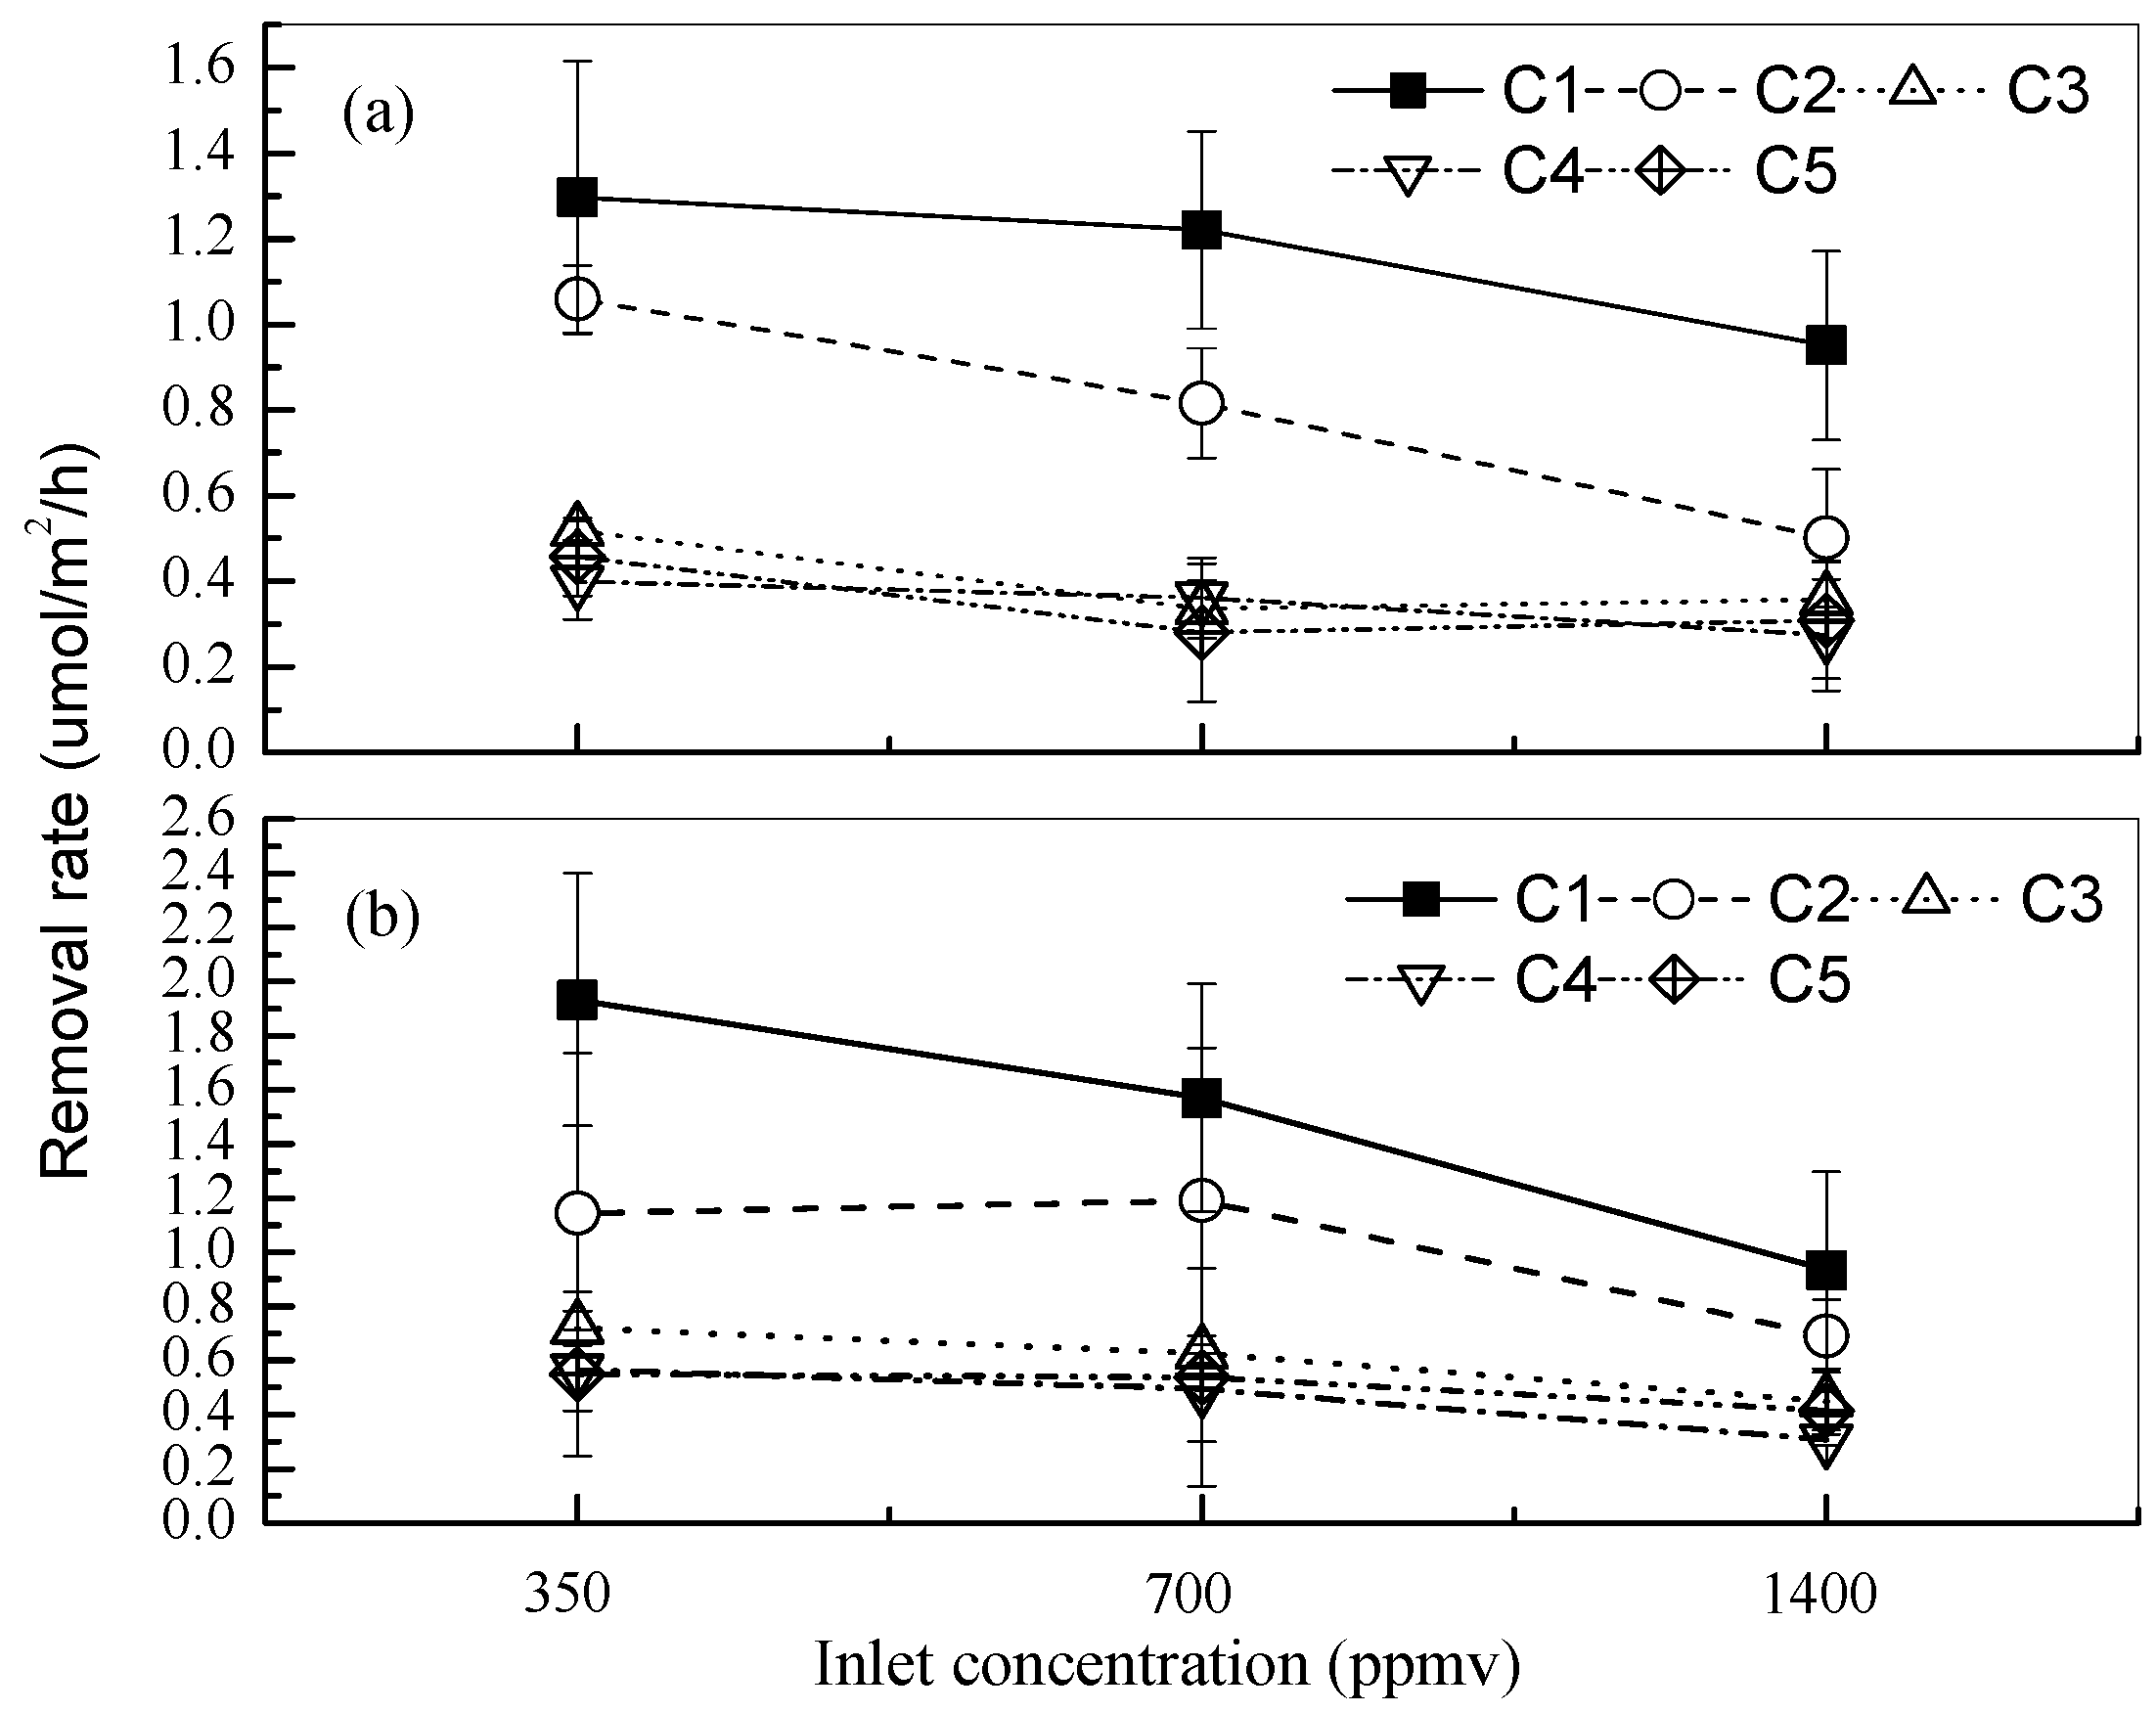
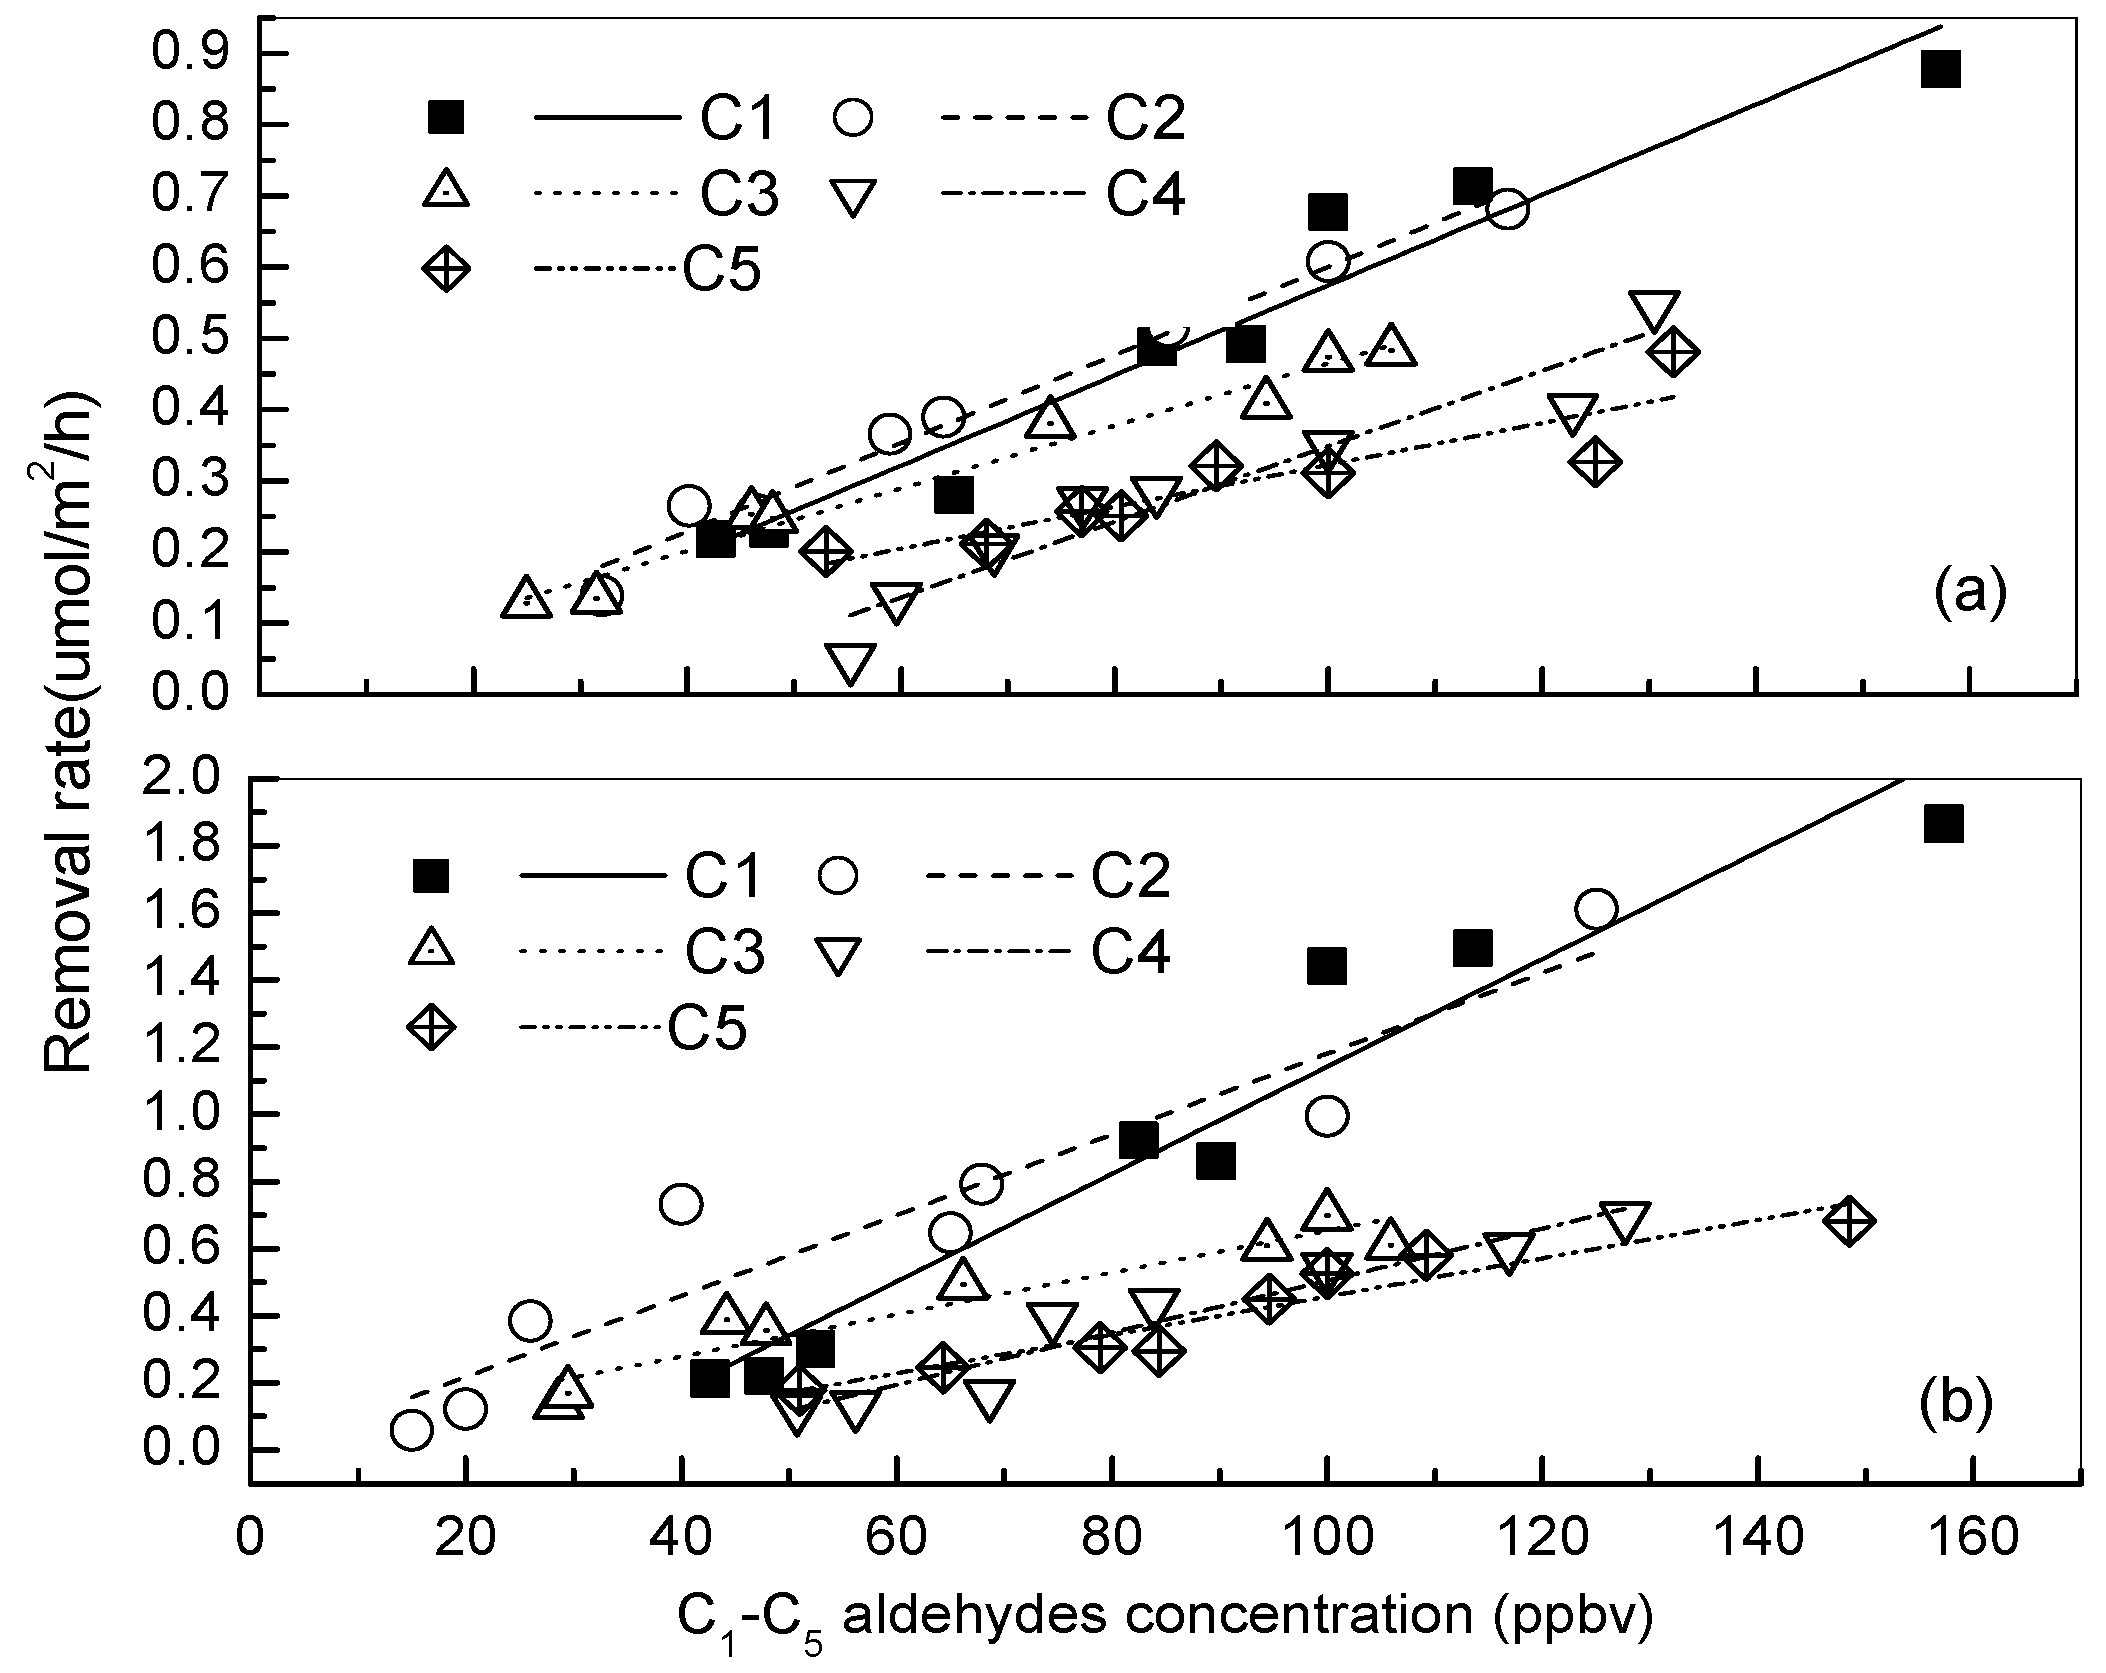
3.3. Effects of Different CO2 Concentrations

Figure 8 shows the variation of aldehyde (C1–C5) removal rates under three levels of CO2 concentration from 350 μmol/mol to 1400 μmol/mol. Contrary to light intensities, excessive CO2 concentration might have an inhibiting effect on carbonyl removal by Schefflera octophylla (Lour.) Harms and Chamaedorea elegans. When the CO2 concentration was elevated from 350 ppmv to 1400 ppmv, the removal efficiency of Schefflera octophylla (Lour.) Harms for formaldehyde, acetaldehyde, propionaldehyde, n-butyraldehyde, and valeraldehyde decreased about 26.7%, 52.7%, 31.1%, 31.3%, and 32.5%, respectively. For Chamaedorea elegans, the respective removal amount decreased 51.7% for formaldehyde, 39.6% for acetaldehyde, 37.6% for propionaldehyde, 45.7% for n-butyraldehyde, and 24.3% for valeraldehyde. Removal rates of the total aldehydes decreased about 32.0% and 43.1% when the inlet CO2 concentrations increased from 350 ppmv to 1400 ppmv for Schefflera octophylla (Lour.) Harms and Chamaedorea elegan (Lour.) Harms, respectively. This phenomenon indicates that elevated CO2 concentration might negatively affect plant absorption on low molecular mass aldehydes.
The CO2 experiment results could be explained by the fact that plants exposed to high CO2 may make adaptive acclimatization response in terms of photosynthesis, stomatal conductance, water use efficiency, and production allocation etc. [37,38]. Stomatal movements are primarily in response to the changes from environmental parameters such as light and CO2 concentration [50]. It has been reported that high CO2 concentrations can induce stomatal closure, as a response of the plants facing environmental changes, and consequently may have an impact on the ability to absorb air pollutants [51,52]. However, the conclusion from this study was based on observation of short-term experiments, because plants eliminating indoor contaminants may be a long term process as well as the persistence of indoor air pollution, long-term observation needs to be carried out to enhance assessment work in the future.

4. Conclusions

Two houseplant species (Schefflera octophylla (Lour.) Harms and Chamaedorea elegans) were selected to test the removal rates of low-molecular mass aldehydes at different light intensities and CO2 concentrations in this study. Under normal environmental conditions with a light intensity of 300 lx and CO2 concentration of 350 ppmv, the removal ratios of Schefflera octophylla (Lour.) Harms and Chamaedorea elegans (Lour.) Harms ranged from 0.311 μmol/m2/h for valeraldehyde to 0.677 μmol/m2/s for formaldehyde, and 0.526 μmol/m2/h for propionaldehyde to 1.440 μmol/m2/h for formaldehyde, respectively. The removal efficiency for formaldehyde and acetaldehyde by these species was higher than for propionaldehyde, n-butyraldehyde, and valeraldehyde. It was found that the removal efficiency showed a positive correlation with the light intensity ranging from 0 to 600 lx. However, the plant removal ratios decreased as the CO2 concentration increased. When the inlet CO2 concentrations ranged from 350 ppmv to 1400 ppmv, the total aldehyde removal rate of S. octophylla and C. elegans decreased by 32.0% and 43.1%, respectively. The results showed that excess CO2 may lead to a decrease in stomatal conductance, leading to limited pollutant uptake of stomata. Also, this study found that stomatal uptake was the main removal pathway for C1–C5 aldehydes by S. octophylla and C. elegans and the characteristic of removal rate can be easy affected by environmental factors such as light intensity and CO2 concentration.

Acknowledgments

This work was financially supported by the National Natural Science Foundation of China (Grants 21467018, 41003057, 41203076), the Natural Science Foundation of Jiangxi Province of China 20142BBG70005, 20151BAB203027), Foundation of Jiangxi Educational Committee (GJJ14511, GJJ14406) and Fund of Key Laboratory of Jiangxi Province for Persistent Pollutants Control and Resources Recycle (ST2013220).

Author Contributions

Jian Li and Chun-Juan Xie conceived and designed the experiments; Jing Cai performed the experiments and analyzed the data; Liu-Shui Yan contributed analysis tools; Jian Li wrote the paper and Ming-Ming Lu revised the paper.

Conflicts of Interest

The authors declare no conflict of interest.

References

  1. Klepeis, N.E.; Nelson, W.C.; Ott, W.R.; Robinson, J.P.; Tsang, A.M.; Switzer, P.; Behar, J.V.; Hern, S.C.; Engelmann, W.H. The National Human Activity Pattern Survey (NHAPS): Aresource for assessing exposure to environmental pollutants. J. Exp. Anal. Environ. Epidemiol. 2001, 11, 231–252. [Google Scholar] [CrossRef] [PubMed]
  2. US Environment Protection Agency. Child-Specific Exposure Factors Handbook; National Center for Environmental Assessment: Washington, DC, USA, 2002.
  3. Mølhave, L.; Krzyzanowski, M. The right to healthy indoor air: Status by 2002. Indoor Air 2003, 13, 50–53. [Google Scholar] [CrossRef] [PubMed]
  4. Yang, D.S.; Pennisi, S.V.; Son, K.C.; Kays, S.J. Screening Indoor Plant for Volatile Organic Pollutant Removal Efficiency. HortScience 2009, 44, 1377–1381. [Google Scholar]
  5. Wu, X.M.; Apte, M.G.; Maddalena, R.; Bennett, D.H. Volatile organic compounds in small-and medium-sized commercial buildings in California. Environ. Sci. Technol. 2011, 45, 9075–9083. [Google Scholar] [CrossRef] [PubMed]
  6. Bakeas, E.B.; Argyris, D.I.; Siskos, P.A. Carbonyl compounds in the urban environment of Athens, Greece. Chemosphere 2003, 52, 805–813. [Google Scholar] [CrossRef]
  7. Duan, J.; Guo, S.; Tan, J.; Wang, S.; Chai, F. Characteristics of atmospheric carbonyls during haze days in Beijing, China. Atmos. Res. 2012, 114, 17–27. [Google Scholar] [CrossRef]
  8. Ho, S.H. Analysis of Airborne Organic Compounds Using Thermal Desorption-Gas Chromatography-Mass Spectrometry Methods. Ph.D. Thesis, Hong Kong University of Science and Technology, Hong Kong, China, 2004. [Google Scholar]
  9. Wang, B.; Lee, S.C.; Ho, K.F. Characteristics of carbonyls: Concentrations and source strengths for indoor and outdoor residential microenvironments in China. Atmos. Environ. 2007, 41, 2851–2861. [Google Scholar] [CrossRef]
  10. De Bortoli, M.; Knoeppel, H.; Pecchio, E.; Peil, A.; Rogora, L.; Schauenburg, H.; Schlitt, H.; Vissers, H. Concentrations of selected organic pollutants in indoor and outdoor air in northern Italy. Environ. Int. 1986, 12, 343–350. [Google Scholar] [CrossRef]
  11. Báez, A.P.; Padilla, H.; Garcia, R.; Torres, M.D.C.; Rosas, I.; Belmont, R. Carbonyl levels in indoor and outdoor air in Mexico City and Xalapa, Mexico. Sci. Total Environ. 2003, 302, 211–226. [Google Scholar] [CrossRef]
  12. Hida, J.; Tanaka, Y.; Yamada, M.; Taki, K.; Yoshia, H. Field measurement of carbonyl compound concentration in indoor air of wooden residential houses newly constructed from 2001 to 2002. J. Jpn. Wood Res. Soc. 2006, 52, 215–220. [Google Scholar] [CrossRef]
  13. Báez, A.P.; Padilla, H.; Garcia, R.; Belmont, R.; Torres, M.D. Measurement of indoor-outdoor carbonyls at four residential homes in Mexico city metropolitan area. Int. J. Environ. Pollut. 2006, 26, 90–105. [Google Scholar] [CrossRef]
  14. Liu, Q.Y.; Liu, Y.J.; Zhang, M.G. Personal exposure and source characteristics of carbonyl compounds and BTEXs within homes in Beijing, China. Build. Environ. 2013, 61, 210–216. [Google Scholar] [CrossRef]
  15. Weng, M.L.; Zhu, L.Z.; Yang, K.; Chen, S. Levels, sources, and health risks of carbonyls in residential indoor air in Hangzhou, China. Environ. Monit. Assess. 2010, 163, 573–581. [Google Scholar] [CrossRef] [PubMed]
  16. Pegas, P.N.; Alves, C.A.; Nunes, T.; Bate-Epey, E.F.; Evtyugina, M.; Pio, C.A. Could houseplants improve indoor air quality in schools? J. Toxicol. Environ. Health A 2012, 75, 1371–1380. [Google Scholar] [CrossRef] [PubMed]
  17. Wood, R.A.; Orwell, R.L.; Tarran, J.; Torpy, F.; Burchett, M. Potted-plant/growth media interactions and capacities for removal of volatiles from indoor air. In Proceedings of the Health Buildings 2003—HB2003, Singapore, 7–11 December 2003; pp. 441–445.
  18. Wood, R.A.; Burchett, M.D.; Alquezar, R.; Orwell, R.L.; Tarran, J.; Torpy, F. The potted-plant microsm substantially reduces indoor air VOC pollution: I. office field-study. Water Air Soil Pollut. 2006, 175, 163–180. [Google Scholar] [CrossRef]
  19. Dingle, P.; Tapsell, P.; Hu, S. Reducing formaldehyde exposure in office environments using plants. Bull. Environ. Contam. Toxicol. 2000, 64, 302–308. [Google Scholar] [CrossRef] [PubMed]
  20. Roberts, B.R. Foliar sorption of atmospheric sulfur dioxide by woody plants. Environ. Pollut. 1974, 7, 133–140. [Google Scholar] [CrossRef]
  21. Fujii, S.; Cha, H.; Kagi, N.; Miyamura, H.; Kim, Y.S. Effects on air pollutant removal by plant absorption and adsorption. Build. Environ. 2005, 40, 105–112. [Google Scholar] [CrossRef]
  22. Barber, J.L.; Kurt, P.B.; Thomas, G.O.; Kerstiens, G.; Jones, K.C. Investigation into the importance of the stomatal pathway in the exchange of PCBs between air and plants. Environ. Sci. Technol. 2002, 36, 4282–4287. [Google Scholar] [CrossRef] [PubMed]
  23. Treesubsuntorn, C.; Thiravetyan, P. Removal of benzene from indoor air by Dracaena sanderiana: Effect of wax and stomata. Atmos. Environ. 2012, 57, 317–321. [Google Scholar] [CrossRef]
  24. Kacálková, K.P.; Tlustoš, P. The uptake of persistent organic pollutants by plants. Cent. Eur. J. Biol. 2011, 6, 223–235. [Google Scholar] [CrossRef]
  25. Collins, C.; Fryer, M.; Grosso, A. Plant uptake of non-ionic organic chemicals. Environ. Sci. Technol. 2006, 40, 45–52. [Google Scholar] [CrossRef] [PubMed]
  26. Omasa, K.; Tobe, K.; Hosomi, M.; Kobayashi, C. Absorption of ozone and seven organic pollutants by Populus nigra and Camellia sasanqua. Environ. Sci. Technol. 2000, 34, 2498–2500. [Google Scholar] [CrossRef]
  27. Seco, R.; Penuelas, J.; Filella, I. Formaldehyde emission and uptake by Mediterranean trees Quercus ilex and Pinus halepensis. Atmos. Environ. 2008, 42, 7907–7914. [Google Scholar] [CrossRef]
  28. Kvesitadze, E.; Sadunishvili, T.; Kvesitadze, G. Mechanisms of organic contaminants uptake and degradation in plants. World Acad. Sci. Eng. Technol. 2009, 55, 458–468. [Google Scholar]
  29. Schreiber, L. Polar paths of diffusion across plant cuticles: New evidence for an old hypothesis. Ann. Bot. 2005, 95, 1069–1073. [Google Scholar] [CrossRef] [PubMed]
  30. Schönherr, J. Characterization of aqueous pores in plant cuticles and permeation of ionic solutes. J. Exp. Bot. 2006, 57, 2471–2491. [Google Scholar] [CrossRef] [PubMed]
  31. Schmitz, H.; Hilgers, U.; Weidner, M. Assimilation and metabolism of formaldehyde by leaves appear unlikely to be of value for indoor air purification. New Phytol. 2000, 147, 307–315. [Google Scholar] [CrossRef]
  32. Kondo, T.; Hasegawa, K.; Uchida, R.; Onishi, M. Absorption of atmospheric C2–C5 aldehydes by various trees pecies and their tolerance to C2–C5 aldehydes. Sci. Total Environ. 1998, 224, 121–132. [Google Scholar] [CrossRef]
  33. Rottenberger, S.; Kuhn, U.; Wolf, A.; Schebeske, G.; Oliva, S.T.; Tavares, T.M.; Kesselmeier, J. Exchange of short-chain aldehydes between Amazonian vegetation and the atmosphere. Ecol. Appl. 2004, 14, 247–262. [Google Scholar] [CrossRef]
  34. Nobel, P.S. Physicochemical and Environmental Plant Physiology; Academic Press: Oxford, UK, 2009. [Google Scholar]
  35. Falkowski, P.; Scholes, R.J.; Boyle, E.; Canadell, J.; Canfield, D.; Elser, J.; Gruber, N.; Hibbard, K.; Högberg, P.; Linder, S.; et al. The global carboncycle: A test of our knowledge of Earth as a system. Science 2000, 290, 291–296. [Google Scholar] [CrossRef] [PubMed]
  36. Houghton, J.T.; Ding, Y.; Griggs, D.J.; Noguer, M.; vander Linden, P.; Dai, X.; Maskell, K.; Johnson, C.A. Climate Change 2001: The Scientific Basis; Cambridge University Press: Cambridge, UK, 2001. [Google Scholar]
  37. Ignatova, L.K.; Novichkova, N.S.; Mudrik, V.A.; Lyubimov, V.Y.; Ivanov, B.N.; Romanova, A.K. Growth, photosynthesis, and metabolism of sugar beet at an early stage of exposure to elevated CO2. Russ. J. Plant Physiol. 2005, 52, 158–164. [Google Scholar] [CrossRef]
  38. Reddy, A.R.; Rasineni, G.K.; Raghavendra, A.S. The impact of global elevated CO2 concentration on photosynthesis and plant productivity. Curr. Sci. 2010, 99, 46–57. [Google Scholar]
  39. Barbehenn, R.V.; Karowe, D.N.; Chen, Z. Performance of a generalist grasshopper on a C3 and a C4 grass: Compensation for the effects of elevated CO2 on plant nutritional quality. Oecologia 2004, 140, 96–103. [Google Scholar] [CrossRef] [PubMed]
  40. Roumet, C.; Garnier, E.; Suzor, H.; Salager, J.L.; Roy, J. Short and long-term responses of whole-plant gas exchange to elevated CO2 in four herbaceous species. Environ. Exp. Bot. 2000, 43, 155–169. [Google Scholar] [CrossRef]
  41. Ainsworth, E.A.; Rogers, A. The response of photosynthesis and stomatal conductance to rising [CO2]: Mechanisms and environmental interactions. Plant Cell. Environ. 2007, 30, 258–270. [Google Scholar] [CrossRef] [PubMed]
  42. Kamakura, M.; Furukawa, A. Responses of individual stomata in Ipomoea pes-caprae to various CO2 concentrations. Physiol. Plant. 2008, 132, 255–261. [Google Scholar] [CrossRef] [PubMed]
  43. Broadmeadow, M.S.J.; Heath, J.; Randle, T.J. Environmental Limitations to O3 Uptake—Some Key Results from Young Trees Growing at Elevated CO2 Concentrations. Water Air Soil Pollut. 1999, 116, 299–310. [Google Scholar] [CrossRef]
  44. Hu, Z.H.; Shen, Y.B.; Su, X.H. Saturated Aldehydes C6–C10 Emitted from Ashleaf Maple (Acer negundo L.) Leaves at Different Levels of Light Intensity, O2, and CO2. J. Plant Biol. 2009, 52, 289–297. [Google Scholar] [CrossRef]
  45. Li, J.; Feng, Y.L.; Xie, C.J.; Huang, J.; Yu, J.Z.; Feng, J.L.; Sheng, G.Y.; Fu, J.M.; Wu, M.H. Determination of gaseous carbonyl compounds by their pentafluorophenyl hydrazones with gas chromatography/mass spectrometry. Anal. Chim. Acta 2009, 635, 84–93. [Google Scholar] [CrossRef] [PubMed]
  46. Kondo, T.; Hasegawa, K.; Uchida, R.; Onishi, M.; Mizukami, A.; Omasa, K. Absorption of Atmospheric Formaldehyde by Deciduous Broad-Leaved, Evergreen Broad-Leaved, and Coniferous Tree Species. Bull. Chem. Soc. Jpn. 1996, 69, 3673–3679. [Google Scholar] [CrossRef]
  47. Seco, R.; Penuelas, J.; Filella, I. Short-chain oxygenated VOCs: Emission and uptake by plants and atmospheric sources, sinks, and concentrations. Atmos. Environ. 2007, 41, 2477–2499. [Google Scholar] [CrossRef]
  48. Hanson, A.D.; Roje, S. One-carbon metabolism in higher plants. Annu. Rev. Plant Biol. 2001, 52, 119–137. [Google Scholar] [CrossRef] [PubMed]
  49. Kondo, T.; Hasegawa, K.; Uchida, R. Absorption of formaldehyde by oleander (Nerium indicum). Environ. Sci. Technol. 1995, 29, 2901–2903. [Google Scholar] [CrossRef] [PubMed]
  50. Shimazaki, K.; Doi, M.; Assmann, S.M.; Kinoshita, T. Light Regulation of Stomatal Movement. Annu. Rev. Plant Biol. 2007, 58, 219–247. [Google Scholar] [CrossRef] [PubMed]
  51. Mansfield, T.A. Porosity at a price: The control of stomatal conductance in relation to photosynthesis. Top. Photosynth. 1985, 6, 419–452. [Google Scholar]
  52. Herrick, J.D.; Maherali, H.; Thomas, R.B. Reduced stomatal conductance in sweetgum (Liquidambar styaciflua) sustained over long-term CO2 enrichment. New Phytol. 2004, 162, 387–396. [Google Scholar] [CrossRef]
Figure 1. Scheme (a) and pictures (b,c) of the experimental apparatus for measuring the removal of aldehyde by plants. (A: pump; B: valve; C: flowmeter; D: Dinitrophenylhydrazine (DNPH)-Acid aqueous solution; E: activated charcoal; F: CO2 gas; G: aldehydes solution injection port; H: gas mixing bag; I: buffer vessel; J: gas sampling port; K: lamp; L: water tank; M: fan; N: potting-plant; O: exposure chamber. All apparatus were connected by Teflon tubes.)
Atmosphere 07 00144 g001
Figure 2. SIM Ion: selective ion monitoring ion Gas Chromatograms of standard mixture of Pentafluorophenyl hydrazine (PFPH) derivatives. Peaks 0: PFPH; 1: formaldehyde; 2 and 2′: acetaldehyde; 3 and 3′: propionaldehyde; 4 and 4′: n-butyraldehyde; 5 and 5′: valeraldehyde; 6 and 6′: 4-fluorobenzaldehyde (IS). The numbers from 2′ to 6′ are the isomers of the corresponding aldehydes.
Atmosphere 07 00144 g002
Figure 3. The mass spectrum of the PFPH-hydrazone derivatives of formaldehyde, acetaldehyde, propionaldehyde, n-butyraldehyde, and valeraldehyde. SIM Ion: selective ion monitoring ion; Qion: quantification ion.
Atmosphere 07 00144 g003
Figure 4. The ratios of peak area derived from GC of C1–C5 aldehydes (Ai) to internal standard (As) from the inlet gas (white bars) and the outlet gas (grey bars) of the Schefflera octophylla (Lour.) Harms (a) and Chamaedorea elegans (Lour.) Harms (b), species enclosed in the chamber at light intensity of about 600 lx respectively. Mean ± S.E. are shown.
Atmosphere 07 00144 g004
Figure 5. Relationship between the removal rate of C1–C5 aldehydes of the two houseplant species and the C1–C5 aldehydes concentration. (a) Schefflera octophylla (Lour.) Harms (R2 = 0.778~0.979); (b) Chamaedorea elegans. (R2 = 0.890~0.928) C1: Formaldehyde; C2: Acetaldehyde; C3: Propionaldehyde; C4: N-butyraldehyde; C5: Valeraldehyde. Significant differences for p < 0.05 are shown with least significant (LSD) test.
Atmosphere 07 00144 g005
Figure 6. The removal rate of C1–C5 aldehydes of Schefflera octophylla (Lour.) Harms (a) and Chamaedorea elegans (Lour.) Harms (b). C1: formaldehyde; C2: acetaldehyde; C3: propionaldehyde; C4: N-butyraldehyde; C5: valeraldehyde. Significant differences for p < 0.05 are shown with least significant (LSD) test.
Atmosphere 07 00144 g006
Figure 7. Relationship between the removal rates of C1–C5 aldehydes and the transpiration rate for the two houseplant species. (a) Schefflera octophylla (Lour.) Harms (R2 = 0.720–0.837); (b) Chamaedorea elegans (R2 = 0.607–0.932). C1: formaldehyde; C2: acetaldehyde; C3: propionaldehyde; C4: N-butyraldehyde; C5: valeraldehyde; transpiration rate was measured by weighing the whole plant before and after exposing to a specific light intensity according to previous research [49]. Significant differences for p < 0.05 are shown with least significant (LSD) test.
Atmosphere 07 00144 g007
Figure 8. The removel capacity on formaldehyde, actealdehyde, propionaldehyde, n-butyraldehyde, valeraldehyde by (a) Schefflera octophylla (Lour.) Harms; and (b) Chamaedorea elegans (Lour.) Harms at three CO2 concentrations (350, 700, 1400 ppmv). C1: formaldehyde; C2: acetaldehyde; C3: propionaldehyde; C4: N-butyraldehyde; C5: valeraldehyde Means (n = 3) ± S.E. are shown. Significant differences for p < 0.05 are shown with least significant (LSD) test.
Atmosphere 07 00144 g008
Table 1. Removal rates for C1 to C5 aldehydes by two houseplant species.
Carbonyl NameRemoval Rate (μmol/m2/h) a
Schefflera octophylla (Lour.) HarmsChamaedorea elegans (Lour.) Harms
Formaldehyde0.677 ± 0.1051.440 ± 0.270
Acetaldehyde0.608 ± 0.0740.995 ± 0.131
Propionaldehyde0.474 ± 0.0530.698 ± 0.091
n-butyraldehyde0.350 ± 0.0630.544 ± 0.041
n-valeraldehyde0.311 ± 0.1000.526 ± 0.143
Total2.420 ± 0.3954.203 ± 0.676
a Mean value and standard deviation (n = 3) Light intensity: approximately, 300 lx. CO2 concentration: approximately 350 ppmv.

