Article

The Effect of Freezing Drizzle, Sleet and Snow on Microphysical Characteristics of Supercooled Fog during the Icing Process in a Mountainous Area

1
Hubei Key Laboratory for Heavy Rain Monitoring and Warning Research, Institute of Heavy Rain, China Meteorological Administration, Wuhan 430205, China
2
Wuhan Regional Climate Center, Wuhan 430074, China
3
School of Atmospheric Physics, Nanjing University of Information Science and Technology, Nanjing 210044, China
*
Author to whom correspondence should be addressed.
Atmosphere 2016, 7(11), 143; https://doi.org/10.3390/atmos7110143
Submission received: 20 September 2016 / Revised: 6 November 2016 / Accepted: 8 November 2016 / Published: 11 November 2016

Abstract

:
Both the similar and different effects of freezing drizzle, sleet and snow on microphysical properties of supercooled fog were analyzed for fourteen events during a comprehensive wire icing, fog, and precipitation observation experiment conducted at Enshi radar station (30°17′N, 109°16′E; 1722 m a.s.l.) on a hilltop in Shibanling, Hubei, China. Liquid precipitation is in a relatively stable form in mountainous areas. Short-term precipitation (1–3 h) is dominant with temperature below 0 °C. The wet scavenging effect of freezing drizzle on small fog droplets with a size range less than 6–12 μm is weak but is stronger for fog droplets with a larger size, which is opposite to the effects of solid precipitation, broadening the fog droplet spectra significantly. As the fog droplet diameter increases, the distributions of droplet spectra change from leptokurtosis to platykurtosis and from positive skewness to negative skewness. Occurrence of freezing drizzle would improve the positive correlation of N-r in dissipation and oscillation periods, resulting in the N-r relationship having a weak negative correlation in the maturity period, and resulting in the transition of the N-L and N-r relationships into positive correlations in the development period. Meanwhile, the emergence of solid precipitation particles would result in negative values for the correlation coefficients of N-L and N-r. The change in relationships among the microphysical properties was caused by the occurrence of different phase precipitation, showing the influence on the main microphysical mechanisms of supercooled fog.

1. Introduction

Mountainous areas, due to their rich water vapor and low temperature, are prone to icing processes (glaze, rime and wet snow, etc.) [1]. These areas are usually preferred for high-voltage transmission line construction because of their characteristics, e.g., considerable land area and few people. However, long-term icing in mountainous areas caused by supercooled cloud/fog and precipitation seriously affects the security of transmission lines, resulting in disaster accidents, such as tower collapse, line breakage, flashover and fitting destruction [2,3], and threatening the normal operation of people's daily lives and production activities, especially in mountainous areas in winter [4]. A freezing rain and snow event in 2008 caused the collapse of 172,000 high-voltage towers, the breakage of 129,000 high-voltage lines, and the outage of 884 substations. Of these incidents, the towers at an altitude of over 300 meters accounted for 53.1% of the total collapsed towers [5,6]. High wind speed throughout the year has resulted in mountainous areas becoming the main distribution area for wind turbine generator systems [7,8]. The icing process exerts a more significant effect on wind power generation, as a severe icing disaster will not only significantly reduce power generation efficiency but also damage blades, leading to the stoppage of the generator. Even weak icing processes will change the aerodynamic characteristics of the blades, thereby lowering electricity generation expectation [9].
During the icing process, supercooled droplets hit the object surface, forming a transparent or an opaque glassy ice layer, which can be mainly divided into precipitation icing and in-cloud icing [10,11]. Precipitation icing often occurs in plains [12,13], where freezing drizzle and wet snow occur in medium-high altitude mountains and usually last a short time [14,15]; in-cloud icing is an icing process caused by cloud or fog in a supercooled state, which takes place in the mountains with a longer duration [9,16,17]. Irrespective of the icing process (except wet snow icing), what determines icing intensity is the mass of supercooled liquid water per unit volume, supercooled droplet size and the duration of the process [18,19]. Therefore, it is very important to explore macro and micro characteristics of fog and precipitation during the icing process in mountainous areas.
In recent years, studies on fog macro and micro characteristics mainly focused on the Yangtze River Delta and Pearl River Delta areas and centered on aspects such as the temporal and spatial variation of fog, temperature and humidity distribution, physical and chemical characteristics, remote sensing and numerical simulation research conducted in China [20,21,22,23,24,25,26]. However, the macro and micro characteristics of the mountain fog process have been paid little attention by scholars. Compared to plain areas, the abundant moisture in mountainous areas is more conducive to the fog process formation [27], as the uplift of warm moist air by mountain wind circulation easily results in saturation, which causes the formation of fog [28]. Tang et al. [29] and Wu et al. [30] found that fog in Dayaoshan Mountain was mainly advection and upslope fog, and fog on the windward slope was stronger than that on the leeward slope. The fog droplet concentration of mountainous fog is generally 102 cm−3 in China, which is between the values for city fog (102–103 cm−3) and sea fog (101–102 cm−3); the liquid water content is generally 0.1–0.2 g·m−3; average diameter is about 10 μm, all of which are significantly lower than those of fog in other regions [31], though its duration is significantly longer than other types of fog [32]. Deng et al. [33] noted that the fog process in Nanling Mountain is a small-droplet pattern; the particle size of most droplets is less than 12 μm, and advection factors and terrain effects have a major impact on the fluctuant changes in microphysical properties. Hilltop fog is mainly caused by a cloud system after cold front transit. Under advection, a hilltop is more vulnerable to a strong and stable fog process compared to a slope [34,35,36]. Similarly, the number concentration, liquid water content and average diameter of mountain fog in Guizhou province are 234 cm−3, 0.2 g·m−3 and 7.5 μm, respectively. The fog has a peak diameter of 4 μm, with a peak concentration of approximately 63% of total concentration [37]. However, with an adequate supply of water vapor, there would be a significant increase in the liquid water content of mountain fog [38]. Drage and Hauge [5] observed and simulated the liquid water content of supercooled fog in coastal mountain areas and showed that the liquid water content reached 0.4 g·m−3 during a rapid growth period of icing.
However, the fog process in mountainous areas usually does not occur alone in winter but is often accompanied by freezing precipitation [39]. There are usually two formation mechanisms of freezing precipitation: melting process and supercooled warm rain process. The melting process mainly occurs in plains, which is the main mechanism for the formation of freezing rain [13], while the supercooled warm rain process primarily occurs in high altitude areas or mountains, which is the main mechanism for the formation of freezing drizzle [40]. The supercooled warm rain process does not require the presence of a warm layer above 0 °C over the observation point. The diameters of supercooled droplets increase through collision-coalescence mechanisms and fall to the ground in the form of freezing drizzle [41,42]. Hilltop observation points, due to their high altitude, are vulnerable to exposure to the bottom of the cloud formed after cold front transit. In an environment of high relative humidity at low levels, under stably stratified conditions, weak mesoscale uplift, cloud tops of −15 °C or warmer, and low concentrations of both ice crystals and ice nuclei, the formation of freezing drizzle would be more favorable [43].
In comprehensive observations of macro and micro characteristics of wire icing during the winter of 2009 and 2010, we observed the simultaneous occurrence of supercooled fog and freezing drizzle, mixed-phase precipitation or solid precipitation several times when icing occurred. Precipitation would have some “scouring action” on the fog process and would reduce the liquid water content of fog, but increased moisture due to precipitation particle evaporation is beneficial to the maintenance of fog [44]. In particular, when solid precipitation occurs, under the effect of ice crystals, the growth of ice particles will consume the supercooled fog droplets [45], thereby affecting the microphysical properties of supercooled fog. However, observational experiments and numerical simulations have mostly focused on pure foggy weather; there is less research on the phenomena of fog mixed with rain/snow, and there are even fewer studies on the effect of different phases of precipitation, including freezing drizzle, sleet and snow in the icing process below 0 °C, on fog droplet spectra. A study on the macro and micro characteristics of fog mixed with different phase precipitation in a supercooled state would provide accurate hydrometeor spectra for an icing numerical model, which would promote the progress of the microphysical parameterization scheme of cloud precipitation in icing weather in mountain areas, improve reliability and accuracy of quantitative evaluation and early warning of icing phenomena, and effectively enhance the ability of the relevant authorities to prevent icing hazards. In this paper, 14 events of supercooled fog mixed with freezing drizzle, sleet and snow in 4 icing processes of the Enshi radar station in Hubei during January–March 2009 and December 2009–January 2010 were selected. Using an FM-100 fog droplet spectrometer, Parsivel precipitation particle disdrometer, visibility meter and automatic/manual meteorological station, the evolution of macro and micro characteristics of supercooled fog under the effect of different phases of precipitation during the icing process was analyzed in detail. A comparative study was conducted on the similarities and differences of the effect of different phase precipitation on the microphysical properties of supercooled fog. Finally, a method to quantitatively estimate the effect of different phase precipitation on the fog droplet spectral pattern was preliminarily explored.

2. Observation Site and Instruments

In January–March 2009 and December 2009–January 2010, a comprehensive observation experiment on wire icing, fog, and precipitation was conducted at Enshi radar station (30°17′N, 109°16′E; 1722 m a.s.l.) on a hilltop in Shibanling, Hubei. The observations mainly covered icing thickness and mass, macro- and microphysical structures of fog and precipitation, visibility, weather phenomena and routine meteorological factors. The detailed conditions of the observation experiment could be found in [46]. The observation site was located at the highest point of the surrounding area (Figure 1), which is less affected by mountains or buildings. Moreover, the lush vegetation cover in the mountain area of southwestern Hubei is conducive to the occurrence and development of fog and precipitation. Enshi, located in western Hubei, is densely covered by 500 kV high voltage transmission lines of the Gezhouba Power Plant and the Three Gorges power transmission project, which provides considerable scientific and practical value for a study on supercooled fog and precipitation during icing.
Fog droplet size distributions were measured using an FM-100 droplet spectrometer (Droplet Measurement Technologies (DMT), Boulder, CO, USA). This spectrometer consists of three parts: optical base, signal processor, and vacuum component for dust removal of particles through the optical window. The principle is: first, the optical base receives a forward scattered beam of the particles through the optical window; then, the signal processor converts the optical pulse to voltage, to be transmitted to the data processing system after amplification and filtering; then, according to different laser scattering intensities of fog droplets of different diameters, the fog droplets are counted to provide the number within each class. The sampling frequency is 1 Hz, and the measurement range is 1–50 μm in diameter, with 20 classes. As there might exist large measurement error in particle size 1–2 μm, this class was excluded from the calculations. See the literature for the detailed measurement principle [47].
Raindrop size distributions were measured with a Parsivel raindrop spectrometer (OTT Hydromet, Kempten, Germany). The principle is as follows: when the raindrop generates a high stable laser band after passing through the generator, a weakened signal under the extinction effect results in reduced voltage; then, the size of the raindrop can be measured by the amplitude of the voltage deviation, and raindrop speed can be measured by the duration of the voltage deviation. This instrument can distinguish eight types of precipitation, including drizzle, rain, freezing rain, sleet, snow, hail, etc. See the literature for the detailed measurement principle [48].

3. Results and Discussion

3.1. General Characteristics of Drizzle/Sleet/Snow–Mixed Fog

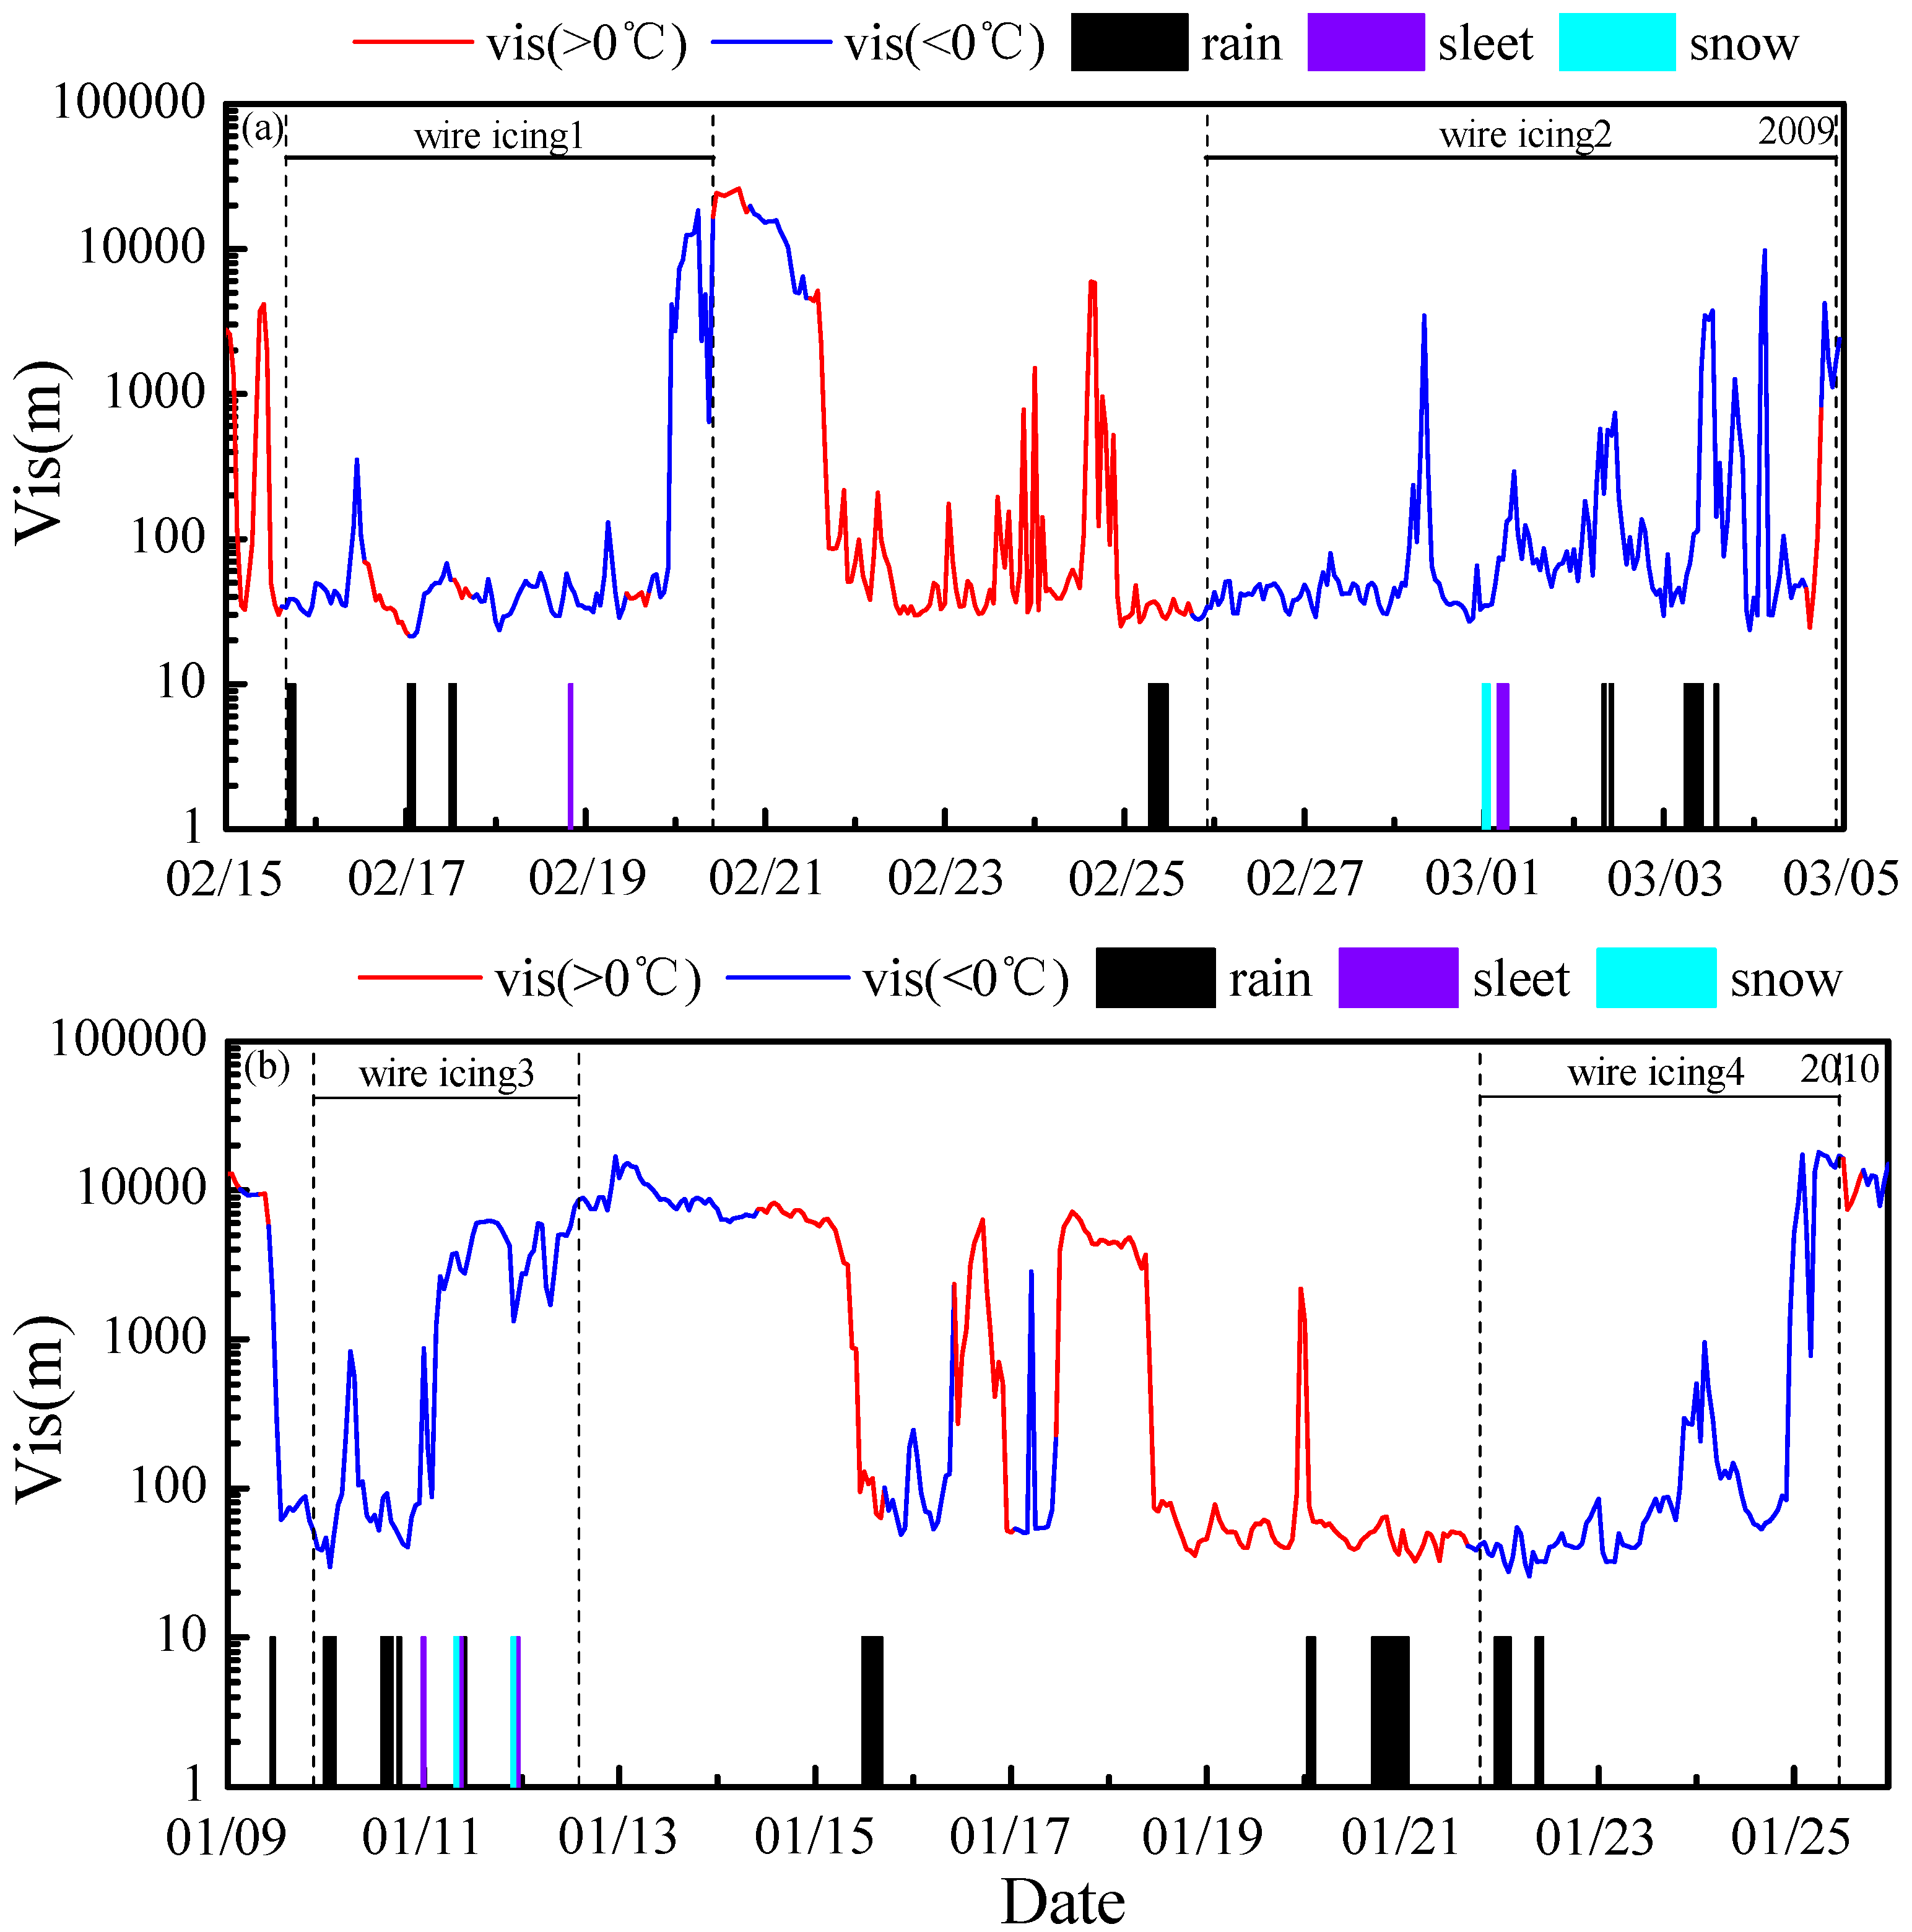
In the winter of 2009 and 2010, 4 icing events were observed. The first icing event was weak, the second had the longest duration, and all of them were typical mountainous icing processes presented as mixed-phase. Figure 2 shows the temporal evolution of visibility, temperature, and the occurrence time of rain, sleet, and snow in the field observations in winter of 2009 and 2010. As can be observed, precipitation mainly occurred when the temperature was below 0 °C, and the icing process occurred, which was mainly affected by stratiform cloud associated with a cold front and the topographic uplifting effect [18]. There were different types of precipitation, of which the dominant was freezing rain or freezing drizzle. Sometimes, sleet and snow occurred, but with relatively short duration. Further, snow might be converted to sleet or even rain, which indicates that the liquid state is a relatively stable form of precipitation during icing events in mountainous areas.
The duration of precipitation was different when the temperature was above 0 °C versus below 0 °C. The duration of precipitation usually lasted more than 5 h when the temperature was above 0 °C, accounting for about 75% of the total precipitation events within that temperature range; 1–3 h short-term precipitation was dominant when the temperature was below 0 °C, accounting for 89.5% of total precipitation events within that temperature range. Moreover, visibility was less than 100 m for a long time period, which was different from the fog observation in Nanling Mountain, whose visibility increased above 1000 m more frequently [33]. This might be related to the higher altitude of the observation site, which could reduce the effect of cloud gap on visibility.
As shown in Table 1, in order to analyze the evolution of microphysical properties of supercooled fog mixed with different phase precipitation as well as the influence of precipitation on fog events during icing events, 14 supercooled fog events (visibility less than 1000 m) accompanied with precipitation with a duration longer than 60 min during icing events were selected. The rainfall density of freezing drizzle was very low, and the cases of rainfall density lower than 0.2 mm·h−1 accounted for more than 80% of all cases, while the rainfall density of sleet and snow was higher than 1 mm·h−1. Combined with its relatively short duration, even the wind transport of supercooled raindrops to wire icing was considered [49], and the cumulative rainfall of freezing drizzle contributed little to wire icing growth. Therefore, sustainable development of the icing process in this mountainous area mainly depended on the stable maintenance of supercooled fog or cloud. It is very important to discuss the variations in microphysical characteristics of drizzle/sleet/snow-mixed fog, influenced by different types of precipitation.
Number concentrations and average diameters of fog droplets during precipitation periods were substantially lower than 300 cm−3 and 5 μm, respectively, smaller than the observation values from other mountainous areas in China [31], which was determined by the development of both fog and precipitation. The range of liquid water content was 0.02~0.17 g·cm−3, which was smaller than the value of pure fog, but mainly determined by the development period of the fog process. Gultepe et al. [50] divided the life history of fog into three phases: development, maturity and dissipation. During the observation in the Enshi mountainous area, we found that there was a significant increase in the number concentration of fog droplets in a short time, but diameter remained at a relatively low value after fog body dissipation, causing the liquid water content to increase slightly. Therefore, we defined this as an oscillation period. There was freezing drizzle in all 4 icing periods, while sleet and snow only occurred in the dissipation and oscillation periods. Solid precipitation particles would be prone to appear in a cloud system behind a cold front, with very low temperature and less water vapor, causing the fog to dissipate.

3.2. Effect of Drizzle/Sleet/Snow on Number Concentrations of Fog

The two aspects of the direct impact of precipitation on the fog process have been reported as follows: one is due to the different falling velocities of droplets [51], fog droplets are easily subject to coagulation by raindrops, especially the larger fog droplets; the other is that increasing humidity caused by the evaporation of precipitation particles contributes to fog maintenance [44]. However, when temperature is below 0 °C, the appearance of solid precipitation particles increases the complexity of its impact on the fog process. Fog droplets are not only affected by the coagulation effect but are also continuously evaporated under the ice crystal effect, with number concentrations of fog droplets been effectively reduced.
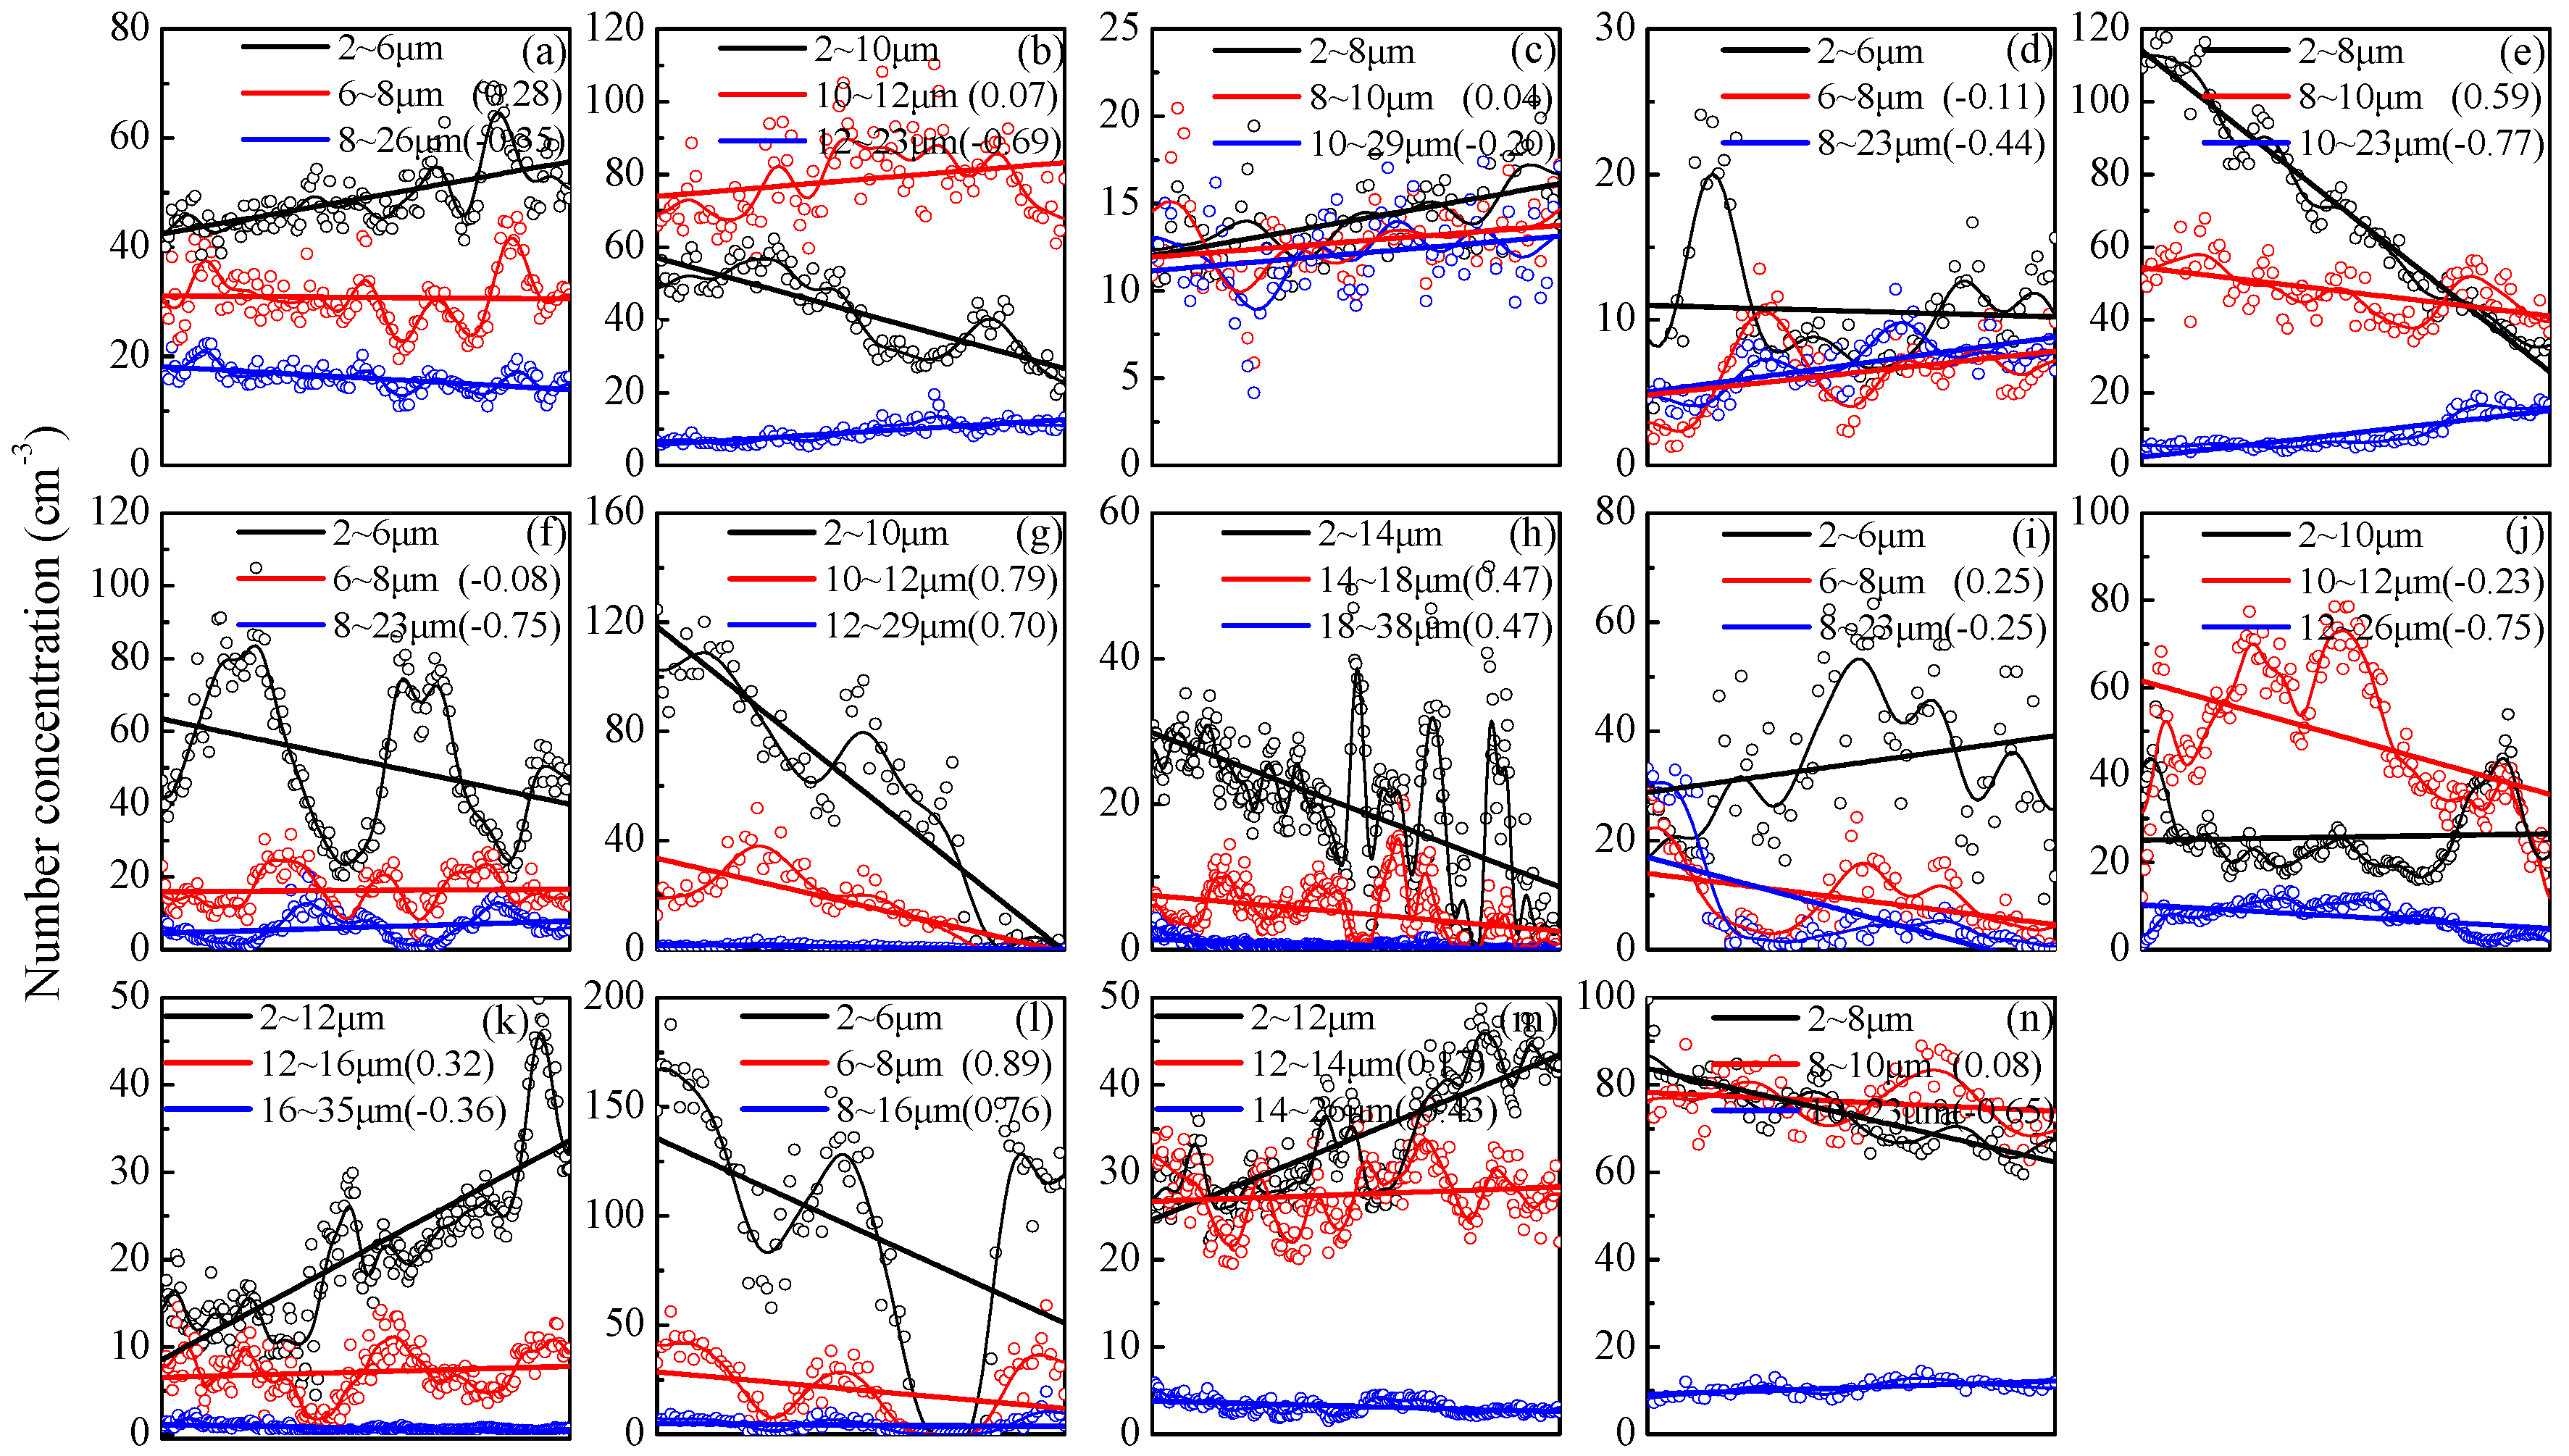
The number concentrations of fog droplets in each bin of the spectrometer exhibited similar or different variation trends based on the analysis of the 14 precipitation events. Therefore, we analyzed the relationships among the number concentrations of each bin of the spectrometer. They exhibited similar or different variation laws based on the calculations of correlation coefficients. In addition, if we found that the number concentration of a certain bin was poorly correlated with the number concentration of an adjacent bin with a smaller diameter but well-correlated with the value of an adjacent bin with a larger diameter, this bin was the cutoff value (Cv1) between Nm and Ns. In addition, if the number concentration of a certain bin was poorly correlated with the number concentration of an adjacent bin with a larger diameter but was well-correlated with the value of an adjacent bin with a smaller diameter, this bin was the cutoff value (Cv2) between Nl and Nm. The whole size range of the spectrometer could be divided into three categories: size range from 2 μm to Cv1, size range from Cv1 to Cv2, and size range larger than Cv2. The number concentrations of fog droplets in the bins of each category showed a similar variation law. The average values of number concentrations in the bins of similar variation trends are shown in Figure 3. The starting and ending periods in Figure 3 were defined by the duration periods of precipitation observed by the raindrop spectrometer. Linear correlation was used to illustrate the variation trends of Ns, Nm, and Nl generally, while a non-linear correlation method was not suitable in showing the variation trends.
During 11 freezing drizzle events, raindrops had a stronger wet scavenging action on larger fog droplets, while smaller fog droplets would be pulled away from the collision trajectory of raindrops because of fluid dynamics [52]. The variations in small fog droplet concentrations (Ns, black lines) showed an upward tendency in 6 events but a downward tendency in the other 5 events. However, the size ranges of fog droplets (Nm, red lines), where the variation of average number concentrations affected by precipitation presented stable or declining characteristics, especially for events with small fog droplet number concentrations, increased significantly (case1, 9, 11 and 13). This illustrated that freezing drizzle had an inhibitory effect or reducing effect on the variation in the number concentrations in these size ranges to some extent. Under the suppression of precipitation, the number concentrations of large fog droplets (Nl, blue lines) exhibited more gradual variations with no significant increasing period. In case4, sleet was slight in the first 20 min, which resulted in a marked increase in the number concentrations of small fog droplets at the beginning. Subsequently, the number concentrations of each bin were significantly suppressed by precipitation. In case6, the alternating occurrence of liquid and solid precipitation particles caused the number concentrations of small fog droplets to fluctuate dramatically and reduce gradually in variation. Snow occurred throughout case5; the number concentration of small fog droplets declined rapidly and varied with weak fluctuation. In these 3 fog cases with the occurrence of solid precipitation particles, the number concentrations of large fog droplets varied with the oscillating increase. This might be caused by the enhancement of disturbance and turbulence, when solid raindrops fell to the ground. Therefore, the number concentrations of small fog droplets would be reduced by the ice crystal effect, while the large fog droplets would be further supplemented. The threshold diameter which distinguished the size range of fog droplets with different variation laws under the influence of precipitation was mainly concentrated in the range 6–12 μm. For the only three cases (case8, 11, 13) with a threshold diameter greater than 12 μm, precipitation durations were the longest among all the processes, i.e., longer than 200 min. The longer duration resulted in large fluctuation in the size ranges of fog droplets under the effect of precipitation.
Furthermore, we conducted a comparison analysis of the number concentration variations among the 3 size ranges. Because the correlation coefficients of the Ns’s relationship with Nm and Nl were comparable, we mainly focused on their characteristics, without analyzing the correlation between Nm and Nl. The microphysical properties of fog varified concurrently, so the relationships were calculated only offset in time. In case1, 2, 3, 4, 6, 9, 10, 11, 13 and 14, the relationships between Ns and Nl showed good negative correlations, while the relationships between Ns and Nm were weak. Moreover, the variations of Ns were well-correlated with Nm and Nl in case7, 8, and 12, which might be caused by the sharply decrease in Ns and the weak impact of precipitation on fog cases. However, it could be noted that the correlation characteristics in case5 with solid precipitation during the whole process were distinctively different from those in other cases. There was a positive correlation between Ns and Nm, but a negative correlation between Ns and Nl, which might be caused by the consumption of small fog droplets and the enhancement of large fog droplets by the influence of frozen precipitation. The characteristics of correlations also confirmed that our division of three size ranges of fog droplets, which were affected by precipitation to different degrees, was relatively reasonable.

3.3. Evolution of Fog Droplet Spectra under the Influence of Drizzle/Sleet/Snow

A droplet spectrum is a microphysical property that can comprehensively reflect the whole process of fog formation, development and dissipation [53]. The macro and microphysical mechanisms affecting the fog process can be examined by the characteristics of fog spectra [54]. Therefore, the exploration of precipitation effects on fog droplet spectra could comprehensively reveal the diverse role of different phase precipitation droplets on the microphysical characteristics of supercooled fog.
Figure 4 illustrates the temporal evolution of fog spectra based on the data from one-hour before/after the precipitation processes and average data during the processes. As can be seen in the figure, the spectral pattern of fog spectra was basically a bimodal distribution, with peaks at 3 μm and 11–13 μm. Comparisons of fog spectra in the last one hour of the processes with the spectra one hour after the processes were made in 10 freezing drizzle cases (spectral data missing for case13), which revealed that there was a significant decline in peak concentration at 3 μm in seven cases (case1, 2, 3, 7, 8, 10 and 11) at the end of precipitation, with close values in the other three cases (case9, 12 and 14). In further comparisons of peak concentrations at 11–13 μm, there was a significant decline in the peak values of 9 cases as precipitation tended to end, with the exception of case11, whose peak concentration increased to a certain extent after precipitation. This might be because the background variation of peak concentrations in case11 was significantly reduced, so the increased value caused by the occurrence of freezing drizzle could not exceed the one-hour value after the case, which was also reflected in the evolution of peak concentration in this case (first decreased and then increased). With respect to the end of large fog droplets (40 μm or so), there was an obvious decline in number concentrations accompanied by the precipitation compared to one hour before the cases, except for case3, which might be caused by background variation of the spectrum. Moreover, it could be noted that the spectral distributions near the end of the large droplets (except case2) were closer to the corresponding spectral distributions of one hour after the precipitation processes, indicating that the occurrence of freezing drizzle would suppress the increase of large fog droplet concentrations.
For the three cases with sleet or snow, the most notable feature was that the droplet spectra were significantly widened accompanied by the duration of precipitation. However, the number concentrations of small fog droplets between the first and second peak decreased significantly in case5, while the reduction of concentrations in the corresponding size range was not obvious in case4 and case6, due to the existence of liquid precipitation, and they had the characteristics of fog droplet spectra under the simultaneous existence of liquid and solid precipitation particles, in which the droplet spectra distributions between the second peak and large fog droplet end were more regular due to the weak impact of solid precipitation on these size ranges.

3.4. Quantitative Estimation for Fog Droplet Size Distribution under the Influence of Drizzle/Sleet/Snow

Based on contrast analysis of temporal variations of fog droplet spectra between different periods, we had a qualitative understanding of the effects of different phase precipitation on the size distributions of droplet spectra. In order to quantitatively estimate these effects, statistical parameters, kurtosis (K) and skewness (S), were introduced in this section to describe the steepness and symmetry, respectively, of spectral distributions. This is a method proposed by Liu et al. [55,56] to describe the statistical characteristics of spectra, which can be applied to raindrop, aerosol and cloud droplet spectra. The calculation formulas are defined as:
S = ( D D ¯ ) 3 N ( D ) N d D [ ( D D ¯ ) 2 N ( D ) N d D ] 3 2
K = ( D D ¯ ) 4 N ( D ) N d D [ ( D D ¯ ) 2 N ( D ) N d D ] 2 3    
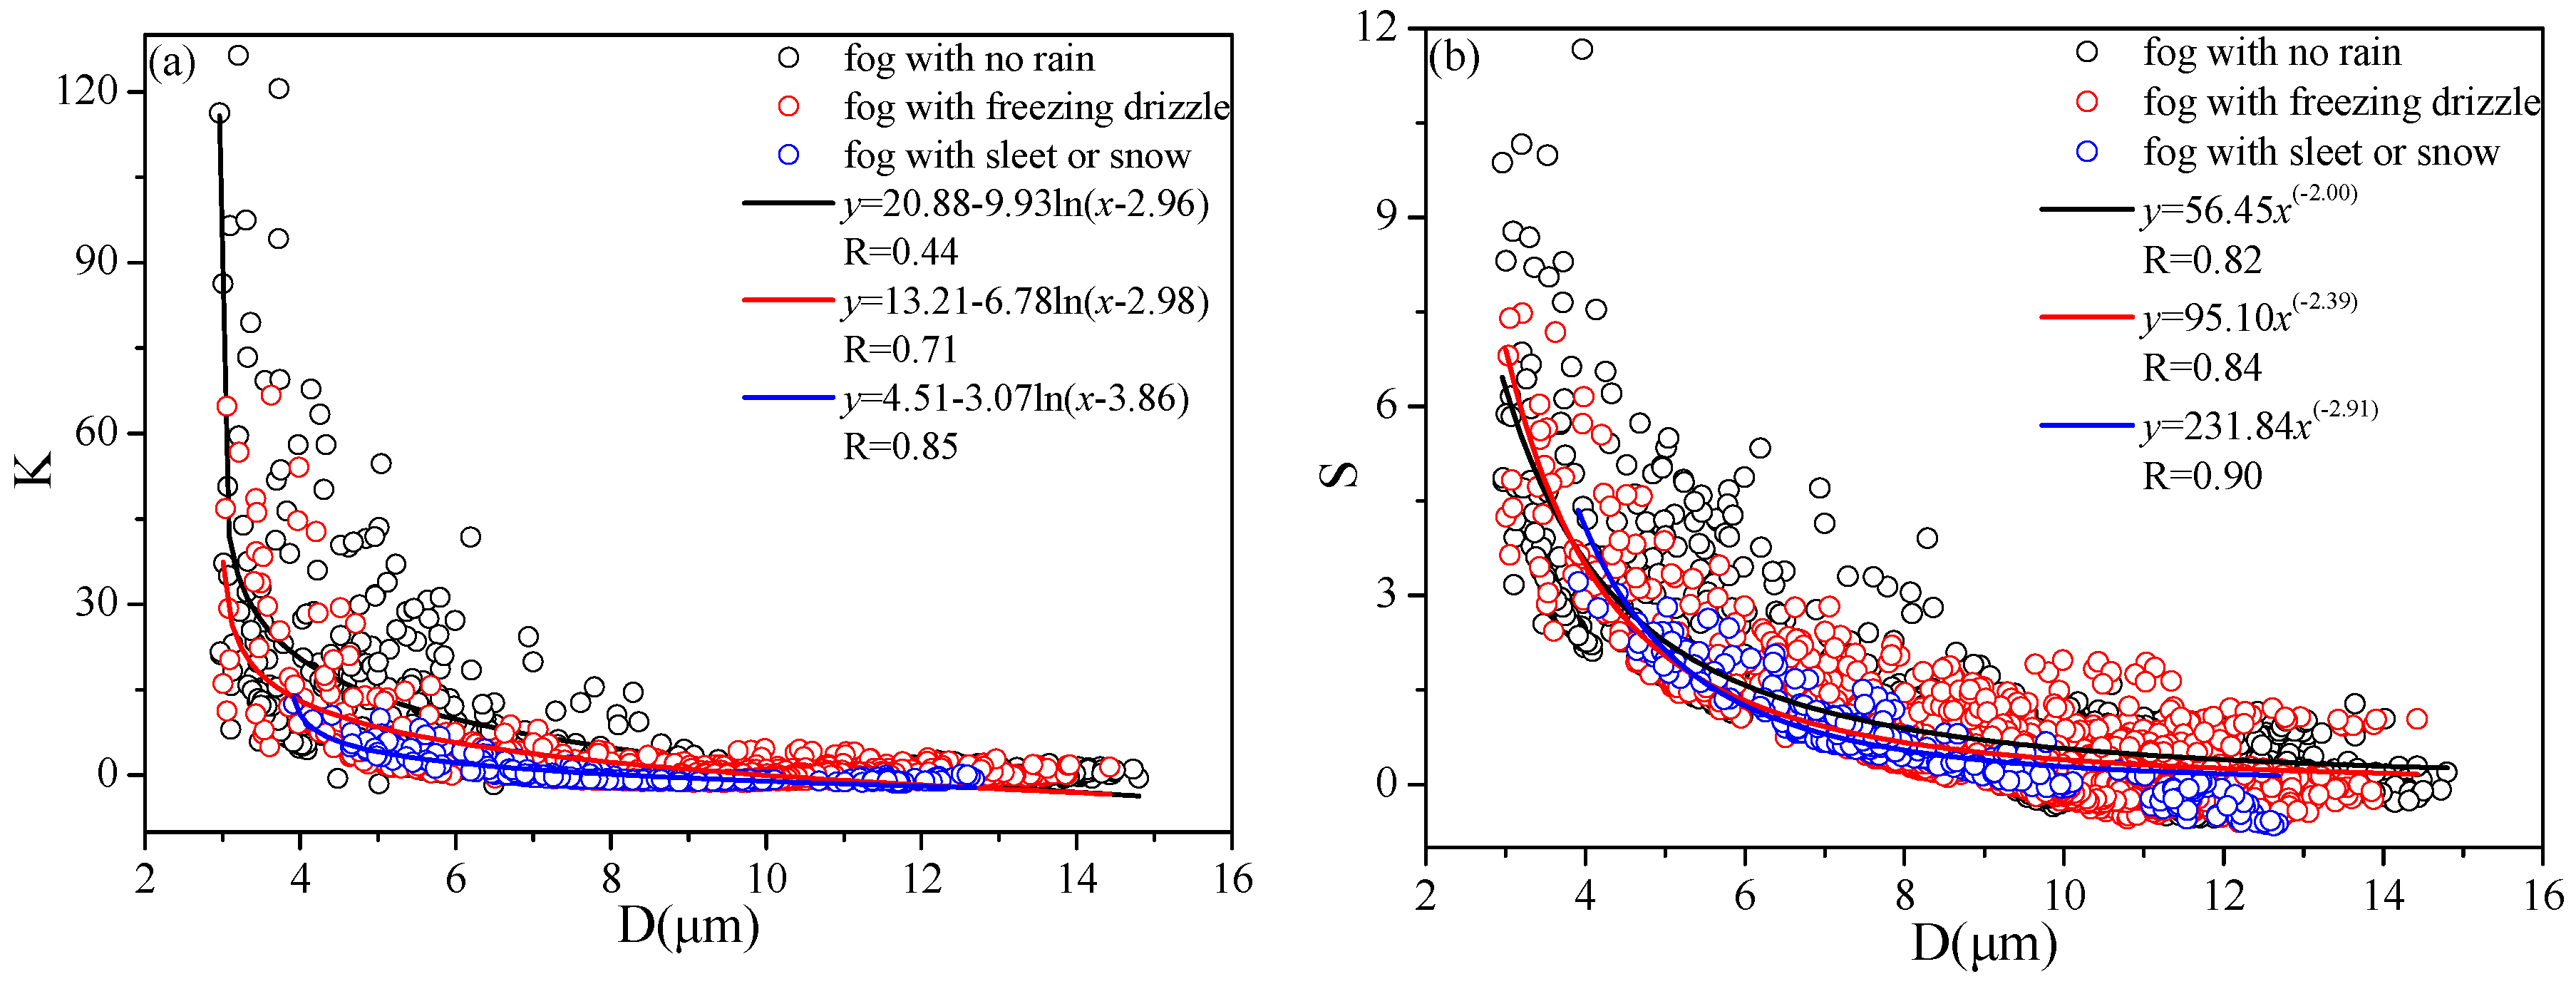
where N is the total number concentration, D ¯ is the average diameter, N(D) is number concentration of fog droplets in diameter D. Figure 5 illustrates the scatterplot of K and S calculated from the 1-min-average data and the corresponding fitting curves during the no-precipitation (one hour before and after precipitation), freezing drizzle, and sleet/snow periods. The values of kurtosis or skewness reduced monotonically with the diameter of fog droplet increase, changing from a positive value to a negative value irrespective of K or S. Moreover, the correlation coefficients increased from 0.44 to 0.85 in Figure 5a and from 0.82 to 0.90 in Figure 5b, indicating the spectral patterns evolved regularly and stably under the suppression of precipitation. For kurtosis, fog droplet spectra varied from leptokartosis to platykurtosis; for skewness, it changed from positive skewness to negative skewness with the increase in fog droplet diameter.
Further, we contrasted the variation of kurtosis with diameter in three different situations (no precipitation; freezing drizzle; sleet/snow) in Figure 5a. When the values of kurtosis were the same, the diameter of fog droplets would be the minimum under the effect of sleet/snow, followed by that under the effect of freezing drizzle, while that in the process without precipitation was the maximum. The consumption of small fog droplets and enhancement of turbulent collision-coagulation by solid precipitation particles resulted in a platykurtic spectral distribution. The occurrence of freezing drizzle increased the number concentrations of small fog droplets but reduced the number concentrations of large fog droplets, resulting in the diameter being smaller than that in fog periods without precipitation. On the other hand, when the diameter was the same, droplet spectra under the effect of sleet/snow were close to the platykurtic distribution. However, the spectra kurtosis under the effect of freezing drizzle was lower than that of periods without precipitation; the reason is that there were more small fog droplets and less large fog droplets under the effect of freezing drizzle, making the average diameter almost the same as that for the fog processes without precipitation.
Figure 5b shows the variation of skewness with diameter. Under the conditions of the average diameter less than 4 μm, the small fog droplets dominated the fog processes. The occurrence of freezing drizzle would provide abundant moisture, favorable to condensational growth of droplets, resulting in the larger diameter under the same skewness and larger skewness under the same particle size. The proportions of large droplets increased with the increase in droplet diameter, and the variation characteristics of skewness with diameter were similar to those of kurtosis.

3.5. Microphysical Mechanisms of Fog under the Influence of Drizzle/Sleet/Snow

The effects of different phase precipitation particles on the number concentrations of fog droplets would not only change droplet spectral distributions and variations of microphysical properties but also influence the leading microphysical mechanisms of fog processes. Fog events at different periods are usually co-affected by one predominate microphysical mechanism and several subordinate microphysical mechanisms. Distribution laws in figures for relationships among microphysical properties are expected in response to various physical mechanisms. The following analysis focuses on discussions of effects of different phase precipitation on the leading microphysical mechanism of fog. Figure 6 shows the relationships among the number concentration (N), radius (r), and liquid water content (L) of fog under the effects of freezing drizzle, sleet, and snow during the development, maturity, dissipation, and oscillation periods. Fog droplets affected by activation with subsequent condensational growth (deactivation via complete droplet evaporation) would lead to the co-variations of N, r, and L [23] when the fog processes were in maturity, dissipation and oscillation periods (Figure 6j–r), in which the positive correlation between N and r was weaker than that between N and L and between L and r, which might be affected by slower activation speed of small fog droplets. As freezing drizzle occurred, there was an increase in the number concentrations of small fog droplets in the dissipation and oscillation periods of fog, improving the positive correlation of N-r significantly. However, in the mature period of fog, there would be more large droplets and less small droplets; the increase in the number concentrations of small droplets caused by freezing drizzle in this period would increase N and decrease r, resulting in the weak negative correlation between N and r (Figure 6p–r).
In the development period of fog (Figure 6a–c), N-L and N-r showed strong negative correlations, while L-r showed a strong positive correlation. These are typical relationships among microphysical properties during the growth process of collection (collision and coalescence): the reduction of small droplets in terms of number concentration due to coagulation and an increase in large droplets in terms of number concentration caused by the increase in the liquid water content and average diameter of the fog. The occurrence of freezing drizzle in this period increased the small droplets and decreased the large droplets in terms of number concentrations, leading to a conversion from negative correlations to positive correlations of N-L and N-r.
Sleet occurred in the oscillation period of the fog process (Figure 6d–f), and snow occurred in the dissipation period of the fog (Figure 6g–i). Comparative analysis of relationships of N-L and N-r was carried out under these two phases of precipitation. With the appearance of solid precipitation particles, positive correlations of N-L and N-r weakened significantly and began to transit from positive correlations to negative correlations. Moreover, the increased proportion of solid precipitation particles further weakened the positive correlations of N-L and N-r. Compared with case4, the positive correlation among microphysical properties was weaker, and the negative correlation was stronger in case5, caused by the decrease in small fog droplets and increase in large fog droplets in terms of number concentrations under the influence of solid precipitation particles. Number concentrations decreased for small droplets and increased for large droplets, which would lead to the values of r increasing markedly but with an effect on the variation of L with two distinct trends for increment and reduction. As a result, N-r exhibited stronger correlation in the snow period.

4. Conclusions

In comprehensive field observations of wire icing and macro and microphysical characteristics of fog/cloud and precipitation at Enshi radar station, 14 events of supercooled fog mixed with freezing drizzle, sleet and snow were encountered and observed in icing periods during the winter of 2009 and 2010, including 11 events with freezing drizzle, 2 events with sleet, and 1 event with snow. The major conclusions are as follows.
(1)
In icing processes of mountainous areas, liquid precipitation was a relatively stable form of precipitation. The duration of precipitation was usually more than 5 h with temperature above 0 °C, while 1–3 h short-term precipitation was dominant with temperature below 0 °C. Due to the high altitude of the observational site, the visibility was below 1000 m for a long time. The rainfall intensity of freezing drizzle was substantially below 0.2 mm·h−1, while that of sleet and snow was greater than 1 mm·h−1. Precipitation occurred at different periods of fog processes, but sleet and snow mainly occurred in the dissipation and oscillation periods. When precipitation occurred, the number concentration, diameter and liquid water content of fog were 300 cm−3, 5 μm and 0.02–0.17 g·cm−3, respectively, which were lower than those of fog processes in other regions.
(2)
The wet scavenging effect of freezing drizzle on small fog droplets with a size range less than 6–12 μm was weak but stronger for fog droplets with a larger size, which was opposite to the effects of solid precipitation. Moreover, the number concentrations of small droplets had a strong negative correlation with those of large droplets under the influence of precipitation. Droplet spectra had a basic bimodal pattern, with the peak value located at 3 μm and 11–13 μm. Freezing drizzle increased the number concentrations at 3 μm and decreased the values at 11–13 μm, while the occurrence of solid precipitation significantly broadened the droplet spectra.
(3)
Under the suppression of raindrops, the distributions of fog droplets showed regular evolution. The distributions of droplet spectra changed from leptokartosis to platykurtosis and from positive skewness to negative skewness with the increase in diameter. The spectrum was closest to a platykurtic distribution under the influence of sleet/snow. In addition, when the average diameter of the fog droplets was smaller than 4 μm, the skewness of the droplet spectrum was greater under the conditions of freezing drizzle.
(4)
Fog droplets mainly affected by activation with subsequent condensational growth (deactivation via complete droplet evaporation) would lead to the co-variations of N, r, and L, when fog processes were in the maturity, dissipation and oscillation periods. Freezing drizzle would improve the positive correlation of N-r in the dissipation and oscillation periods and reduce the negative correlation of N-r in the maturity period. The relationships among N, r and L demonstrated a strong negative correlation when the fog process was in the development period. The major microphysical mechanism in this period was collision-coalescence, while the occurrence of freezing drizzle would result in the transition of relationships of N-L and N-r into positive correlations. With the advent of solid precipitation particles, relationships of N-L and N-r would transit into negative correlation. Moreover, the number concentrations of small droplets decreased and those for large droplets increased under the influence of snow, causing the negative correlation of N-r to be stronger than that of N-L.

Acknowledgments

This work is supported by the National Natural Science Foundation of China (41375138, 41505121, and 41675136), National Key Project of MOST (JFYS2016ZY01002213-03) and the Natural Science Foundation of Jiangsu Province (BK20130111). The authors are grateful for the valuable help provided by Chunsong Lu from the School of Atmospheric Physics, Nanjing University of Information Science and Technology, Nanjing, China.

Author Contributions

Shengjie Niu conceived and supported the observations; Yue Zhou and Jingjing Lü carried out the observations; Yue Zhou and Yuehua Zhou analyzed the data; Yue Zhou wrote the paper.

Conflicts of Interest

The authors declare no conflict of interest.

References

  1. Lamraoui, F.; Fortin, G.; Benoit, R.; Perron, J.; Masson, C. Atmospheric icing impact on wind turbine production. Cold Reg. Sci. Technol. 2014, 100, 36–49. [Google Scholar] [CrossRef]
  2. Parent, O.; Llinca, A. Anti-icing and de-icing techniques for wind turbines. Cold Reg. Sci. Technol. 2011, 65, 88–96. [Google Scholar] [CrossRef]
  3. Neil, D.; Hahmann, A.N.; Clausen, N.E. Forecast of icing events at a wind farm in Sweden. J. Appl. Meteorol. Climatol. 2014, 53, 262–281. [Google Scholar]
  4. Hu, Y. Analysis and countermeasures for large area accident cause by icing on transmission line. High Volt. Eng. 2005, 31, 14–15. [Google Scholar]
  5. Drage, M.A.; Hauge, G. Atmospheric icing in a coastal mountainous terrain: Measurements and numerical simulations, a case study. Cold Reg. Sci. Technol. 2008, 53, 150–161. [Google Scholar] [CrossRef]
  6. Carrière, J.M.; Lainard, C.; Bot, C.L.; Robart, F. A climatological study of surface freezing precipitation in Europe. Meteorol. Appl. 2000, 7, 229–238. [Google Scholar] [CrossRef]
  7. Yang, J.B.; Li, Z.; Yang, F.L.; Huang, T.Z. Analysis of the features of covered ice and collapsed tower of transmission line snow and ice Attacked in 2008. Adv. Power Syst. Hydroelectr. Eng. 2008, 24, 4–8. [Google Scholar]
  8. Li, Z.; Yang, J.B.; Han, J.K.; Huang, T.Z.; Huang, H. Analysis on transmission tower toppling caused by icing disaster in 2008. Power Syst. Technol. 2009, 33, 31–35. [Google Scholar]
  9. Jasinski, W.J.; Noe, S.C.; Selig, M.S.; Bragg, M.B. Wind turbine performance under icing conditions. J. Sol. Energy Eng. 1998, 120, 60–65. [Google Scholar] [CrossRef]
  10. Jiang, X.L.; Yi, H. Transmission Line Regelation Harm and Protection; China Power Press: Beijing, China, 2002; pp. 3–15. [Google Scholar]
  11. Farzaneh, M. Atmospheric Icing of Power Networks; Springer: Québec, QC, Canada, 2008; pp. 83–110. [Google Scholar]
  12. Chen, B.J.; Hu, W.; Pu, J.P. Characteristics of the raindrop size distribution for freezing precipitation observed in southern China. J. Geophys. Res. 2011, 116. [Google Scholar] [CrossRef]
  13. Bernstein, B.C. Regional and local influences on freezing drizzle, freezing rain, and ice pellet events. Weather Forecast. 2000, 15, 485–508. [Google Scholar] [CrossRef]
  14. Ikeda, K.; Rasmussen, R.M.; Hall, W.D.; Thompson, G. Observations of freezing drizzle in extratropical cyclonic storms during IMPROVE-2. J. Atmos. Sci. 2007, 64, 3016–3043. [Google Scholar] [CrossRef]
  15. Changnon, S.A.; Karl, T.R. Temporal and spatial variations of freezing rain in the contiguous United States: 1948–2000. J. Appl. Meteorol. 2003, 42, 1302–1315. [Google Scholar] [CrossRef]
  16. Frohboese, P.; Anders, A. Effects of icing on wind turbine fatigue loads. J. Phys. Conf. Ser. 2007, 75, 1–13. [Google Scholar] [CrossRef]
  17. Makkonen, L.; Ahti, K. Climatic mapping of ice loads based on airport weather observations. Atmos. Res. 1995, 36, 185–193. [Google Scholar] [CrossRef]
  18. Zhou, Y.; Niu, S.J.; Lü, J.J.; Zhao, L.J. Meteorological conditions of ice accretion based on real-time observation of high voltage transmission line. Chin. Sci. Bull. 2012, 57, 812–818. [Google Scholar] [CrossRef]
  19. Thorkildson, R.M.; Jones, K.F.; Emery, M.K. In-cloud icing in the Columbia Basin. Mon. Weather Rev. 2009, 137, 4369–4381. [Google Scholar] [CrossRef]
  20. Niu, S.J.; Liu, D.Y.; Zhao, L.J.; Lu, C.S.; Lü, J.J.; Yang, J. Summary of a 4-year fog field study in Northern Nanjing, Part 2: Fog Microphysics. Pure Appl. Geophys. 2012, 169, 1137–1155. [Google Scholar] [CrossRef]
  21. Pu, M.J.; Zhang, G.Z.; Yan, W.L.; Li, Z.H. The characteristics of an infrequent advection radiation fog. Sci. China Earth Sci. 2008, 38, 776–783. [Google Scholar]
  22. Fan, Q.; Wang, A.Y.; Fan, S.J.; Wu, D.; Liang, J.J. Numerical simulation study of a radiation fog in Pearl River Delta regions. Sci. Meteorol. Sin. 2004, 24, 1–8. [Google Scholar]
  23. Niu, S.J.; Lu, C.S.; Liu, Y.G.; Zhao, L.J.; Lü, J.J.; Yang, J. Analysis of the microphysical structure of heavy fog using a droplet spectrometer: A case study. Adv. Atmos. Sci. 2010, 27, 1259–1275. [Google Scholar] [CrossRef]
  24. Lu, C.S.; Niu, S.J.; Tang, L.L.; Lü, J.J.; Zhao, L.J.; Zhu, B. Chemical composition of fog water in Nanjing area of China and its related fog microphysics. Atmos. Res. 2010, 97, 47–69. [Google Scholar] [CrossRef]
  25. Jiang, L.L.; Wei, M. Application of fog monitoring with FY-3A data. Remote Sens. Technol. Appl. 2011, 264, 489–495. [Google Scholar]
  26. Liu, D.Y.; Wei, J.S.; Yan, W.L.; Lü, J.; Sun, Y. Trends of Urban Haze in Jiangsu Province China over the Past 33 Years. Environ. Sci. 2014, 35, 3247–3255. [Google Scholar]
  27. Wang, L.P.; Chen, S.Y.; Dong, A.X. The distribution and seasonal variations of fog in China. Acta Geogr. Sin. 2005, 60, 134–139. [Google Scholar]
  28. Li, Z.H.; Huang, J.P.; Huang, Y.S.; Yang, Z.Y.; Wang, Q. Study on the physical process of winter valley fog in Xishuangbanna Region. Acta Meteorol. Sin. 1999, 13, 494–508. [Google Scholar]
  29. Tang, H.H.; Fan, S.J.; Wu, D.; Deng, X.J. Research of the microphysical structure and evolution of dense fog over Nanling Mountain area. Acta Sci. Nat. Univ. Sunyatseni 2002, 41, 92–96. [Google Scholar]
  30. Wu, D.; Deng, X.J.; Ye, Y.X.; Mao, W.K. The study of fog-water chemical composition in Dayaoshan of Nanling Mountain. Acta Meteorol. Sin. 2004, 62, 476–485. [Google Scholar]
  31. Niu, S.J.; Lu, C.S.; Lü, J.J.; Xu, F.; Zhao, L.J.; Liu, D.Y.; Yue, Y.Y.; Zhou, Y.; Yu, H.Y.; Wang, T.S. Advances in fog research in China. Adv. Meteorol. Sci. Technol. 2016, 2, 1–14. [Google Scholar]
  32. Niu, S.J.; Lu, C.S.; Yu, H.Y.; Zhao, L.J.; Lü, J.J. Fog research in China: An overview. Adv. Atmos. Sci. 2010, 27, 639–662. [Google Scholar] [CrossRef]
  33. Deng, X.J.; Wu, D.; Ye, Y.X. Physical characteristics of dense fog at Nanling mountain region. J. Trop. Meteorol. 2002, 18, 227–237. [Google Scholar]
  34. Shi, Y.Q.; Deng, X.J.; Hu, Z.J.; Wu, D. Three-dimensional numerical study on dense fog over mountain area. J. Trop. Meteorol. 2006, 22, 351–359. [Google Scholar]
  35. Wu, D.; Zhao, B.; Deng, X.J.; Bi, X.Y.; Fan, S.J. A study on bad visibility over foggy section of freeway in Nanling mountainous region. Plateau Meteorol. 2007, 26, 649–654. [Google Scholar]
  36. Deng, X.J.; Wu, D.; Tang, H.H.; Fan, S.J.; Huang, H.H.; Mao, W.K.; Ye, Y.X. Analyses on boundary layer structure of a frontal heavy fog process in Nanling mountain area. Plateau Meteorol. 2007, 26, 881–889. [Google Scholar]
  37. Luo, N.; Wen, J.F.; Zhao, C.; Tang, L. Observation study on properties of cloud and fog in ice accretion areas. J. Appl. Meteorol. Sci. 2008, 19, 91–95. [Google Scholar]
  38. Hodges, D.; Pu, Z.X. The climatology, frequency, and distribution of cold season fog events in Northern Utah. Pure Appl. Geophys. 2015, 172, 1–15. [Google Scholar] [CrossRef]
  39. Gultepe, I.; Isaac, G.A.; Joe, P.; Kucera, P.A.; Theriault, J.M.; Fisico, T. Roundhouse (RND) mountain top research site: Measurements and uncertainties for winter alpine weather conditions. Pure Appl. Geophys. 2014, 171, 59–85. [Google Scholar] [CrossRef]
  40. Rauber, R.M.; Olthoff, L.S.; Ramamurthy, M.K.; Kunkel, K.E. The relative importance of warm rain and melting processes in freezing precipitation events. J. Appl. Meteor. 2000, 39, 1185–1195. [Google Scholar] [CrossRef]
  41. Rasmussen, R.M.; Geresdi, I.; Thompson, G.; Manning, K.; Karplus, E. Freezing drizzle formation in stably stratified layer clouds: The role of radiative cooling of cloud droplets and cloud condensation and ice nuclei. J. Atmos. Sci. 2002, 59, 837–860. [Google Scholar] [CrossRef]
  42. Cortinas, J.V.; Bernstein, B.C.; Robbins, C.C.; Strapp, J.W. An analysis of freezing rain, freezing drizzle, and ice pellets across the United States and Canada. Weather Forecast. 2010, 19, 377–390. [Google Scholar] [CrossRef]
  43. Fernández, G.S.; Valero, F.; Sanchez, J.L.; Gascón, E.; López, L.; Garcia, O.E.; Merino, A. Observation of a freezing drizzle episode: A case study. Atmos. Res. 2014, 149, 244–254. [Google Scholar] [CrossRef]
  44. Li, H.Y.; Hu, Z.X.; Wei, X. Analysis of meteorological elements in rain/snow-mixed fogs. Chin. J. Atmos. Sci. 2010, 34, 843–852. [Google Scholar]
  45. Geresdi, I.; Rasmussen, R.; Grabowski, W.; Bernstein, B. Sensitivity of freezing drizzle formation in stably stratified clouds to ice processes. Meteorol. Atmos. Phys. 2005, 88, 91–105. [Google Scholar] [CrossRef]
  46. Niu, S.J.; Zhou, Y.; Jia, R.; Yang, J.; Lü, J.J.; Ke, Y.M.; Yang, Z.B. The microphysics of ice accretion on wires: Observations and simulations. Sci. China Earth Sci. 2012, 55, 428–437. [Google Scholar] [CrossRef]
  47. Yue, Y.Y.; Niu, S.J.; Zhao, L.J.; Zhang, Y.; Xu, F. Chemical composition of sea fog water along the South China Sea. Pure Appl. Geophys. 2012, 169, 2231–2249. [Google Scholar] [CrossRef]
  48. Niu, S.J.; Jia, X.C.; Sang, J.R.; Liu, X.L.; Lu, C.S.; Liu, Y.G. Distributions of raindrop sizes and fall velocities in a semiarid plateau climate: Convective versus stratiform rains. J. Appl. Meteorol. Climatol. 2010, 49, 632–645. [Google Scholar] [CrossRef]
  49. Jones, K.F. A simple model for freezing rain ice loads. Atmos. Res. 1998, 46, 87–97. [Google Scholar] [CrossRef]
  50. Gultepe, I.; Tardif, R.; Michaelides, S.C.; Cermak, J.; Bott, A.; Bendix, J.; Müller, M.D.; Pagowski, M.; Hansen, B.; Ellrod, G.; et al. Fog research: A review of past achievements and future perspectives. Pure Appl. Geophys. 2007, 164, 1121–1159. [Google Scholar] [CrossRef]
  51. Sheng, P.X.; Mao, J.T.; Li, J.G.; Zhang, A.C.; Sang, J.G.; Pan, N.X. Atmospheric Physics; Peking University Press: Beijing, China, 2003; pp. 336–342. [Google Scholar]
  52. Lin, C.L.; Lee, S.C. Collision efficiency of water drops in the atmosphere. J. Atmos. Sci. 1975, 32, 1412–1418. [Google Scholar] [CrossRef]
  53. Gu, Z.C. Recent investigations in the theory of the formation of the cloud-drop spectra. Acta. Meteorol. Sin. 1962, 32, 267–284. [Google Scholar]
  54. Lu, C.S. Investigation of Main Macro and Micro Physical Processes in Fogs and Low-Level Clouds. Ph.D. Thesis, Nanjing University of Information Science and Technology, Nanjing, China, 2012; pp. 1–5. [Google Scholar]
  55. Liu, Y.G. The application of skewness and kurtosis to the studies on particle distribution. Meteorol. Mon. 1991, 17, 9–14. [Google Scholar]
  56. Liu, Y.G.; Chen, W.K.; Liu, G.Z. Investigation of aerosol particle size spectra-a simple statistical method. Acta Sci. Circumstantiae 1993, 13, 22–30. [Google Scholar]
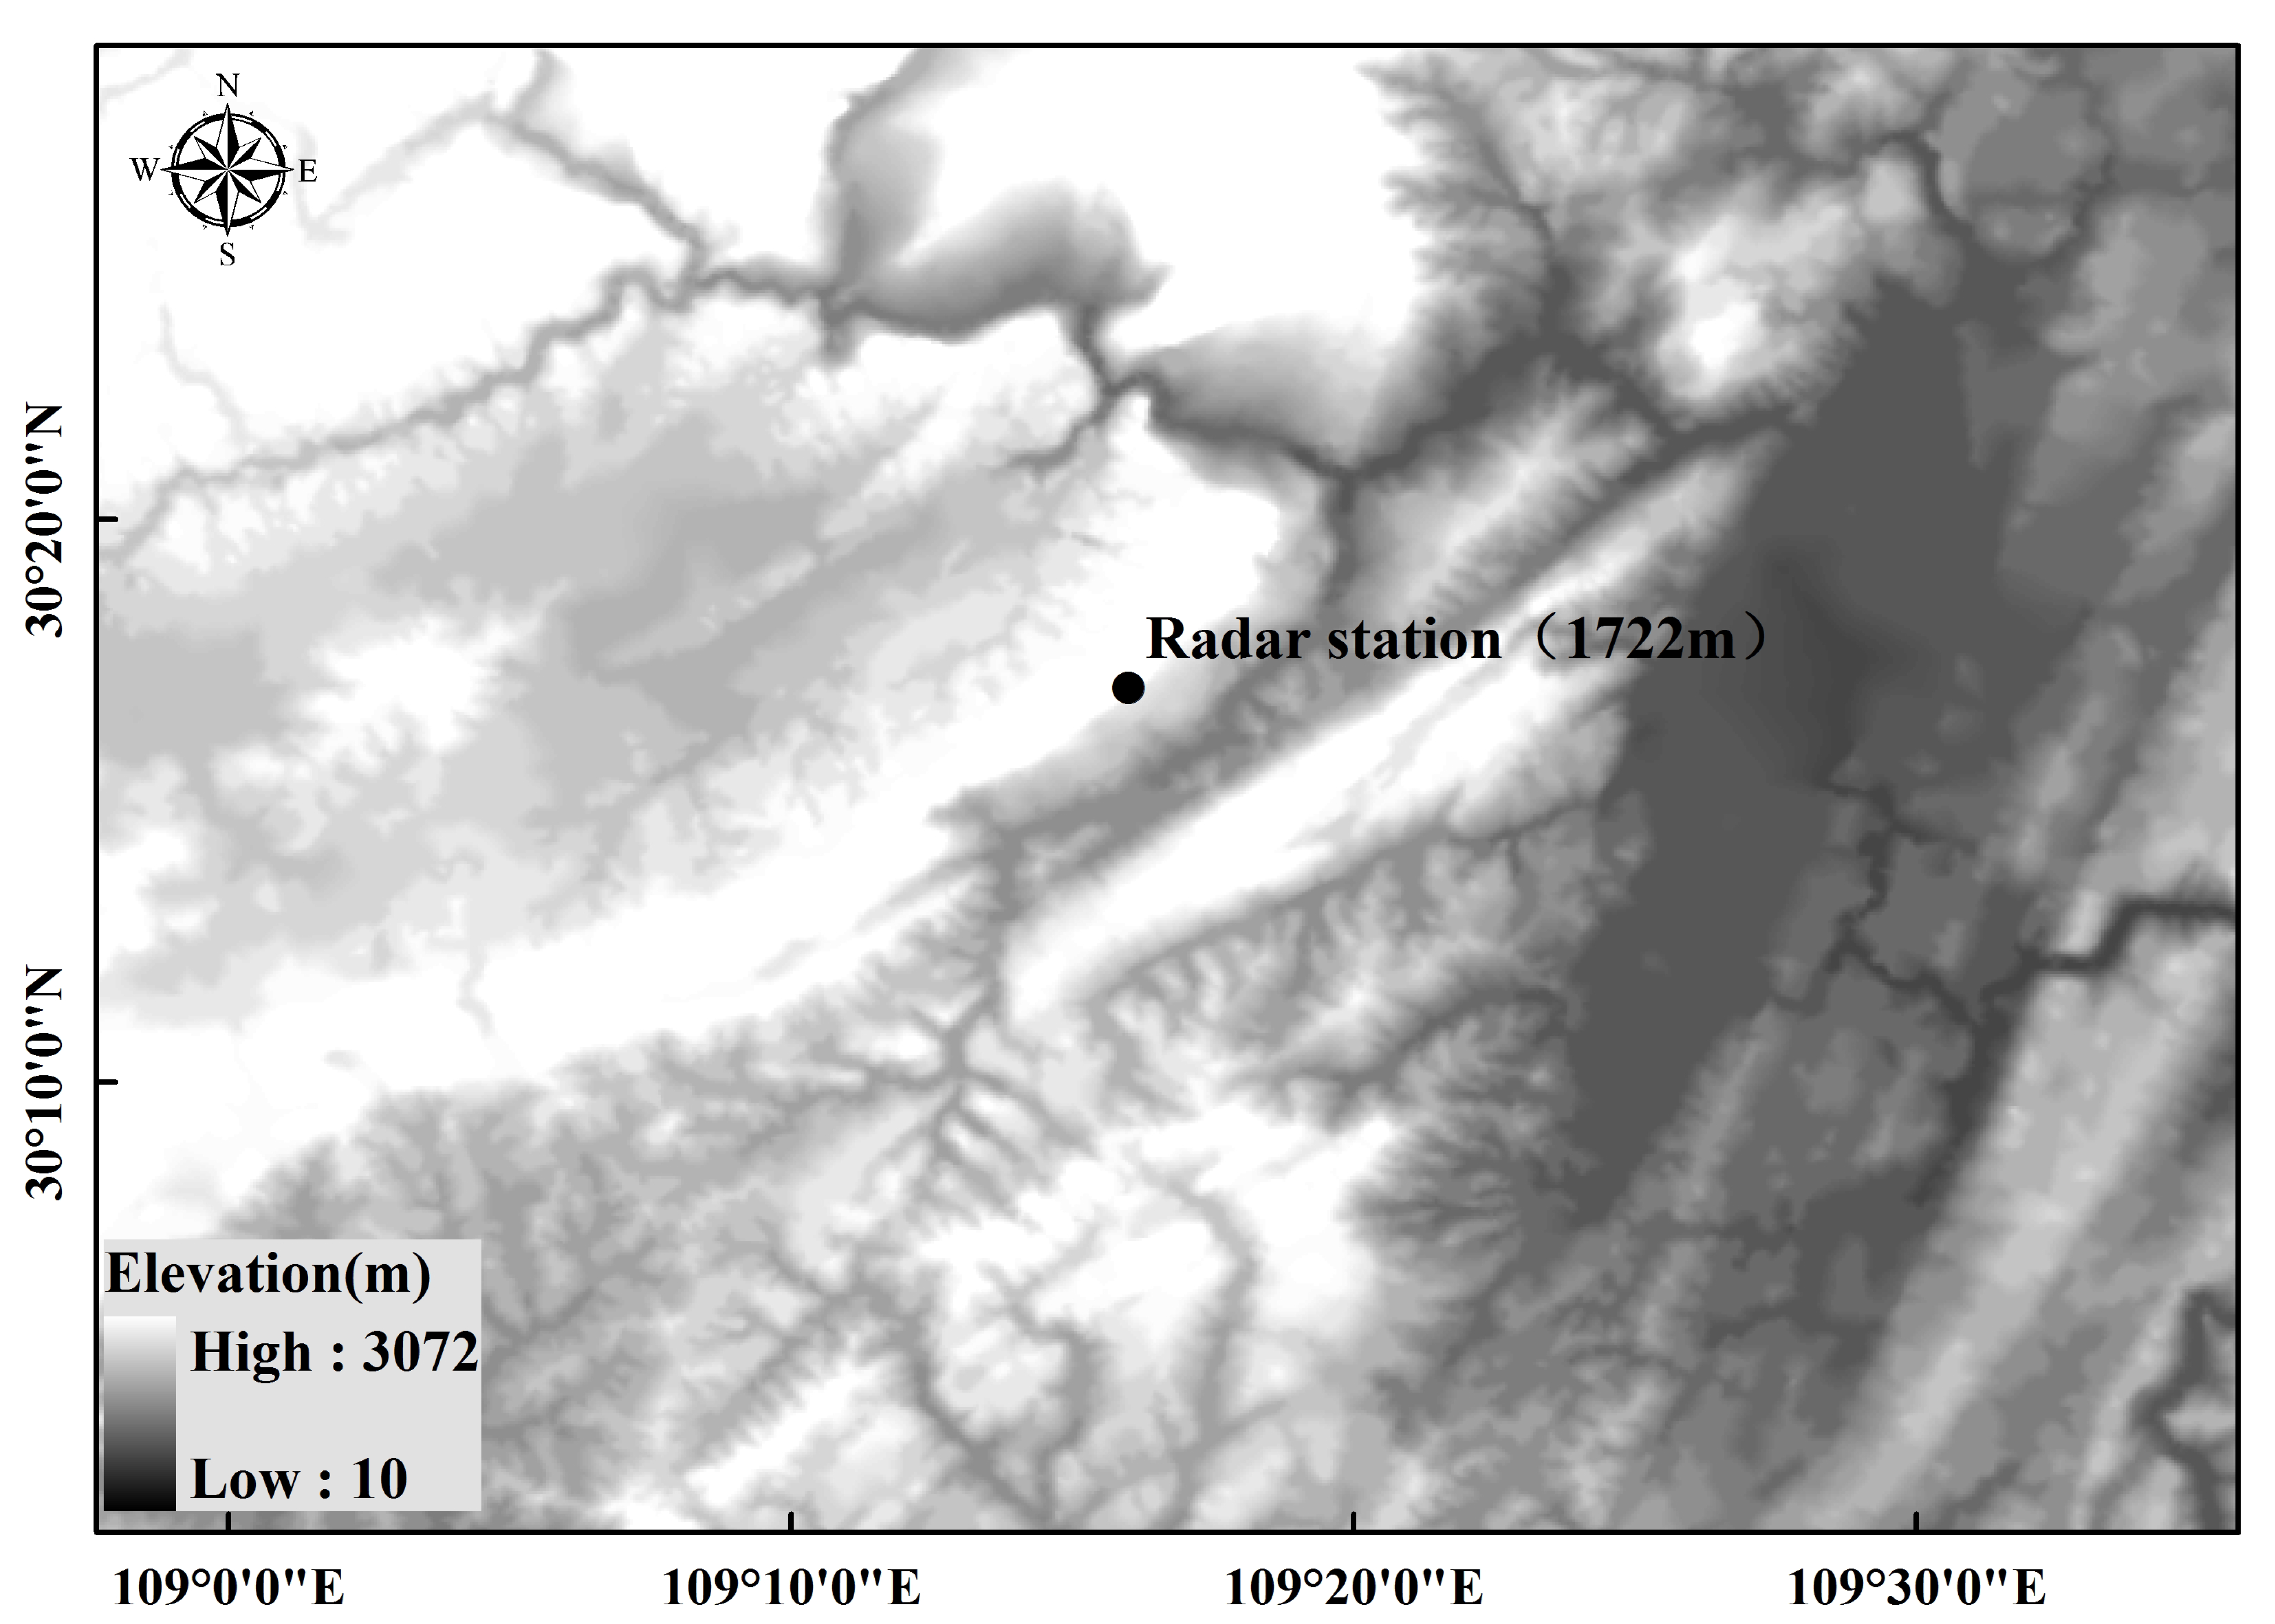
Figure 1. Map of the observation site.
Atmosphere 07 00143 g001
Figure 2. Temporal evolution of visibility, temperature, and occurrence time of rain, sleet, and snow in two winter observations in (a) 2009; and (b) 2010.
Atmosphere 07 00143 g002
Figure 3. Temporal evolutions and correlation coefficients (in parentheses) of average number concentrations of fog droplets in three categories with similar variation trends. (a) Case1; (b) case2; (c) case3; (d) case4; (e) case5; (f) case6; (g) case7; (h) case8; (i) case9; (j) case10; (k) case11; (l) case12; (m) case13; (n) case14.
Atmosphere 07 00143 g003
Figure 4. Temporal evolution of fog spectra based on one-hour-average data in cases 1–14 and one hour before/after. (a) Case1; (b) case2; (c) case3; (d) case4; (e) case5; (f) case6; (g) case7; (h) case8; (i) case9; (j) case10; (k) case11; (l) case12; (m) case13; (n) case14.
Atmosphere 07 00143 g004
Figure 5. The scatterplot of K and S calculated from the 1-min average data and the corresponding fitting curves during the no-precipitation (one hour before and after precipitation), freezing drizzle, and sleet/snow periods. (a) Kurtosis (K) as a function of diameter (D); (b) skewness (S) as a function of D.
Atmosphere 07 00143 g005
Figure 6. Relationships among N, r, and L under the effects of freezing drizzle, sleet, and snow during the development, maturity, dissipation, and oscillation periods of fog. (a) Liquid water content (L) as a function of number concentration (N); (b) radius (r) as a function of N; (c) r as a function of L during the freezing drizzle event in development period of fog; (d) L as a function of N; (e) r as a function of N; (f) r as a function of L during the sleet event in oscillation period of fog; (g) L as a function of N; (h) r as a function of N; (i) r as a function of L during the snow event in dissipation period of fog; (j) L as a function of N; (k) r as a function of N; (l) r as a function of L during the freezing drizzle event in dissipation period of fog; (m) L as a function of N; (n) r as a function of N; (o) r as a function of L during the freezing drizzle event in oscillation period of fog; (p) L as a function of N; (q) r as a function of N; (r) r as a function of L during the freezing drizzle event in maturity period of fog.
Atmosphere 07 00143 g006
Table 1. The characteristics of precipitation and key microphysical properties of freezing fog in 14 cases.
EventTimePrecipitation TypeDuration (min)R (mm·h−1)Nfog (cm−3)Lfog (g·m−3)Dfog (μm)Period
case115 February 2009 16:25–18:30freezing drizzle1250.47257.690.113.85development
case217 February 2009 01:00–02:35freezing drizzle950.09289.100.154.47maturity
case317 February 2009 12:30–13:35freezing drizzle650.23151.530.175.40maturity
case418 February 2009 20:00–21:10sleet704.1686.750.074.78oscillation
case51 March 2009 00:10–01:35snow851.33305.450.083.31dissipation
case61 March 2009 04:00–06:20sleet1403.32161.580.042.88dissipation
case72 March 2009 09:50–11:00freezing drizzle700.09254.810.042.32dissipation
case83 March 2009 06:15–11:20freezing drizzle3050.36129.250.093.93oscillation
case93 March 2009 14:00–15:15freezing drizzle750.09120.660.042.85oscillation
case109 January 2010 23:50–10 January 03:05freezing drizzle1950.12187.120.134.65maturity
case1110 January 2010 13:50–17:10freezing drizzle2000.17123.830.063.73dissipation
case1210 January 2010 23:50–11 January 01:20freezing drizzle900.20223.640.021.91oscillation
case1321 January 2010 23:00–22 January 03:00freezing drizzle2400.08213.750.134.56maturity
case1422 January 2010 08:45–10:30freezing drizzle1050.18359.240.103.30maturity