Article

A Case Study of Chemical Characteristics of Daytime and Nighttime Ambient Particles in Shanghai, China

1
Key Laboratory of Aerosol Chemistry & Physics, Institute of Earth Environment, Chinese Academy of Sciences, Xi'an 710061, Shanxi, China
2
State Key Laboratory of Loess and Quaternary Geology (SKLLQG), Institute of Earth Environment, Chinese Academy of Sciences, Xi'an 710061, China
3
Institute of Global Environmental Change, Xi'an Jiaotong University, Xi'an 710061, Shanxi, China
4
Department of Environmental Science and Engineering, Xi'an Jiaotong University, Xi'an 710049, China
5
Key Scientific Research Base of Ancient Polychrome Pottery Conservation, State Administration of Cultural Heritage (SACH), Emperor Qin Shihuang's Mausoleum Site Museum, Xi'an 710600, China
6
School of Tropical Eco-environment Protection, Qiongzhou University, Sanya 722000, China
*
Authors to whom correspondence should be addressed.
Atmosphere 2015, 6(8), 1141-1153; https://doi.org/10.3390/atmos6081141
Submission received: 20 June 2015 / Accepted: 4 August 2015 / Published: 7 August 2015
(This article belongs to the Special Issue Sources, Formation and Impacts of Secondary Aerosol)

Abstract

:
Ambient daytime and nighttime PM2.5 (particulate matter with aerodynamic diameter less than 2.5 μm) and TSP (the total suspended particulates) samples were collected at two sites (named Pudong and Jinshan) in Shanghai. The concentrations of PM2.5 and TSP were lower at Pudong than at Jinshan. Higher PM2.5 and TSP concentrations were observed during daytime than nighttime for both sites. Carbonaceous aerosol and secondary sulfate were the most abundant components. Larger enrichment factor (EFs) of Zn, Pb, Cl, and S for Jinshan nighttime were observed than for other sampling periods. PM2.5 showed higher relative spatial uniformity (the coefficients of divergence, COD = 0.18) than TSP (COD = 0.23) during the sampling period. The variations of chemical components and the species ratios showed that the contributions of primary particulate emissions in Jinshan (industrial zone) were more significant than in Pudong (residential zone).

1. Introduction

Atmospheric PM2.5 (particulate matter with aerodynamic diameter less than 2.5 μm) and TSP (the total suspended particulates) have been found to be associated with air pollution and human health [1,2,3,4,5]. Previous studies reported that carbonaceous matter and water soluble ions are the major components of atmospheric particulate matter in many urban areas [6,7,8,9,10]. Attributing to the urbanization of China with rapid industrial development, the identification and quantification of the aerosol components are needed to determine the severity of urban air pollution, and to develop strategies for urban air quality improvement.
Shanghai is an industrial base with China’s largest petrochemical complex and other major industries. Rapid economic growth and urbanization have sharply increased fossil fuel consumption, which can contribute to air pollution [2]. Previous studies have revealed that organic matter and sulfate are the most abundant components and which exist distinctly in fine and coarse modes in Shanghai. However, most of these studies were based on filter sampling with low time-resolution [11,12]. The data was scarce in particle size distributions of chemical composition both during the daytime and nighttime for various urban functional zones. In order to understand the aerosol chemistry in depth in Shanghai, a sampling campaign was deployed simultaneously at two urban sites (Pudong and Jinshan).
Here, we presented the data of the mass and chemical components of PM2.5 and TSP for daytime and nighttime. The objective of this study is to provide the distributions and relationships of PM2.5 and TSP as well as the major components for different urban zones in Shanghai.

2. Experimental Section

2.1. Sample Collection

Shanghai represents a typical urban environment in eastern China (Figure 1). PM2.5 were collected on quartz and teflon filters simultaneously by using four mini-Volume samplers, and TSP were collected on quartz filters by two mini-Volume samplers with the flow rate of 5 L·min−1 at Pudong (residential zone) and Jinshan (industrial zone) from 1 to 20 September 2009, respectively. Aerosol sampling was carried out over a period of 20 days, daytime samples were collected from 8:00 to 20:00 (local time) and those for nighttime samples were from 20:00 to 8:00. The meteorological data was also collected during the sampling period. All quartz filters were pre-heated at 900 °C for 3 h and then stored in aluminum foil before sampling. The quartz and teflon filters were stored in a refrigerator after sampling.
Filters were analyzed gravimetrically for PM2.5 and TSP mass concentrations on a Sartorius MC5 electronic micro balance with ±1 µg sensitivity (Sartorius, Göttingen, Germany) after 24 h equilibration at temperatures between 20 °C and 23 °C and RH between 35% and 45%. Each filter was weighed at least three times before and after samplings, and the net mass was obtained by subtracting the difference between the averaged pre- and post-sampling weights. The precision of mass measurement before and after sampling based on replicate weighting is 15 and 20 µg per filter, respectively.
Figure 1. Location of the sampling sites in Shanghai (PD: Pudong, JS: Jinshan).
Atmosphere 06 01141 g001

2.2. Carbonaceous Aerosol Measurement

All the PM2.5 and TSP quartz filters were analyzed for carbon fractions using a DRI Model 2001 Thermal/Optical Carbon Analyzer (Atmoslytic Inc., Calabasas, CA, USA). Using a punch from the quartz filter, three elemental carbon (EC) fractions and four organic carbon (OC) fractions were analyzed following the IMPROVE-A (Interagency Monitoring of Protected Visual Environments) thermal/optical reflectance (TOR) protocol [13]. The method produced data for four OC fractions (OC1, OC2, OC3, and OC4 in a helium atmosphere at 140, 280, 480, and 580 °C, respectively), a pyrolyzed carbon fraction (OP, determined when reflected laser light attained its original intensity after oxygen was added to the combustion atmosphere), and three EC fractions (EC1, EC2, and EC3 in a 2% oxygen/98% helium atmosphere at 580, 740 °C, and 840 °C, respectively). The IMPROVE (Interagency Monitoring of Protected Visual Environments) protocol defined OC as OC1 + OC2 + OC3 + OC4 + OP and EC as EC1 + EC2 + EC3−OP. The EC fraction was also divided into char and soot. Char is defined as EC1 minus OP, and soot is defined as the sum of EC2 and EC3 [14,15]. The blank filters were also analyzed for quality control and the sample results were corrected by the average of the blank concentrations, which were 0.96 and 0.23 μg·m−3 for OC and EC, respectively. The detailed quality assurance/quality control (QA/QC) procedures are described elsewhere [16].

2.3. Ion Analyses

The concentrations of three anions (Cl, NO3 and SO42−) and five cations (Na+, NH4+, K+, Mg2+ and Ca2+) were determined in aqueous extracts of the sample filters by using a Dionex-600 Ion Chromatograph (Dionex Inc., Sunnyvale, CA, USA). Standard solution and blank test were performed before sample analysis and the result of correlation coefficient of standard samples was more than 0.999. One in 10 extracts was reanalyzed and none of the differences between these replicates exceeded precision intervals. All the reported data of water solvable ions were corrected by the filter blanks. Minimum detection limits were as follows: 0.001 µg·mL−1 for Na+, NH4+, K+, Mg2+ and Ca2+; 0.008 µg·mL−1 for Cl, 0.025 µg·mL−1 for NO3; and 0.027 µg·mL−1 for SO42−. Standard reference materials produced by the National Research Center for Certified Reference Materials (Beijing, China) were analyzed for quality control and quality assurance purposes. The experimental uncertainties were ±0.04 for NO3 and SO42−, ±0.03 for Ca2+, ±0.02 for Cl, ±0.01 for NH4+, K+ and Mg2+, and ±0.004 for Na+.

2.4. Element Analyses

An energy-dispersive X-ray fluorescence (ED-XRF) was used to determine the concentrations of the elements collected on the PM2.5 Teflon fibre filters. The characteristic X-ray radiation is detected by a germanium detector (PAN 32). A spectrum of X-ray counts versus photon energy was acquired during analysis, with the individual peak energies matching to specific elements, and peak areas corresponding to elemental concentrations [17]. In total, 15 interested elements were discussed in the paper. Minimum detection limits were as follows: 0.115 µg·cm−2 for Al, 0.007 µg·cm−2 for K and Ca, 0.011 µg·cm−2 for Fe, 0.093 µg·cm−2 for Si, 0.032 µg·cm−2 for S, 0.008 µg·cm−2 for Zn, 0.003 µg·cm−2 for Ni, 0.010 µg·cm−2 for Cu, 0.014 µg·cm−2 for Mn, 0.015 µg·cm−2 for Sr and Pb, 0.003 µg·cm−2 for Cl, 0.004 µg·cm−2 for As, and 0.005 µg·cm−2 for Ti, respectively.

3. Results and Discussion

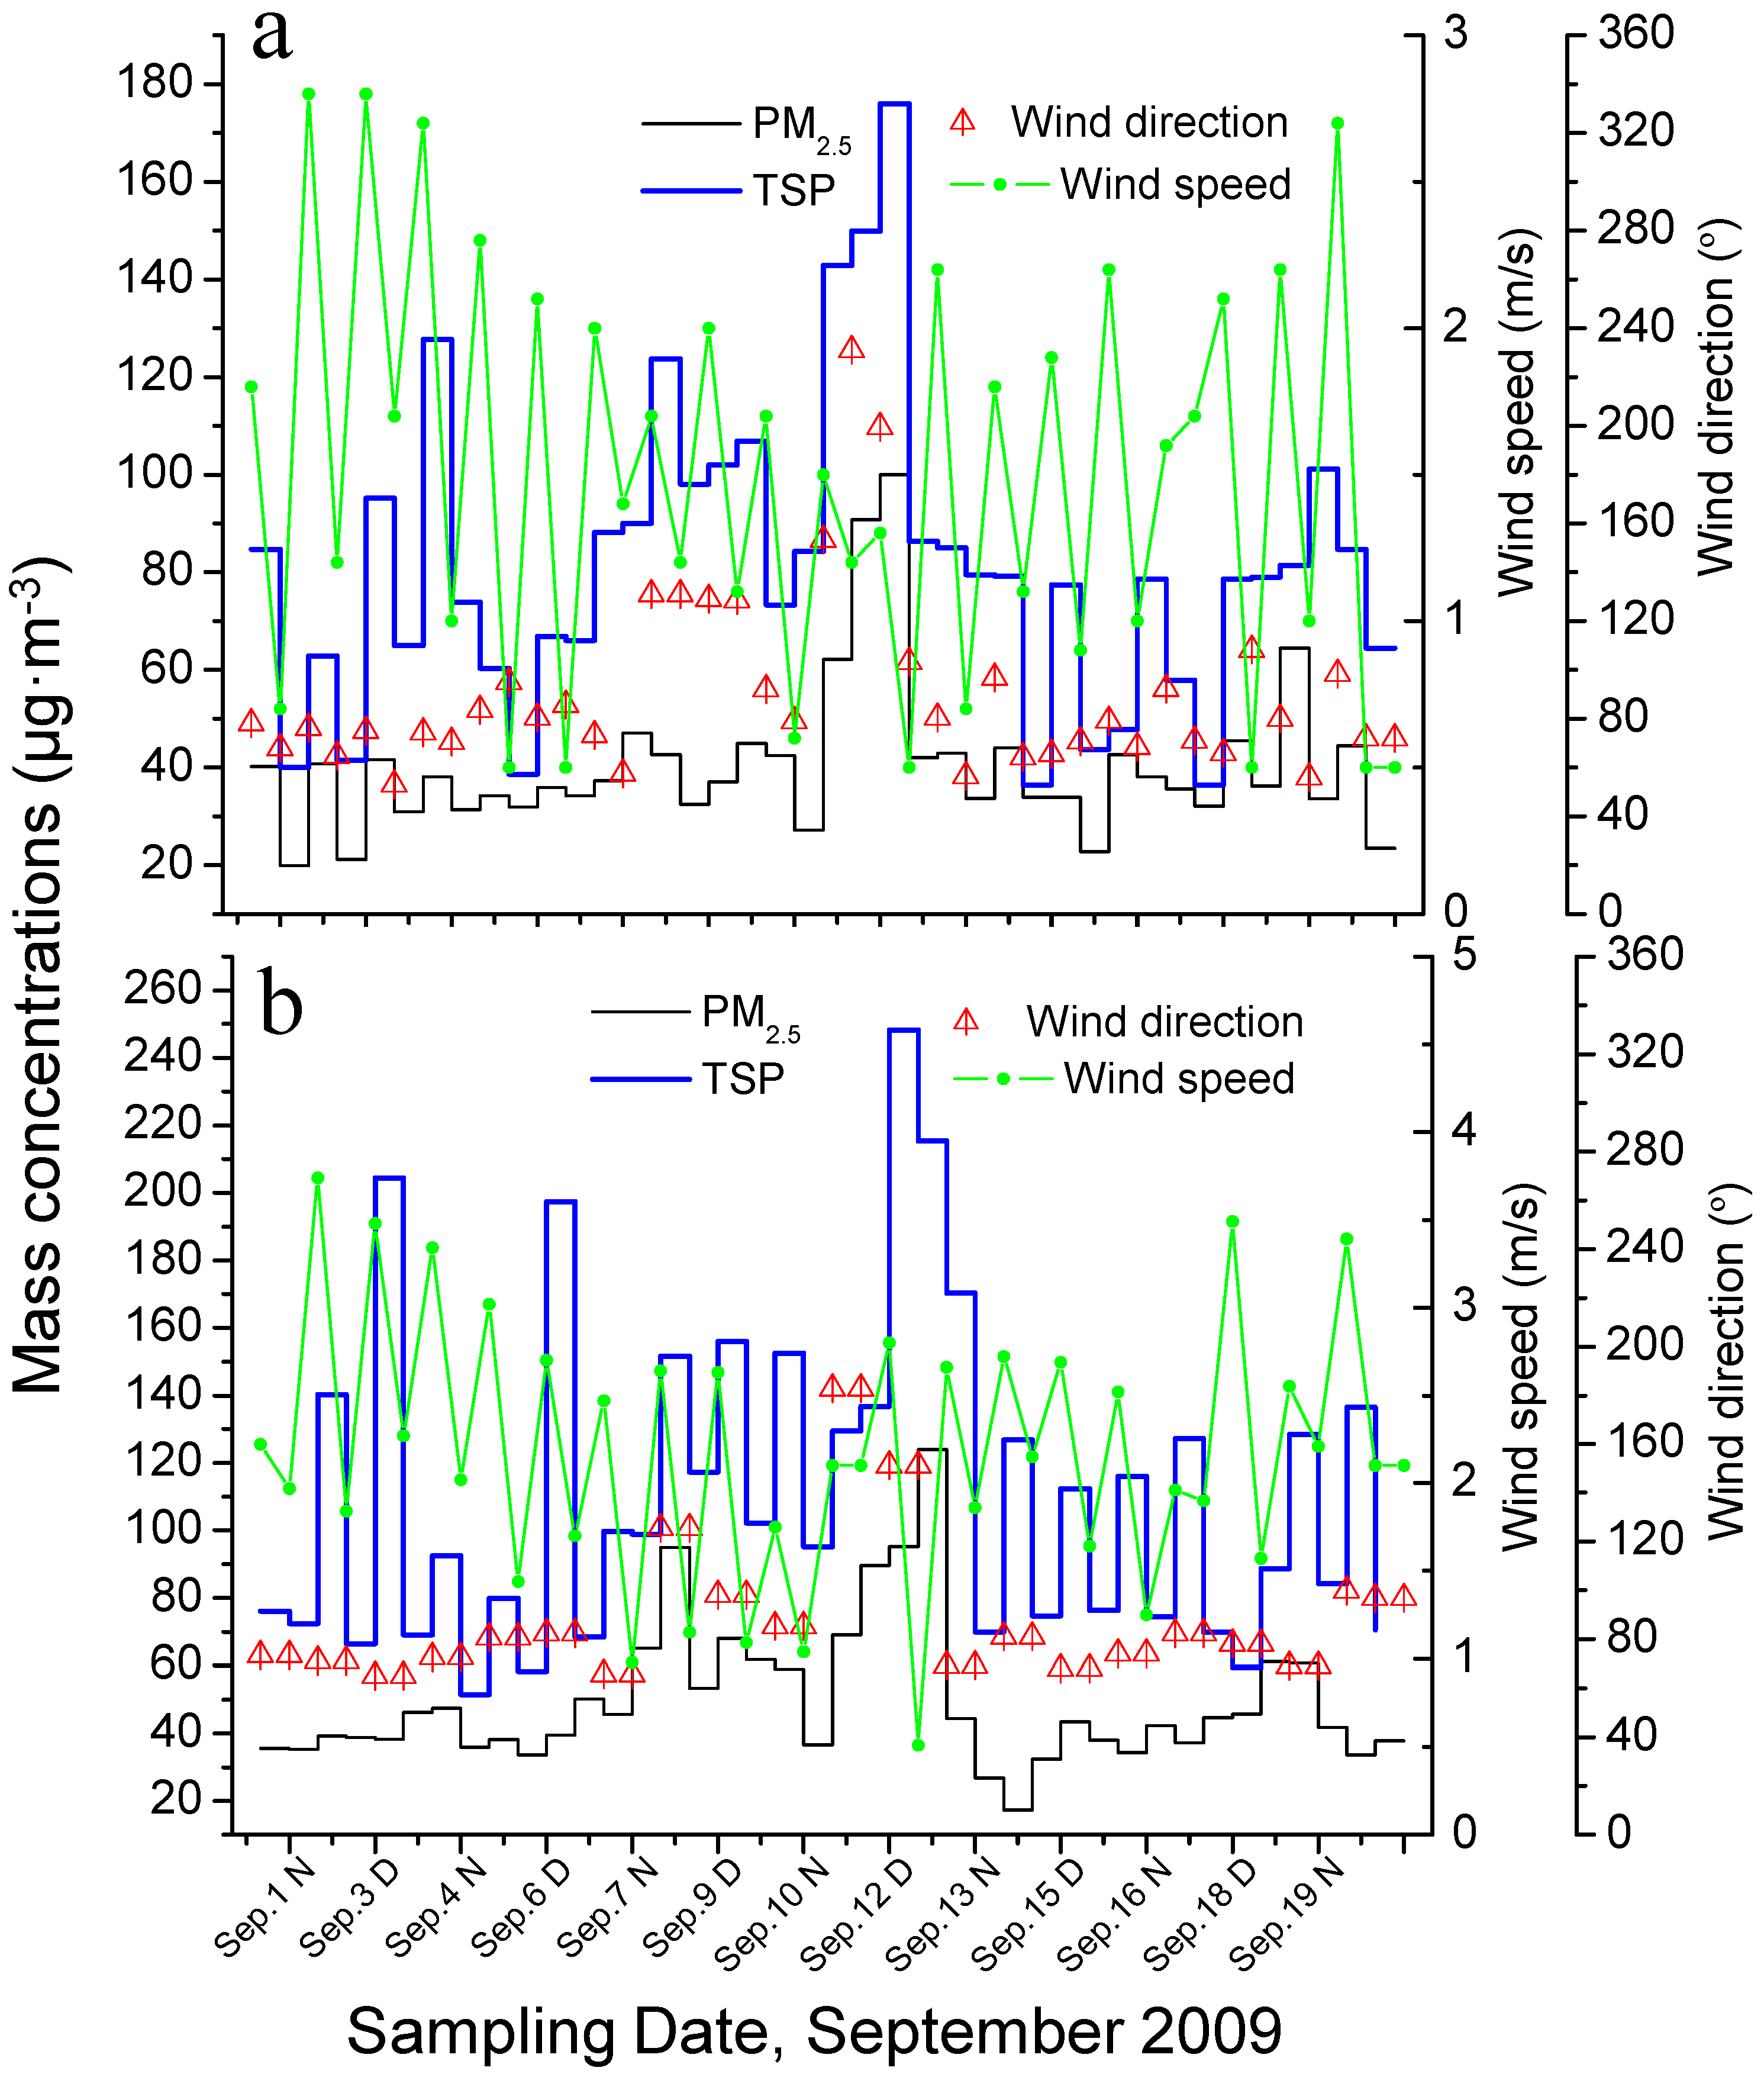
3.1. Characteristics of PM2.5 and TSP for Daytime and Nighttime

The average PM2.5 and TSP obtained during the sampling periods reached 45.3 μg·m−3 and 89.8 μg·m−3 for daytime, and those were 32.8 μg·m−3 and 67.0 μg·m−3 for nighttime at Pudong, respectively. The concentrations of PM2.5 and TSP were 49.3 μg·m−3 and 135.3 μg·m−3 in daytime, 49.8 μg·m−3 and 88.0 μg·m−3 in nighttime at Jinshan, respectively. PM2.5 experienced lowest concentrations for Pudong nighttime and highest value for Jinshan nighttime. Higher TSP concentrations were observed in daytime than nighttime for both sites. The variations of TSP showed a slight increase at Jinshan, which may be attributed to the local primary sources. The ratios of PM2.5 to TSP (~0.51 and ~0.49 for daytime and nighttime at Pudong, ~0.36 and ~0.57 for daytime and nighttime at Jinshan, respectively) were obtained at both sampling sites. The average PM2.5 concentration is much higher than the USEPA (United States Environmental Protection Agency) National Ambient Air Quality Standards (NAAQS) (15 μg·m−3), indicating very serious potential environmental and health impacts for local residents.
Variations of PM2.5 and TSP mass with wind speed and wind direction were plotted in Figure 2. High wind speeds during daytime (~2.0 and ~2.7 m·s−1 for Pudong and Jinshan, respectively) and low values during nighttime (0.98 m·s−1 and 1.62 m·s−1 for Pudong and Jinshan, respectively) were observed during the sampling periods, which was shown to be inversely related with the corresponding mass concentrations. A sharp increase of the mass was observed when the wind direction was >180°, which was consistent with the previous study [18].
Figure 2. The concentrations of PM2.5 and TSP vs the wind speed and wind direction during daytime and nighttime. (a) Pudong, (b) Jinshan.
Atmosphere 06 01141 g002
The coefficients of divergence (COD) was applied to sites within study areas as a relative measure of particulate concentration uniformity [19]. To further investigate the similarities among the sites in Shanghai, the coefficients of divergence (CODpj) between Pudong and Jinshan were calculated by using the average concentrations of PM2.5 and TSP, respectively. The COD is defined mathematically as:
COD p j = 1 m i = 1 m [ ( x i p x i j ) / ( x i p + x i j ) ] 2
where xip and xij represent the 24 h average particulate concentration for sampling day i at sampling sites Pudong and Jinshan, and m is the number of observations. A COD of zero means there are no differences between concentrations at the sites, while a value approaching one indicates maximum differences and absolute heterogeneity. Values of CODs coefficients lower than 0.2 indicates a relatively homogeneous spatial distribution [20]. In the present study, the values of the CODs calculated for the both sites are 0.18 and 0.23 for PM2.5 and TSP, respectively, suggesting that the area investigated is characterized by a relatively homogeneous distribution of PM2.5, but not for TSP during the sampling period.

3.2. Variations of OC and EC

OC and EC are the major components of aerosols that originate from natural and anthropogenic sources. Total carbon (the sum of OC and EC) contribution to urban aerosol mass ranges from 20% to 50% in both fine and coarse fractions in China [21,22,23,24]. The average concentrations of PM2.5 carbonaceous species were given in Table 1. The average OC and EC concentrations were 8.0 and 1.7 μg·m−3 for Pudong daytime and 5.7 and 1.7 μg·m−3 for Pudong nighttime, respectively. The corresponding concentrations were 14.5 and 2.3 μg·m−3 for Jinshan daytime and 19.1 and 2.9 μg·m−3 for Jinshan nighttime. Lower OC and EC concentrations were observed in Pudong than in Jinshan. Carbonaceous aerosol contribute ~30% of PM2.5 and ~23% of TSP at Pudong, respectively. The contributions were ~48% and ~31% for PM2.5 and TSP at Jinshan, respectively. The contributions of carbonaceous materials to PM2.5 were higher than those for TSP, which was consistent with the previous research [8]. The concentrations of OC and EC for daytime and nighttime at Pudong and Jinshan were comparable to previous results of Shanghai, Beijing and Guangzhou [25,26,27].
The ratios of OC to EC were 4.8 and 4.5 in daytime, 3.5 and 4.1 in nighttime for PM2.5 and TSP at Pudong, respectively. Those for Jinshan were 6.0 and 6.4 in daytime, 5.9 and 7.2 in nighttime for PM2.5 and TSP, respectively. Higher OC/EC ratio at Jinshan denoted a significant contribution of primary (from biomass burning and residue incineration) and secondary OC. The little difference for ratios of OC to EC between PM2.5 and TSP from Pudong indicated the secondary organic carbon contribution. Significant variations were observed for Jinshan nighttime, which may be attributed to primary emissions.
Table 1. The average concentrations of OC, EC for PM2.5 and TSP at Pudong and Jinshan (μg·m−3).
SizeCarbon FractionPudong DaytimePudong NighttimeJinshan DaytimeJinshan Nighttime
Ave.Max.Min.Ave.Max.Min.Ave.Max.Min.Ave.Max.Min.
PM2.5OC8.014.63.95.710.82.814.532.77.719.145.86.7
EC1.73.81.01.72.80.92.34.80.92.95.11.4
TSPOC11.619.06.19.615.04.130.655.314.637.16214
EC2.74.91.52.54.21.23.97.91.54.48.22.2

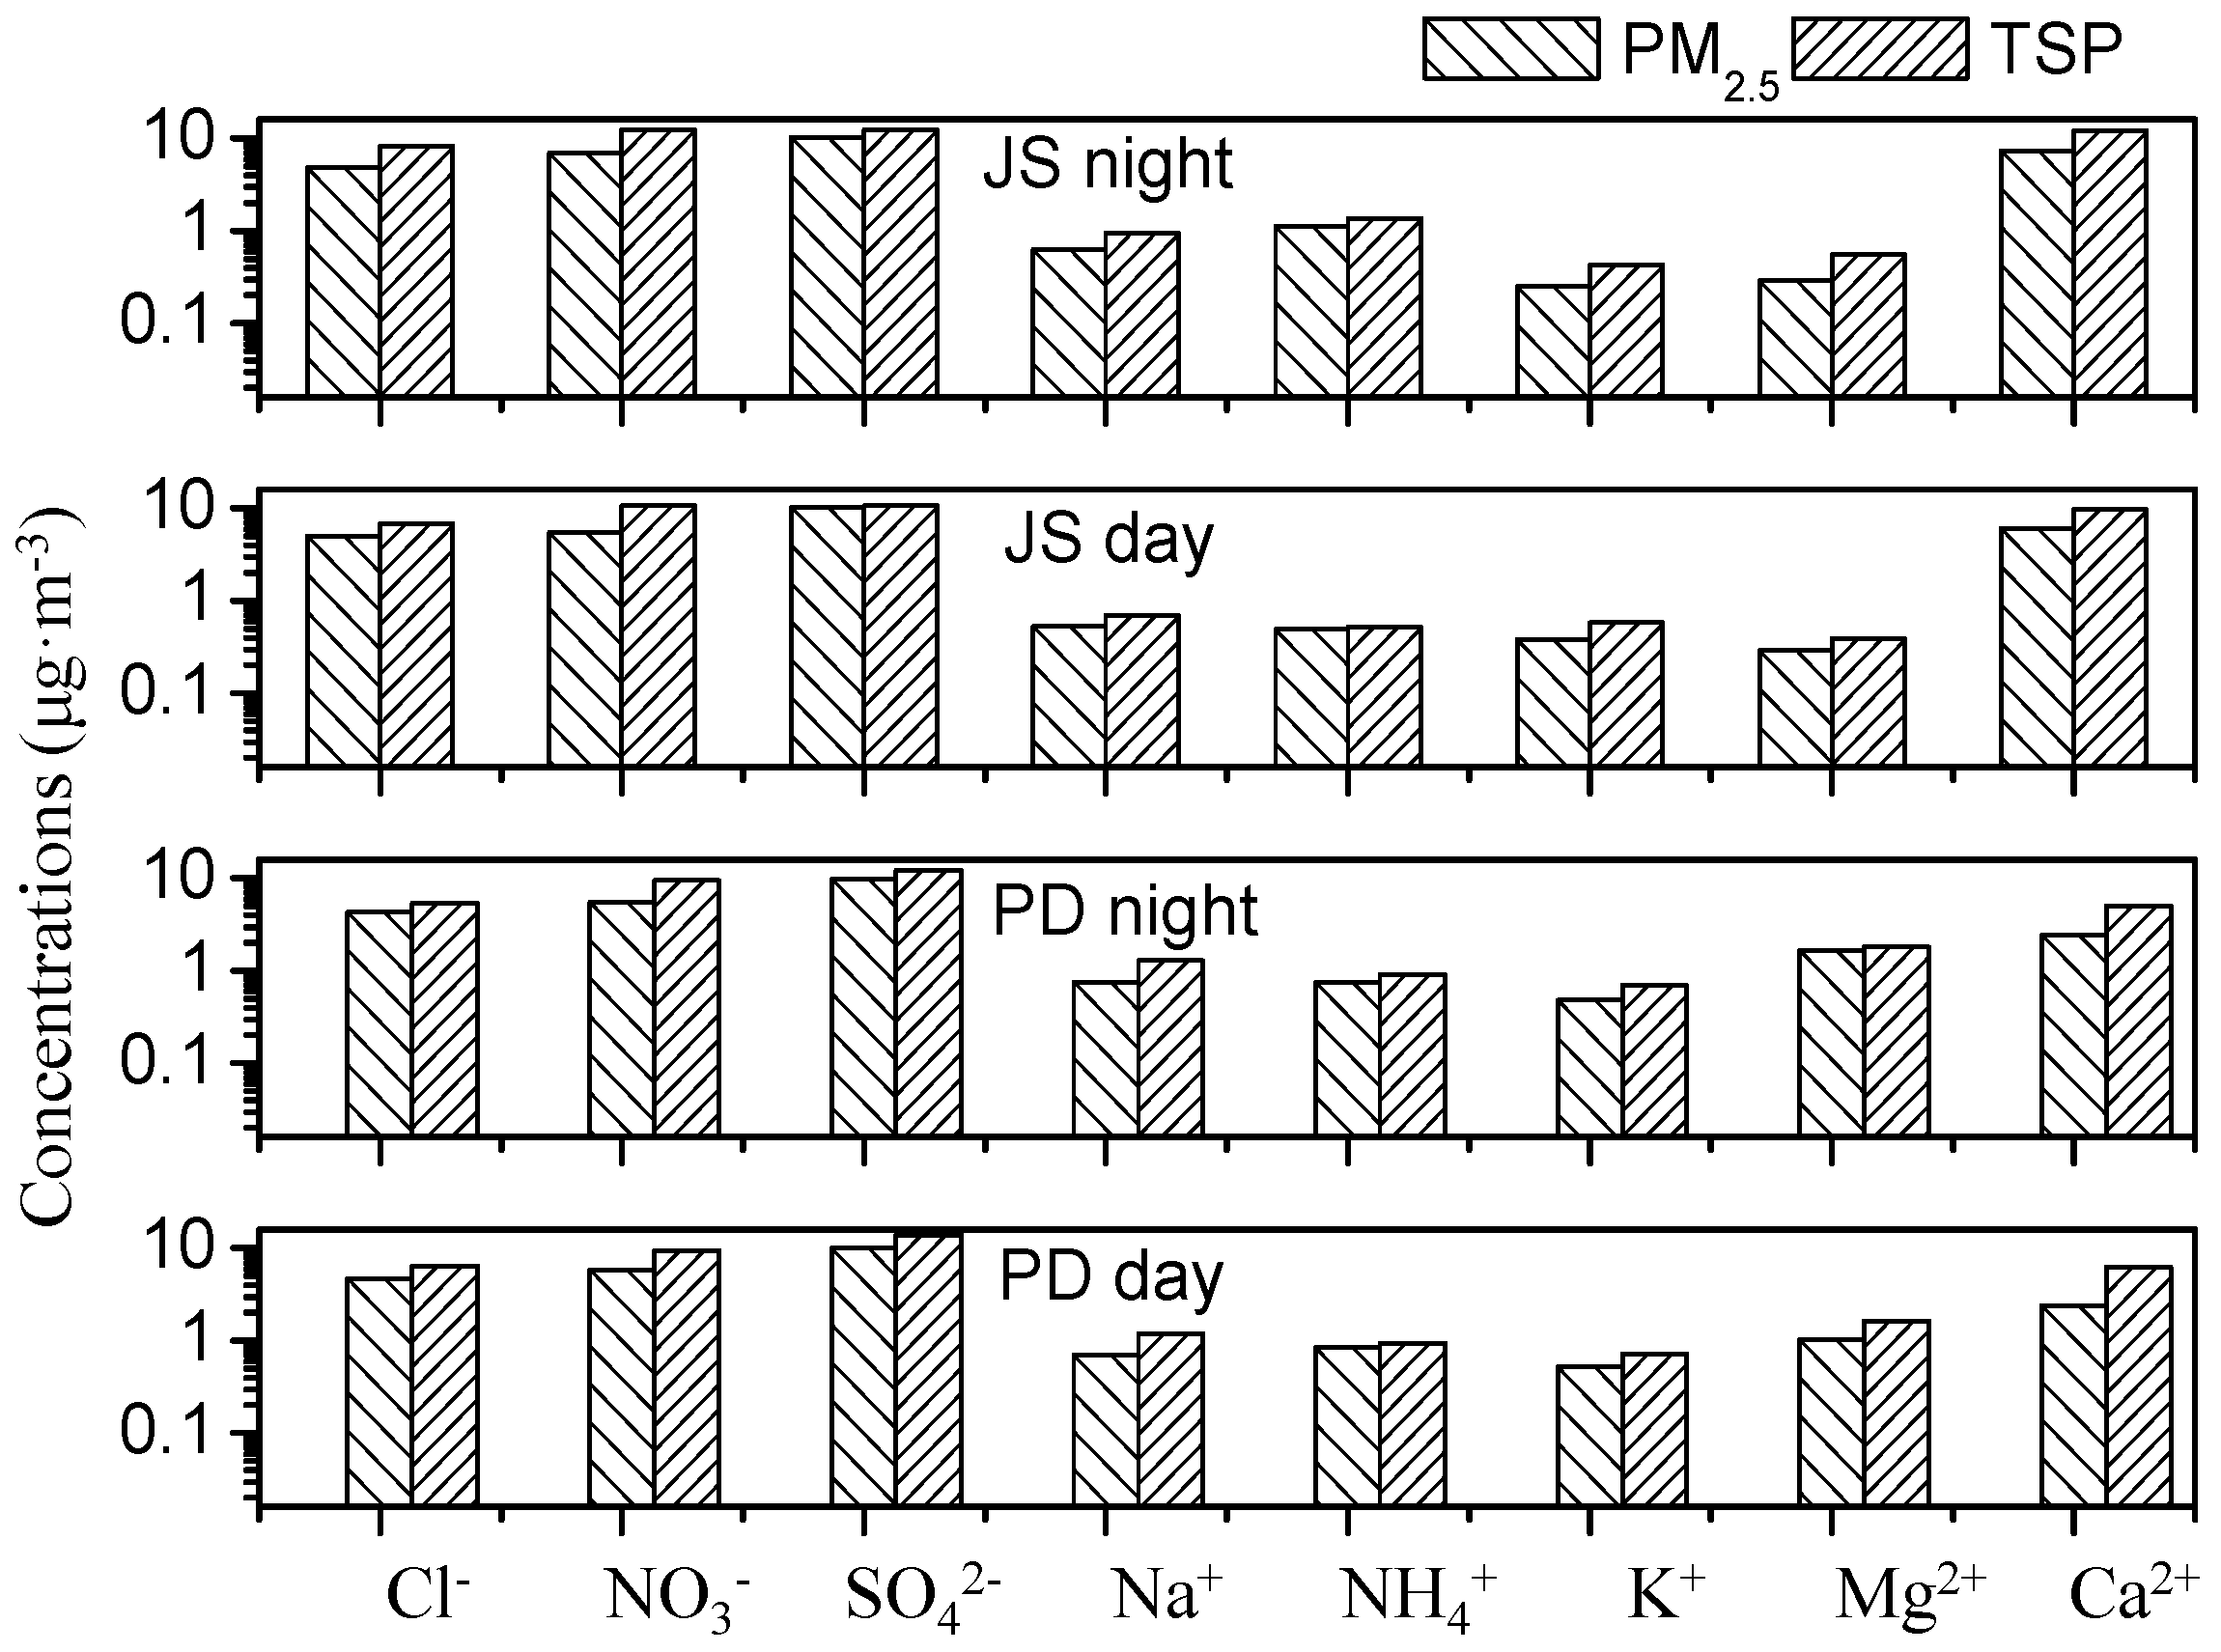
3.3. Variations of Water Soluble Ions

The average concentrations of water soluble inorganic species in PM2.5 collected during daytime and nighttime are presented in Table 2. The concentrations of SO42− (10.0 μg·m−3 for Pudong daytime, 8.6 μg·m−3 for Pudong nighttime, 10.3 μg·m−3 for Jinshan daytime and 10.2 μg·m−3 for Jinshan nighttime) showed high concentration during daytime, which may be attributed to more secondary species production. SO42− accounted for ~40% and ~36% of the total mass of inorganic ions for Pudong and Jinshan, respectively. The average NO3 concentrations were 5.8 μg·m−3 for daytime and 4.7 μg·m−3 for nighttime at Pudong, and 5.5 μg·m−3 for daytime and 6.9 μg·m–3 for nighttime at Jinshan, respectively. NO3 accounted for ~23% (Pudong daytime), ~21% (Pudong nighttime), ~20% (Jinshan daytime) and ~23% (Jinshan nighttime) of the total mass of the inorganic ions, respectively. Significant increases of NO3 and NH4+ were observed during nighttime at Jinshan.
Table 2. The concentrations of water soluble ions for PM2.5 at Pudong and Jinshan (μg·m−3).
IonsPudong DaytimePudong NighttimeJinshan DaytimeJinshan Nighttime
Ave.Max.Min.Ave.Max.Min.Ave.Max.Min.Ave.Max.Min.
Cl4.368.053.143.856.452.804.225.883.114.876.943.94
NO3-5.8215.793.494.747.782.575.5311.60n.a.6.9716.242.86
SO42-10.0323.252.358.5619.681.9010.3018.593.7310.1818.923.48
Na+0.692.35n.a.0.752.60n.a.0.531.400.150.630.900.22
NH4+0.851.91n.a.0.793.64n.a.0.491.80n.a.1.165.72n.a.
K+0.521.04n.a.0.390.79n.a.0.381.33n.a.0.270.54n.a.
Mg2+1.022.70n.a.1.333.72n.a.0.291.24n.a.0.291.04n.a.
Ca2+2.407.45n.a.1.827.87n.a.6.0818.140.135.6713.922.04
n.a.: under the method detection limit.
The concentrations of Ca2+, increased from Pudong samples (2.4 and 1.8 μg·m−3 for daytime and nighttime, respectively) to Jinshan samples (6.0 and 5.7 μg·m−3 for daytime and nighttime, respectively), which accounted for ~9% and ~20% of the total inorganic ions for Pudong and Jinshan, respectively. The concentrations of Mg2+ in PM2.5 were higher for Pudong than for Jinshan. The sea salt contribution to Na+ should not be neglected at coastal sites. In this study, the concentrations of Na+ for PM2.5 were 0.7 μg·m−3 (Pudong daytime), 0.8 μg·m−3 (Pudong nighttime), 0.5 μg·m−3 (Jinshan daytime), and 0.6 μg·m−3 (Jinshan nighttime), respectively. The concentrations of K+ were lower than other ions, and showed higher concentrations during daytime than nighttime at both sampling sites. The result is somewhat consistent with the previous study [26].
SO42− was the most abundant anion followed by secondary contribution of NO3 during daytime and nighttime for Pudong. The concentrations of Ca2+ at Jianshan were significantly higher than those of Pudong, which may be attributed to the emission of local construction activities and soil dust at Jinshan. The concentrations of ions (except Na+ and Mg2+) are higher during daytime than nighttime at Pudong, while those for Jinshan were SO42−, K+ and Ca2+. The result of ionic balance showed an anion deficit in the present study, which may indicate the presence of calcium carbonates combined with the large concentrations of Ca2+ [28].
The much distinct contents of ions in PM2.5 and TSP were Ca2+ and NO3. It was noteworthy that Ca2+ abundances in TSP increased by twice or more than that of PM2.5 (Figure 3), which may be explained as a consequence of the lifting of dust due to municipal engineering. Enhanced Cl and Mg2+ concentrations in TSP were also found in the present study. Na+ and Cl existed in both TSP and PM2.5, which suggested that sea salt aerosols and anthropogenic emissions were factors to affect the distributions. The variations of NO3 and SO42− in both sizes seem to indicate that NO3 was more abundant in coarse fraction than SO42−.
Figure 3. The major ions concentrations in daytime and nighttime for PM2.5 and TSP at Jinshan (JS) and Pudong (PD).
Atmosphere 06 01141 g003

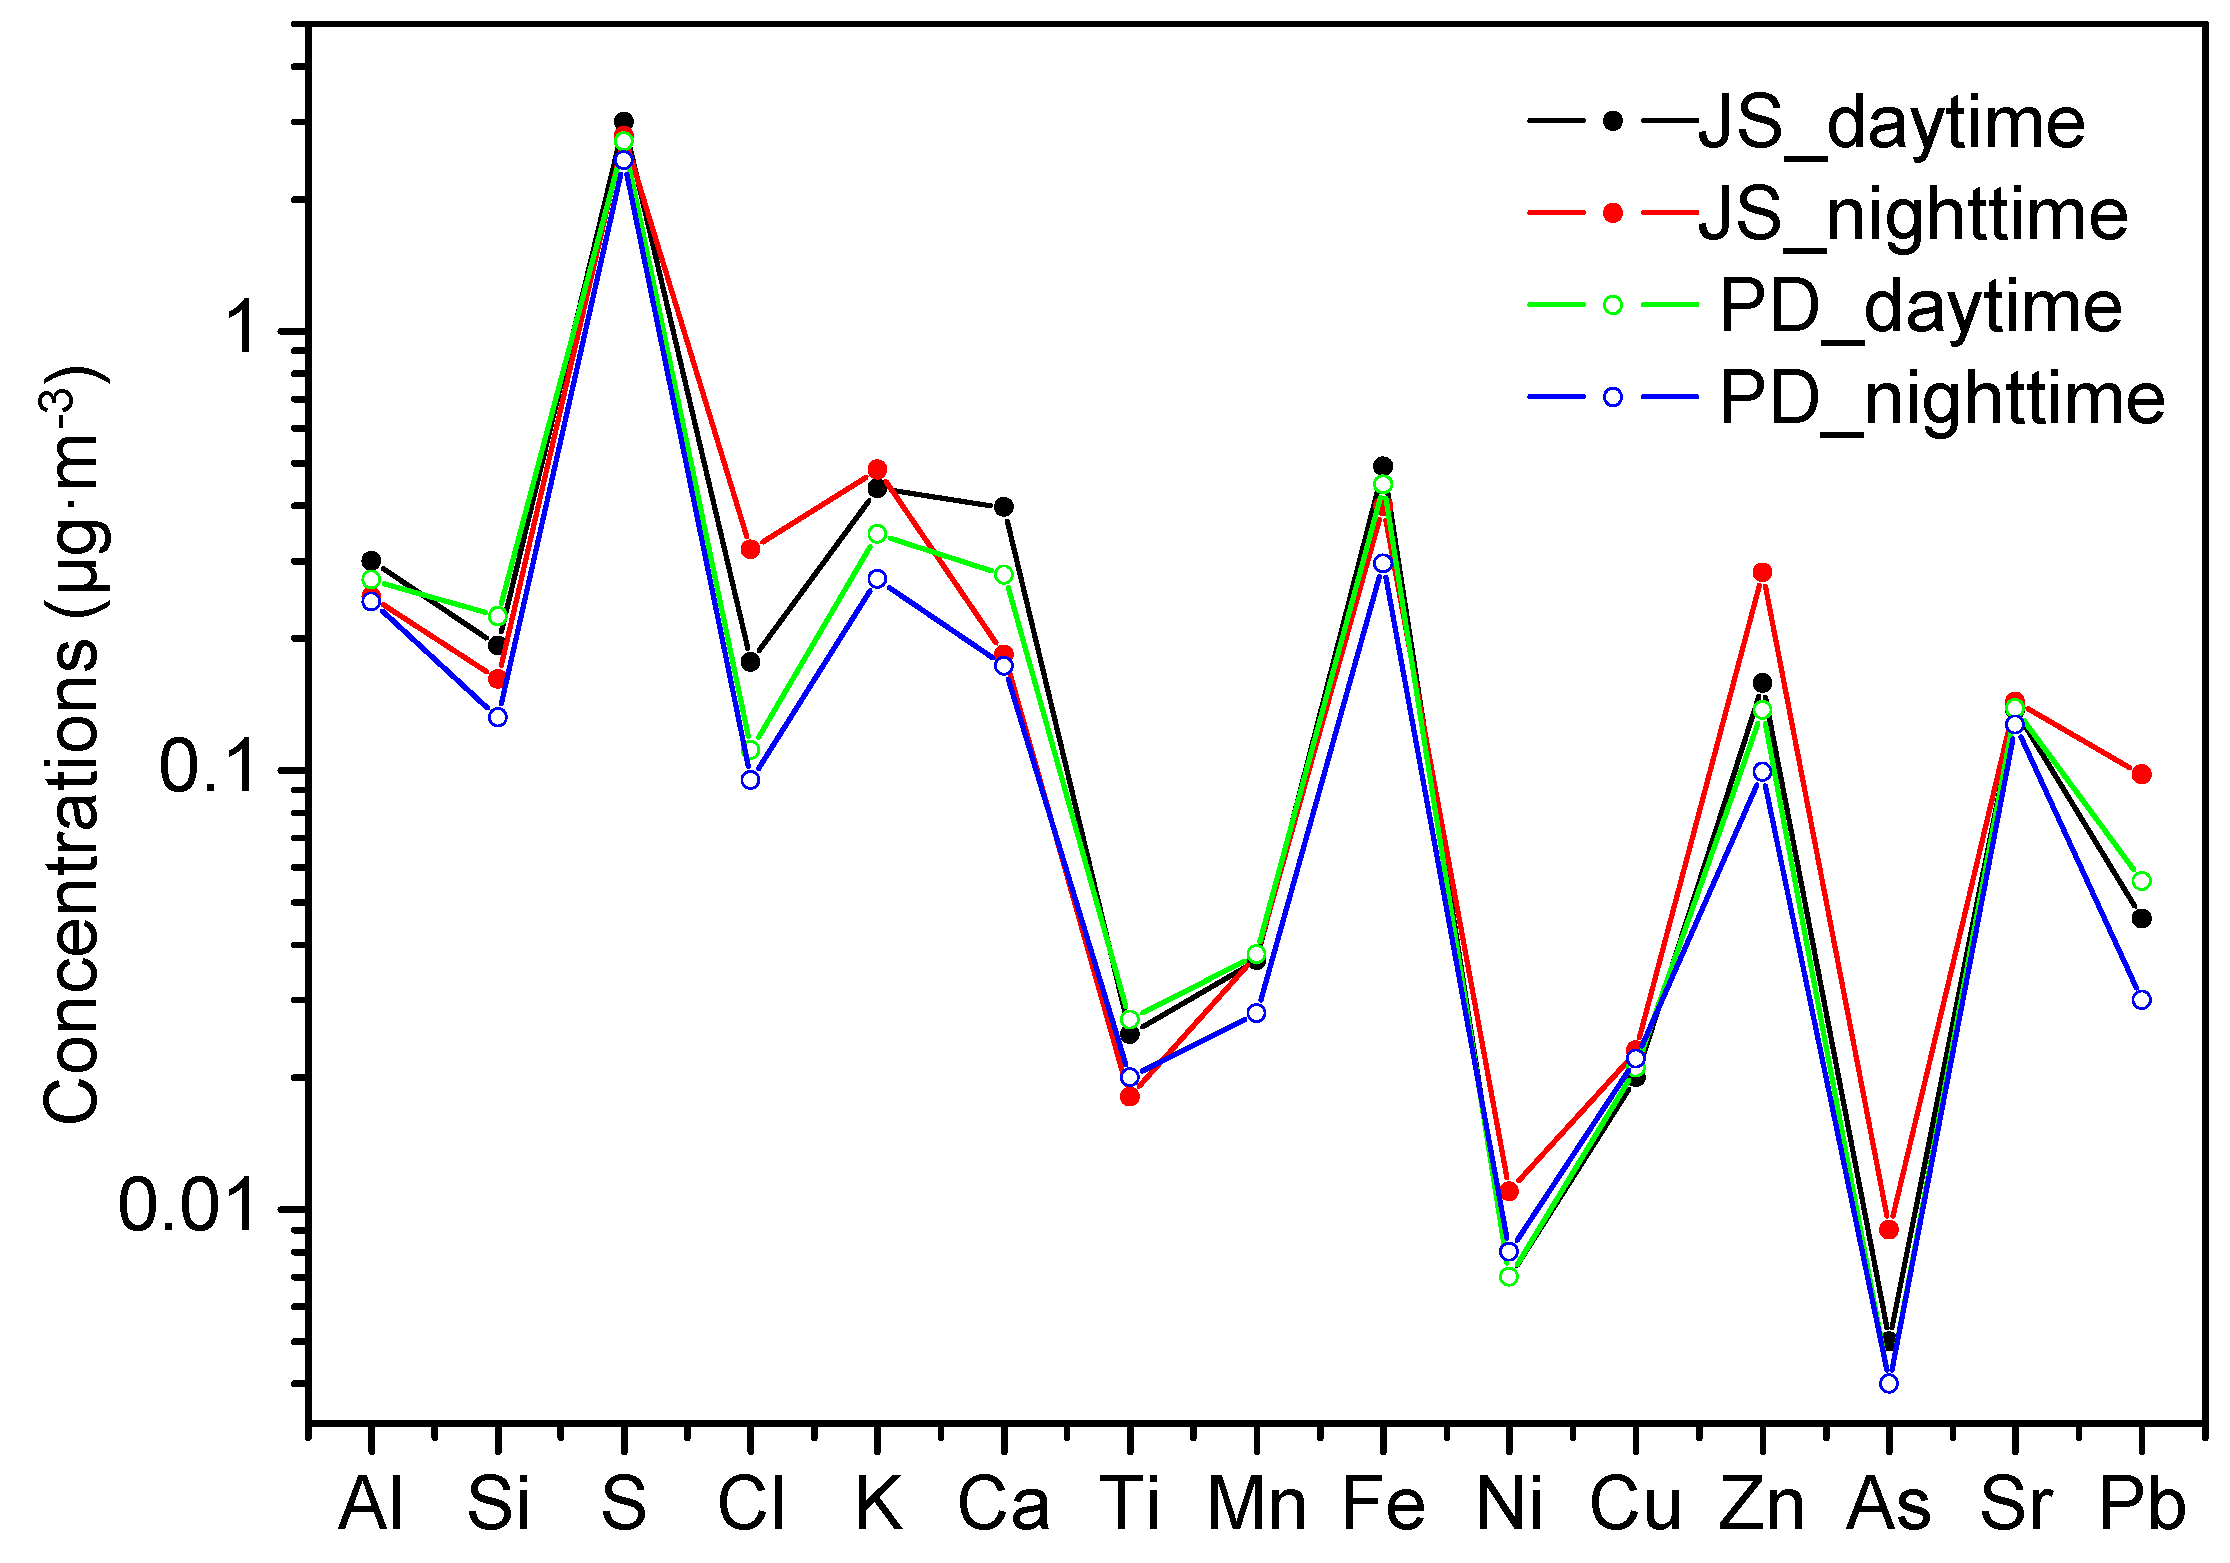
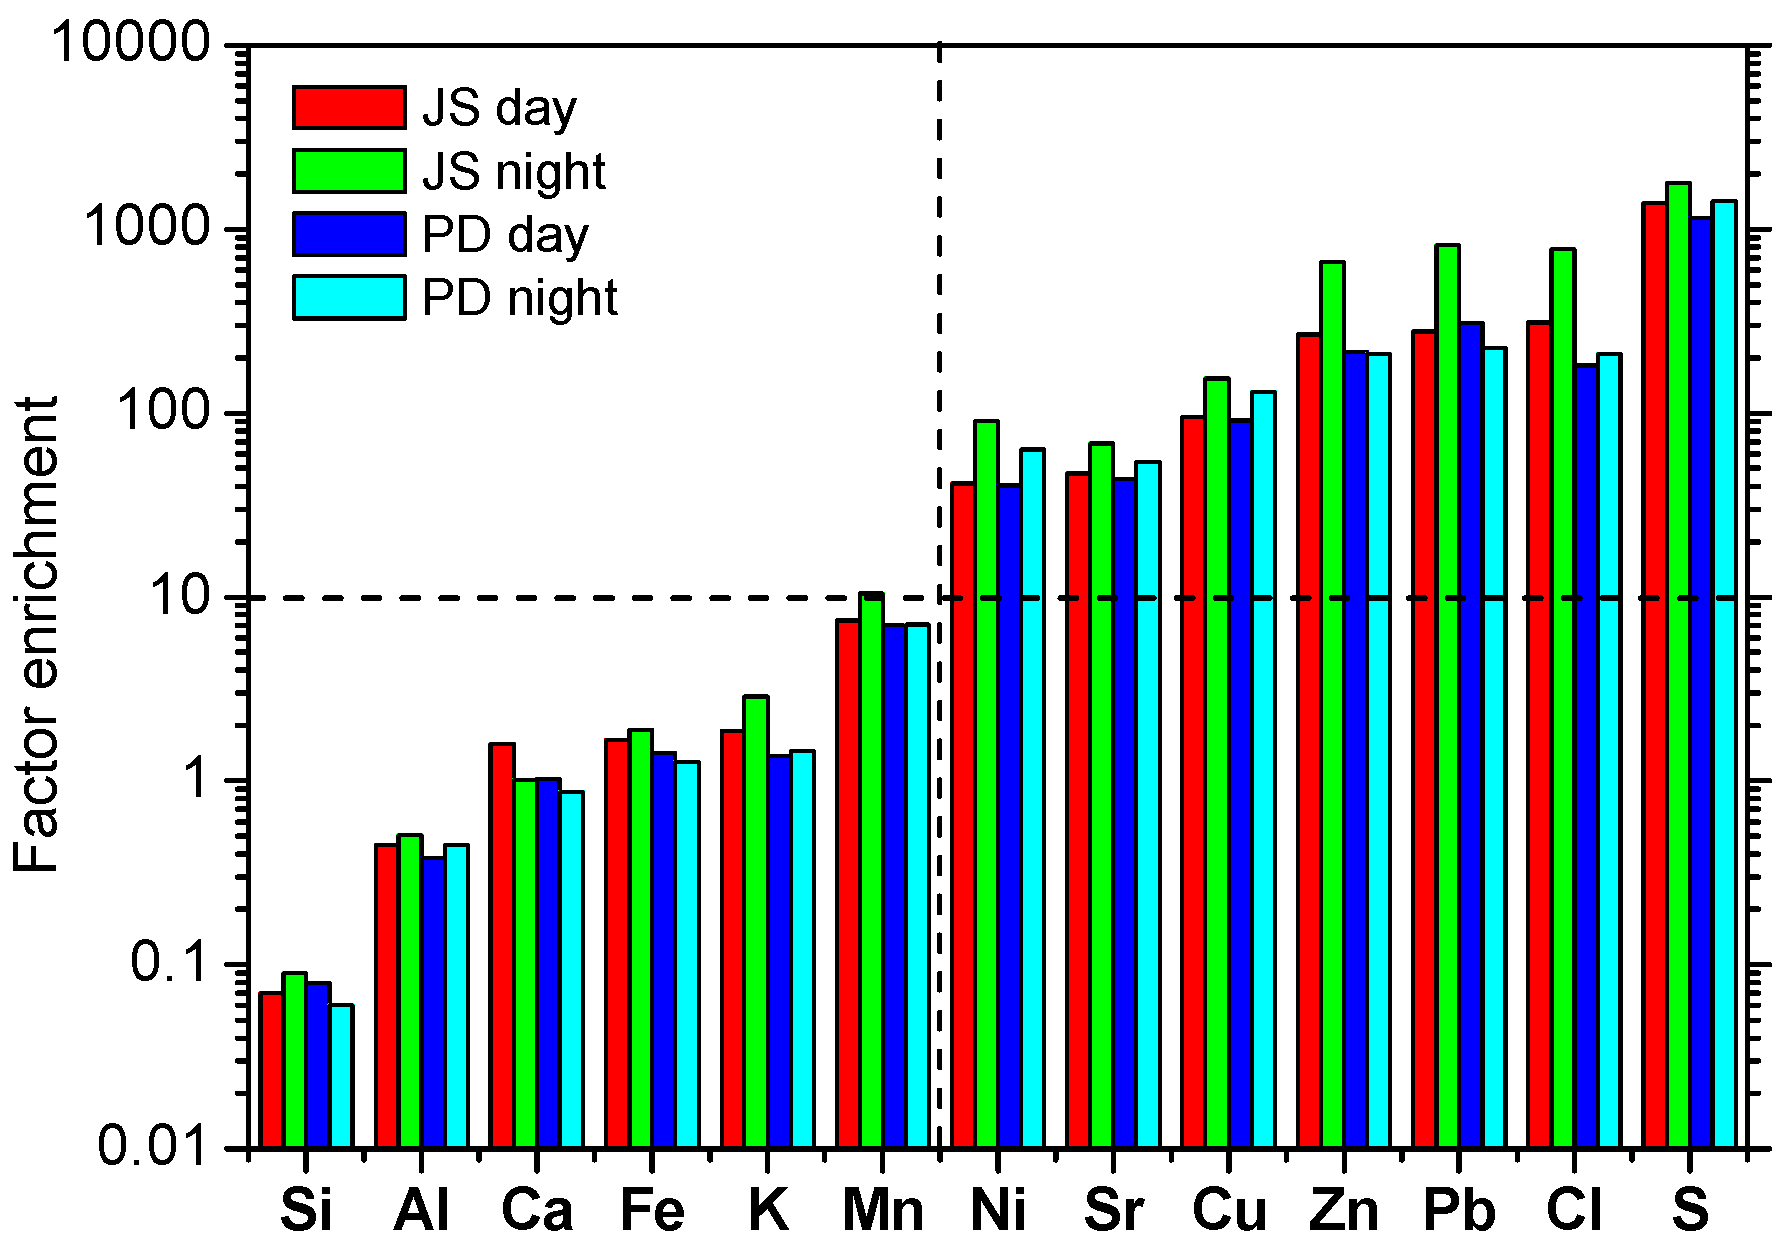
3.4. The Variations of Elemental Compositions

Figure 4 showed the element concentrations of PM2.5 in daytime and nighttime for Pudong and Jinshan, respectively. The elements are divided into two groups: major (Al, K, Ca, Fe and Si) and sub-major elements (S, Zn, Ni, Cu, Mn, Sr, Pb, Cl, As and Ti). The average concentrations of the major elements for daytime and nighttime at Pudong were 1.6 and 1.1 μg·m−3, respectively, and those of sub-major elements were 3.1 and 2.7 μg·m−3, respectively. In comparison, the average concentrations of the major elements were 1.8 and 1.5 μg·m−3 for daytime and nighttime at Jinshan, respectively, and those of sub-major elements were 3.5 and 3.6 μg·m−3, respectively. The ratios of Jinshan to Pudong for major elements were 1.2 for daytime and 1.3 for nighttime, respectively, and those of the sub-major were 1.1 and 1.3, respectively. Higher concentrations of major and sub-major elements at Jinshan were observed than Pudong.
Figure 4. Concentrations of elements in PM2.5 during daytime and nighttime at Pudong and Jinshan.
Atmosphere 06 01141 g004
The enrichment factor (EF) method was applied to obtain qualitative information on natural and anthropogenic origins of the elements. High values of the enrichment factor indicated a prevailing anthropogenic origin. The enrichment factor (EF) for the i-th sampling day (with i = 1, …, n; n = number of observations) and for a generic element X in comparison with a crustal reference element Y is defined as:
E F X i = ( X i / Y i ) a i r ( X / Y ) c r u s t
in which (Xi/Yi )air is the concentration ratio calculated starting from Xi-concentration and Yi-concentration measured in the i-th aerosol sample, and (X/Y)crust is the concentration ratio in the crust. In this study, Ti was used as the crustal reference element based on chemical composition of the Earth’s crust [29]. The uncertainties of EFs arising from the choice of the reference element were commonly observed in previous study [30]. In the present study, EFs will be much lower or larger if Fe or Al was used as reference element. Si was not chosen as reference element because of its low concentrations due to a lower content in the soil around the sites. EFX values ≈ 1 indicate that crustal soils are likely the predominant source for element X, while EFX values ˃10 suggest that the element X has mainly non-crustal origins.
The EFs of elements were shown in Figure 5. Si, Al, Ca, Fe and K had EFs of ˂10, indicating that these elements were mostly from crustal dust. The low EF of Si can be attributed to some complicated factors, such as the low concentration of Si in the soils around the measurement areas. The EFs of Ni, Sr, Cu, Zn, Pb, Cl, and S during daytime and nighttime of Pudong and Jinshan were greater than 10 and even greater than 100, indicating these elements were mainly from the anthropogenic pollution source. The EFs of these elements for Jinshan nighttime were much higher than those for other sampling periods, which further indicated that these elements were partly attributed to local emissions of industries, construction activities and residue combustion.
Figure 5. Enrichment factors of elements.
Atmosphere 06 01141 g005

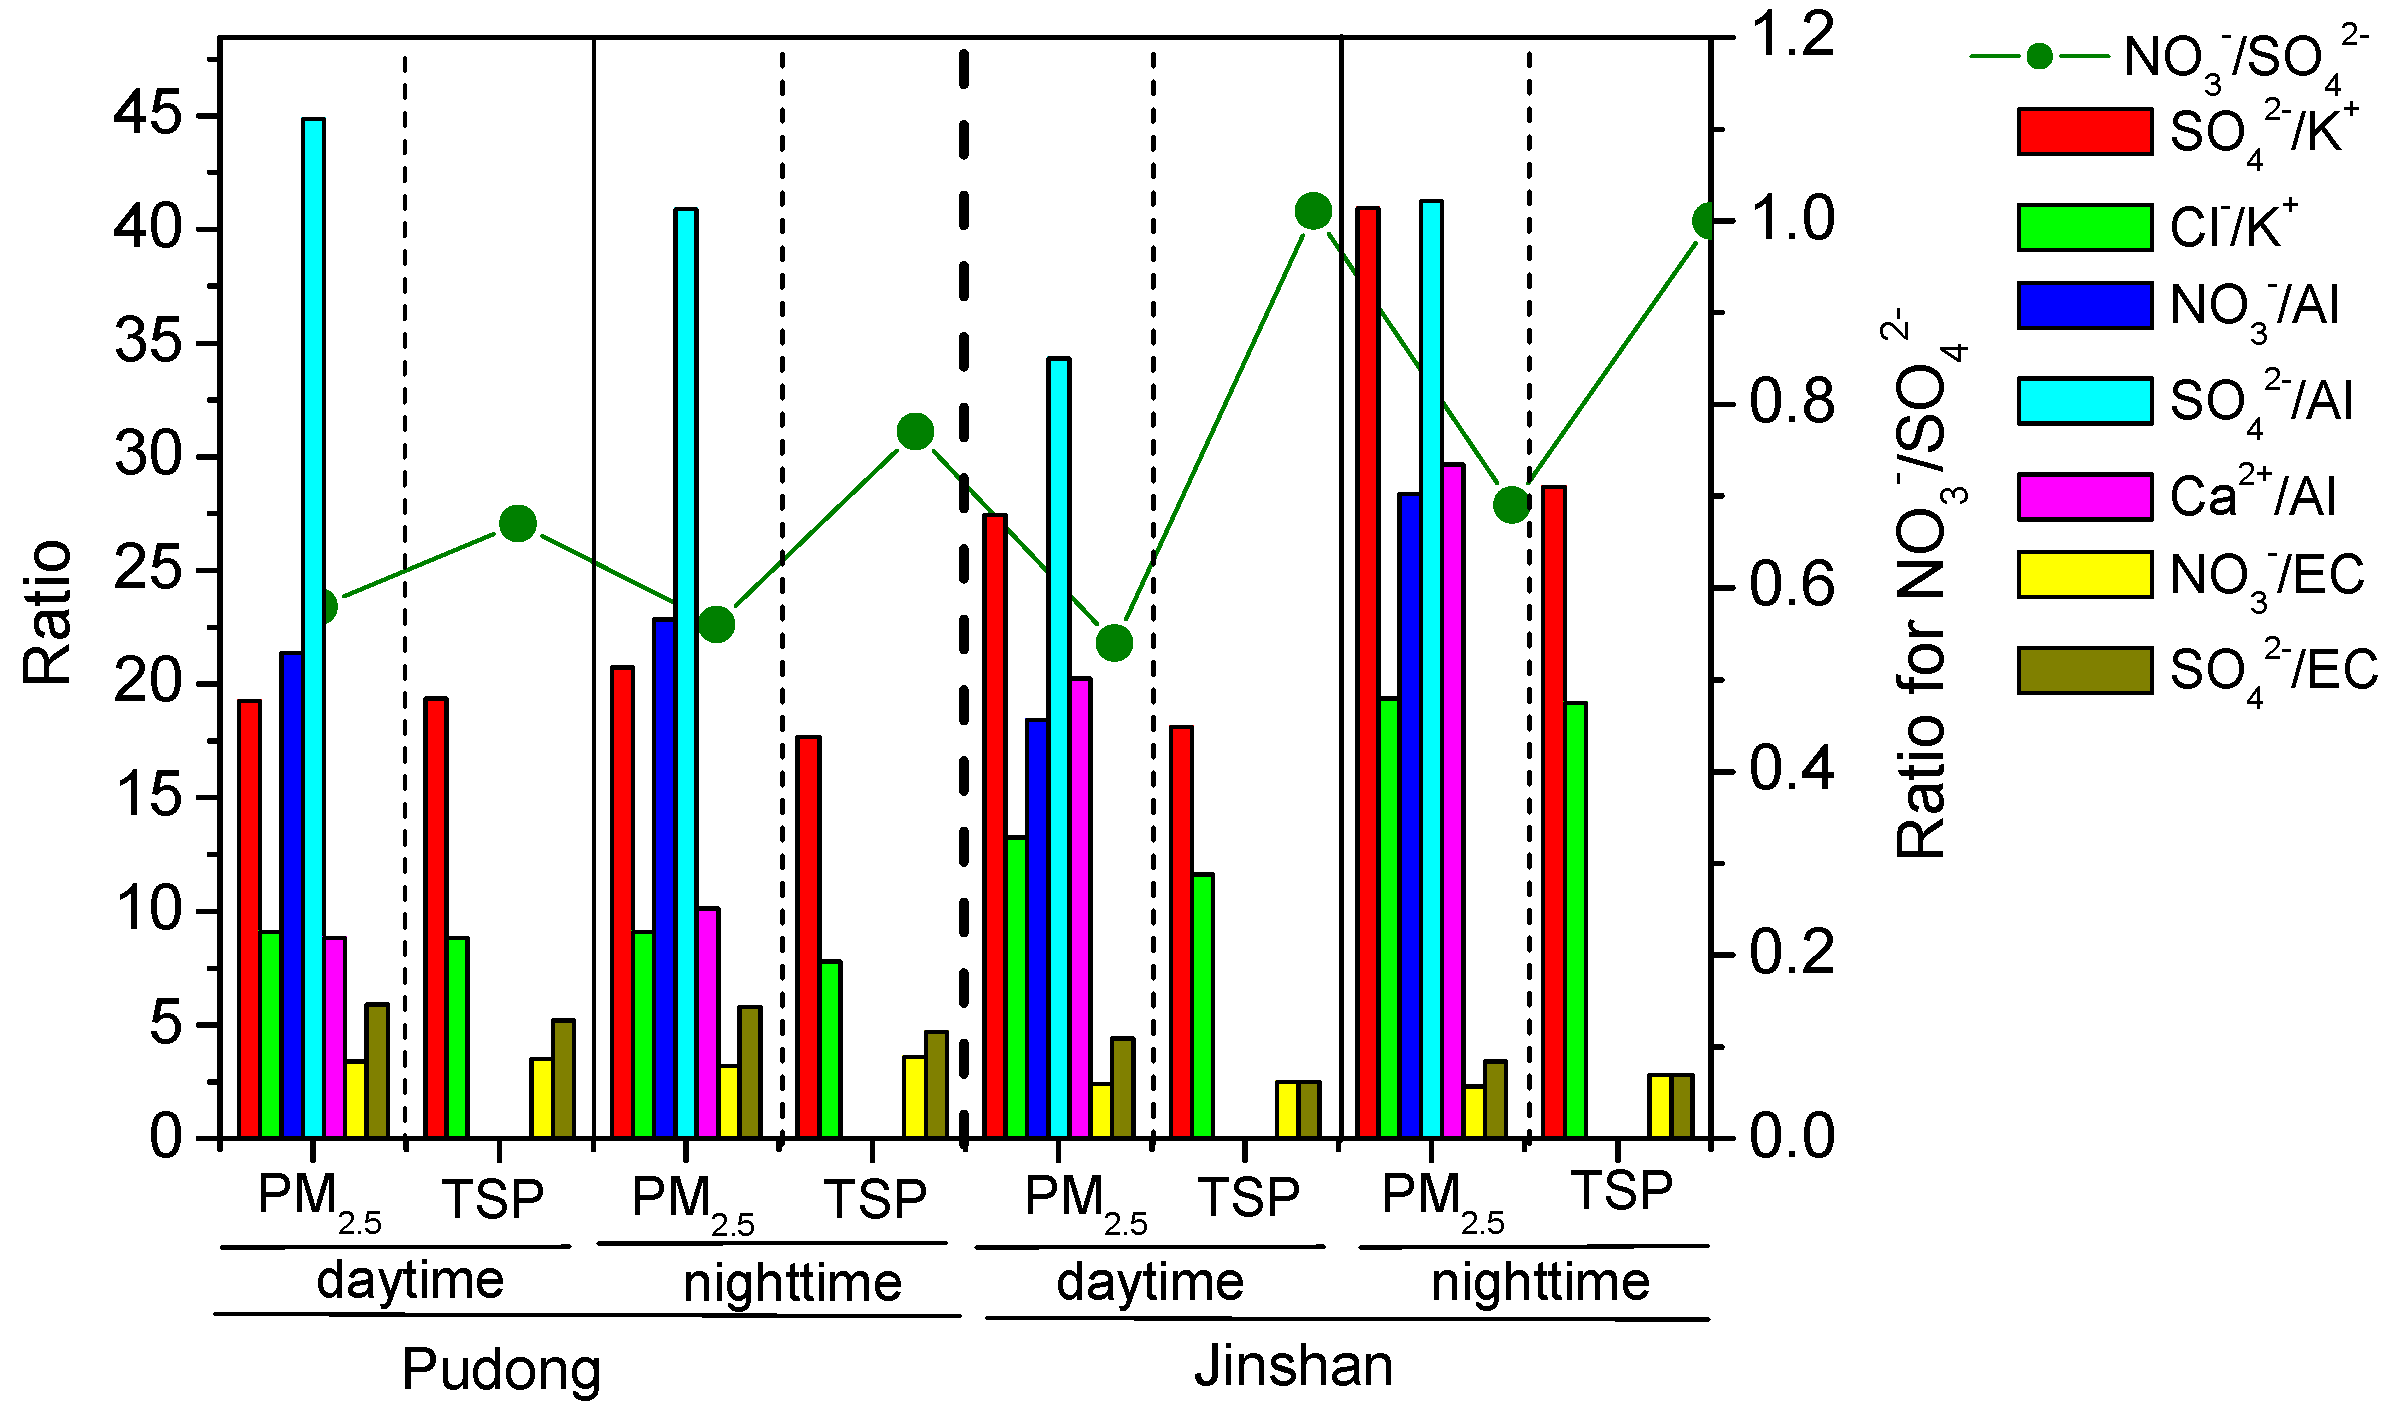
3.5. Indications of the Major Components Ratios

The ratios of special components may give some indications as to the source and chemical reaction of aerosol. NO3 and SO42− are the major secondary species and mainly from the oxidation of NOx and SO2, respectively. Some studies have used NO3/SO42− mass ratio to identify the relative importance of aerosol particles from mobile sources vs. stationary sources for sulfur and nitrogen in the atmosphere [31]. The previous study indicated that solar-absorption efficiency was positively correlated with the ratio of SO42−/EC [32]. Al is quite stable in the atmosphere and its concentration is not influenced by chemical reactions. Therefore, the ratios of NO3/Al and SO42−/Al can be used to show the degree of concentration variations due to the chemical reactions. Ca2+ is usually considered to derive from construction materials and soil dust, and the ratio of Ca2+/Al is a tracer to indicate the emission of construction materials in urban aerosol [9,33]. The species ratios for daytime and nighttime at Pudong and Jinshan were presented in the study.
The chemical species ratios (SO42−/K+, Cl/K+, NO3/Al, SO42−/Al, Ca2+/Al, NO3/SO42-, NO3/EC, and SO42−/EC) of PM2.5 and TSP were calculated and compared in Figure 6. NO3/SO42− for PM2.5 were lower than the corresponding values for TSP in daytime and nighttime, respectively. The average values of PM2.5 NO3/SO42− were ~0.58 and ~0.56 for daytime and nighttime at Pudong, respectively. Those were ~0.54 and ~0.69 for daytime and nighttime at Jinshan, respectively. Comparing with PM2.5, higher values of TSP NO3/SO42− were observed at both sites, which indicated that NO3 is more abundant in coarse fraction than SO42− [28].
As shown in Figure 6, the ratios of PM2.5 NO3/Al for both sites were ~20, except Jinshan nighttime with 28. The ratios of SO42−/Al for both sites were similar, which were among 34–44. The results showed the variations of NO3/Al and SO42−/Al were similar for daytime and nighttime at Pudong, while the ratios were lower for daytime than for nighttime at Jinshan. SO42−/K+ and Cl/K+ for daytime and nighttime were comparable at Pudong, respectively, but higher ratios were observed during nighttime than daytime at Jinshan.
Figure 6. The variations of chemical species ratios in Shanghai.
Atmosphere 06 01141 g006
The ratios of PM2.5 Ca2+/Al at Pudong were 8.8 and 7.6 for daytime and nighttime, respectively. Higher values were observed at Jinshan, which for daytime and nighttime were 20.3 and 22.7, respectively. The results indicated that the abundance of Ca2+ may be attributed to the emissions from local construction activities at Jinshan.
Higher ratios of NO3/EC and SO42−/EC were found at Pudong (with ~3.5 and ~5.5, respectively) than those for Jinshan (with ~2.5 and ~3.2, respectively) (Figure 5). There was no notable variance for NO3/EC and SO42−/EC between daytime and nighttime. The ratios of SO42−/EC in PM2.5 were higher than those in TSP, indicating that the chemical formation processes of sulfate were more dominant in fine particles. Attributing to primary emissions from construction activities and waste incineration, lower ratios of NO3/EC and SO42−/EC were observed at Jinshan. The study showed that reducing the secondary production at Pudong and mitigating primary emissions at Jinshan are likely to be effective strategies to improve air quality.

4. Conclusions

The concentrations of PM2.5 were lowest for Pudong nighttime and highest for Jinshan nighttime, respectively. Lower contributions of carbonaceous matter to PM2.5 and TSP were observed at Pudong (~30% and ~23%, respectively) than Jinshan (~48% and ~31% for PM2.5 and TSP, respectively), which indicated high carbonaceous pollution in Shanghai. Higher spatial uniformity (COD = 0.18) for PM2.5 was observed than for TSP (COD = 0.23) during the sampling period. SO42− was the most abundant anion followed by NO3. The abundance of Ca2+ and elements at Jianshan may be attributed to local sources. Higher EFs of Zn, Pb, Cl, and S for Jinshan nighttime were observed than for other sampling periods. The results suggest that stringent controls on aerosol precursors could be an efficient measure to reduce secondary aerosol production in urban residential zones, and control of primary local emissions could be an efficient strategy in industrial zones.

Acknowledgments

This study was supported by the National Natural Science Foundation of China (41230641, 41271481), the “Strategic Priority Research Program” of the Chinese Academy of Sciences (XDA05100401), and National Gongyi Project (201209007). The authors are grateful to Yingying Li and Haiyan Lu for their assistance in the aerosol sampling and analyses.

Author Contributions

Chongshu Zhu and Junji Cao designed and wrote the paper. Suixin Liu, Ting Zhang, Zhuzi Zhao, and Jiamao Zhou performed the gravimetric and chemical analyses. All authors reviewed and commented on the paper.

Conflicts of Interest

The authors declare no conflict of interest.

References

  1. Charlson, R.J.; Scharwtz, S.E.; Hales, J.M.; Cess, R.D.; Coakley, J.A., Jr.; Hansen, J.E.; Hofman, D.J. Climate forcing by anthropogenic aerosols. Science 1992, 255, 423–430. [Google Scholar] [CrossRef] [PubMed]
  2. Ye, B.M.; Ji, X.L.; Yang, H.Z.; Yao, X.H.; Chan, C.K.; Cadle, S.H.; Chan, T.; Mulaw, P.A. Concentration and chemical composition of PM2.5 in Shanghai for a 1-year period. Atmos. Environ. 2003, 37, 499–510. [Google Scholar] [CrossRef]
  3. Zhang, M.G.; Han, Z.W.; Zhu, L.Y. Simulation of atmospheric aerosols in East Asia using modeling system RAMS-CMAQ: model evaluation. China Particuology 2007, 5, 321–327. [Google Scholar] [CrossRef]
  4. Zhang, R.J.; Ho, K.F.; Cao, J.J.; Han, Z.W.; Zhang, M.G.; Cheng, Y.; Lee, S.C. Organic carbon and elemental carbon associated with PM10 in Beijing during spring time. J. Hazard. Mater. 2009, 172, 970–977. [Google Scholar] [CrossRef] [PubMed]
  5. Cao, J.J.; Xu, H.M.; Xu, Q.; Chen, B.H.; Kan, H.D. Fine particulate matter constituents and cardiopulmonary mortality in a heavily polluted Chinese city. Environ. Health Persp. 2012, 120, 373–378. [Google Scholar] [CrossRef] [PubMed]
  6. Jacobson, M.C.; Hansson, H.C.; Noone, K.J.; Charlson, R.J. Organic atmospheric aerosols: Review and state of the science. Rev. Geophys. 2000, 38, 267–294. [Google Scholar] [CrossRef]
  7. Cao, J.J.; Lee, S.C.; Ho, K.F.; Zou, S.C.; Fung, K.; Li, Y.; Watson, J.G.; Chow, J.C. Spatial and seasonal variations of atmospheric organic carbon and elemental carbon in Pearl River Delta Region, China. Atmos. Environ. 2004, 38, 4447–4456. [Google Scholar] [CrossRef]
  8. Cao, J.J.; Wu, F.; Chow, J.C.; Lee, S.C.; Li, Y.; Chen, S.W.; An, Z.S.; Fung, K.K.; Watson, J.G.; Zhu, C.S.; Liu, S.X. Characterization and source apportionment of atmospheric organic and elemental carbon during fall and winter of 2003 in Xi’an, China. Atmos. Chem. Phys. 2005, 5, 3127–3137. [Google Scholar] [CrossRef]
  9. Shen, Z.X.; Cao, J.J.; Arimoto, R.; Zhang, R.J.; Jie, D.M.; Liu, S.X.; Zhu, C.S. Chemical composition and source characterization of spring aerosol over Horqinsandland in northeastern China. J. Geophys. Res. 2007, 112, D14315. [Google Scholar] [CrossRef]
  10. Shen, Z.X.; Cao, J.J.; Tong, Z.; Liu, S.X.; Reddy, L.S.S.; Han, Y.M.; Zhang, T.; Zhou, J. Chemical characteristics of submicron particles in winter in Xi’an. Aerosol Air Qual. Res. 2009, 9, 80–93. [Google Scholar] [CrossRef]
  11. Yang, F.; He, K.; Ye, B.; Chen, X.; Cha, L.; Cadle, S.H.; Chan, T.; Mulawa, P.A. One-year record of organic and elemental carbon in fine particles in downtown Beijing and Shanghai. Atmos. Chem. Phys. 2005, 5, 1449–1457. [Google Scholar] [CrossRef]
  12. Feng, Y.L.; Chen, Y.J.; Guo, H.; Zhi, G.R.; Xiong, S.C.; Li, J.; Sheng, G.Y.; Fu, J.M. Characteristics of organic and elemental carbon in PM2.5 samples in Shanghai, China. Atmos. Res. 2009, 92, 434–442. [Google Scholar]
  13. Chow, J.C.; Yu, J.Z.; Watson, J.G.; Ho, S.S.H.; Bohannan, T.L.; Hays, M.D.; Fung, K.K. The application of thermal methods for determining chemical composition of carbonaceous aerosols: A review. J. Environ. Sci. Health 2007, 42, 1521–1541. [Google Scholar] [CrossRef] [PubMed]
  14. Han, Y.M.; Cao, J.J.; Chow, J.C.; Watson, J.G.; Fung, K.K.; Jin, Z.D.; Liu, S.X.; An, Z.S. Evaluation of the thermal/optical reflectance method for discrimination between soot- and char-EC. Chemosphere 2007, 69, 569–574. [Google Scholar] [CrossRef] [PubMed]
  15. Han, Y.M.; Lee, S.C.; Cao, J.J.; Ho, K.F.; An, Z.S. Spatial distribution and seasonal variation of char-EC and soot-EC in the atmosphere over China. Atmos. Environ. 2009, 43, 6066–6073. [Google Scholar] [CrossRef]
  16. Chow, J.C.; Watson, J.G.; Robles, J.; Wang, X.; Chen, L.W.; Trimble, D.L.; Steven, D.K.; Richard, J.T.; Kochy, K.F. Quality assurance and quality control for thermal/optical analysis of aerosol samples for organic and elemental carbon. Anal. Bioanal. Chem. 2011, 401, 3141–3152. [Google Scholar] [CrossRef] [PubMed]
  17. Brouwer, P. Theory of XRF: Getting Acquainted with the Principles; PANanalytical: Almelo, The Netherlands, 2003; pp. 50–58. [Google Scholar]
  18. Shan, W.P.; Lu, H.X.; Huo, S.Y.; Huang, Z.X.; You, L.N. Analysis of a high PM10 episode observed at a coastal site nearby Shanghai, China. Environ. Monit. Assess. 2010, 163, 337–345. [Google Scholar] [CrossRef] [PubMed]
  19. Contini, D.; Belosi, F.; Gambaro, A.; Cesari, D.; Stortini, A.M.; Bove, M.C. Comparison of PM10 concentrations and metal content in three different sites of the Venice Lagoon: An analysis of possible aerosol sources. J. Environ. Sci. 2012, 24, 1954–1965. [Google Scholar] [CrossRef]
  20. Wilson, J.G.; Kingham, S.; Pearce, J.; Sturman, A.P. A review of intraurban variations in particulate air pollution: Implications for epidemiological research. Atmos. Environ. 2005, 39, 6444–6462. [Google Scholar] [CrossRef]
  21. He, K.; Yang, F.; Ma, Y.; Zhang, Q.; Yao, X.; Chan, C.K.; Cadle, S.; Chan, T.; Mulawa, P. The characteristics of PM2.5 in Beijing, China. Atmos. Environ. 2001, 35, 4959–4970. [Google Scholar] [CrossRef]
  22. Cao, J.J.; Lee, S.C.; Chow, J.C.; Watson, J.G.; Ho, K.F.; Zhang, R.J.; Jin, Z.D.; Shen, Z.X.; Chen, G.C.; Kang, Y.M.; et al. Spatial and seasonal distributions of carbonaceous aerosols over China. J. Geophys. Res. 2007, 112, D22S11. [Google Scholar] [CrossRef]
  23. Shen, Z.X.; Cao, J.J.; Liu, S.X.; Zhu, C.S.; Wang, X.; Zhang, T.; Xu, H.M.; Hu, T.F. Chemical composition of PM10 and PM2.5 collected at ground level and 100 meters during a strong wintertime pollution episode in Xi’an, China. J. Air Waste Manag. Assoc. 2011, 61, 1150–1159. [Google Scholar]
  24. Tao, J.; Shen, Z.X.; Zhu, C.S.; Yue, J.H.; Cao, J.J.; Liu, S.X.; Zhu, L.H.; Zhang, R.J. Seasonal variations and chemical characteristics of sub-micrometer particles (PM1) in Guangzhou, China. Atmos. Res. 2012, 118, 222–231. [Google Scholar] [CrossRef]
  25. Cao, J.J.; Lee, S.C.; Ho, K.F.; Zhang, X.Y.; Zou, S.C.; Fung, K.K.; Chow, J.C.; Watson, J.G. Characteristics of carbonaceous aerosol in Pear River Delta Region, China during 2001 winter period. Atmos. Environ. 2003, 37, 1451–1460. [Google Scholar] [CrossRef]
  26. Cao, J.J.; Zhu, C.S.; Tie, X.X.; Geng, F.H.; Xu, H.M.; Ho, S.S.H.; Wang, G.H.; Han, Y.M.; Ho, K.F. Characteristics and sources of carbonaceous aerosols from Shanghai, China. Atmos. Chem. Phys. 2013, 13, 803–817. [Google Scholar] [CrossRef]
  27. Duan, F.K.; He, K.B.; Ma, Y.L.; Yang, F.M.; Yu, X.C.; Cadle, S.H.; Chan, T.; Mulawa, P.A. Concentration and chemical characteristics of PM2.5 in Beijing, China: 2001–2002. Sci. Total Environ. 2006, 355, 264–275. [Google Scholar] [CrossRef] [PubMed]
  28. Contini, D.; Cesari, D.; Genga, A.; Siciliano, M.; Ielpo, P.; Guascito, M.R.; Conte, M. Source apportionment of size-segregated atmospheric particles based on the major water-soluble components in Lecce (Italy). Sci. Total Environ. 2014, 472, 248–261. [Google Scholar] [CrossRef] [PubMed]
  29. Taylor, S.R.; McLennan, S.M. The Continental Crust: Its Composition and Evolution; Blackwell Scientific Publications: Oxford, UK, 1985. [Google Scholar]
  30. Cesari, D.; Contini, D.; Genga, A.; Siciliano, M.; Elefante, C.; Baglivi, F.; Daniele, L. Analysis of raw soils and their re-suspended PM10 fractions: Characterisation of source profiles and enrichment factors. Appl. Geochem. 2012, 27, 1238–1246. [Google Scholar] [CrossRef]
  31. Arimoto, R.; Duce, R.A.; Savoie, D.L.; Prospero, J.M.; Talbot, R.; Cullen, J.D.; Tomza, U.; Lewis, N.F.; Ray, B.J. Relationships among aerosol constituents from Asia and the North Pacific during PEM-West A. J. Geophys. Res. 1996, 101, 2011–2023. [Google Scholar] [CrossRef]
  32. Ramana, M.V.; Ramanathan, V.; Feng, Y.; Yoon, S.C.; Kim, S.W.; Carmichael, G.R.; Schauer, J.J. Warming influenced by the ratio of black carbon to sulphate and the black-carbon source. Nat. Geosci. 2010, 3, 542–545. [Google Scholar] [CrossRef]
  33. Wang, Y.; Zhuang, G.; Sun, Y.; An, Z. The variation of characteristics and formation mechanisms of aerosols in dust, haze, and clear days in Beijing. Atmos. Environ. 2006, 40, 6579–6591. [Google Scholar] [CrossRef]

