Article

Spatial Distribution of Methanesulphonic Acid in the Arctic Aerosol Collected during the Chinese Arctic Research Expedition

1
School of Life Sciences, University of Science and Technology of China, Hefei 230026, China
2
Institute of Polar Environment, School of Earth and Space Sciences, University of Science and Technology of China, Hefei 230026, China
*
Author to whom correspondence should be addressed.
Atmosphere 2015, 6(5), 699-712; https://doi.org/10.3390/atmos6050699
Submission received: 9 March 2015 / Revised: 29 April 2015 / Accepted: 8 May 2015 / Published: 20 May 2015

Abstract

:
Methanesulphonic acid (MSA, mainly derived from marine biogenic emissions) has been frequently used to estimate the marine biogenic contribution. However, there are few reports on MSA over the Arctic Ocean, especially the central Arctic Ocean. Here, we analyzed MSA in aerosol samples collected over the ocean and seas during the Chinese Arctic Research Expedition (CHINARE 2012) using ion chromatography. The aerosol MSA concentrations over the Arctic Ocean varied considerably and ranged from non-detectable (ND) to 229 ng/m3, with an average of 27 ± 54 ng/m3 (median: 10 ng/m3). We found the distribution of aerosol MSA exhibited an obvious regional variation, which was affected by biotic and abiotic factors. High values were generally observed in the Norwegian Sea; this phenomenon was attributed to high rates of phytoplankton primary productivity and dimethylsulfide (DMS) fluxes in this region. Concentrations over the pack ice region in the central Arctic Ocean were generally lower than over the open waters at the ice edge in the Chukchi Sea. This difference was the mainly caused by sea ice. In addition, we found that higher MSA concentrations were associated with warmer sea surface temperature (SST).

1. Introduction

Atmospheric sulfur of marine origin is considered to be an important biogenic species in the marine atmosphere. In the Arctic region, it has been estimated that 42% of the total sulfur emissions are biogenic [1]. DMS produced by marine phytoplankton comprise over 90% of the marine sulfur flux and over 50% of the global biogenic flux of sulfur to the troposphere [2]. However, once DMS is released into the air, it is then oxidized by the OH radical, leading to the formation of methanesulphonic acid (MSA) and non-seasalt sulfate (nss-SO42−) [3], both of which can form aerosols [3]. These sulfur-containing aerosols could influence the earth’s radiation balance by directly scattering solar radiation and acting as cloud condensation nuclei (CCN) to influence cloud coverage and albedo, resulting in a negative feedback to climatic perturbations [4]. In the marine atmosphere, the main source of MSA is the oxidation of DMS. Thus, MSA serves as a tracer to separate sulfate of marine biogenic origin from other sources [5,6], and has been frequently used to estimate the marine biogenic production [7,8].
Many previous works have been focused on the spatial characteristics of MSA in various oceanic regions (Table 1) and explored the factors influencing MSA. For example, changes in MSA concentration records in an ice core were related to temperature and sea ice [9], and these records can act as an indicator of marine primary production to investigate climate history [10]. Warm sea surface temperature (SST) and diminishing sea ice coverage could increase the DMS flux and MSA concentrations [11,12]. The pattern of variability for aerosol MSA in the Arctic area exhibited a summer maximum and winter minimum [13]. In addition, the highest values were found along the ice edge zone in August, and lowest values were recorded over the pack ice in September [13]. Furthermore, sea-ice conditions, wind speed, ocean currents, and solar radiation influence MSA concentrations [14,15]. Based on previous studies, although MSA concentrations can be affected by multiple processes, these can be mainly summarized into two categories, i.e., biotic factors such as primary productivity and phytoplankton species, and abiotic factors that include air and sea temperatures, sea-ice, wind and sea-air exchange.
The Arctic plays an important role in the global climate system. With global warming, the Arctic warming rate is almost twice the average rate of the world [16]. Meanwhile, the Arctic sea ice area has decreased by a rate of 2.7% per decade [17]. These factors will influence the primary production and sea-air exchange of biogenic compounds in the Arctic Ocean [11]. Although there are many reports on MSA in the Arctic region, most of these studies have focused on land-based observations around the Arctic Ocean. Thus, additional studies on MSA over the Arctic Ocean, especially the central Arctic Ocean, are needed for a better understanding of biogenic sulfur emissions in this region. Here, we report and discuss the results of aerosol MSA in summertime collected during the Chinese National Arctic Research cruise (CHINARE 2012). Our goal is to investigate the spatial distributions of MSA and to explore the mechanisms and influencing factors of MSA over the Arctic Ocean. Results from this work will also provide new data concerning MSA for model constraints.

2. Experimental Methods

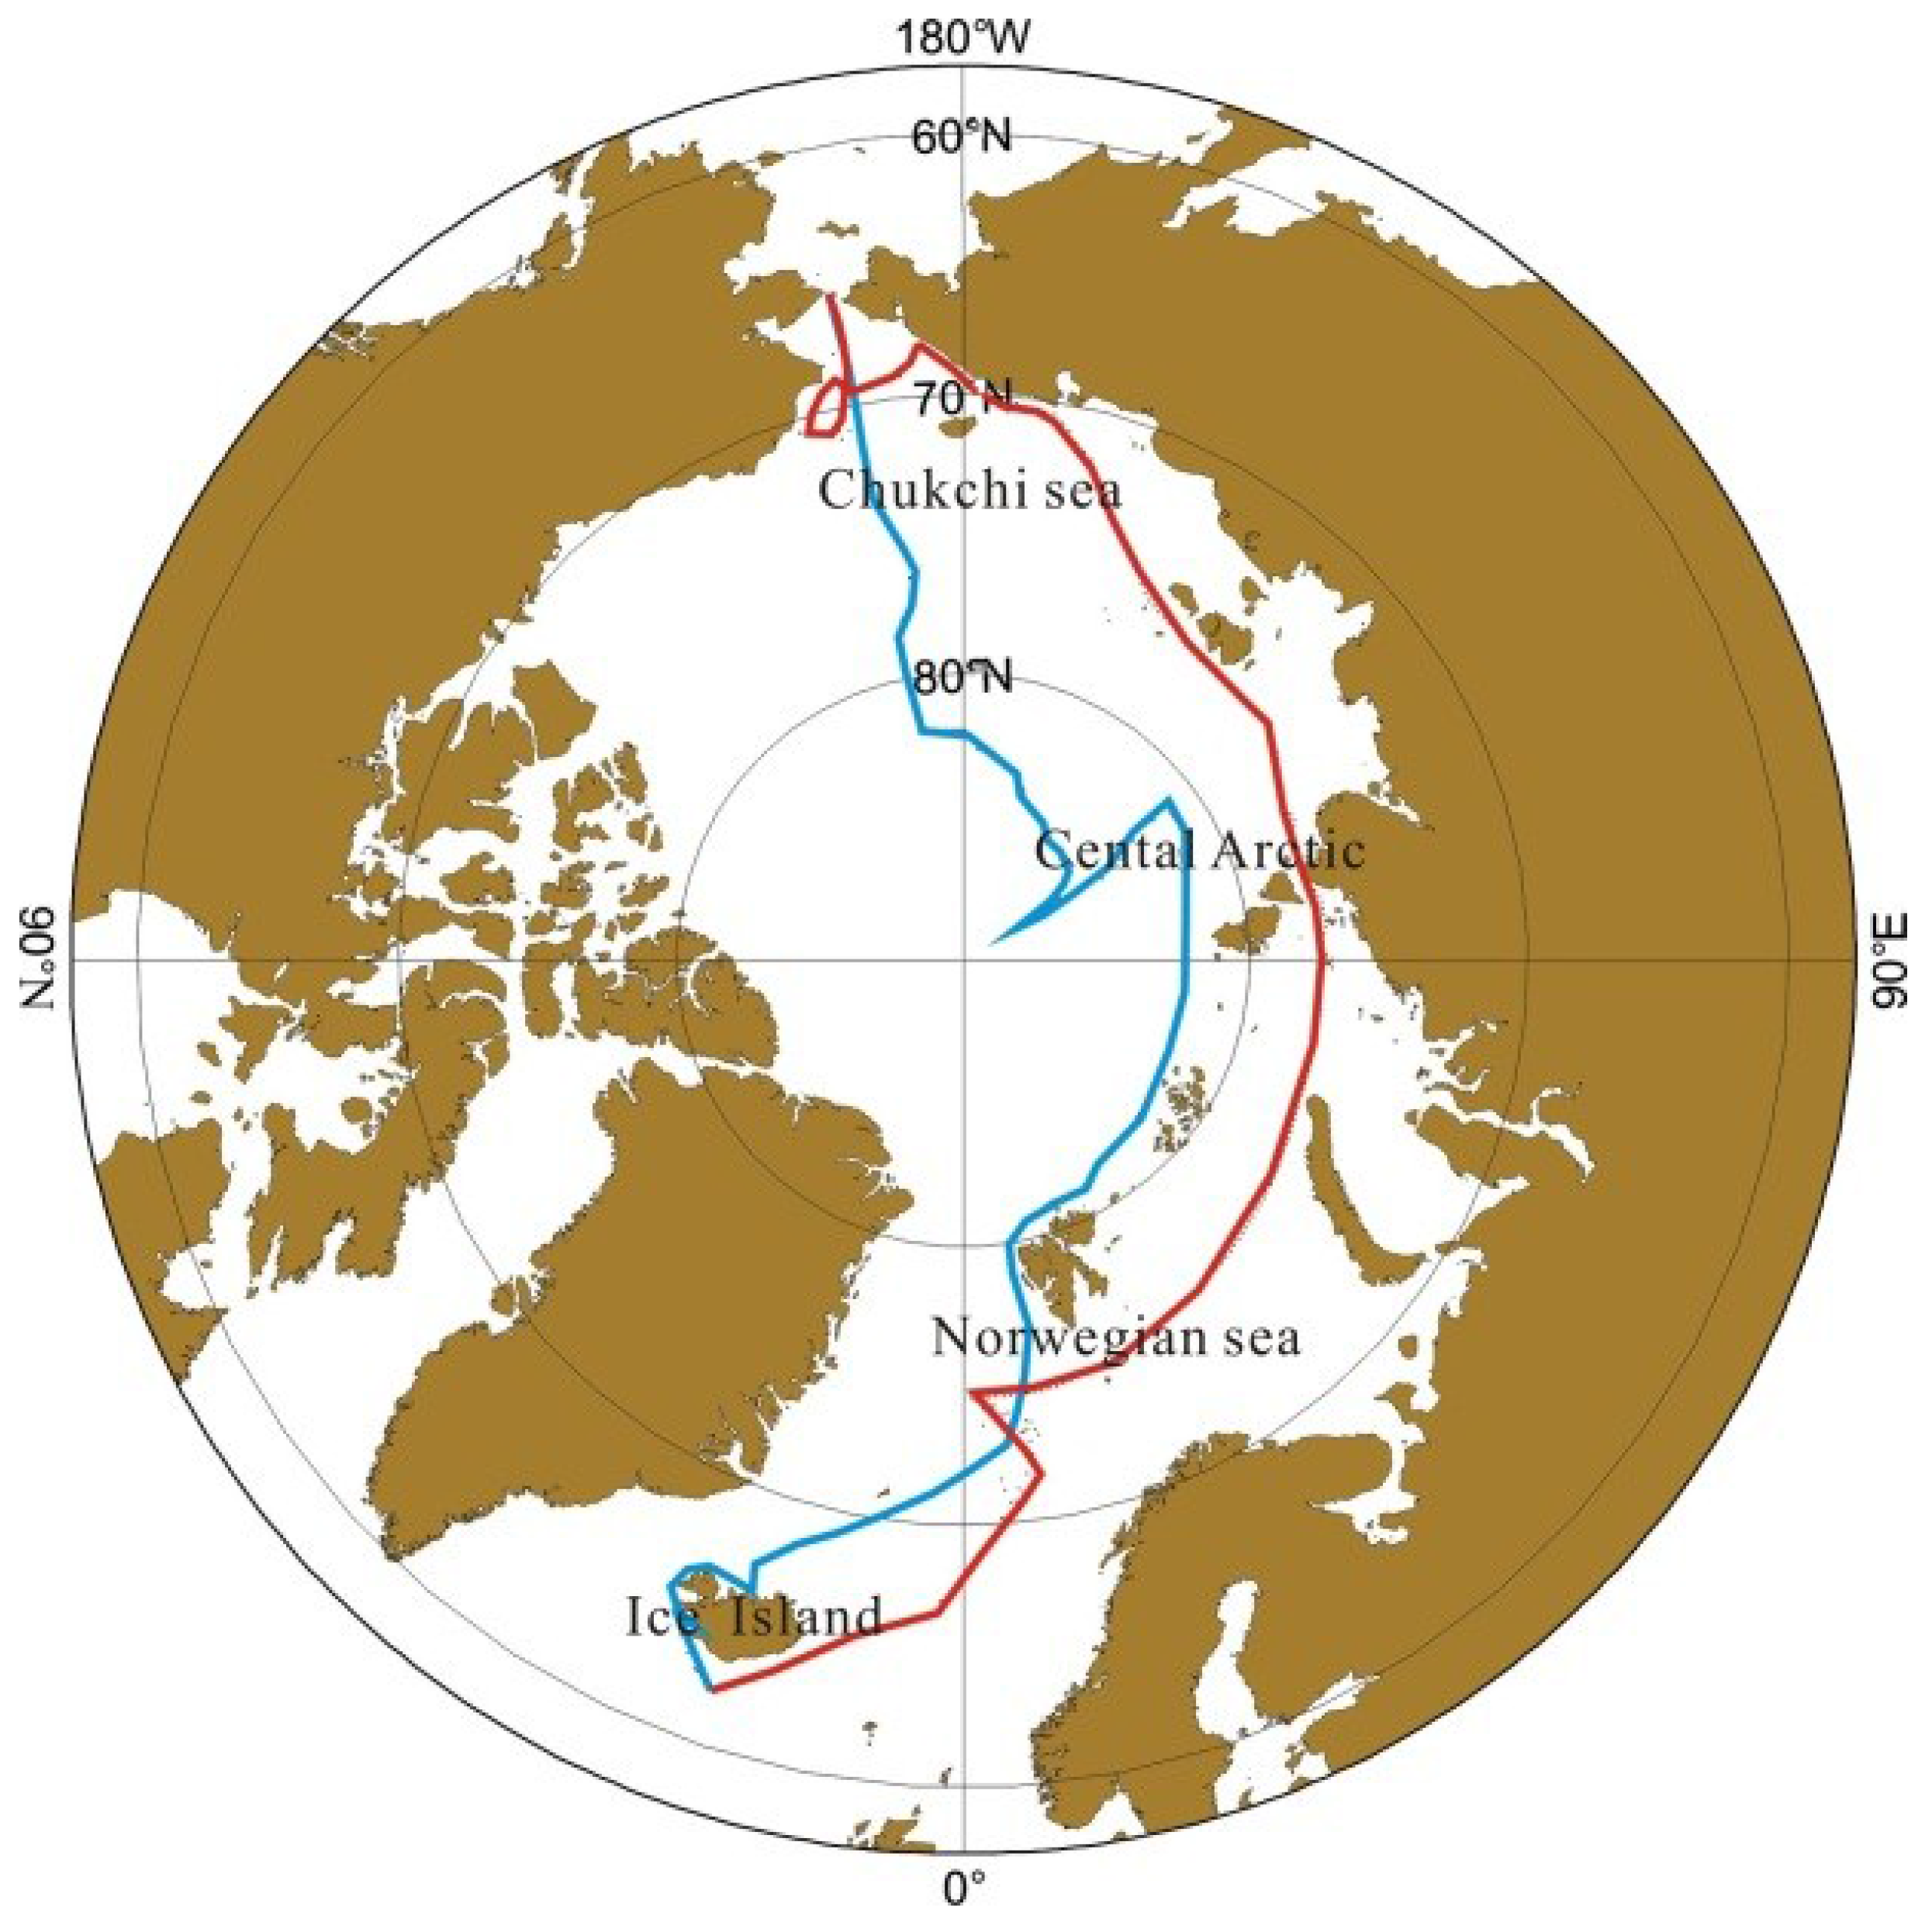
2.1. The Cruise Route

The data over the Arctic Ocean were collected on the Chinese Research Vessel Xuelong during CHINARE 2012. The cruise (67°N–87°N, 167°W–90°E–14°W) started on 18 July in the Chukchi Sea, visited Ice Island, and then returned to the Chukchi Sea on 8 September by passing through the central Arctic Ocean. The navigation in the ice region of the Arctic was up to 5370 nautical miles, and reached a northernmost point of 87°N (Figure 1). In addition, we were also provided with the MSA data from CHINARE 2010 (Table A1), and these results were compared with the results from CHINARE 2012. The CHINARE 2010 route differed from that of CHINARE 2012; the cruise started on 20 July in the Chukchi Sea, reached the central Arctic Ocean and then returned to the Chukchi Sea on 31 August.
Figure 1. The Arctic Ocean route of the fifth Chinese Arctic Research Expedition (CHINARE 2012). The red and blue lines represent the departing and return trips, respectively.
Atmosphere 06 00699 g001

2.2. Sampling and Experimental Methods

Twenty-three total suspended particles (TSP) samples and three field blanks were collected in the Arctic Ocean during the CHINARE 2012 from July to September. A high volume air sampler (Tianhong Instruments, Wuhan, China) was placed on the upper-most deck of the icebreaker Xuelong. All samples were collected at a flow rate of 1.05 m3/min by Whatman 41 filters for 24 h or 48 h. To avoid possible contamination from the ship’s own stack emissions, the wind direction and speed controller was used during the sampling periods. All filter samples were retrieved from the sampler, placed and sealed in clean plastic bags, and kept at 4 °C until laboratory analysis. All sample handling was performed according to stringent contamination control protocols [18,19]. In addition, ancillary data including color dissolved organic matter (CDOM), sea surface temperature (SST) and wind speed were obtained from the ship’s monitoring system during CHINARE 2012 (Table A1). These data could help to investigate the influence the spatial distribution of MSA over the Arctic Ocean. Detailed information for each sample is listed in Table A1.
A punch (2 cm × 2 cm) of each filter was taken and analyzed. Briefly, each sample was extracted by sonication with 20 mL ultra-pure (≥18 MΩ) in an ice water bath for 80 min. All the extracts were filtered through pre-washed 0.45 um filters. Then, MSA was analyzed by a Dionex DX-2100 ion chromatograph (IC) system with an AG11-HC guard column and an AS11-HC analytical column. Three filter blanks were taken and analyzed, MSA concentrations were observed under the detection limits in filter blanks.

3. Results and Discussion

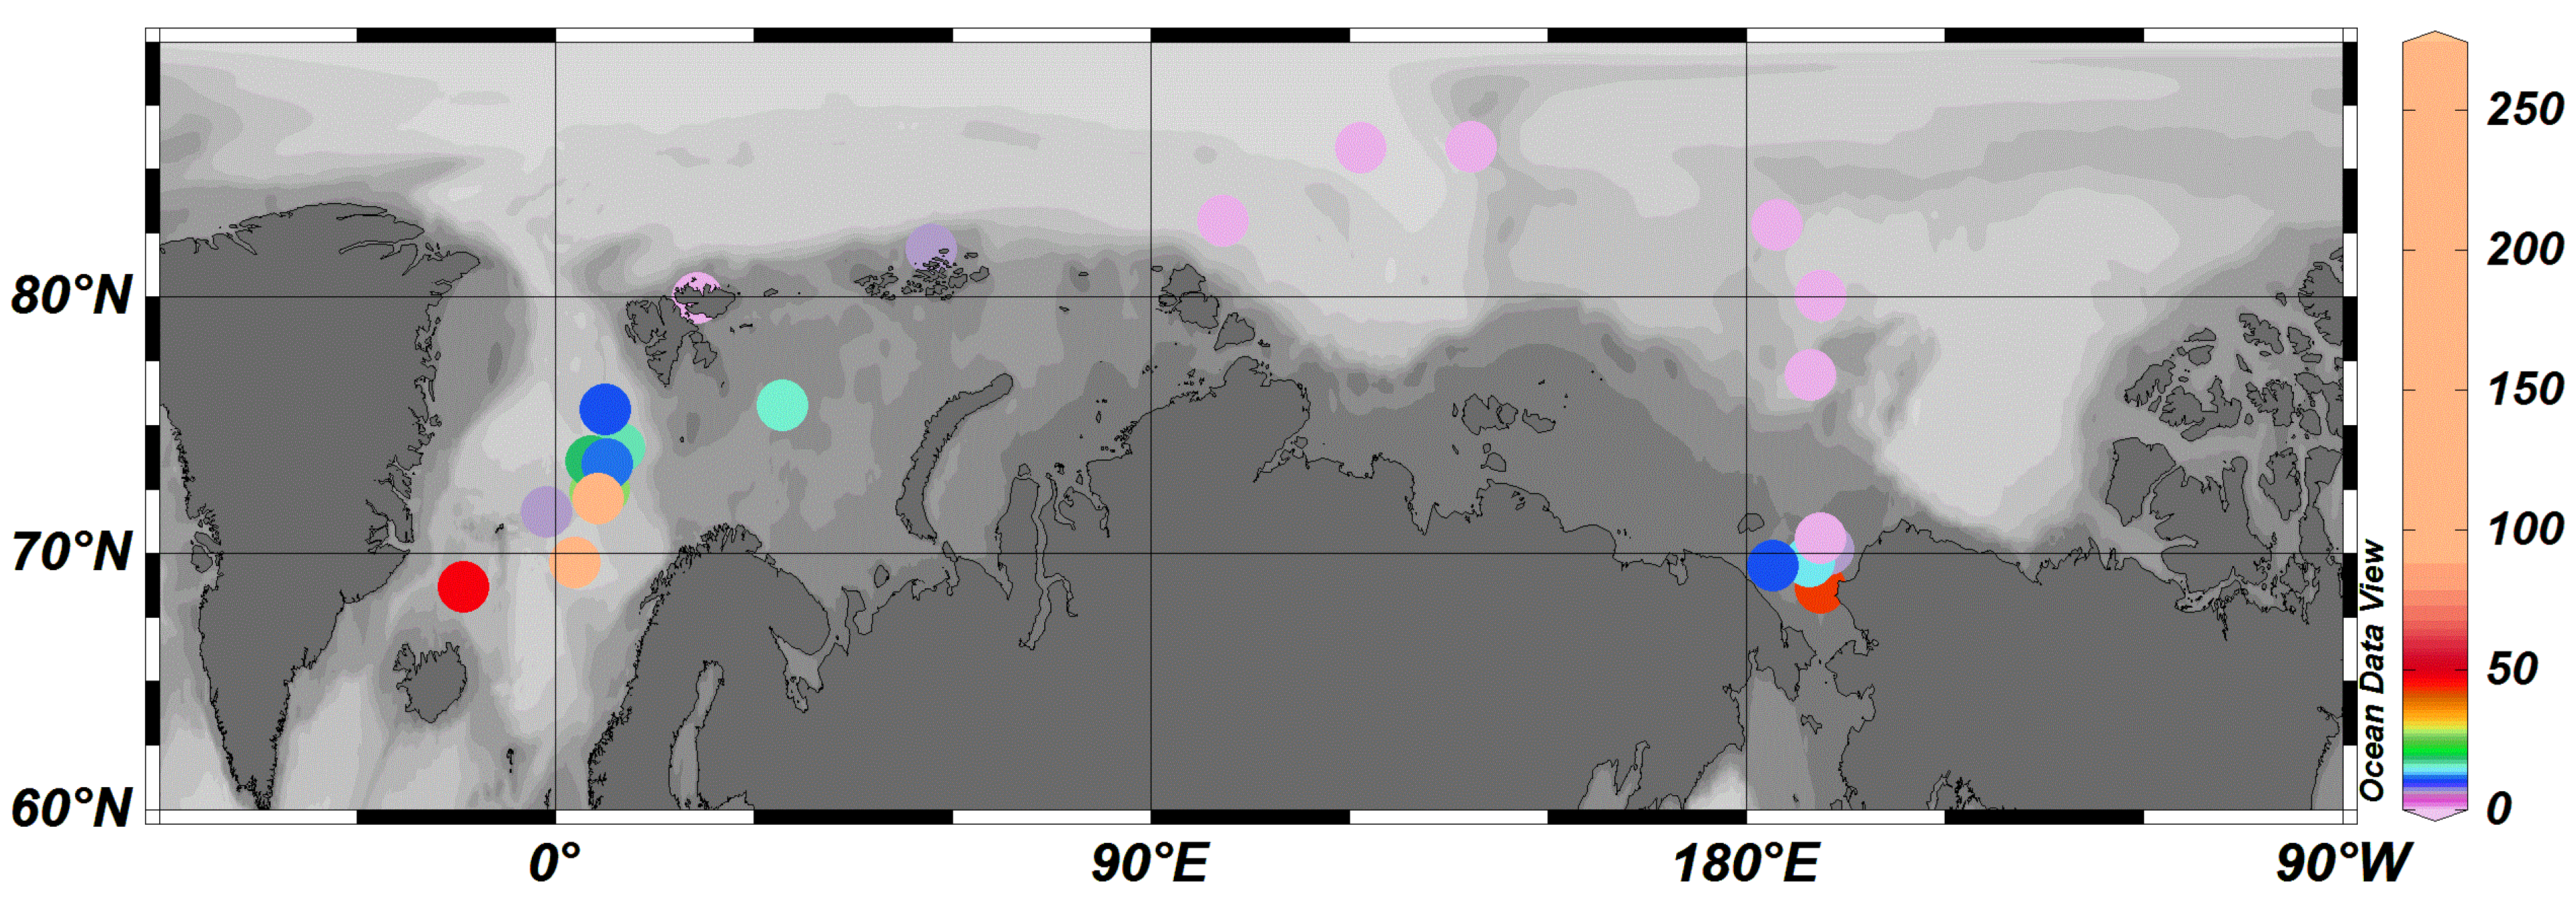
3.1. General Observations

The aerosol MSA concentrations collected along the cruise path during CHINARE 2012 are shown in Figure 2. The MSA concentrations varied considerably from non-detectable to 229 ng/m3, with an average of 27 ± 54 ng/m3 (median: 10 ng/m3). This average is similar to the data over the Antarctic Ocean (26 ng/m3) [20] and the value reported by Ny-Ålesund (mean: 26 ± 24 ng/m3) [12]. However, our results were somewhat higher than the average measured over Alert (6–18 ng/m3) in July-August from 1980 to 1991 [21]. In addition, Xie et al., (2005) reported the average MSA concentration (71 ± 60 ng/m3) over the Arctic Ocean during the First Chinese Arctic Research Expedition (69°N~75°N,133°W~165°W) [22], which is much higher than that measured during CHINARE 2012; this difference may be mainly caused by different observation routes.
Figure 2. Spatial distribution of aerosol methanesulphonic acid (MSA) over the Arctic Ocean (ng/m3) along the cruise path during CHINARE 2012 from July to September, generated by Ocean Data View 4.0.
Atmosphere 06 00699 g002

3.2. Regional Characteristics

The MSA concentrations displayed different characteristics at different locations along the cruise (Figure 2). To better interpret the data, we divided the Arctic Ocean into three parts: the Chukchi Sea (67°N–71°N, 167°W–176°W), Norwegian Sea (69°N–75°N, 2°E–34°E), and the central Arctic Ocean (80°N–87°N, 170°W–138°E). The sea ice, biological source contributions and ocean basin caused significant differences in biological and physical processes in these three regions, and hence will result in different distribution of MSA. Here, we defined the central Arctic Ocean as the area that was covered with sea ice during our sampling episodes and which lies at a latitude higher than 80°N.
As shown in Table 1, the Norwegian Sea had the highest MSA concentrations (60 ± 80 ng/m3), followed by the Chukchi Sea (12 ± 16 ng/m3). Compared with previous results obtained near the Norwegian Sea, high MSA levels (approximately 120 ng/m3) were also observed along the Tromso-Svalbard in the fall of 2007 and 2008 [23]. In addition, Figure 2 shows the MSA concentrations increased sharply around 70°N~73°N, 2°E~7°E. Significantly, colored dissolved organic matter (CDOM) concentrations also increased sharply, which coincided with the increased MSA in this region. Furthermore, CDOM concentrations in the Norwegian Sea were higher than in the other regions along the cruise (Table A1). These concentrations corresponded to relatively high MSA concentrations over the Norwegian Sea; there may be a potential relationship between these variables and this will be discussed later. The spatial distributions of the MSA concentrations over the central Arctic Ocean were notably different from those over the Norwegian and Chukchi Seas. The MSA over the central Arctic Ocean ranged from non-detectable to 5 ng/m3, with an average of 1.2 ± 2 ng/m3, which is significantly lower than in the other regions. In addition, the MSA levels over the Chukchi Sea and the central Arctic Ocean during CHINARE 2010 and CHINARE 2012 are similar (Table 1 [7,12,15,23,24,25,26,27]). The levels of aerosol MSA at different locations are listed in Table 1.
Table 1. Comparison of MSA concentrations at different locations.
LocationSampling TimeAverage (ng/m3)Range (ng/m3)Reference
Chukchi SeaJuly, September 201212ND-42This study
Norwegian SeaAugust 20126010–229This study
Central ArcticAugust 20121.2ND-5This study
Chukchi SeaJuly, August 20108ND-43This study
Central ArcticAugust 20103ND-12This study
AlertJuly–August 1980–1991-6–18[24]
AlertJuly–August 1998–2009103–17[12]
BarrowJuly–August 1998–200912ND-40[12]
Ny-ÅlesundJuly–August 1998–200442ND-86[25]
IslandJune–August 2011, 2012-1–10[26]
Norwegian coastFall 2007, 2008-120 (maximum)[23]
Shemya (52°N, 174°E) May–September 198117-[27]
Shemya (52°N, 174°E) October 1981–March 198214-[27]
Bermuda (32.27°N, 64.87°W)July 1988, 199043-[7]
MaceHead, Ireland (53.32°N, 9.85°W)August 1989–August 199069-[7]
EquatorSummer*11[15]
63°S, 23°WSummer*260 (maximum)[15]
Note: “ND” indicates that the MSA concentrations were below the detection limit. “-” indicates no information was available. “*” indicates only one sample.

3.3. The Role of Biotic Factors

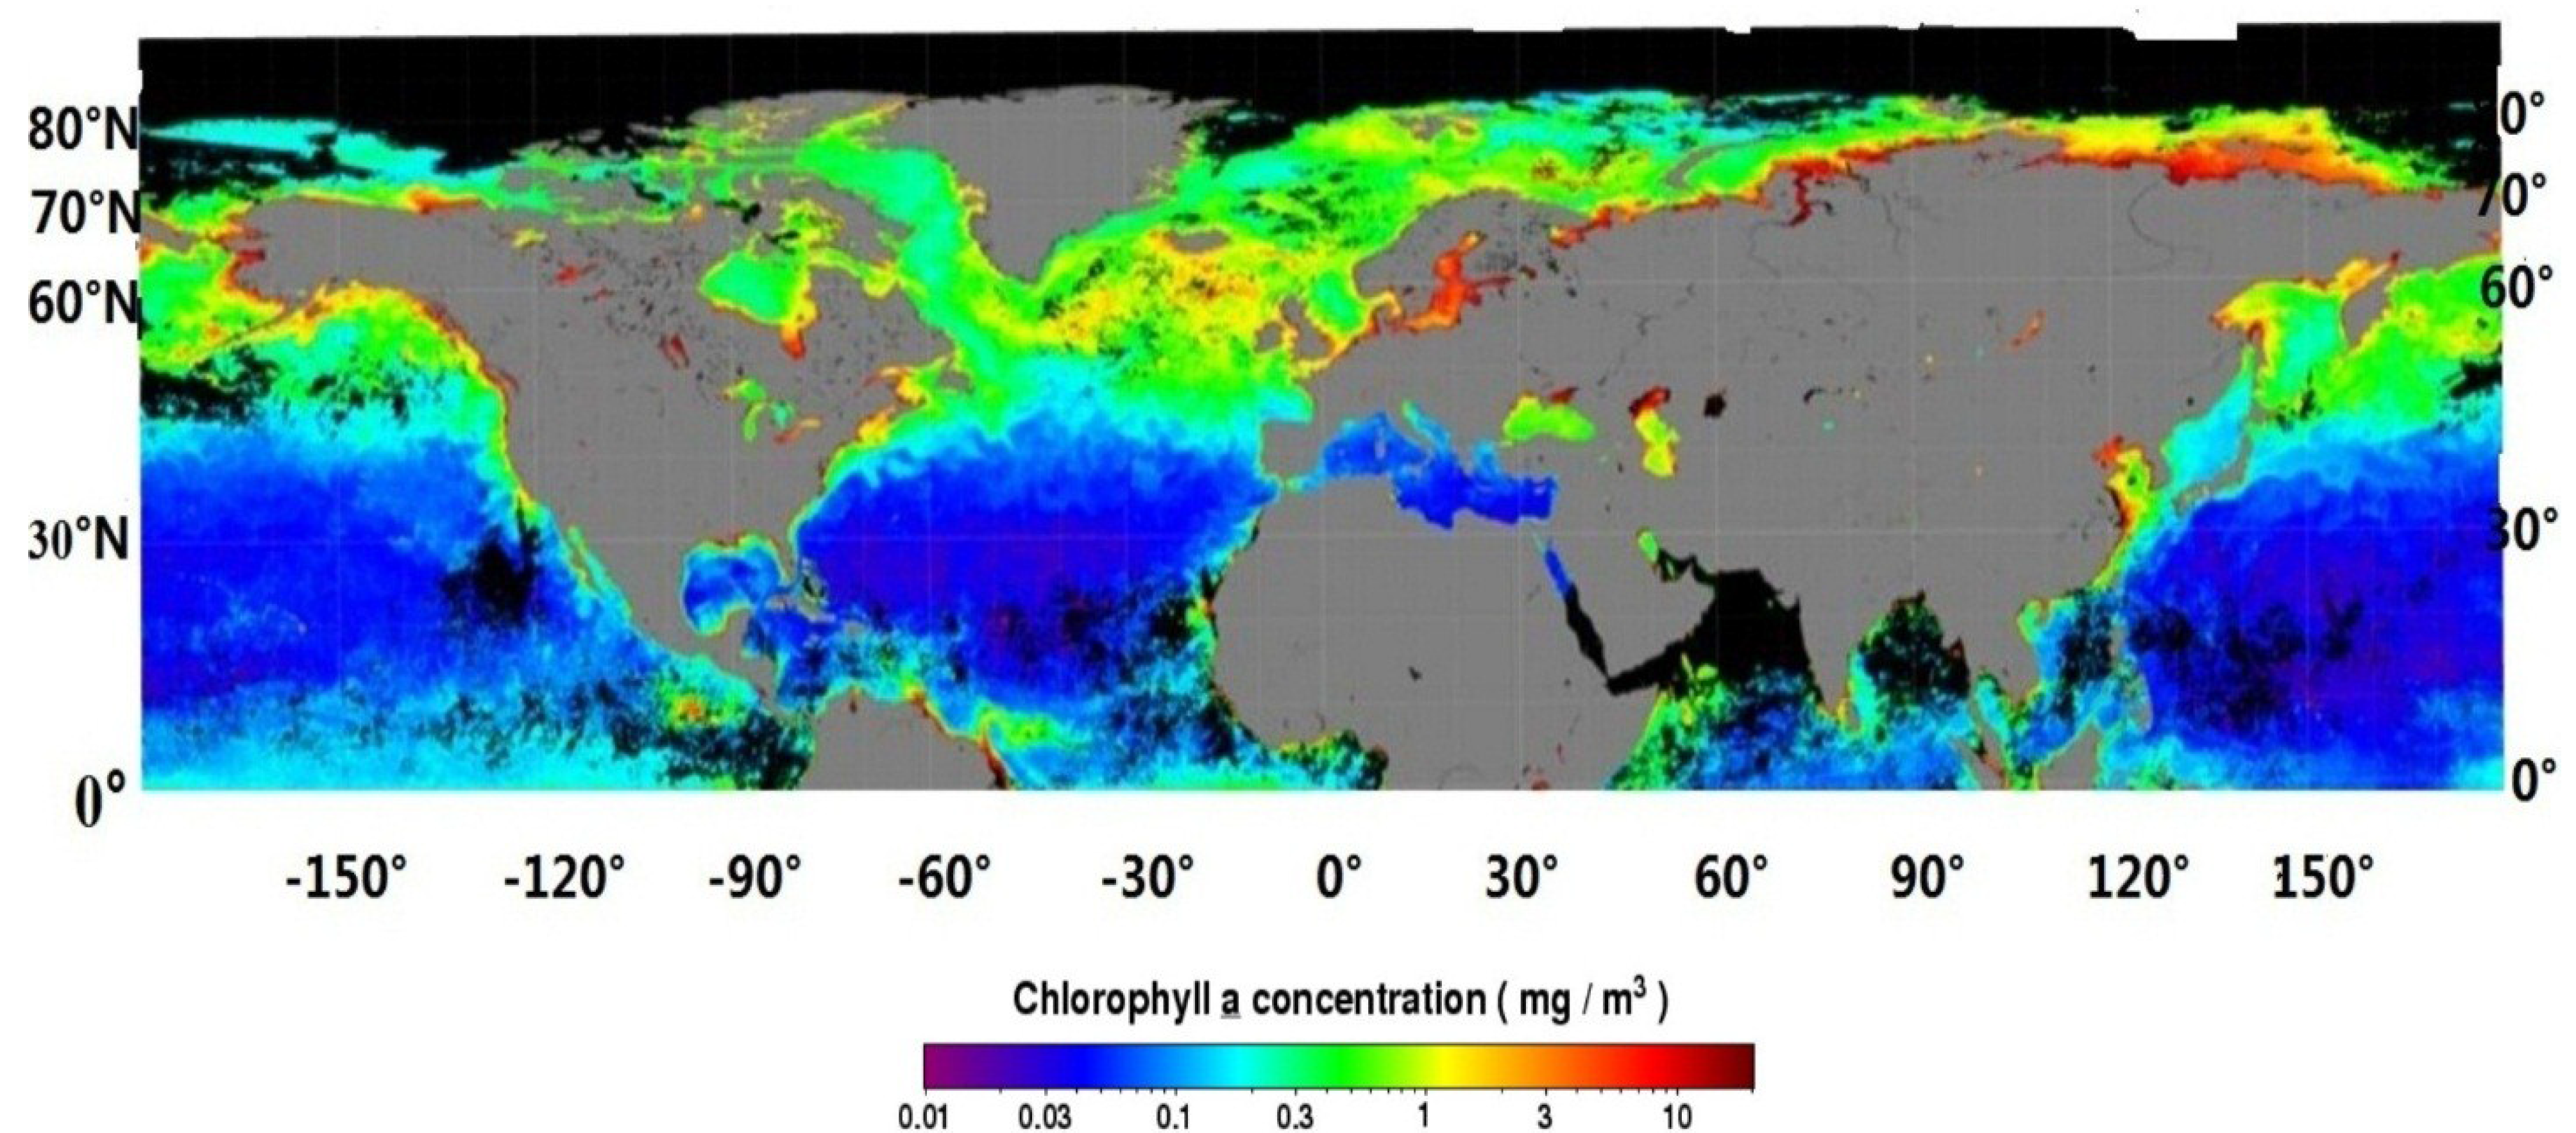
3.3.1. Phytoplankton

As shown in Figure 2 and Table 1, the aerosol MSA exhibited obvious regional variations along the cruise. High MSA concentrations were found over the Norwegian Sea and low MSA levels were observed over the central Arctic Ocean. Due to MSA being mainly derived from marine biogenic emissions, we should first discuss the role of primary productivity on the distribution of MSA. As is well known, Chlorophyll-a is frequently used as a proxy for phytoplankton primary productivity. Based on Figure 3, we estimated that the primary productivity in August 2012 in the Norwegian Sea (69°N–75°N, 2°E–34°E) was more abundant than that in the central Arctic Ocean (80°N–87°N, 170°W–138°E), which is consistent with a previous study that showed that the Norwegian Sea had very high rates of phytoplankton primary productivity [28].
Figure 3. Map of oceanic Chlorophyll-a concentrations in the Northern Hemisphere. Chl-a concentrations for August 2012. The map was acquired from the NASA Ocean color website (http://oceancolor.gsfc.nasa.gov).
Atmosphere 06 00699 g003
Note: Sample sites with longitudes west and east are denoted as “-” and “+”, respectively.

3.3.2. Phytoplankton Composition
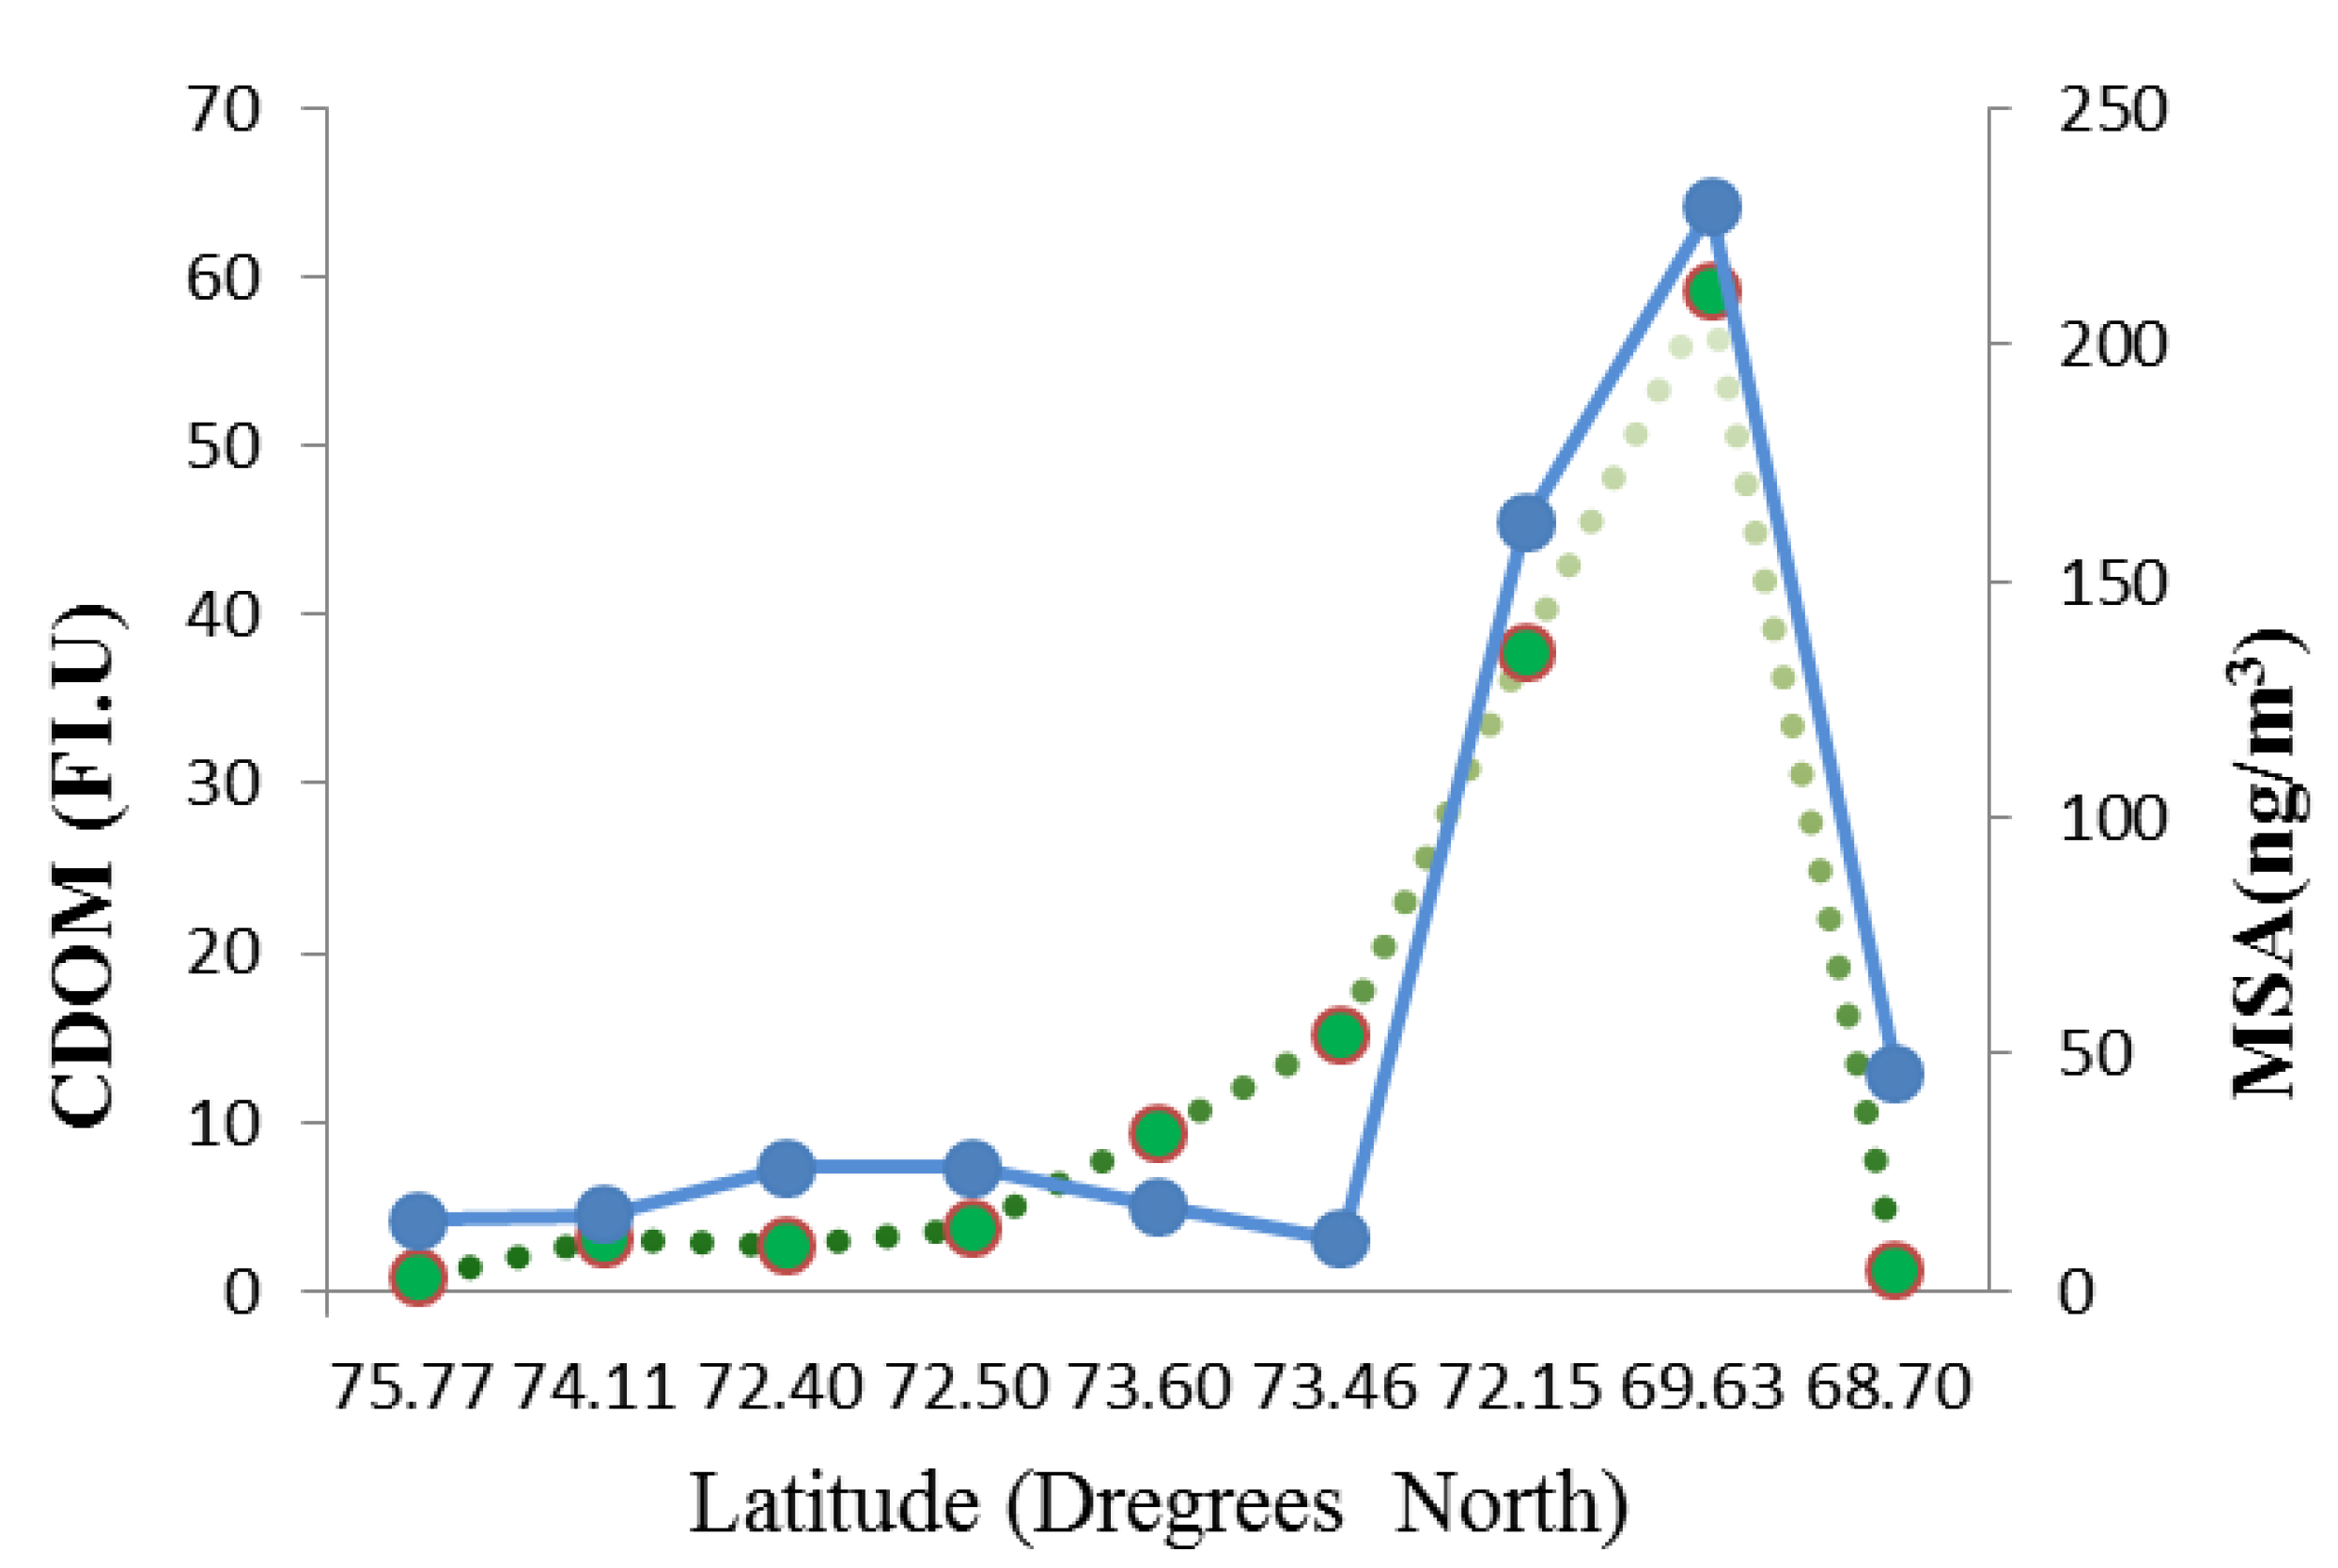
The use of only Chlorophyll-a is not sufficient to properly estimate the phytoplankton contribution to the oceanic DMS emissions because different phytoplankton species produce different organic substances [29]. For example, the prymnesiophyte Phaeocystis pouchetii is the important producer of DMS, the precursor of MSA [30]. Although diatoms can also produce DMS, they produce less DMS compared with the prymnesiophyte Phaeocystis pouchetii [30,31]. Significantly, the prymnesiophyte Phaeocystis pouchetii was quantitatively the most important species in the Norwegian Sea [32]. A high wind speed was recorded over the Norwegian Sea (Table A1). A high wind speed would accelerate the sea-air exchange of DMS [33]. Thus, high concentrations of MSA over the Norwegian Sea may be ascribed to the existence of relatively high Phaeocystis concentrations and high DMS fluxes. The central Arctic Ocean, however, was notably different from the Norwegian Sea because in the central Arctic Ocean, the ice-cover consists of multiyear ice, and diatom Nitzschia frigida, which is a dominant species [34], only produces limited DMS [31].

3.3.3. CDOM

The MSA concentrations over the Norwegian Sea increased sharply around 70°N–73°N, 2°E–7°E (Figure 2). The resolution of Figure 3 was not sufficiently high that the Chlorophyll-a aspects could be determined from such a small spatial scale to explain the MSA concentrations. Significantly, a sharp increase in the CDOM concentrations coincided with increased MSA concentrations in this region (Figure 4). Furthermore, CDOM concentrations in the Norwegian Sea were higher than the other regions along the cruise, corresponding with relatively high MSA concentrations over the Norwegian Sea (Table A1).
Figure 4. Colored dissolved organic matter (CDOM) (dotted line) and MSA (continuous line) over the Norwegian Sea during CHINARE 2012.
Atmosphere 06 00699 g004
Normally, CDOM is produced by phytoplankton and microbial humification [35,36]. The degradation of CDOM by sunlight causes CDOM to release nitrogen-rich compounds that are the necessary nutrients for phytoplankton growth [37]. Previous studies showed that Chlorophyll-a is a significant indicator of the intensity of CDOM absorption during summer [38,39], suggesting that the concentration of CDOM can reflect the primary productivity to a certain degree. In addition, MSA is frequently used to estimate the marine biogenic production [7,8]. Thus, the increased MSA concentrations around 70°N–73°N, 2°E–7°E were probably related to the high CDOM concentrations in this area.

3.4. The Role of Abiotic Factors
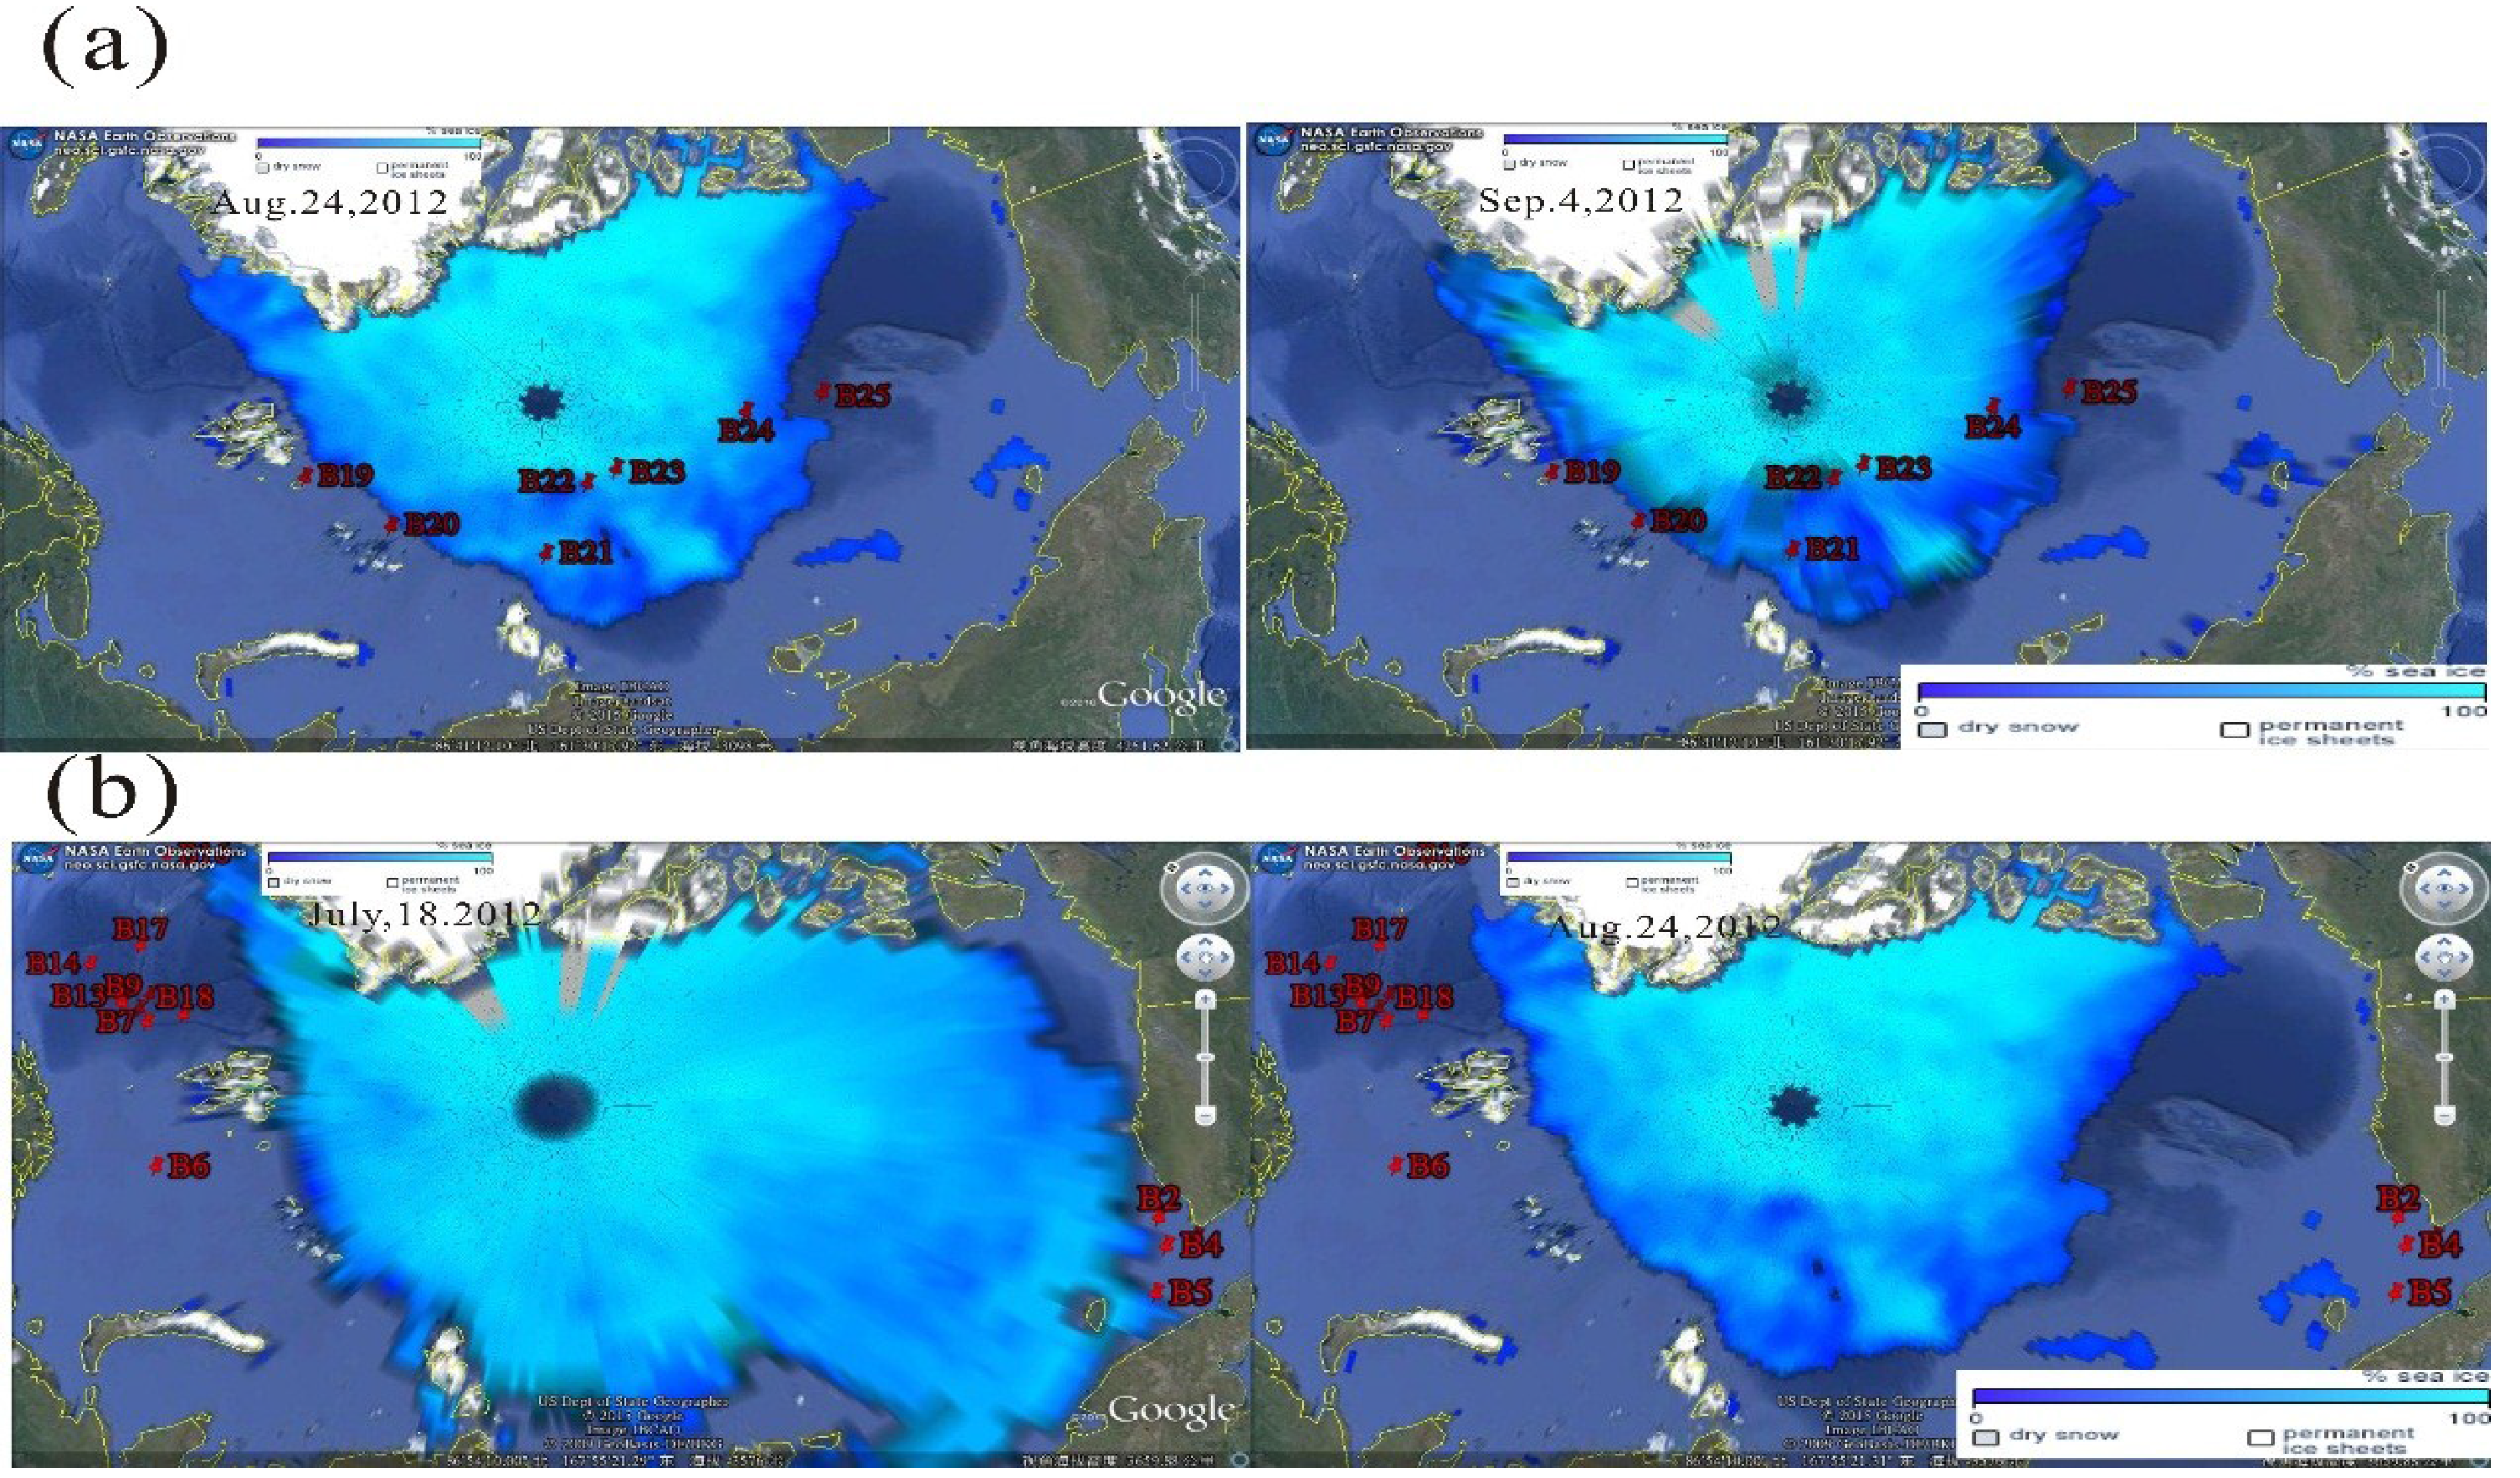
3.4.1. Sea Ice

A notable characteristic of the central Arctic Ocean is that it is covered with multiyear ice. Ice cover strongly affects marine biota, air-sea exchanges and thus climate [40]. As shown in Table 1 and Figure 5a (http://nsidc.org/data/seaice_index/archives.html), relatively low MSA concentrations were observed when the ship passed through the ice-covered region in the central Arctic Ocean during our sampling episodes, implying that sea ice may have played an important role in the spatial distribution of MSA. The sea ice contains ice algae [41], which might emit large amount of DMS; however, diatoms comprise an important part of the ice algal community [41] and these produce few DMS compared with the prymnesiophyte Phaeocystis pouchetii [31]. In addition, DMS is located mainly at the bottom of the sea ice [42], and sea ice is a physical barrier that limits DMS air-sea exchange [13,43]. Previous reports also found DMS and MSA concentrations are significantly negatively correlated with the sea ice extent [11,12].
The MSA concentrations over the central Arctic Ocean with pack ice were lower than over the open waters at the ice edge in the Chukchi Sea. The sampling sites in the Chukchi Sea shown in Figure 5b were at the ice edge, which would be influenced by the ice-melting water during this period. DMS at the bottom of the ice sheet were always at a maximum relative to the other parts of the ice sheet [42]. When the sea ice decays, DMS at the bottom of the ice sheet could act as a DMS hot spot, resulting in the transfer of high concentrations of DMS to the surrounding water, and thus DMS in the open water near the ice edge could increase [42,44]. In addition, ice algae can provide a starter community for phytoplankton growth in the water column [45]. Furthermore, melting sea ice may serve as a source of organic matter and micronutrients [46]. With global warming, the Arctic sea ice area has decreased at a rate of 2.7% per decade [17], which will influence the primary production and sea-air exchange of biogenic compounds in the Arctic Ocean [11].
Figure 5. Maps of sea ice distribution during our sampling episodes, and the sampling sites are displayed in each map. (a) Samples B19-B25 were collected over the central Arctic Ocean. The ship entered the central Arctic Ocean on August 24 and left this area on 4 September 2012; (b) Samples B1-B5 collected over the Chukchi Sea started from 18 July 2012, and samples B7-B18 collected over the Norwegian Sea ended on 24 August 2012 (Sea ice images were downloaded from the NASA Ocean by Ross Swick, National Snow and Ice Data Center (NSIDC) in Boulder, Colorado. http://neo.sci.gsfc.nasa.gov).
Atmosphere 06 00699 g005

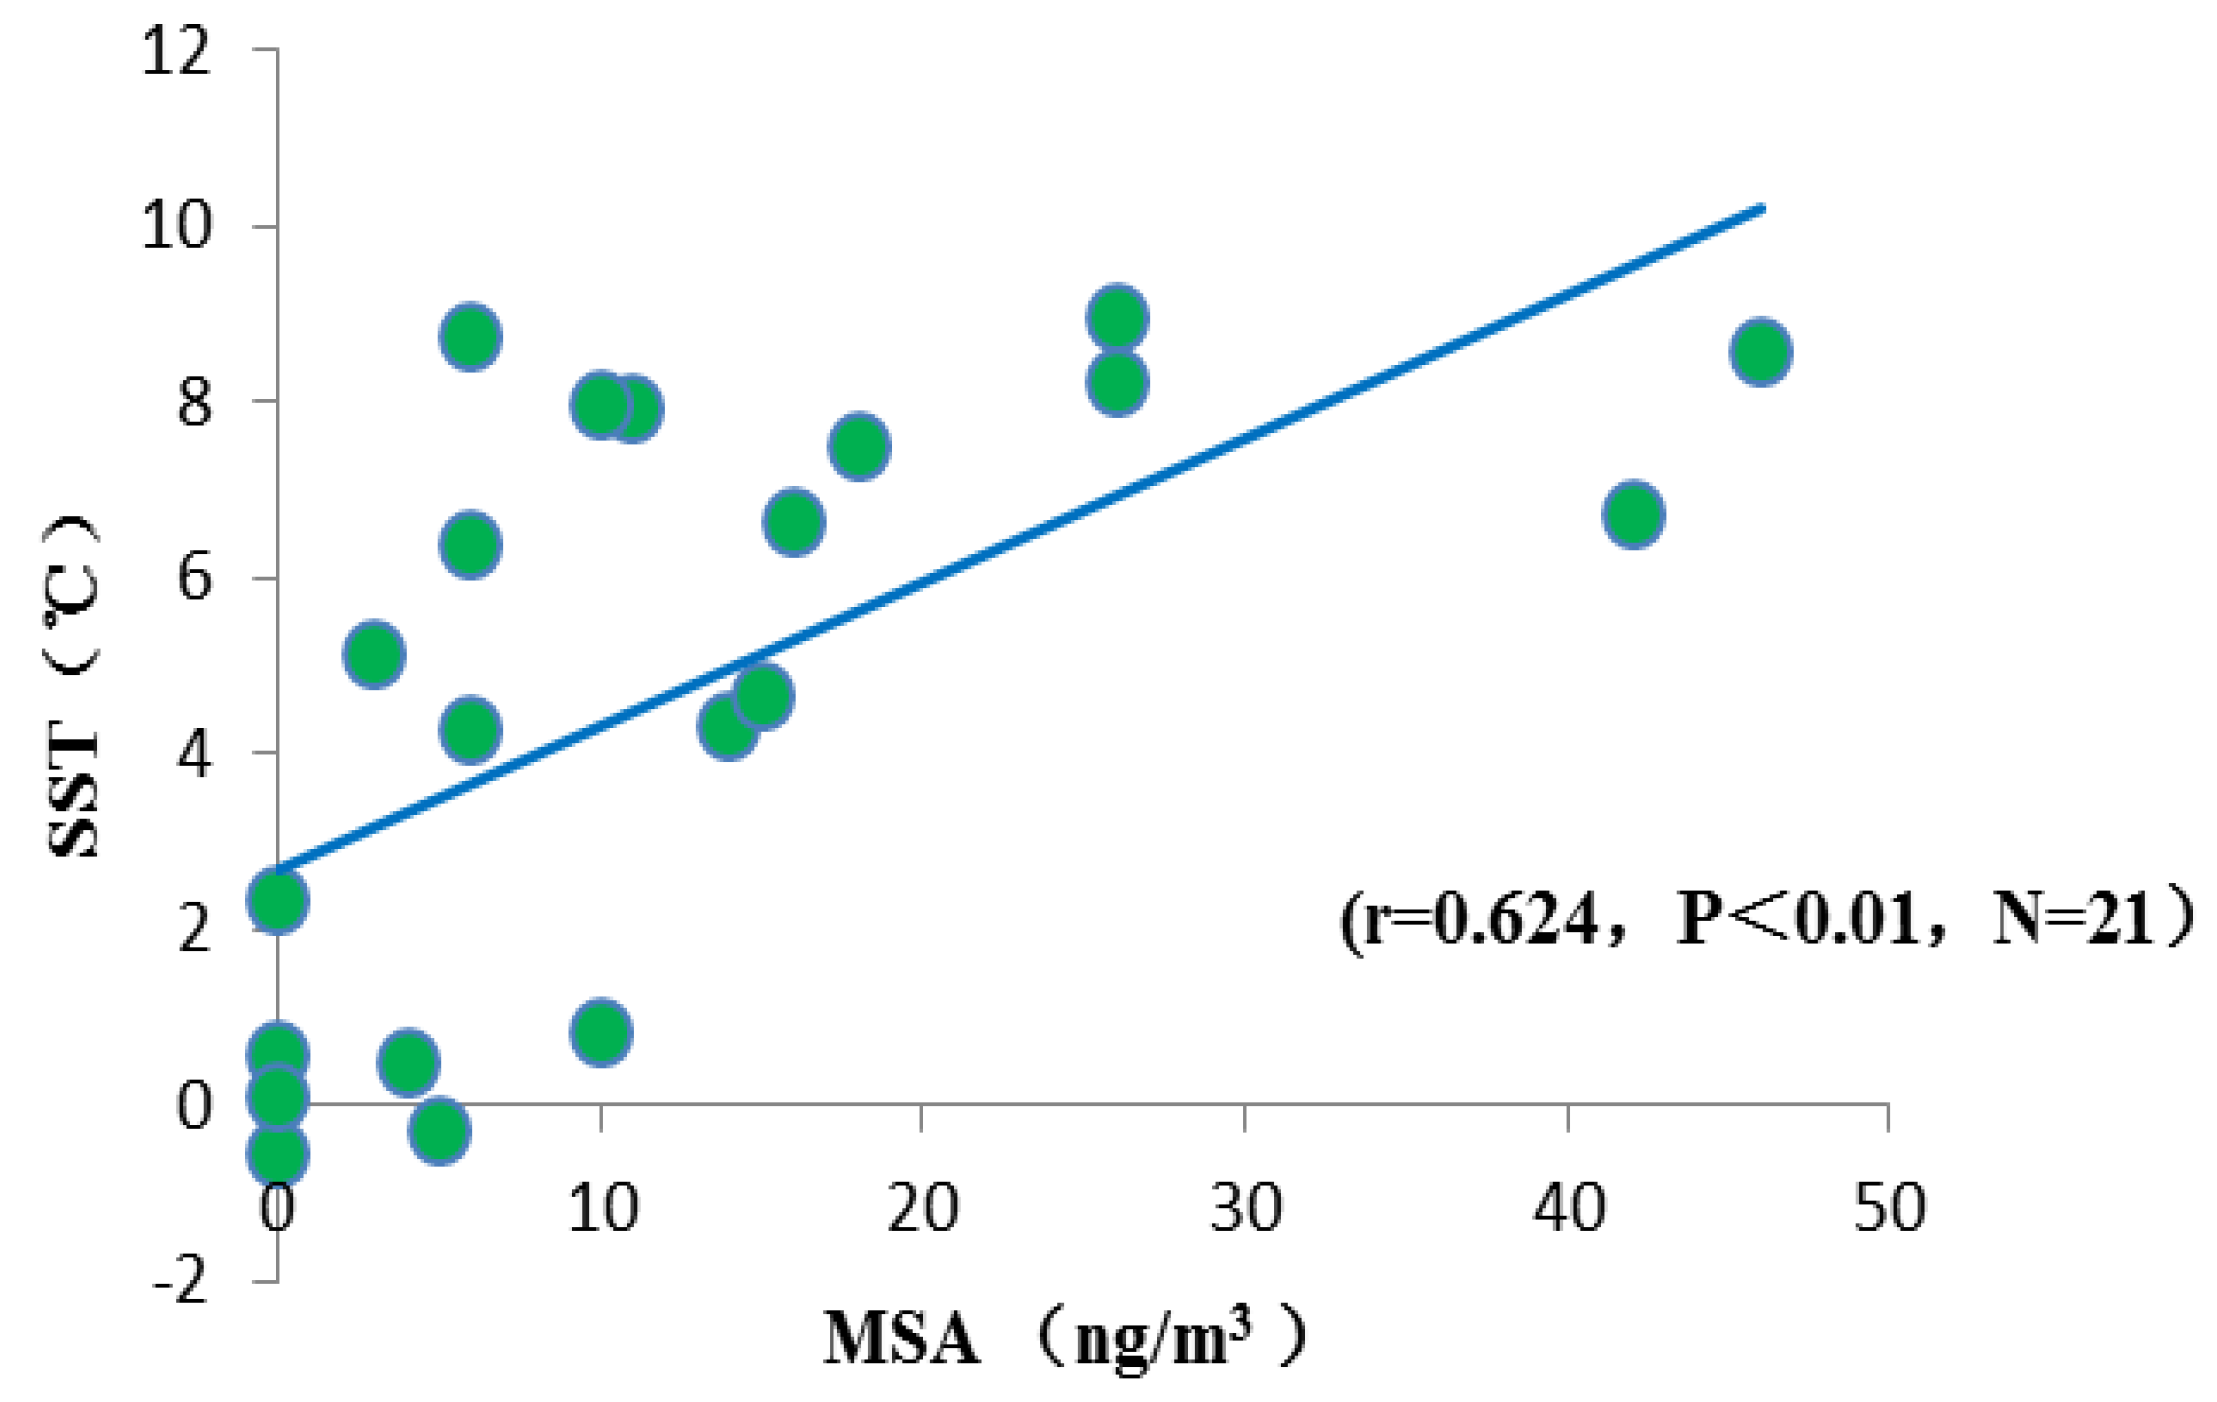
3.4.2. Sea Surface Temperature

Previous studies have shown that lower temperature may lead to a higher yield of MSA [47]. However, this theory of the MSA production mechanism at low temperature has been questioned [48,49]. It has been reported that high MSA concentrations tend to be associated with warmer SSTs because warmer and more open waters will stimulate primary productivity, increasing DMS concentrations and DMS fluxes, and leading to increased MSA concentrations in the air [50]. These results match those presented by Gabric et al., (2005) who simulated DMS production in response to global warming in the Arctic Ocean and found that increased SST and diminishing sea ice coverage could increase the DMS flux [11]. Laing et al., (2013) studied long-term MSA trends and found a positive relationship with SST in Arctic Finland (r2 = 0.200, p < 0.001) [50]. Here, we have presented the MSA and SST data from the duration of the cruise. Within such a relatively short time scale, we also found higher MSA concentrations were associated with warmer SST, and a positive correlation between MSA and SST was observed (r = 0.520, p < 0.05). If the two abnormally high samples (B13 and B14) are removed, the correlation becomes more significant (r = 0.642, p = 0.001, n = 21, Figure 6).
Figure 6. The relationship between MSA and sea surface temperature (SST) during CHINARE 2012 along the cruise path in the Arctic Ocean.
Atmosphere 06 00699 g006

4. Summary

During the fifth CHINARE in July to September 2012, the aerosol MSA concentrations over the Arctic Ocean varied considerably and ranged from non-detectable to 229 ng/m3, with an average of 27 ± 54 ng/m3 (median: 10 ng/m3). We found the distribution of aerosol MSA over the Arctic Ocean exhibited an obvious regional variation. Combined with previous reports that mention the factors that influence the MSA distribution, we found aerosol MSA over the Arctic Ocean was mainly affected by biotic and abiotic factors. High values (60 ± 80 ng/m3) were generally observed over the Norwegian Sea; this phenomenon was attributed to high rates of phytoplankton primary productivity and DMS fluxes in this region, which is consistent with the results of a previous study [28]. Sea ice may also have a significant impact on MSA distributions, and the MSA concentrations over the pack ice region in the central Arctic Ocean were generally lower than over the open waters at the ice edge in the Chukchi Sea. In addition, we found that higher MSA concentrations were associated with warmer sea surface temperature (SST), and a positive correlation between MSA and SST was observed, similar to the results reported by Laing et al. (2013) [50].

Acknowledgments

This research was supported by grants from the National Natural Science Foundation of China (Project No. 41025020, 41176170), the Program of China Polar Environment Investigation and Assessment (Project No. CHINARE2011-2015) and the Fundamental Research Funds for the Central Universities.

Author Contributions

Zhouqing Xie supervised the research. Juan Yu conducted the field campaign. Peipei Ye and Hui Kang analyzed the samples. Peipei Ye and Zhouqing Xie wrote the manuscript. All authors contributed to the discussion of results.

Appendix

Table A1. Sampling information and concentrations of MSA, CDOM, SST, and Wind speed in the Arctic Ocean during the CHINARE 2012 and CHINARE 2010.
Sample NumberLatitude *Longitude *Sampling DateMSA (ng/m3)CDOM (FI.U)SST (°C)Wind speed (m/s)
B0168.63−168.8518–19 July 2012420.8996.745.6
B0270.16−167.6719–20 July 201260.5726.3810.55
B0469.66−170.6221–22 July 2012140.3814.32513.5
B0569.52−176.0023–24 July 2012100.6260.85512.7
B0675.7734.311–2 August 2012150.8904.6816.4
B0774.119.762–3 August 2012163.0826.6559.9
B0872.405.953–4 August 2012262.7008.249.4
B0972.507.384–5 August 2012263.6648.965.9
B1173.605.396–7 August 2012189.3867.5152.95
B1273.467.827–8 August 20121115.1087.9214.58
B1372.156.548–9 August 201216237.6679.0025.35
B1469.632.919–10 August 201222959.22610.1713.35
B1668.70−13.9321–22 August 2012461.141-14.53
B1771.61−1.3822–23 August 201262.5458.76513.8
B1875.617.5023–24 August 2012102.7737.9913.9
B1979.9621.4224–25 August 2012ND1.6275.1510.05
B2081.8556.7825–26 August 2012ND0.6444.25513.65
B2182.97100.8026–28 August 2012ND0.6620.587.4
B2285.81121.6428–30 August 201250.286-4.9
B2385.85138.3430 August–1 September 2012ND0.000-6.1
B2482.82−175.502 September–4 201240.4170.50521.45
B2580.06−168.854–5 September 2012ND0.226−0.55520.8
B2676.96−170.475–6 September 2012ND0.2170.11516.5
B2770.58−168.917–8 September 2012ND0.9632.3255.7
B2869.31−164.2820–22 July 20105--
B2972.37−156.5825–27 July 20104--
B3075.15−156.8328–30 July 20107--
B3178.59−158.9130 July–Aug.1 2010ND--
B3280.69−162.071–2 August 201012--
B3386.82−179.247–8 August 2010ND--
B3488.16−178.3819–20 August 2010ND--
B3581.15−169.1123–24 August 2010ND--
B3678.76−170.5321–22 August 2010ND--
B3776.26−171.9027–28 August 201043--
B3872.49−169.0329–30 August 2010ND--
Note: * The latitude and longitude represent the mean location of the start and end of each sampling episode. Sample sites in latitude south and north are denoted with “−” and “+”, respectively. Sample sites in longitude west and east are denoted with “−” and “+”, respectively. “ND” means MSA concentrations under the detection limit. “-” means have no information about it. SamplesB1-B5 collected over Chukchi Sea, samples B7–B19 collected over Norwegian Sea, Samples B19–B25 were collected over the central Arctic Ocean, and sample B3, sample B10, sample B15 are field blank samples during the CHINARE 2012.

Conflicts of Interest

The authors declare no conflict of interest.

References

  1. Bates, T.; Lamb, B.; Guenther, A.; Dignon, J.; Stoiber, R. Sulfur emissions to the atmosphere from natural sourees. J. Atmos. Chem. 1992, 14, 315–337. [Google Scholar] [CrossRef]
  2. Jenkins, A.; Dutrieux, P.; Jacobs, S.S.; McPhail, S.D.; Perrett, J.R.; Webb, A.T.; White, D. Observations beneath Pine Island Glacier in West Antarctica and implications for its retreat. Nat. Geosci. 2010, 3, 468–472. [Google Scholar] [CrossRef] [Green Version]
  3. Saltzman, E.; Savoie, D.; Zika, R.; Prospero, J. Methane sulfonic acid in the marine atmosphere. J. Geophys. Res. Ocean. 1983, 88, 10897–10902. [Google Scholar] [CrossRef]
  4. Charlson, R.J.; Lovelock, J.E.; Andreae, M.O.; Warren, S.G. Oceanic phytoplankton, atmospheric sulphur, cloud albedo and climate. Nature 1987, 326, 655–661. [Google Scholar] [CrossRef]
  5. Legrand, M.; Saigne, C.F. Methanesulfonic acid in south polar snow layers: A record of strong El Nino? Geophys. Res. Lett. 1991, 18, 187–190. [Google Scholar] [CrossRef]
  6. Davis, D.; Chen, G.; Bandy, A.; Thornton, D.; Eisele, F.; Mauldin, L.; Tanner, D.; Lenschow, D.; Fuelberg, H.; Huebert, B. Dimethyl sulfide oxidation in the equatorial Pacific: Comparison of model simulations with field observations for DMS, SO2, H2SO4 (g), MSA (g), MS and NSS. J. Geophys. Res. Atmos. 1999, 104, 5765–5784. [Google Scholar] [CrossRef]
  7. Savoie, D.L.; Arimoto, R.; Keene, W.C.; Prospero, J.M.; Duce, R.A.; Galloway, J.N. Marine biogenic and anthropogenic contributions to non-sea-salt sulfate in the marine boundary layer over the North Atlantic Ocean. J. Geophys. Res. Atmos. 2002, 107, 4356–4366. [Google Scholar] [CrossRef]
  8. Curran, M.A.; van Ommen, T.D.; Morgan, V.I.; Phillips, K.L.; Palmer, A.S. Ice core evidence for Antarctic sea ice decline since the 1950s. Science 2003, 302, 1203–1206. [Google Scholar] [CrossRef] [PubMed]
  9. Isaksson, E.; Kekonen, T.; Moore, J.; Mulvaney, R. The methanesulfonic acid (MSA) record in a Svalbard ice core. Ann. Glaciol. 2005, 42, 345–351. [Google Scholar] [CrossRef]
  10. Saltzman, E.S.; Dioumaeva, I.; Finley, B.D. Glacial/interglacial variations in methanesulfonate (MSA) in the Siple Dome ice core, West Antarctica. Geophys. Res. Lett. 2006, 33. [Google Scholar] [CrossRef]
  11. Gabric, A.J.; Qu, B.; Matrai, P.; Hirst, A.C. The simulated response of dimethylsulfide production in the Arctic Ocean to global warming. Tellus B 2005, 57, 391–403. [Google Scholar] [CrossRef]
  12. Sharma, S.; Chan, E.; Ishizawa, M.; Toom-Sauntry, D.; Gong, S.; Li, S.; Tarasick, D.; Leaitch, W.; Norman, A.; Quinn, P. Influence of transport and ocean ice extent on biogenic aerosol sulfur in the Arctic atmosphere. J. Geophys. Res. Atmos. 2012, 117. [Google Scholar] [CrossRef] [Green Version]
  13. Leck, C.; Persson, C. Seasonal and short-term variability in dimethyl sulfide, sulfur dioxide and biogenic sulfur and sea salt aerosol particles in the arctic marine boundary layer during summer and autumn. Tellus B 1996, 48, 272–299. [Google Scholar] [CrossRef]
  14. O’Dwyer, J.; Isaksson, E.; Vinje, T.; Jauhiainen, T.; Moore, J.; Pohjola, V.; Vaikmäe, R.; van de Wal, R.S.W. Methanesulfonic acid in a Svalbard Ice Core as an indicator of ocean climate. Geophys. Res. Lett. 2000, 27, 1159–1162. [Google Scholar] [CrossRef]
  15. Chen, L.; Wang, J.; Gao, Y.; Xu, G.; Yang, X.; Lin, Q.; Zhang, Y. Latitudinal distributions of atmospheric MSA and MSA/nss-SO42- ratios in summer over the high latitude regions of the Southern and Northern Hemispheres. J. Geophys. Res. 2012, 117. [Google Scholar] [CrossRef]
  16. ACIA. Arctic Climate Impact Assessment. Cambridge University Press: Cambridge, UK, 2005. [Google Scholar]
  17. Forster, P.; Ramaswamy, V.; Artaxo, P.; Berntsen, T.; Betts, R.; Fahey, D.W.; Haywood, J.; Lean, J.; Lowe, D.C.; Myhre, G.; et al. Changes in Atmospheric Constituents and in Radiative Forcing. In Climate Change 2007: The Physical Science Basis; Cambridge University Press: Cambridge, UK, 2007. [Google Scholar]
  18. Gao, Y.; Arimoto, R.; Duce, R.; Chen, L.; Zhou, M.; Gu, D. Atmospheric non-sea-salt sulfate, nitrate and methanesulfonate over the China Sea. J. Geophys. Res. Atmos. 1996, 101, 12601–12611. [Google Scholar] [CrossRef]
  19. Xie, Z.Q.; Sun, L.G.; Wang, J.J.; Liu, B.Z. A potential source of atmospheric sulfur from penguin colony emissions. J. Geophys. Res. Atmos. 2002, 107, ACH 5-1–ACH 5-10. [Google Scholar]
  20. Berresheim, H. Biogenic sulfur emissions from the Subantarctic and Antarctic Oceans. J. Geophys. Res. Atmos. 1987, 92, 13245–13262. [Google Scholar] [CrossRef]
  21. Li, S.M.; Barrie, L.A.; Sirois, A. Biogenic sulfur aerosol in the Arctic troposphere: 2. Trends and seasonal variations. J. Geophys. Res. Atmos. 1993, 98, 20623–20631. [Google Scholar] [CrossRef]
  22. Xie, Z.; Sun, L.; Jihong, C. Non-sea-salt sulfate in the marine boundary layer and its possible impact on chloride depletion. Acta Oceanol. Sinica 2005, 24, 162–171. [Google Scholar]
  23. Rempillo, O.; Seguin, A.; Norman, A. Shipboard measurement of atmospheric DMS and its oxidation products over the Canadian Arctic. In Proceedings of the AGU Fall Meeting 2009, San Francisco, CA, USA, 14–18 December 2009.
  24. Li, S.M.; Barrie, L.A. Biogenic sulfur aerosol in the Arctic troposphere: 1. Contributions to total sulfate. J. Geophys. Res. Atmos. 1993, 98, 20613–20622. [Google Scholar] [CrossRef]
  25. Savoie, D.; Prospero, J.; Larsen, R.; Huang, F.; Izaguirre, M.; Huang, T.; Snowdon, T.; Custals, L.; Sanderson, C. Nitrogen and sulfur species in Antarctic aerosols at Mawson, Palmer station, and Marsh (King George Island). J. Atmos. Chem. 1993, 17, 95–122. [Google Scholar] [CrossRef]
  26. Udisti, R.; Rugi, F.; Becagli, S.; Bolzacchini, E.; Calzolai, G.; Chiari, M.; Frosini, D.; Ghedini, C.; Marconi, M.; Grazia Perrone, M.; et al. Spatial distribution of biogenic sulphur compounds in the Arctic aerosol collected during the AREX 2011 and 2012 Oceania ship cruises. In Proceedings of the EGU General Assembly Conference 2013, Vienna, Austria, 7–12 April 2013.
  27. Savoie, D.L.; Prospero, J.M.; Saltzman, E.S. Non-sea-salt sulfate and nitrate in trade wind aerosols at Barbados: Evidence for long-range transport. J. Geophys. Res. Atmos. 1989, 94, 5069–5080. [Google Scholar] [CrossRef]
  28. Behrenfeld, M.J.; Falkowski, P.G. Photosynthetic rates derived from satellite-based chlorophyll concentration. Limnol. Oceanogr. 1997, 42, 1–20. [Google Scholar] [CrossRef]
  29. Alvain, S.; Moulin, C.; Dandonneau, Y.; Bréon, F.M. Remote sensing of phytoplankton groups in case 1 waters from global SeaWiFS imagery. Deep Sea Res. 2005, 52, 1989–2004. [Google Scholar] [CrossRef] [Green Version]
  30. Belviso, S.; Moulin, C.; Bopp, L.; Stefels, J. Assessment of a global climatology of oceanic dimethylsulfide (DMS) concentrations based on SeaWiFS imagery (1998–2001). Can. J. Fish. Aquat. Sci. 2004, 61, 804–816. [Google Scholar] [CrossRef]
  31. Vogt, M.; Liss, P. Dimethylsulfide and climate. Geophys. Monogr. Ser. 2009, 197, 197–232. [Google Scholar] [CrossRef]
  32. Degerlund, M.; Eilertsen, H.C. Main species characteristics of phytoplankton spring blooms in NE Atlantic and Arctic waters (68–80 N). Estuaries Coasts 2010, 33, 242–269. [Google Scholar] [CrossRef]
  33. Trevena, A.; Jones, G. DMS flux over the Antarctic sea ice zone. March Chem. 2012, 134, 47–58. [Google Scholar] [CrossRef]
  34. McMinn, A.; Hegseth, E. Quantum yield and photosynthetic parameters of marine microalgae from the southern Arctic Ocean, Svalbard. J. March Biol. Assoc. UK 2004, 84, 865–871. [Google Scholar] [CrossRef]
  35. Rochelle-Newall, E.; Fisher, T. Production of chromophoric dissolved organic matter fluorescence in marine and estuarine environments: an investigation into the role of phytoplankton. March Chem. 2002, 77, 7–21. [Google Scholar] [CrossRef]
  36. Stedmon, C.A.; Markager, S. Tracing the production and degradation of autochthonous fractions of dissolved organic matter by fluorescence analysis. Limnol. Oceanogr. 2005, 50, 1415–1426. [Google Scholar] [CrossRef]
  37. Bushaw, K.L.; Zepp, R.G.; Tarr, M.A.; Schulz-Jander, D.; Bourbonniere, R.A.; Hodson, R.E.; Miller, W.L.; Bronk, D.A.; Moran, M.A. Photochemical release of biologically available nitrogen from aquatic dissolved organic matter. Nature 1996, 381, 404–407. [Google Scholar] [CrossRef]
  38. Kowalczuk, P.; A Stedmon, C.; Markager, S. Modeling absorption by CDOM in the Baltic Sea from season, salinity and chlorophyll. March Chem. 2006, 101, 1–11. [Google Scholar] [CrossRef]
  39. Gabric, A.J.; Qu, B.; Matrai, P.A.; Murphy, C.; Lu, H.; Lin, D.R.; Qian, F.; Zhao, M. Investigating the coupling between phytoplankton biomass, aerosol optical depth and sea-ice cover in the Greenland Sea. Dyn. Atmos.Ocean. 2014, 66, 94–109. [Google Scholar] [CrossRef]
  40. Clarke, D.; Ackley, S. Sea ice structure and biological activity in the Antarctic marginal ice zone. J. Geophys. Res. Ocean. 1984, 89, 2087–2095. [Google Scholar] [CrossRef]
  41. Trevena, A.J.; Jones, G.B. Dimethylsulphide and dimethylsulphoniopropionate in Antarctic sea ice and their release during sea ice melting. March Chem. 2006, 98, 210–222. [Google Scholar] [CrossRef]
  42. Andres, R.; Kasgnoc, A. A time-averaged inventory of subaerial volcanic sulfur emissions. J. Geophys. Res. Atmos. 1998, 103, 25251–25261. [Google Scholar] [CrossRef]
  43. Leck, C.; Persson, C. The central Arctic Ocean as a source of dimethyl sulfide Seasonal variability in relation to biological activity. Tellus B 1996, 48, 156–177. [Google Scholar] [CrossRef]
  44. Tison, J.L.; Brabant, F.; Dumont, I.; Stefels, J. High-resolution dimethyl sulfide and dimethylsulfoniopropionate time series profiles in decaying summer first-year sea ice at Ice Station Polarstern, western Weddell Sea, Antarctica. J. Geophys. Res. Biog. 2010, 115. [Google Scholar] [CrossRef]
  45. Kuosa, H.; Norrman, B.; Kivi, K.; Brandini, F. Effects of Antarctic sea ice biota on seeding as studied in aquarium experiments. Polar biol. 1992, 12, 333–339. [Google Scholar] [CrossRef]
  46. Lannuzel, D.; Schoemann, V.; de Jong, J.; Tison, J.L.; Chou, L. Distribution and biogeochemical behaviour of iron in the East Antarctic sea ice. March Chem. 2007, 106, 18–32. [Google Scholar] [CrossRef]
  47. Bates, T.S.; Calhoun, J.A.; Quinn, P.K. Variations in the methanesulfonate to sulfate molar ratio in submicrometer marine aerosol particles over the South Pacific Ocean. J. Geophys. Res. Atmos. 1992, 97, 9859–9865. [Google Scholar] [CrossRef]
  48. Prospero, J.; Savoie, D.; Saltzman, E.; Larsen, R. Impact of oceanic sources of biogenic sulphur on sulphate aerosol concentrations at Mawson, Antarctica. Nature. 1991, 350. [Google Scholar] [CrossRef]
  49. Wagenbach, D. Coastal Antarctica: Atmospheric Chemical Composition and Atmospheric Transport. In Chemical Exchange between the Atmosphere and Polar Snow; Wolff, E., Bales, R.C., Eds.; Springer: Berlin, Heidelberg, Germany, 1996; pp. 173–199. [Google Scholar]
  50. Laing, J.R.; Hopke, P.K.; Hopke, E.F.; Husain, L.; Dutkiewicz, V.A.; Paatero, J.; Viisanen, Y. Long-term trends of biogenic sulfur aerosol and its relationship with sea surface temperature in Arctic Finland. J. Geophys. Res. Atmos. 2013, 118, 11770–11776. [Google Scholar] [CrossRef]

