Article

Long-Term Measurement for Low-Tropospheric Water Vapor and Aerosol by Raman Lidar in Wuhan

1
State Key Laboratory of Information Engineering in Surveying, Mapping and Remote Sensing (LIESMARS), Wuhan University, Wuhan 430079, China
2
Collaborative Innovation Center for Geospatial Technology, Wuhan 430079, China
3
Hubei Collaborative Innovation Center for High-Efficiency Utilization of Solar Energy, Wuhan 430079, China
4
School of Remote Sensing and Information Engineering, Wuhan University, Wuhan 430079, China
5
School of Resource and Environmental Science of Wuhan University, Wuhan 430079, China
6
School of Science, Hubei University of Technology, Wuhan 430068, China
*
Author to whom correspondence should be addressed.
Atmosphere 2015, 6(4), 521-533; https://doi.org/10.3390/atmos6040521
Submission received: 14 February 2015 / Revised: 26 March 2015 / Accepted: 30 March 2015 / Published: 3 April 2015

Abstract

:
A Raman Lidar (RL) system is developed to measure the water vapor mixing ratio (WVMR) and aerosol optical property in Wuhan with high temporal-spatial resolution during rainless nights. The principle of the self-developed lidar system and data processing method are discussed. WVMR profiles of a representative case retrieved by RL, Radiosonde (RS), and microwave radiometer (MR) are in good agreement. The relationship of WVMR and aerosol optical depth (AOD) indicates that water vapor dramatically reduces with the decline of the AOD. Moreover, the mean relative difference of mean WVMRs at low-troposphere obtained by RL and RS (MR) is about 5.17% (9.47%) during the analyzed year. The agreement certifies that the self-developed RL system can stably provide accurate and high temporal-spatial resolution data for the fundamental physical studies on water vapor. Furthermore, the maximum AOD from 0.5 km to 3 km is 0.41 at night in spring, which indicates that the air quality in Wuhan is heavily influenced by aerosols that are transported by air mass from the north during this time. Moreover, abundant rainfall led to relatively low AOD in summer (0.22), which demonstrates that water vapor is crucial for air purification.

1. Introduction

Atmospheric water vapor and aerosol play crucial roles in the material and hydrological cycles of the Earth’s atmosphere, especially in the low-troposphere. Aerosol is changing rapidly and impacts people’s health and living environment directly [1,2]. In addition, it also affects the atmospheric physical processes, weather, and climate change [3,4]. Water vapor in the atmosphere strongly absorbs terrestrial radiation [5]. Water vapor either emits or absorbs heat continuously during the water phase transition [6]. Water vapor can be condensed into atmospheric particulate matter settlement, which is an important condition for the formation of clouds [7,8,9]. Adequate amounts of water vapor are necessary for abundant rainfall, which is beneficial to air quality and plays a major role in regulating the climate [10]. Thus, accurate measurements of water vapor and aerosol optical properties are crucial to the research on climatic variation, cloud formation, air quality forecasting, and so on [11].
Some instruments have been used to measure water vapor and aerosols in the atmosphere. A variety of passive detection methods, such as microwave radiometer (MRs) [12] and sun photometers [13], provide results with low vertical resolution and they are difficult to obtain the water vapor information changes in detail. Passive instruments, such as sun photometers, can only provide integral information of the whole aerosol layer rather than the vertical profile of aerosol. Radiosonde (RS) can accurately measure moisture, but sounding balloons are costly and typically measure water vapor only once or twice a day. Thus, these equipment do not completely satisfy the water vapor and aerosol research requirements. Therefore, obtaining a high vertical and temporal resolution infomation to study the atmospheric water vapor and aerosol is still an important and difficult task. Raman Lidar (RL) and differential absorption lidar (DIAL) are two kinds of significant technologies to measure tropospheric water vapor and aerosol profiles with high range resolution and accuracy [14]. DIAL utilizes two laser wavelengths, which are, respectively, in the absorption peak and valley, to retrieve the vertical distribution of atmospheric molecular species. For DIAL techniques, extreme sensitivity is the primary advantage, but the structure and technology of DIAL are complicated because stringent accuracy and stability are required for the wavelengths of the emitted lasers [15]. However, RL employs inelastic scattering of atmospheric molecules to retrieve the high vertical and temporal resolution results of the aerosol extinction coefficient (AEC), atmospheric humidity, and temperature in the troposphere [16]. The differences between RL and DIAL have been discussed in detail by Gran [14]. RL have less requirement of laser wavelengths than that of DIAL [15], which has been more extensively used in meteorology study. Thus, we are concentrating on developing and improving RL hardware, software and algorithms for measureing aerosol extinction, backscatter coefficients, and lidar ratio (i.e., extinction to backscatter ratio) in the recent years [17,18,19,20].
In this study, a new RL system is developed based on our previous work. The aim of this paper is to report the accuracy of the newly developed RL for water vapor mixing ratio (WVMR) and the analysis of the long-term variation of water vapor and aerosols during rainless nights. The hardware design and algorithms for the WVMR and aerosol are introduced. The case study shows that the WVMR obtained by RL is consistent with that of RS. A positive correlation is shown between the WVMR and AOD of RL in this case. Moreover, the small mean relative difference of the WVMR between RL and RS (MR) demonstrate that our RL system can accurately measure atmospheric water vapor with high vertical and temporal resolutions. The quarterly mean AOD shows that the AOD in spring is higher than that in other seasons.

2. Site and Instrument
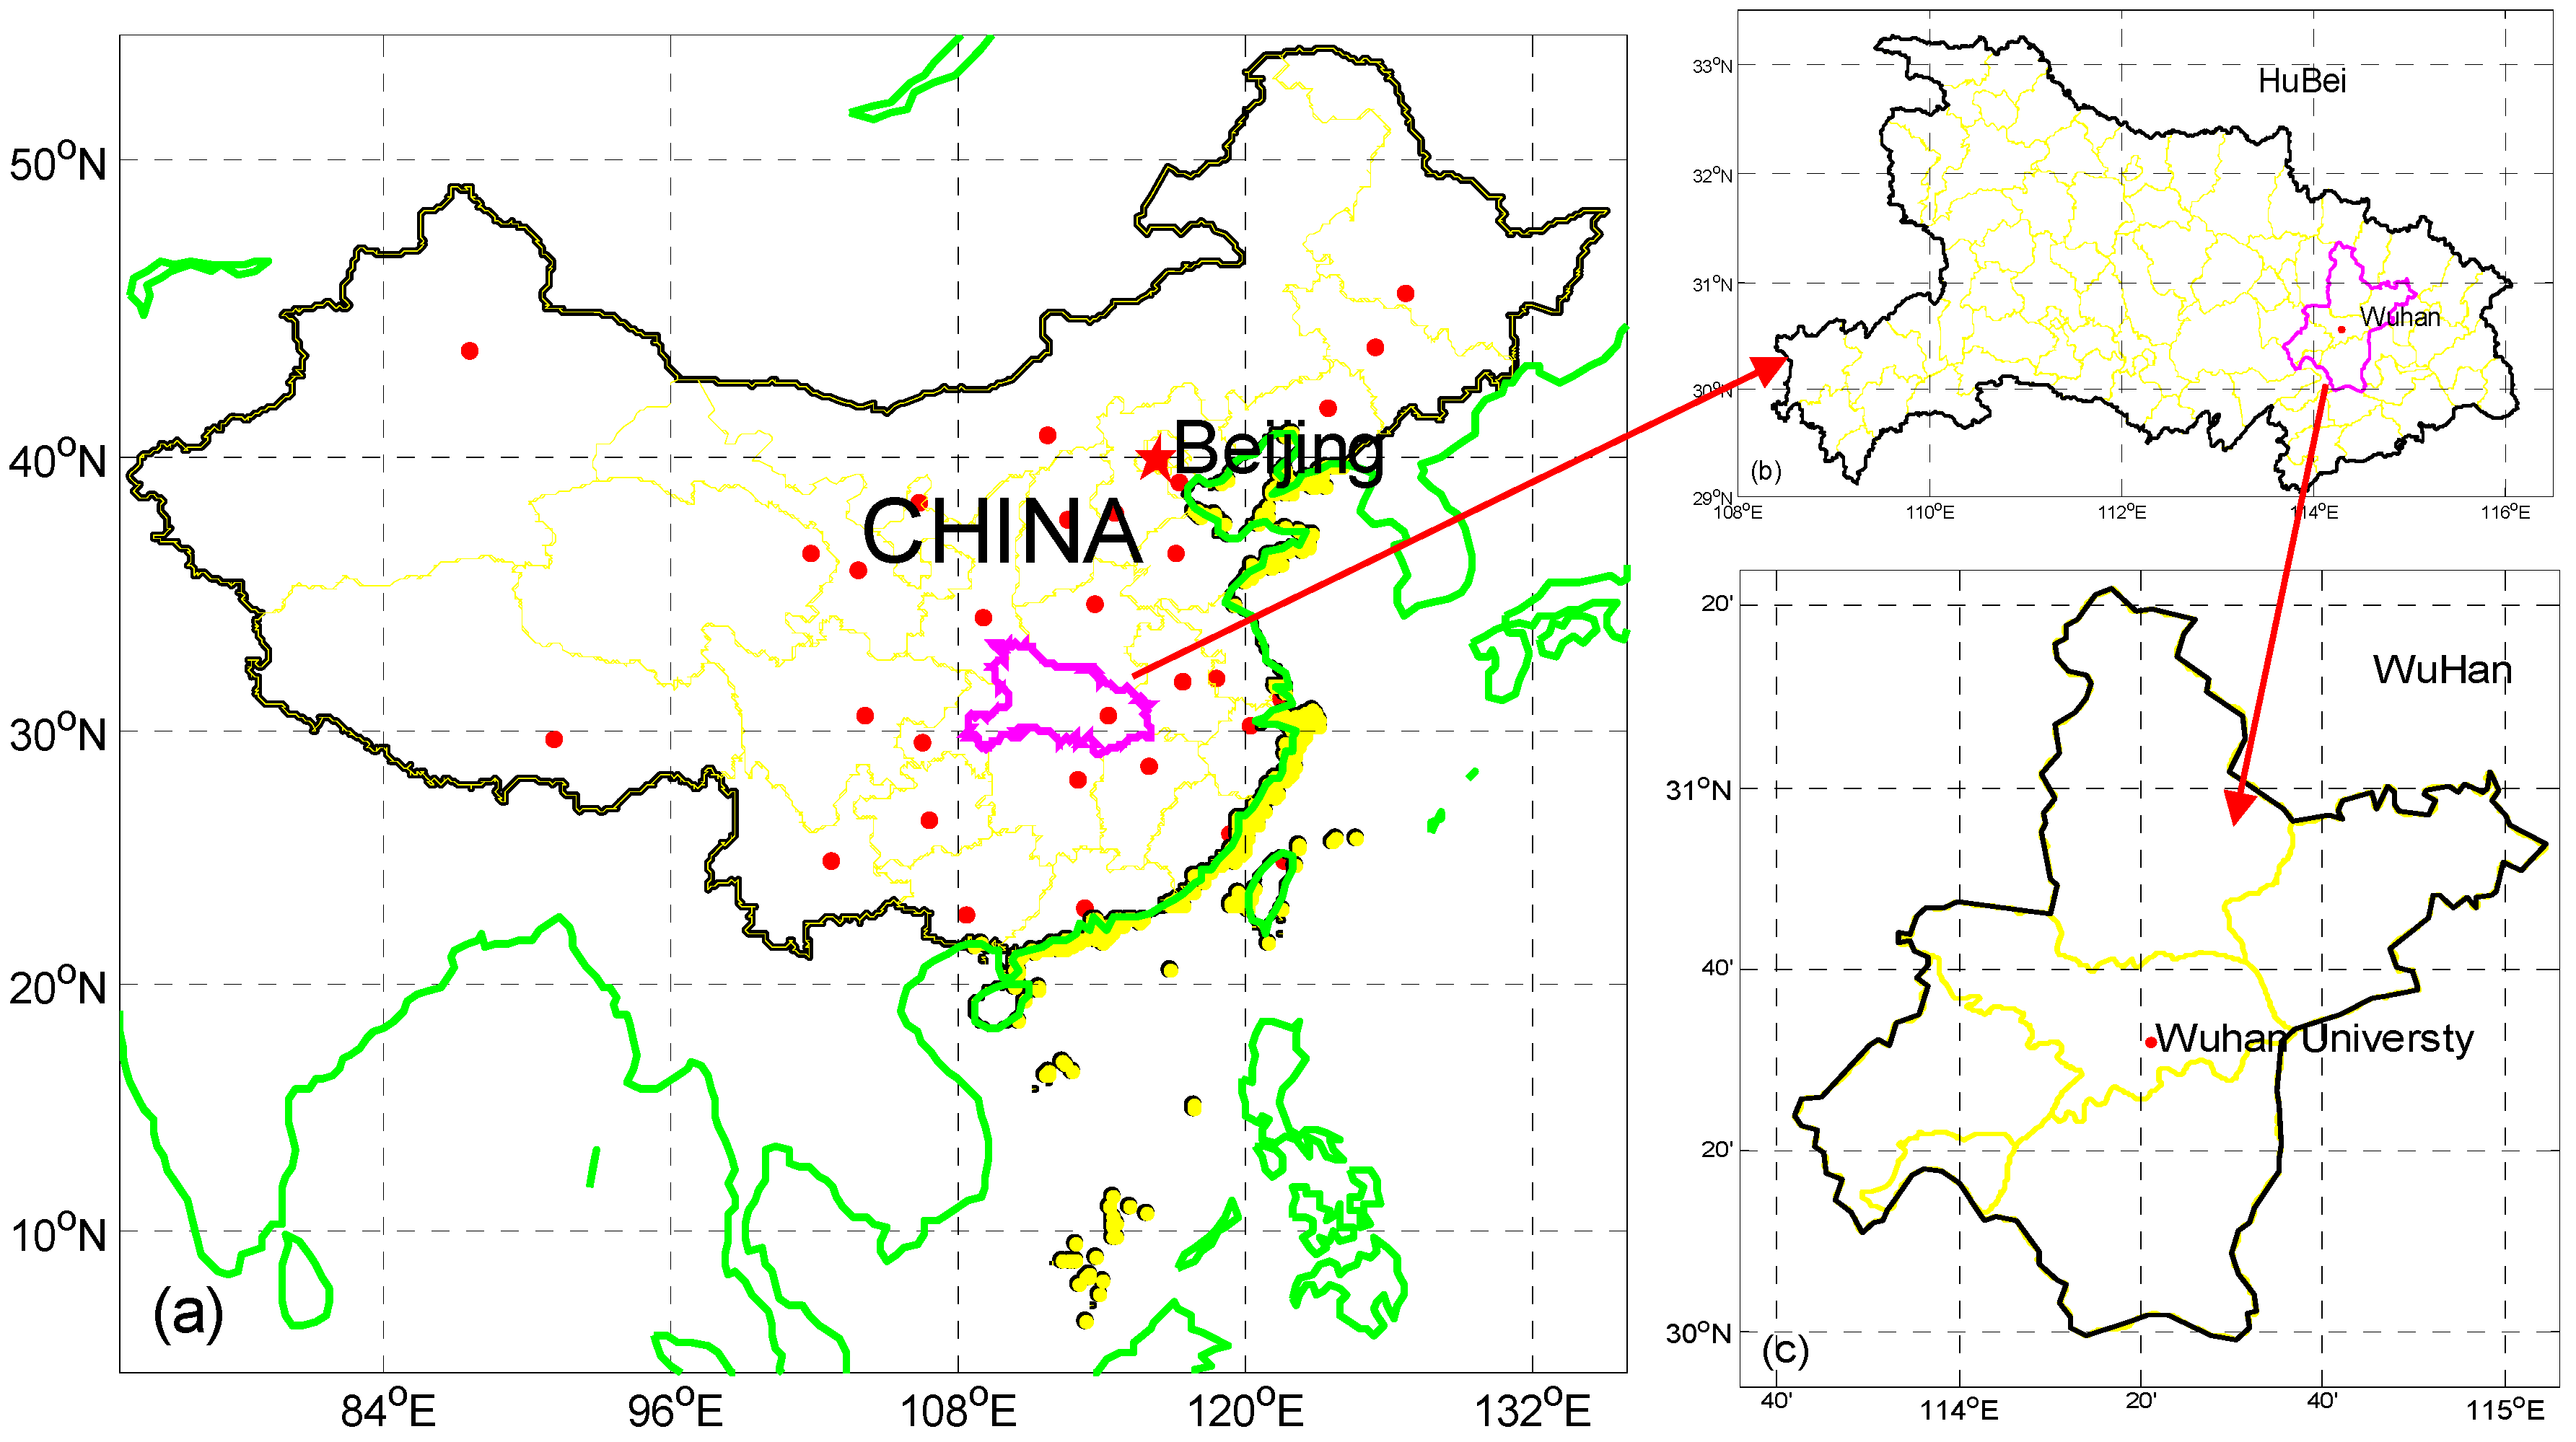
2.1. Site

As shown in Figure 1, the RL and MR is located at the Wuhan University (30°32ʹN, 114°21ʹE), which is in the downtown of Wuhan, China. RS is launched at 30°61ʹN, 114°13ʹE twice a day (specifically, 8:00 a.m. and 8:00 p.m. local time (CST)). The distance between the two sites is about 20 km. Wuhan is the capital city of Hubei Province. Environmental problems have attracted a lot of attention because Wuhan has the largest population and is the most industrialized city in central China [2,21]. However, available methods that measure water vapor and aerosol in Wuhan are limited at present. Wuhan has a subtropical monsoon climate, with abundant cloud cover and rainfall in summer and relatively high air humidity in winter. Moreover, the temperatures are extremely high in summer and very low in winter. Adequate amounts of water vapor are necessary for abundant rainfall, which is beneficial to air quality and plays a major role in regulating the climate in Wuhan.
Figure 1. Location of Wuhan, China: (a) location of Hubei Province in China; (b) location of Wuhan in Hubei Province; and (c) sites of this study in Wuhan (i.e., Wuhan University).
Atmosphere 06 00521 g001

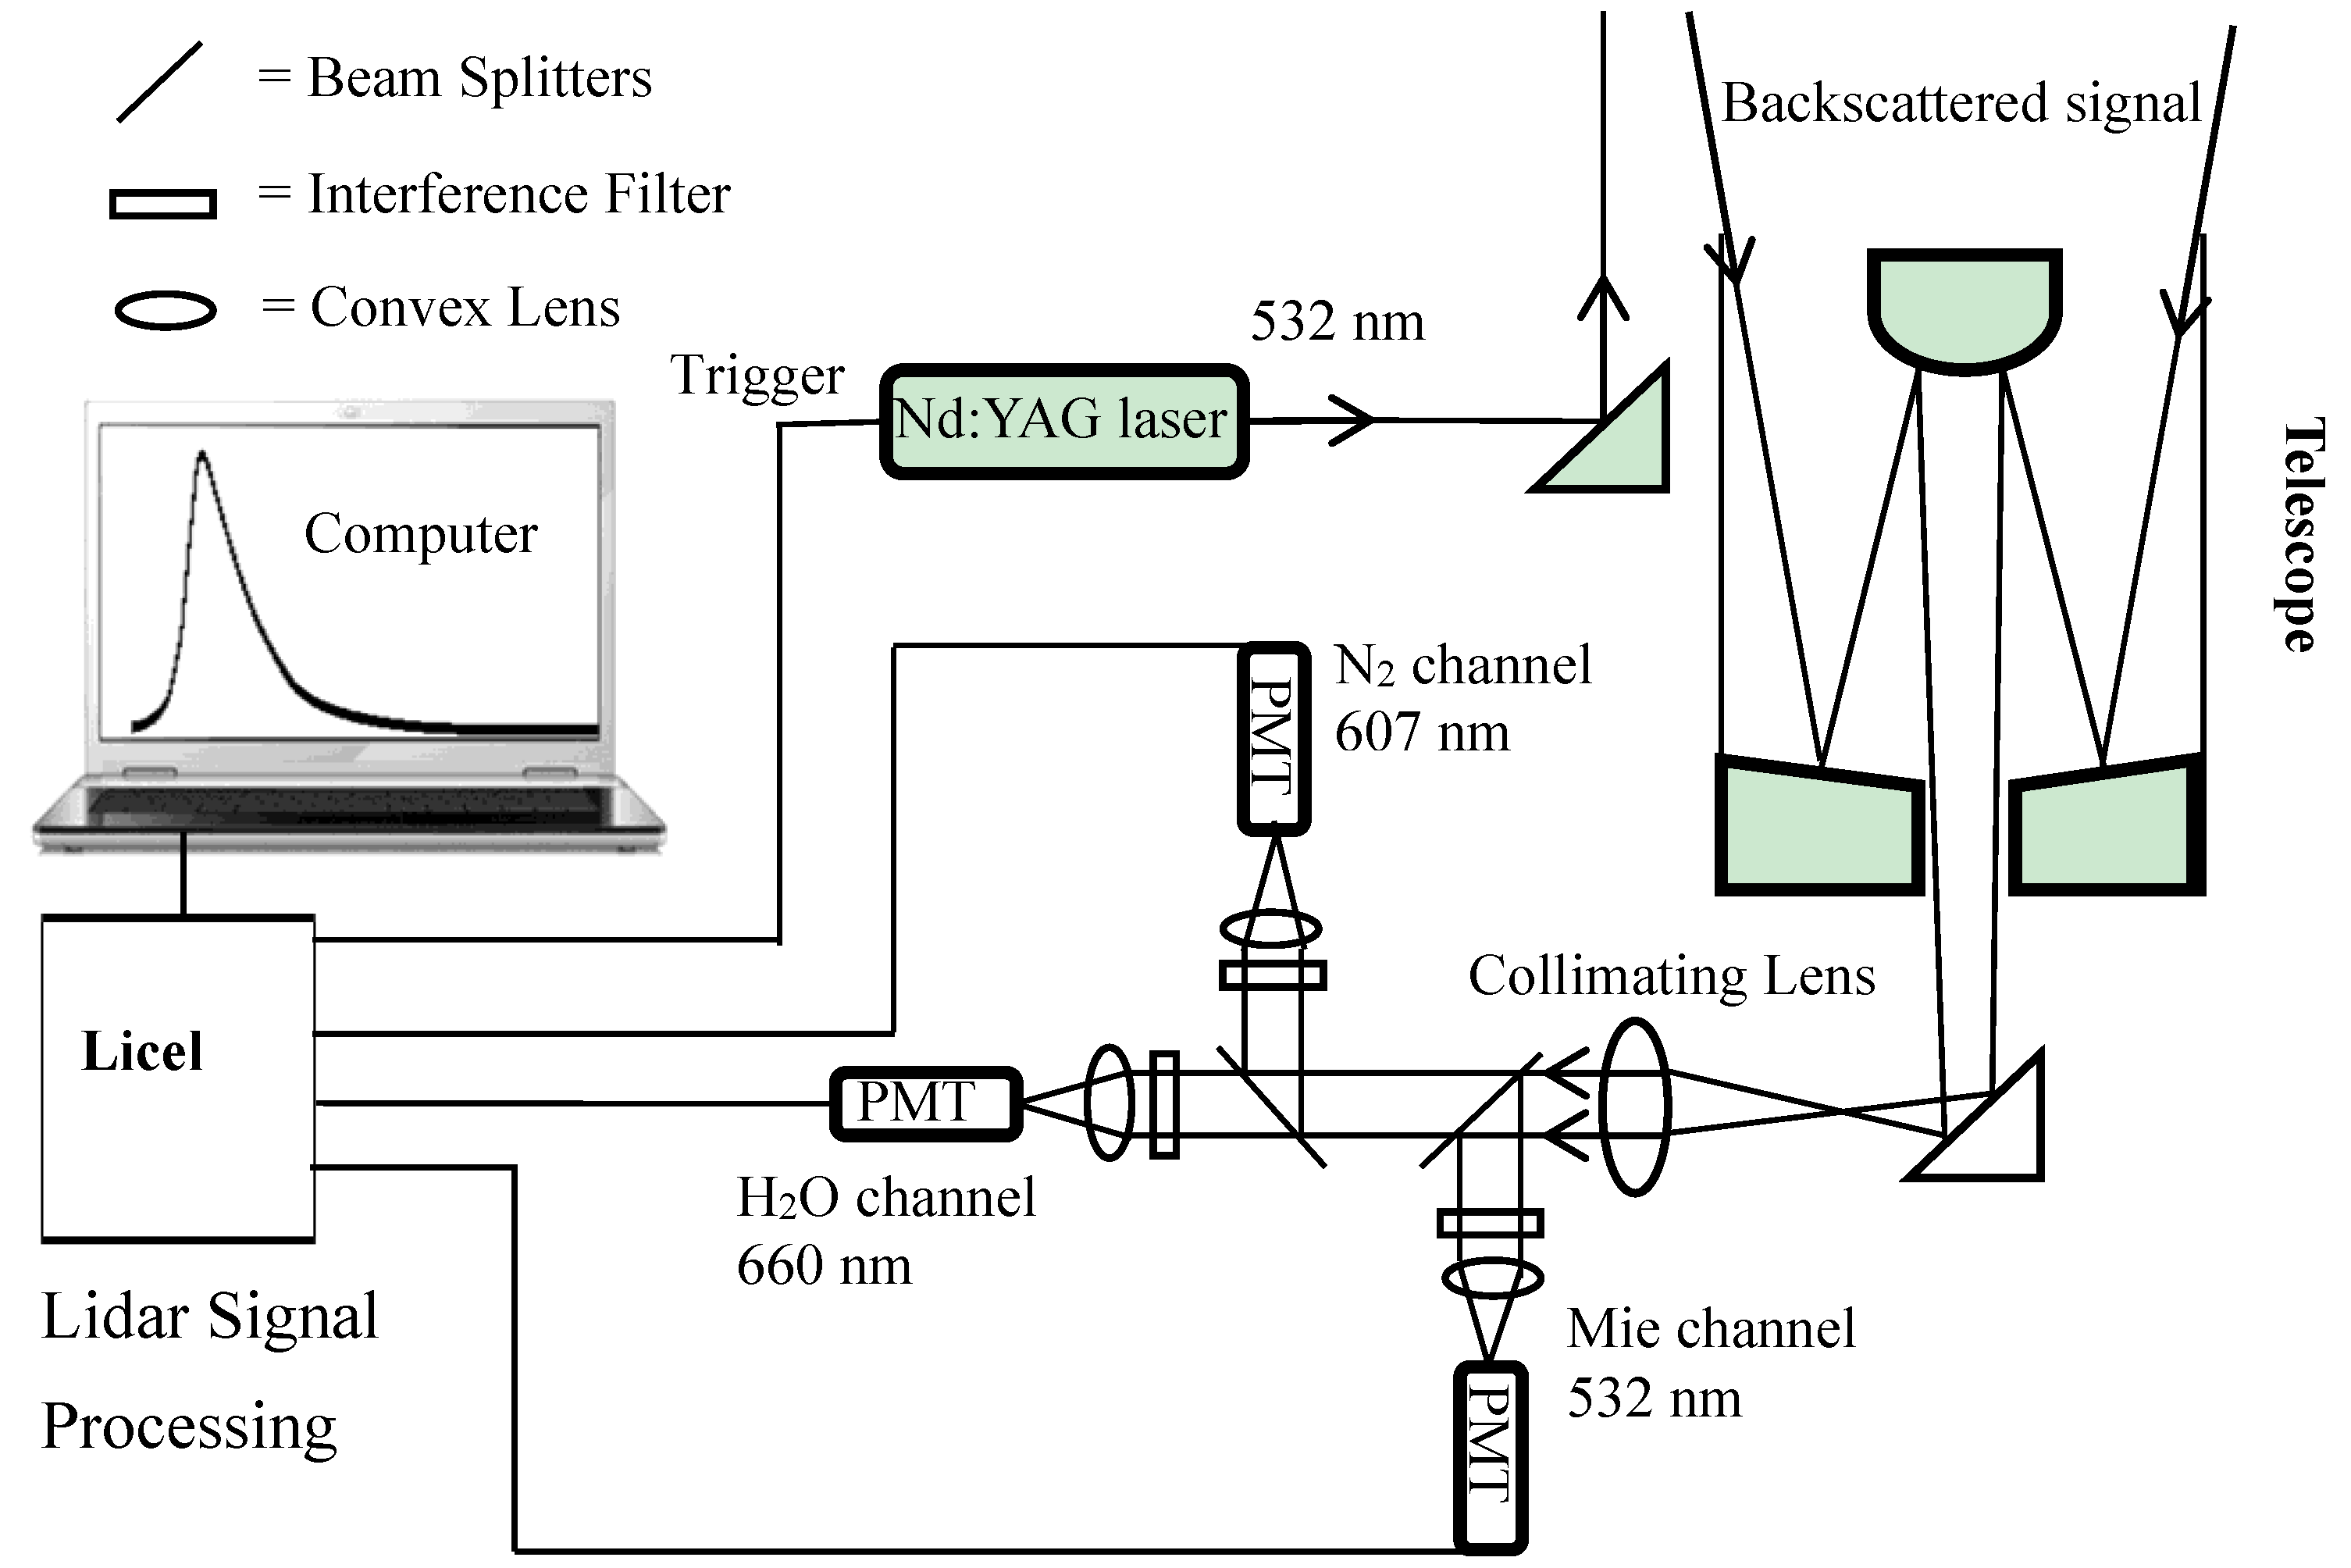
2.2. Instrument and Method

The RL system has three subsystems, namely, laser-transmitting, backscattered-receiving, and signal-processing systems. Figure 2 and Table 1 illustrate the schematic and present the main technical parameters of the RL system, respectively. The transmitter for the RL is an Nd:YAG laser operating at 532 nm with a pulse width of ~10 ns, a repetition rate of 10 Hz, and energy of 200 mJ. Reflective lenses in front of the laser vertically emit the outgoing beam into the atmosphere. Signals backscattered by the atmospheric molecules, aerosols, cloud particles, etc. are collected by a Schmidt–Cassegrainian telescope with a primary mirror diameter of 370 mm. As illustrated in Figure 2, the collected signals are separated into three spectral components using beam splitters, convex lens, and interference filters. Convex lens are attached to the front of each Raman-receiving channel photomultiplier tube (PMT) to increase the signal strength. To reduce the effect of Mie signal and background noise, two identical narrow bandpass interference filters of 607 nm and 660 nm are used in the N2-Raman and H2O-Raman channel, respectively. In the Mie channel, the full width at half-maximum of the filter is 5.0 ± 1 nm and the center wavelength is 532 nm. In the N2 and H2O channels, the full width at half-maximum are both 3 ± 0.5 nm and the center wavelength are 607 nm and 660 nm, respectively. The SNR of the Mie lidar signal is approximately 10−3 (10−5) times higher than that of N2-Raman (H2O-Raman) lidar signal under similar conditions. Thus, the filters with narrower bandwidths are used in Raman channels to restraint the background noise and Mie lidar signal. The out-of-band rejection of the narrow bandpass interference filter is larger than 10−4 in the three channels. The out-of-band rejection of the beam splitters before the interference filter is about 10−2. Thus, in the two Raman channels, the total out-of-band rejection is about 10−8–10−9.
Figure 2. Schematic of the Raman Lidar (RL) system.
Atmosphere 06 00521 g002
Three different signals are detected by the PMTs (R7400). The PMT used in the Mie channel (Raman channels) has a detection wavelength range of 300 nm to 800 nm (300 nm to 900 nm) and a peak sensitivity at 500 nm (630 nm). The lidar computing and electronics (licel) transient recorder used in the RL system provides photon-counting (PC) and analog-to-digital (A/D) signal simultaneously. Both A/D and PC signals are amplified by high voltage and are acquired with vertical and temporal resolutions of 7.5 m and 1 min, respectively (average of 600 shots). A data-processing system is developed to retrieve AECs from the Mie or N2 channels, as well as WVMR from the N2 and H2O channels.
Table 1. Main technical parameters of the Raman Lidar system.
SystemParameterValue
LaserOutput wavelength532 nm
Output energy200 mJ
Pulse width~10 ns
Energy stability≤5%
Frequency10 Hz
TelescopeTypeSchmidt-Cassegrain
Effective aperture356 mm
Primary mirror diameter370 mm
Focal length3556 mm
DetectorPMT Hamamatsu R 7400
Interference FilterMie Channel
CWL532 nm
FWHM5 ± 1 nm
Out-of-Band Rejection>10−4
Minimum Transmission50%
Raman Channels
CWL607 nm (660 nm)
FWHM3 ± 0.5 nm
Out-of-Band Rejection>10−4
Minimum Transmission50%
Acquisition SystemA/D conversion12 bit, 20 MHz
PC250 MHz
The central wavelength of N2 (H2O) in the shifted spectrum is 607 nm (660 nm) when excited by a laser at 532 nm. The following equations illustrate the backscattered signals of the H2O channel and the N2 channel, respectively [22]:
P H ( r ) = C H r 2 G ( r ) σ H n H ( r ) exp ( - 0 r [ α m ( λ H , 0 , x ) + α a ( λ H , 0 , x ) + α m ( λ L , 0 , x ) + α a ( λ L , 0 , x ) ] d x )
P N ( r ) = C N r 2 G ( r ) σ N n N ( r ) exp ( - 0 r [ α m ( λ N , 0 , x ) + α a ( λ N , 0 , x ) + α m ( λ L , 0 , x ) + α a ( λ L , 0 , x ) ] d x )
where Px(r) is the signal at range r; Cx is the system proportionality constant, the subscript x refers to N and H, which are the N2 channel and H2O channel, respectively; nx(r) represents the molecular number density of x; and σx is the scattering cross section, where λL is the output laser wavelength (532 nm), and αm and αa are the air molecular and AECs at wavelength λ, respectively.
The WVMR is defined as the ratio of the water vapor mass to dry air mass expressed in g/kg at a given volume. The retrieval method of WVMR is proposed by Whiteman et al. [22]:
W ( r ) = C w P H ( r ) P N ( r ) exp { 0 r [ α m ( λ H , 0 , x ) α m ( λ N , 0 , x ) ] d x } exp { 0 r [ α a ( λ H , 0 , x ) α a ( λ N , 0 , x ) ] d x }
where Cw is the RL system calibration constant and obtained by simultaneous RS data from 1 km to 3 km and αm(λx) can be determined by the standard atmospheric model. The Klett-Fernald method is most widely used in retrieving the AEC by Mie signals [23,24], but which needs to assume that the lidar ratio is known because there are two unknowns in one equation. The AEC at 532 nm can also be retrieved directly through the N2 signal by Raman method [25], which can be written as:
α a ( λ L , r ) = d [ ln n N ( r ) P N ( r ) r 2 ] - α m ( λ L , r ) - α m ( λ N , r ) 1 + λ L λ N
To obtain an accurate AEC, the least square method is used with 41 points (i.e., 307.5 m) to reduce the noise in the retrieval of Equation (4). The AOD is defined as the integral of the AEC along the optical path from r1 to r2, which can be expressed as,
A O D ( λ L , r ) = r 1 r 2 α a ( λ L , r ) d r
A ground-based multichannel MR developed by Radiometer Physics GmbH in Germany, with K-band (seven channels between 22.24 GHz and 31.4 GHz) and V-band receivers (seven channels between 51 GHz and 58 GHz), is used for measuring the water vapor and temperature profiling, respectively. Relative humidity is measured by the MR, which must be converted into a mixing ratio for comparison with the RL mixing ratio. The WVMR is derived as follows [26]:
W ( r ) = 0.622 e ( r ) p ( r ) - e ( r )
and
e ( r ) = 6.1078 R H ( r ) exp [ 17.2693882 ( T ( r ) 273.16 ) T ( r ) 35.86 ]
where p(r) is the atmospheric pressure and can be determined by the empirical hypsometric equation, e(r) represents the water vapor pressure, RH(r) refers to relative humidity and can be directly measured by MR, and T(r) is the temperature in °C.

3. Results and Discussion

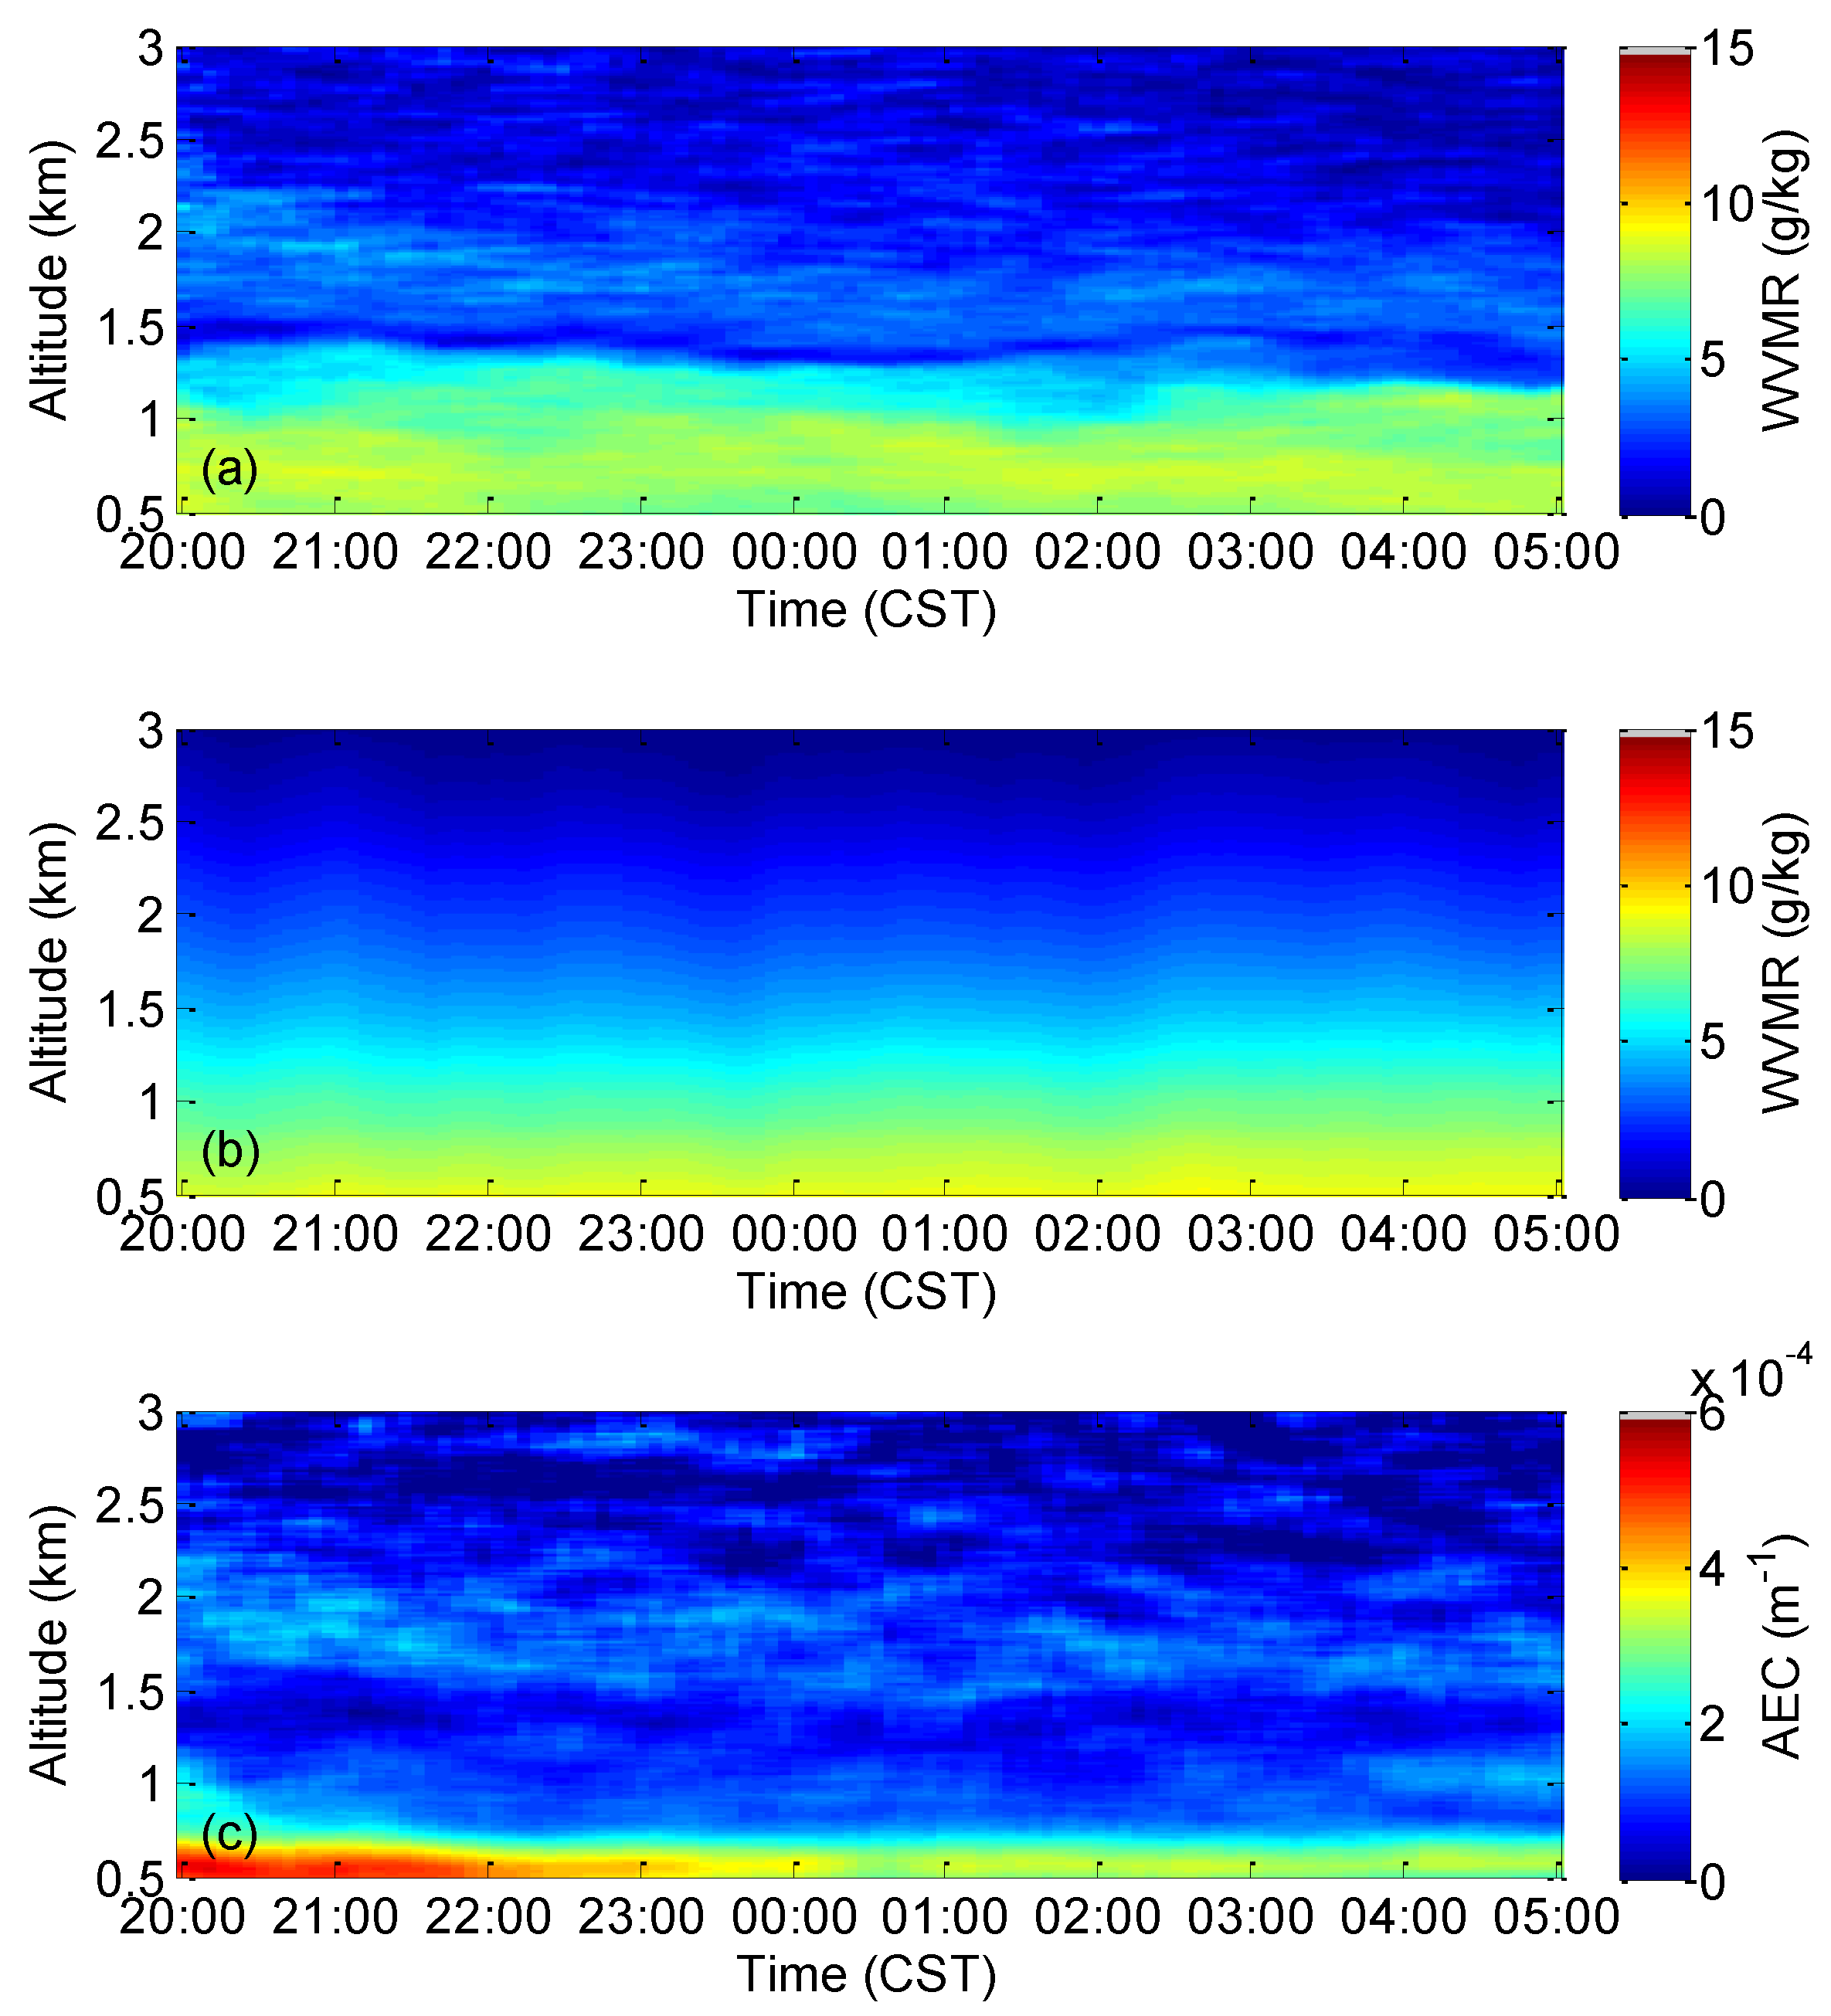
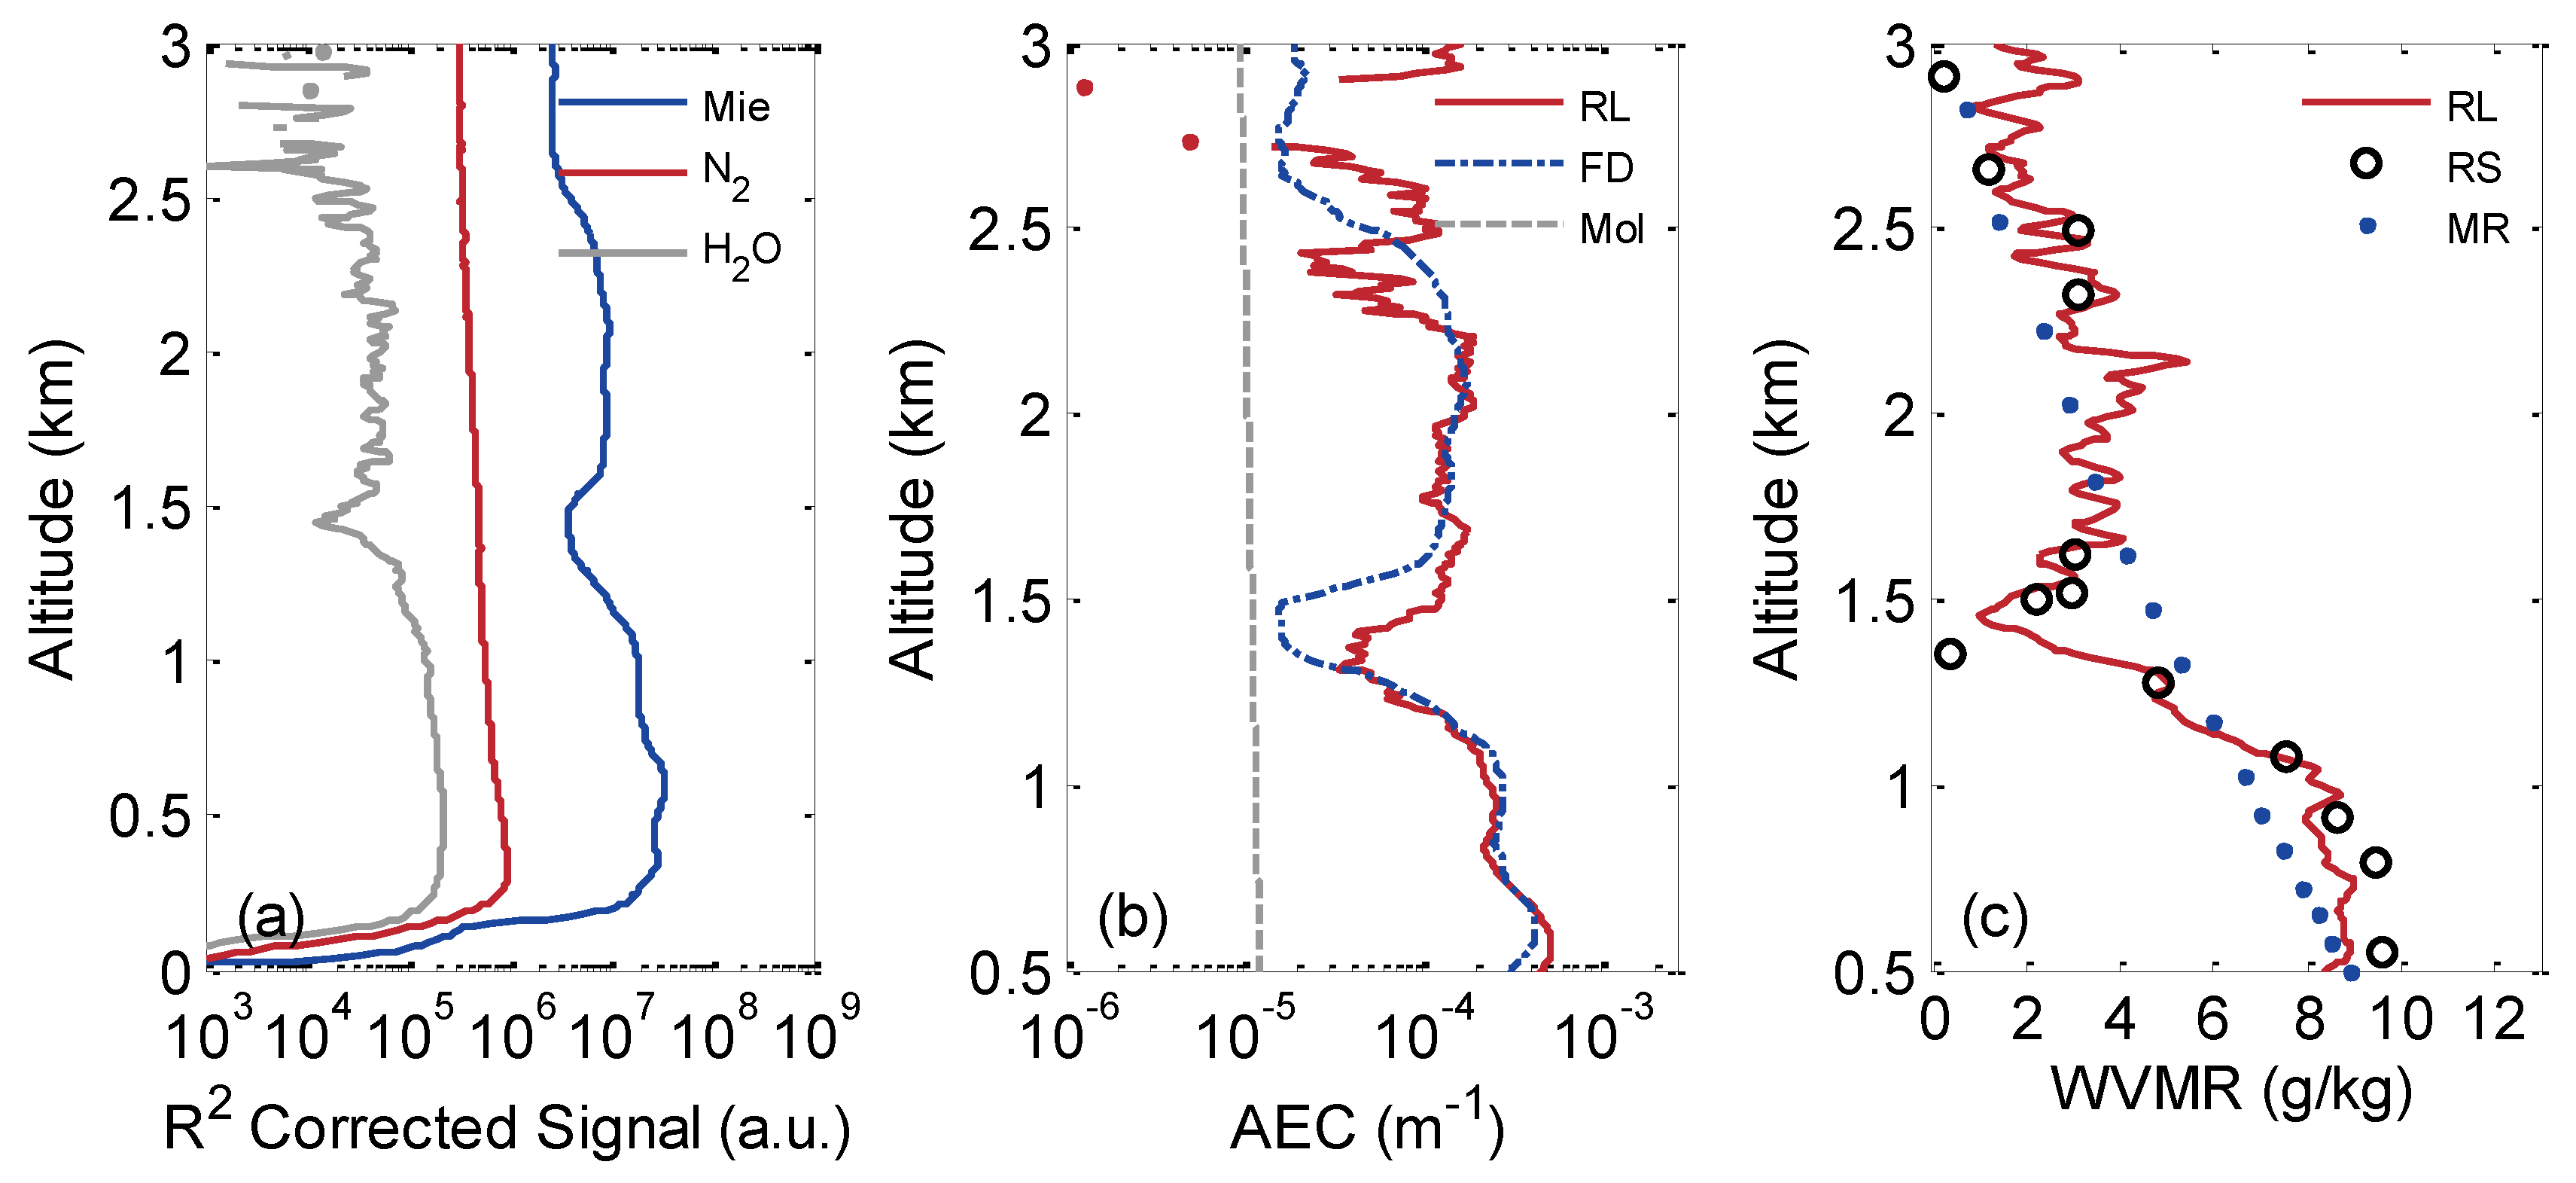
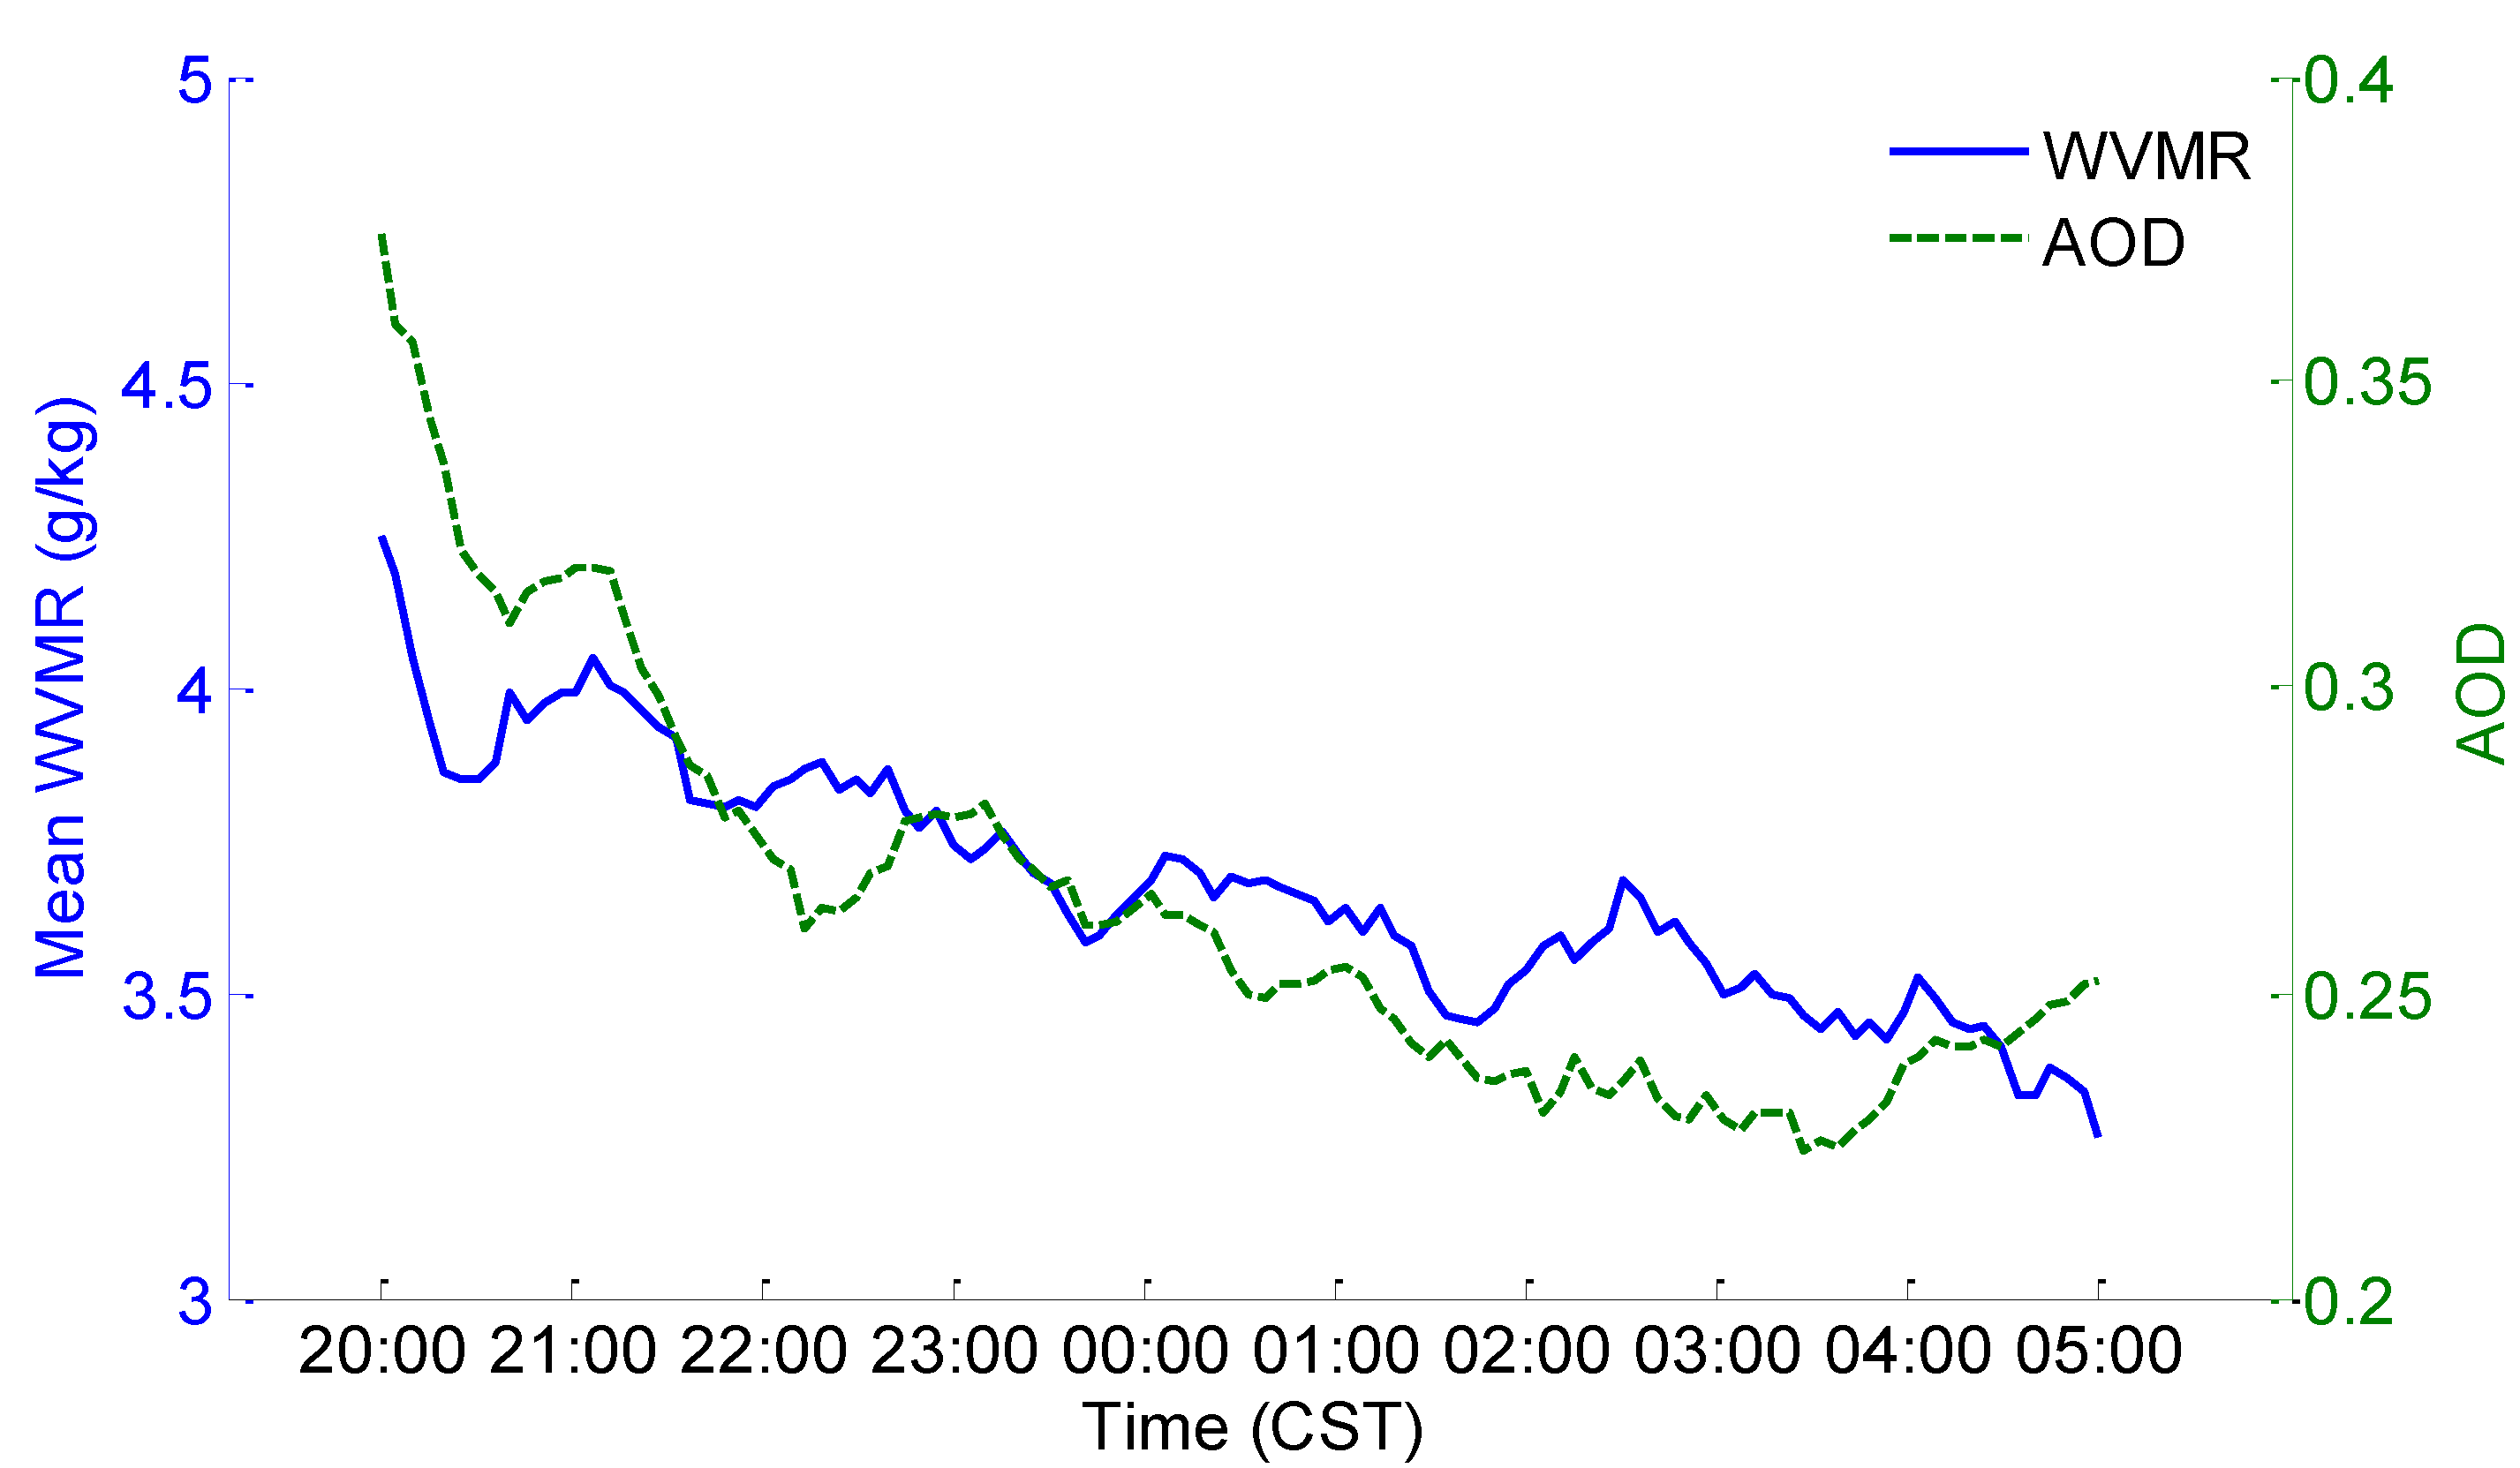
3.1. Representative Case

Figure 3a shows 30-min, range-corrected signals of Mie, N2-Raman, and H2O-Raman measured at 8:00 p.m. to 8:30 p.m. CST on 10 July 2013. There are convex value in both the Mie and H2O-Raman signal between 1.5 and 2.5 km as shown in Figure 3a, which should be caused by a cloud layer. The H2O signal is difficult to be determined up to 3 km because its scattering cross section is small. Figure 3b demonstrates the AEC retrieved by Fernald method (the lidar ratio and the boundary value were assumed as 50 sr and 8 km, respectively) and Raman method, respectively. The regions below 0.5 km are affected by the geometric factor, which was ignored in this study. The AECs retrieved by the two methods were in good agreement below 2.5 km, except for the range around 1.5 km, which was due to a constant lidar ratio was used in the Fernald method. However, above 2.8 km, the AEC obtained by Raman method was unreliable because of lower SNR. The WVMRs measured from RL, RS, and MR are shown in Figure 3c, which are in good consistency with each other in the whole range. RL and RS are very sensitive to changes in water vapor. At about 1.5 km, where water vapor sharply changes from a maximum value of about 9 g/kg to a minimum value of about 1 g/kg, both of RL and RS reflected the change in the water vapor with good sensitivity. However, MR can only show the trend of water vapor change roughly. There are some disagreeing regions in the water vapor profiles retrieved by RL and RS, such as that below 1 km and 1.5 km, which may be caused by the distance between the two instruments.
Figure 3. (a) Range-corrected signals of Mie, N2-Raman, and H2O-Raman measured at 8:00 p.m. to 8:30 p.m. Beijing time (CST) on 10 September 2013; (b) Aerosol extinction coefficient (AEC) retrieved through the Raman method (refer to RL with red solid line) and Fernald method (refer to FD with blue point dotted line), Mol with gray dotted line refer to molecule extinction coefficient; (c) Water vapor mixing ratio (WVMR) measured by Raman Lidar (RL) , RadioSonde (RS) and Microwave Radiometer (MR), which refer to the red solid line, black circle, and blue point, respectively.
Atmosphere 06 00521 g003
Figure 4a,b show the temporal variation in the 30-min WVMRs measured by the data of the RL and MR, respectively. Data are obtained from 8:00 p.m. CST, 10 September 2013 to 05:00 a.m. CST the next morning. Comparing Figure 4a,b, the WVMR approximately agrees with each other. However, the MR was too smooth, which was because of the limited sensitivity of MR. For RL, cloud information can be seen at about 2 km. This demonstrates that RL have the ability to measure water vapor with higher accuracy and spatial resolution than MR. Figure 4c shows the AEC retrieved by the N2-Raman signals, which is significantly higher in an area where the water vapor density was high. AECs in the lowest layer reduced gradually from 8:00 p.m. CST and reached the minimum value in the morning below a height of 1 km.
Figure 4. Observation time was from 8:00 p.m., 10 September 2013 to 05:00 11 September 2013 CST. (a,b) show the temporal variation in the 30-min WVMRs measured by the data of the RL and MR, respectively; (c) Temporal variation in the 30-min AEC retrieved by N2-Raman signals of the RL, and the measured time was same as (a).
Atmosphere 06 00521 g004
Figure 5. Mean WVMR and AOD from 0.5 km to 3 km retrieved by the RL at night, as denoted by a blue solid line corresponding to the left y-value and the green dotted line corresponding to the right y-value. The measured time was the same as that in Figure 4a.
Atmosphere 06 00521 g005
Figure 5 shows the mean water vapor mix ratio and AOD from 0.5 km to 3 km retrieved by the RL at night. The measured time was the same as that in Figure 4a. The mean water vapor clearly reduced gradually from 4.3 g/kg at 8:00 p.m. CST to 3.3 g/kg at 5:00 CST of the next day. The AOD decreased from 0.38 to 0.23, and then continued to rise. Generally, AOD is about 1.0 in Wuhan during the daytime [21], then gradually reduces to the lower value in the evening. Before 3:30 a.m. CST, AOD gradually reduced with the reduction of the water vapor. The reason was water vapor is a part of the aerosol and its proportion was large. The same phenomenon was discussed in detail by Wang, et al. [7]. It also shows that water vapor is crucial for atmospheric particulate cohesion. However, after 3:30 a.m. CST, water vapor negatively correlated with AOD. At about 1 km and after 3:00 a.m. CST in Figure 4a,c, aerosol was enhanced but water vapor change slightly. This may be caused by dry particles transported from adjacent area of Wuhan.

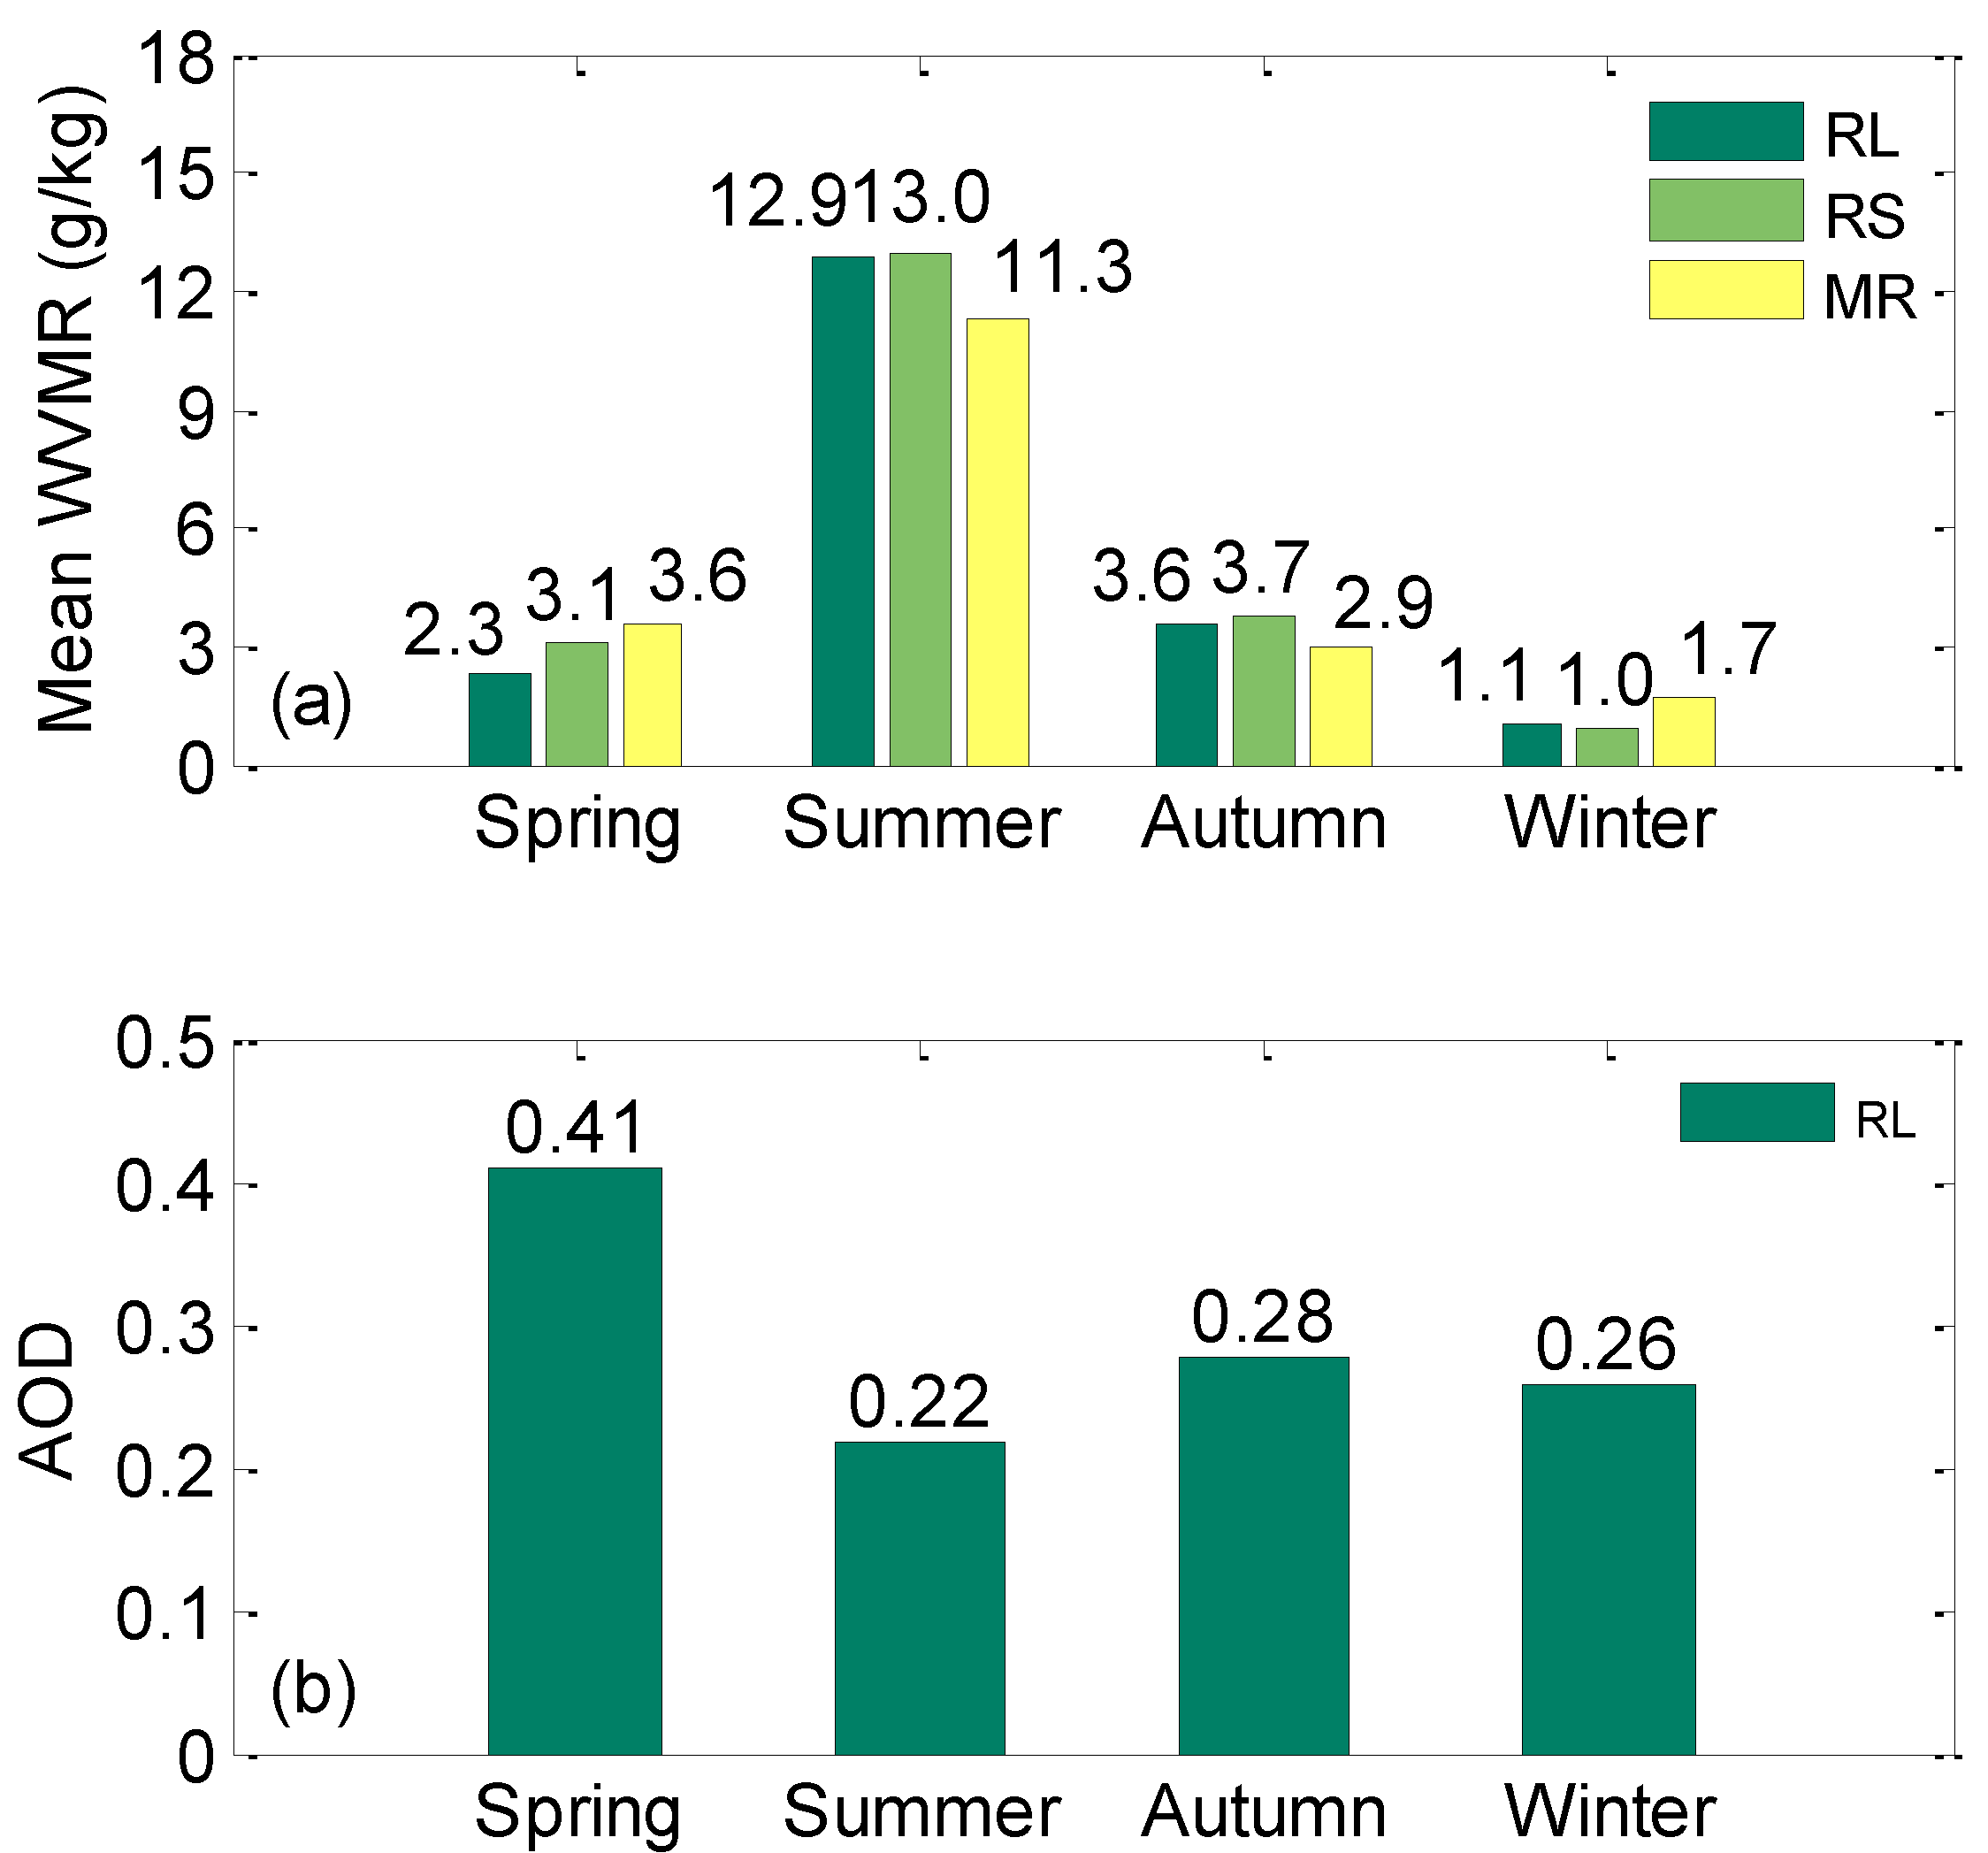
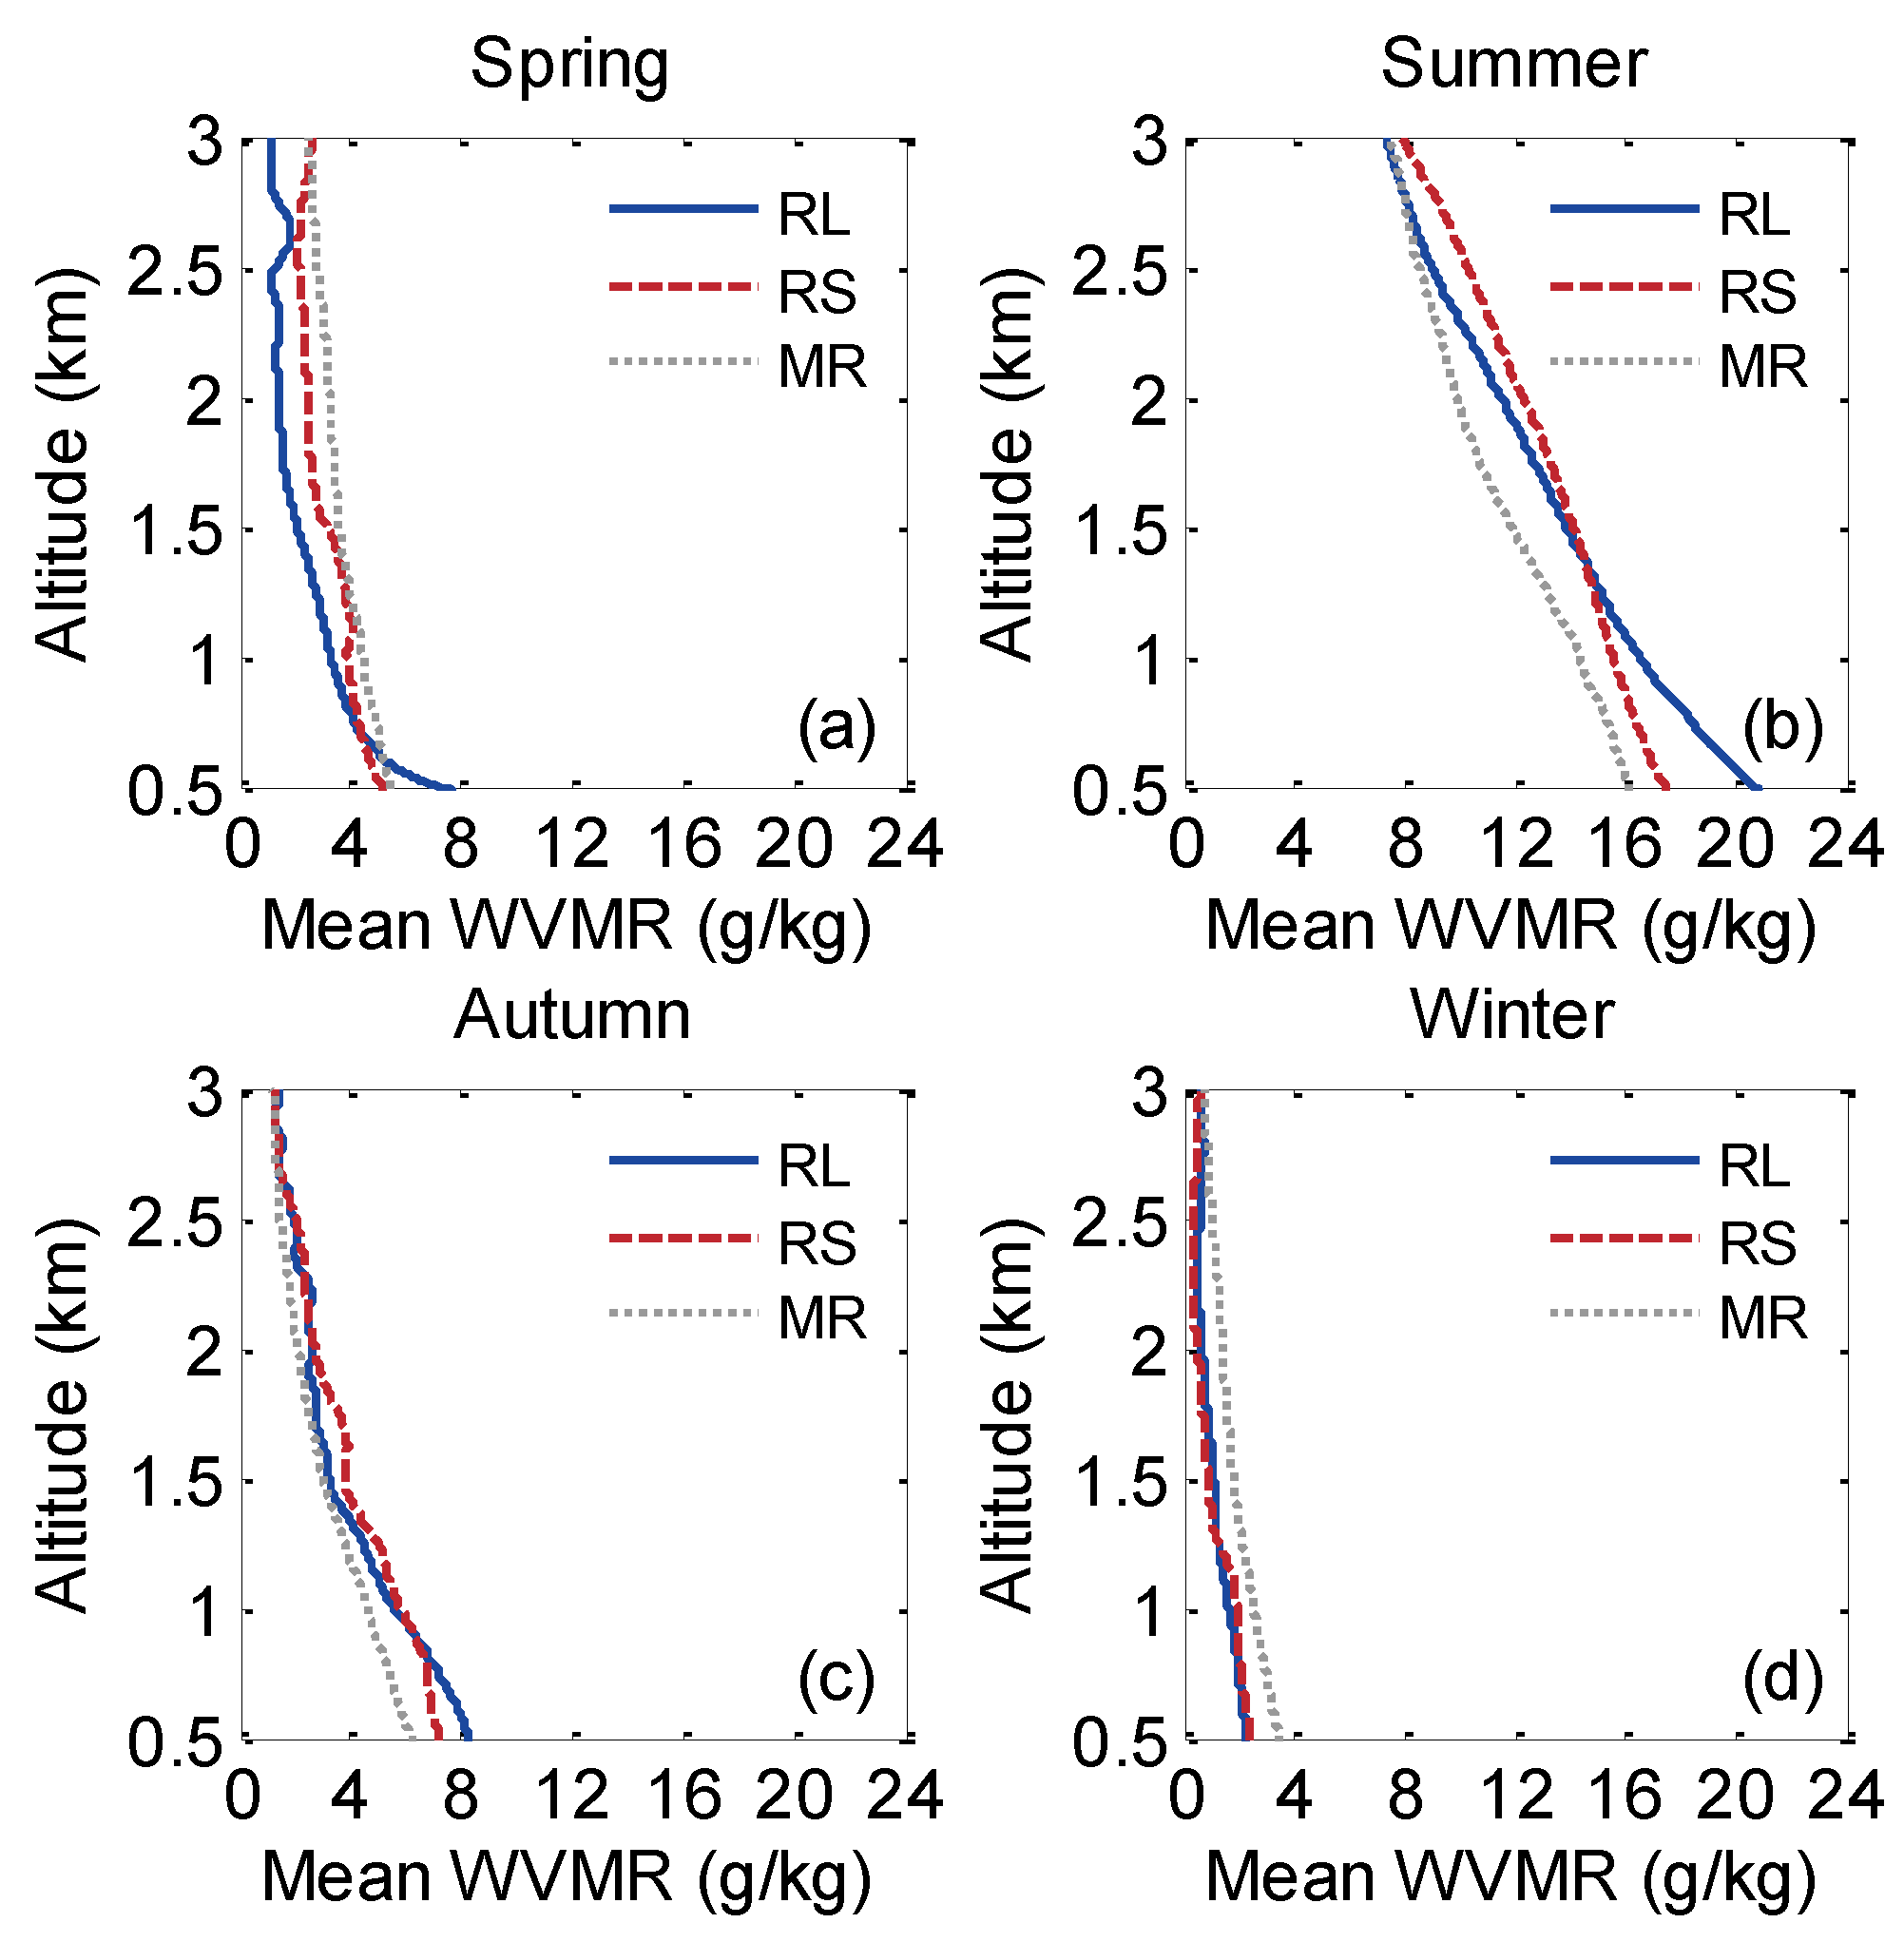
3.2. Long-Term Observation

Long-term water vapor and aerosols were measured by RL at 8:00 p.m.–5:00 a.m. CST at Wuhan from July 2013 to May 2014. The temporal resolution of RL and MR was 30 min. However, only the RS profile at 8:00 p.m. CST each day was applied in this study. Statistical analysis data were only from rainless nights. In this study, spring, summer, fall, and winter were defined as the date from March to May, June to August, September to November, and December to February of the next year, respectively. The number of available profiles measured by RL are 269, 331, 123 and 120 in spring, summer, fall and winter, respectively. Figure 6 shows the quarterly mean WVMR measured by the RL, RS, and MR. The minimum disagreement in winter and the maximum disagreement in the summer. The moisture evaporation in the lake near the RL site was more intense with the high temperatures of summer. Thus, water vapor measured by the RL below 1 km was significantly higher than that of RS in summer. However, the high water vapor near the ground is not reflected by MR, because which is insensitive for water vapor changing in this range. There were small disagreements between the WVMR profiles measured by RL and RS in winter because of the lowest evaporation corresponding to the lowest temperatures.
Figure 6. Quarterly mean water vapor mixing ratio (WVMR) measured by Raman Lidar (RL), RadioSonde (RS) and Microwave Radiometer (MR), respectively.
Atmosphere 06 00521 g006
The quarterly mean WVMRs and AODs were obtained by the aforementioned data from 0.5 km to 3 km and the value can be found in Figure 7. The slight difference between the quarterly mean WVMRs from the three instruments indicates that RL have an ability to measure water vapor accurately. The mean relative difference between the RL and RS (MR) was about 5.17% (9.47%) during a year. The quarterly mean WVMRs of RL in the spring, summer, autumn and winter are 2.3 g/kg, 12.9 g/kg, 3.6 g/kg and 1.1 g/kg, respectively. The quarterly mean AOD in spring was higher than that in other seasons, and the maximum was 0.41. The reason is that the air quality in Wuhan is heavily influenced by the aerosols that are transported by air mass from the north in spring. Abundant rainfall lent to the relatively low AOD in summer (0.22). AOD in autumn and winter was a little higher than that in summer because the water vapor was low.
Figure 7. Quarterly mean WVMR from 0.5 km to 3 km measured by RL, RS, and MR, respectively. Quarterly mean AOD from 0.5 km to 3 km retrieved by RL.
Atmosphere 06 00521 g007

4. Conclusions

In this study, a RL system was developed to measure the WVMR and aerosol optical property in the lower troposphere of Wuhan, China. The representative case indicates that water vapor dramatically decreased with the observable AOD decrease. The WVMR profiles measured by RL for about one year were compared with the results obtained by simultaneous RS and MR. Water vapor distributions were observed to vary significantly based on temporal and spatial scales. The mean relative difference between RL and RS (MR) was about 5.17% (9.47%) during the year. The quarterly mean WVMRs of RL in the spring, summer, autumn and winter are 2.3 g/kg, 12.9 g/kg, 3.6 g/kg and 1.1 g/kg, respectively. The RL system was demonstrated to be a reliable equipment to study water vapor in the lower troposphere according to the nighttime measurements. In addition, the quarterly mean AODs in spring was higher than that in other seasons, and the maximum value was 0.41. The reason is that the air quality in Wuhan is heavily influenced by the aerosols that are transported by air mass from the north in spring. Abundant rainfall lent to the relatively low AOD in summer (0.22), which demonstrate that water vapor is crucial for air purification.
This study demonstrated that RL can measure water vapor and aerosol accurately, which is a powerful tool for studying local and global atmosphere. The analyses of the relationship of water vapor and aerosol in this article promote our understanding of aerosol, which plays a crucial role in people’s health and living environment. However, the existing data measured by RL was insufficient to obtain a comprehensive explanation for the variation of water vapor and aerosols. Therefore, we need to carry out more works to analyze the water vapor and aerosols in Wuhan in the future. Aerosol optical properties in Wuhan should be compared with other similar cities in the world for a comprehensive understanding.

Acknowledgments

This work was supported by the 973 Program (2011CB707106), the NSFCs (41127901, 41301372), and the Major Project of Hubei Collaborative Innovation Center for High-efficiency Utilization of Solar Energy (HBSZD2014002).

Author Contributions

The work presented here was carried out in collaboration between all authors. Wei Gong, Feiyue Mao, Jinye Zhang and Wei Wang defined the research theme. All authors developed this Raman Lidar system together and carried out experiments. This manuscript was finished by Wei Wang and Feiyue Mao. Feiyue Mao and Jinye Zhang checked the experimental result. All authors agreed to the manuscript being submitted.

Conflicts of Interest

The authors declare no conflict of interest.

References

  1. Gong, W.; Zhang, S.S.; Ma, Y.Y. Aerosol optical properties and determination of aerosol size distribution in wuhan, china. Atmosphere 2014, 5, 81–91. [Google Scholar] [CrossRef]
  2. Zhang, M.; Ma, Y.Y.; Gong, W.; Zhu, Z.M. Aerosol optical properties of a haze episode in wuhan based on ground-based and satellite observations. Atmosphere 2014, 5, 699–719. [Google Scholar] [CrossRef]
  3. Charlson, R.J.; Schwartz, S.; Hales, J.; Cess, R.D.; Coakley, J.A., Jr.; Hansen, J.; Hofmann, D. Climate forcing by anthropogenic aerosols. Science 1992, 255, 423–430. [Google Scholar] [CrossRef] [PubMed]
  4. Liou, K.-N. Influence of cirrus clouds on weather and climate processes: A global perspective. Mon. Weather Rev. 1986, 114, 1167–1199. [Google Scholar] [CrossRef]
  5. Gerding, M.; Ritter, C.; Müller, M.; Neuber, R. Tropospheric water vapour soundings by lidar at high arctic latitudes. Atmos. Res. 2004, 71, 289–302. [Google Scholar] [CrossRef]
  6. Harries, J. Atmospheric radiation and atmospheric humidity. Q. J. R. Meteorol. Soc. 1997, 123, 2173–2186. [Google Scholar] [CrossRef]
  7. Wang, Y.F.; Hua, D.X.; Wang, L.; Tang, J.; Mao, J.T.; Kobayashi, T. Observations and analysis of relationship between water vapor and aerosols by using raman lidar. Jpn. J. Appl. Phys. 2012, 51, 102401. [Google Scholar] [CrossRef]
  8. Twomey, S. Aerosols, clouds and radiation. Atmos. Environ. Part A General Top. 1991, 25, 2435–2442. [Google Scholar] [CrossRef]
  9. Turner, D.D.; Goldsmith, J. Twenty-Four-Hour raman lidar water vapor measurements during the atmospheric radiation measurement program’s 1996 and 1997 water vapor intensive observation periods. J. Atmos. Ocean. Technol. 1999, 16, 1062–1076. [Google Scholar] [CrossRef]
  10. Shine, K.P.; Sinha, A. Sensitivity of the earth’s climate to height-dependent changes in the water vapour mixing ratio. Nature 1991, 354, 382–384. [Google Scholar] [CrossRef]
  11. Yufeng, W.; Fei, G.; Chengxuan, Z.; Qing, Y.; Dengxin, H. Observations of atmospheric water vapor, aerosol, and cloud with a raman lidar. Opt. Eng. 2014, 53, 114105–114105. [Google Scholar] [CrossRef]
  12. Hocke, K.; Kämpfer, N.; Gerber, C.; Mätzler, C. A complete long-term series of integrated water vapour from ground-based microwave radiometers. Int. J. Remote Sens. 2011, 32, 751–765. [Google Scholar] [CrossRef]
  13. Shiobara, M.; Spinhirne, J.D.; Uchiyama, A.; Asano, S. Optical depth measurements of aerosol, cloud, and water vapor using sun photometers during fire cirrus ifo ii. J. Appl. Meteorol. 1996, 35, 36–46. [Google Scholar] [CrossRef]
  14. Grant, W.B. Differential absorption and raman lidar for water vapor profile measurements: A review. Opt. Eng. 1991, 30, 40–48. [Google Scholar] [CrossRef]
  15. Weitkamp, C. Range-Resolved Optical Remote Sensing of the Atmosphere; Springer: Geesthacht, Schleswig-Holstein, Germany, 2005. [Google Scholar]
  16. Turner, D.D.; Ferrare, R.; Brasseur, L.H.; Feltz, W.; Tooman, T. Automated retrievals of water vapor and aerosol profiles from an operational raman lidar. J. Atmos. Ocean. Technol. 2002, 19, 37–50. [Google Scholar] [CrossRef]
  17. Gong, W.; Zhang, J.; Mao, F.; Li, J. Measurements for profiles of aerosol extinction coeffcient, backscatter coeffcient, and lidar ratio over wuhan in china with raman/mie lidar. Chin. Opt. Lett. 2010, 8, 533–536. [Google Scholar] [CrossRef]
  18. Gong, W.; Li, J.; Mao, F.; Zhang, J. Comparison of simultaneous signals obtained from a dual-field-of-view lidar and its application to noise reduction based on empirical mode decomposition. Chin. Opt. Lett. 2011, 9, 050101. [Google Scholar] [CrossRef]
  19. Mao, F.; Gong, W.; Li, C. Anti-Noise algorithm of lidar data retrieval by combining the ensemble kalman filter and the fernald method. Opt. Express 2013, 21, 8286–8297. [Google Scholar] [CrossRef] [PubMed]
  20. Mao, F.Y.; Gong, W.; Ma, Y.Y. Retrieving the aerosol lidar ratio profile by combining ground- and space-based elastic lidars. Opt. Lett. 2012, 37, 617–619. [Google Scholar] [CrossRef] [PubMed]
  21. Wang, L.; Gong, W.; Xia, X.; Zhu, J.; Li, J.; Zhu, Z. Long-Term observations of aerosol optical properties at wuhan, an urban site in central china. Atmos. Environ. 2015, 101, 94–102. [Google Scholar] [CrossRef]
  22. Whiteman, D.; Melfi, S.; Ferrare, R. Raman lidar system for the measurement of water vapor and aerosols in the earth’s atmosphere. Appl. Opt. 1992, 31, 3068–3082. [Google Scholar] [CrossRef] [PubMed]
  23. Klett, J.D. Stable analytical inversion solution for processing lidar returns. Appl. Opt. 1981, 20, 211–220. [Google Scholar] [CrossRef] [PubMed]
  24. Fernald, F.G. Analysis of atmospheric lidar observations: Some comments. Appl. Opt. 1984, 23, 652–653. [Google Scholar] [CrossRef] [PubMed]
  25. Ansmann, A.; Riebesell, M.; Weitkamp, C. Measurement of atmospheric aerosol extinction profiles with a raman lidar. Opt. Lett. 1990, 15, 746–748. [Google Scholar] [CrossRef] [PubMed]
  26. Navas-Guzman, F.; Fernandez-Galvez, J.; Granados-Munoz, M.J.; Guerrero-Rascado, J.L.; Bravo-Aranda, J.A.; Alados-Arboledas, L. Tropospheric water vapour and relative humidity profiles from lidar and microwave radiometry. Atmos. Meas. Tech. 2014, 7, 1201–1211. [Google Scholar] [CrossRef]

