Article

Characteristics of Black Carbon Aerosol during the Chinese Lunar Year and Weekdays in Xi’an, China

1
Key Laboratory of Aerosol Chemistry & Physics, Institute of Earth Environment, Chinese Academy of Sciences, Xi'an 710061, China
2
Institute of Global Environmental Change, Xi'an Jiaotong University, Xi'an 710049, China
3
Lab of Atmospheric Chemistry, Paul Scherrer Institute (PSI), Villigen 5232, Switzland
4
Centre for Climate and Air Pollution Studies, Ryan Institute, National University of Ireland Galway, University Road, Galway, Ireland
*
Author to whom correspondence should be addressed.
Atmosphere 2015, 6(2), 195-208; https://doi.org/10.3390/atmos6020195
Submission received: 1 December 2014 / Revised: 9 January 2015 / Accepted: 27 January 2015 / Published: 5 February 2015
(This article belongs to the Special Issue Sources, Formation and Impacts of Secondary Aerosol)

Abstract

:
Black carbon (BC) aerosol plays an important role in climate forcing. The net radiative effect is strongly dependent on the physical properties of BC particles. A single particle soot photometer and a carbon monoxide analyser were deployed during the Chinese Lunar Year (CLY) and on weekdays at Xi’an, China, to investigate the characteristics of refractory black carbon aerosol (rBC). The rBC mass on weekdays (8.4 μg·m−3) exceeds that during the CLY (1.9 μg·m−3), presumably due to the lower anthropogenic emissions during the latter. The mass size distribution of rBC shows a primary mode peak at ~205 nm and a small secondary mode peak at ~102-nm volume-equivalent diameter assuming 2 g·cm−3 in void-free density in both sets of samples. More than half of the rBC cores are thickly coated during the CLY (fBC = 57.5%); the percentage is slightly lower (fBC = 48.3%) on weekdays. Diurnal patterns in rBC mass and mixing state differ for the two sampling periods, which are attributed to the distinct anthropogenic activities. The rBC mass and CO mixing ratios are strongly correlated with slopes of 0.0070 and 0.0016 μg·m−3·ppbv−1 for weekdays and the CLY, respectively.

1. Introduction

Black carbon (BC) aerosol, a by-product of the incomplete combustion of fossil fuels and biomass, plays a unique and important role in Earth’s climate system. In the boundary layer, these particles absorb solar radiation and cool the Earth’s surface, but at the top of the atmosphere, they add to the climate warming caused by radiatively-active gases [1,2]. The total climate forcing of BC aerosol has been estimated to be +1.1 W·m−2, which is ranked as the second largest contributor to anthropogenic radiative forcing after CO2 [3]. Coated BC particles also can act as cloud condensation nuclei (CCN), thereby contributing to the indirect forcing of climate [4]. In addition to the effects on the environment, epidemiological research suggests that BC particles have adverse health effects: they have been implicated in respiratory and cardiovascular diseases [5,6]. Once emitted, the BC aerosol can be transported over regional to intercontinental scales, and the particles are ultimately removed from the atmosphere through wet (e.g., in precipitation) and dry deposition to the Earth’s surface. The resulting average atmospheric lifetime for BC is about a week [3]. Therefore, reductions in BC aerosol emissions are an attractive option, not only for mitigating global warming, but also for improving environmental conditions in other ways [7].
Most large Chinese cities have suffered from air pollution in recent years (e.g., [8,9,10]), and this has become one of the nation’s top environmental concerns. An anthropogenic emission inventory of China developed from 1990 to 2005 shows that the BC emissions, and, therefore, presumably, concentrations, have increased since 2000 [11]. Most studies (e.g., [12,13]) in China have used filter-based techniques that measure bulk aerosol absorption rather than the BC mass concentrations directly. Previous studies indicate that key properties of the BC aerosol, that is the particle’s concentration, size, shape and mixing state, vary in complex ways and that these properties depend on many interacting environmental factors [14,15]. Due to the systematic limitations of most of the current filter-based BC measurements [3], direct examination of the BC size distribution and mixing state are not possible. Therefore, high-quality measurements of BC emissions have become increasingly important for accurately assessing the BC impacts on the atmospheric radiative energy balance, human health and air quality.
Here, we report the results of a study on individual refractory black carbon (rBC) mass concentrations, size distributions, the mixing state and the relationship with carbon monoxide (CO). The terms, rBC and BC, are operationally defined based on the applied measurement technique (laser-induced incandescence and light absorption), and they both refer to the most light absorbing component of carbonaceous combustion particles [16,17]. Samples for the study were collected from Xi’an, China, during the Chinese Lunar Year (CLY), and we contrast those data with observations taken on weekdays. The CLY is one of the most important traditional festivals in China. Numerous migrant workers return to their hometowns to reunite with their families and to celebrate the festival. During this one-week holiday, most companies and many industries shut down, and traffic is also at a minimum. The concentration of PM2.5 (particulate matter with an aerodynamic diameter of less than 2.5 micrometres) during this period (128.9 μg·m−3) is much lower than on weekdays (191.4 μg·m−3). This gives researchers a once-a-year opportunity to study the atmosphere when anthropogenic emissions are greatly reduced. In contrast, normal weekdays (Monday to Friday) are arguably representative of a more typical scenario with respect to pollution emissions. The comparisons of aerosol properties made for the holiday versus weekdays will lead to a better understanding of the impact of anthropogenic emissions on the physical properties of the rBC aerosol in China.

2. Experimental Section
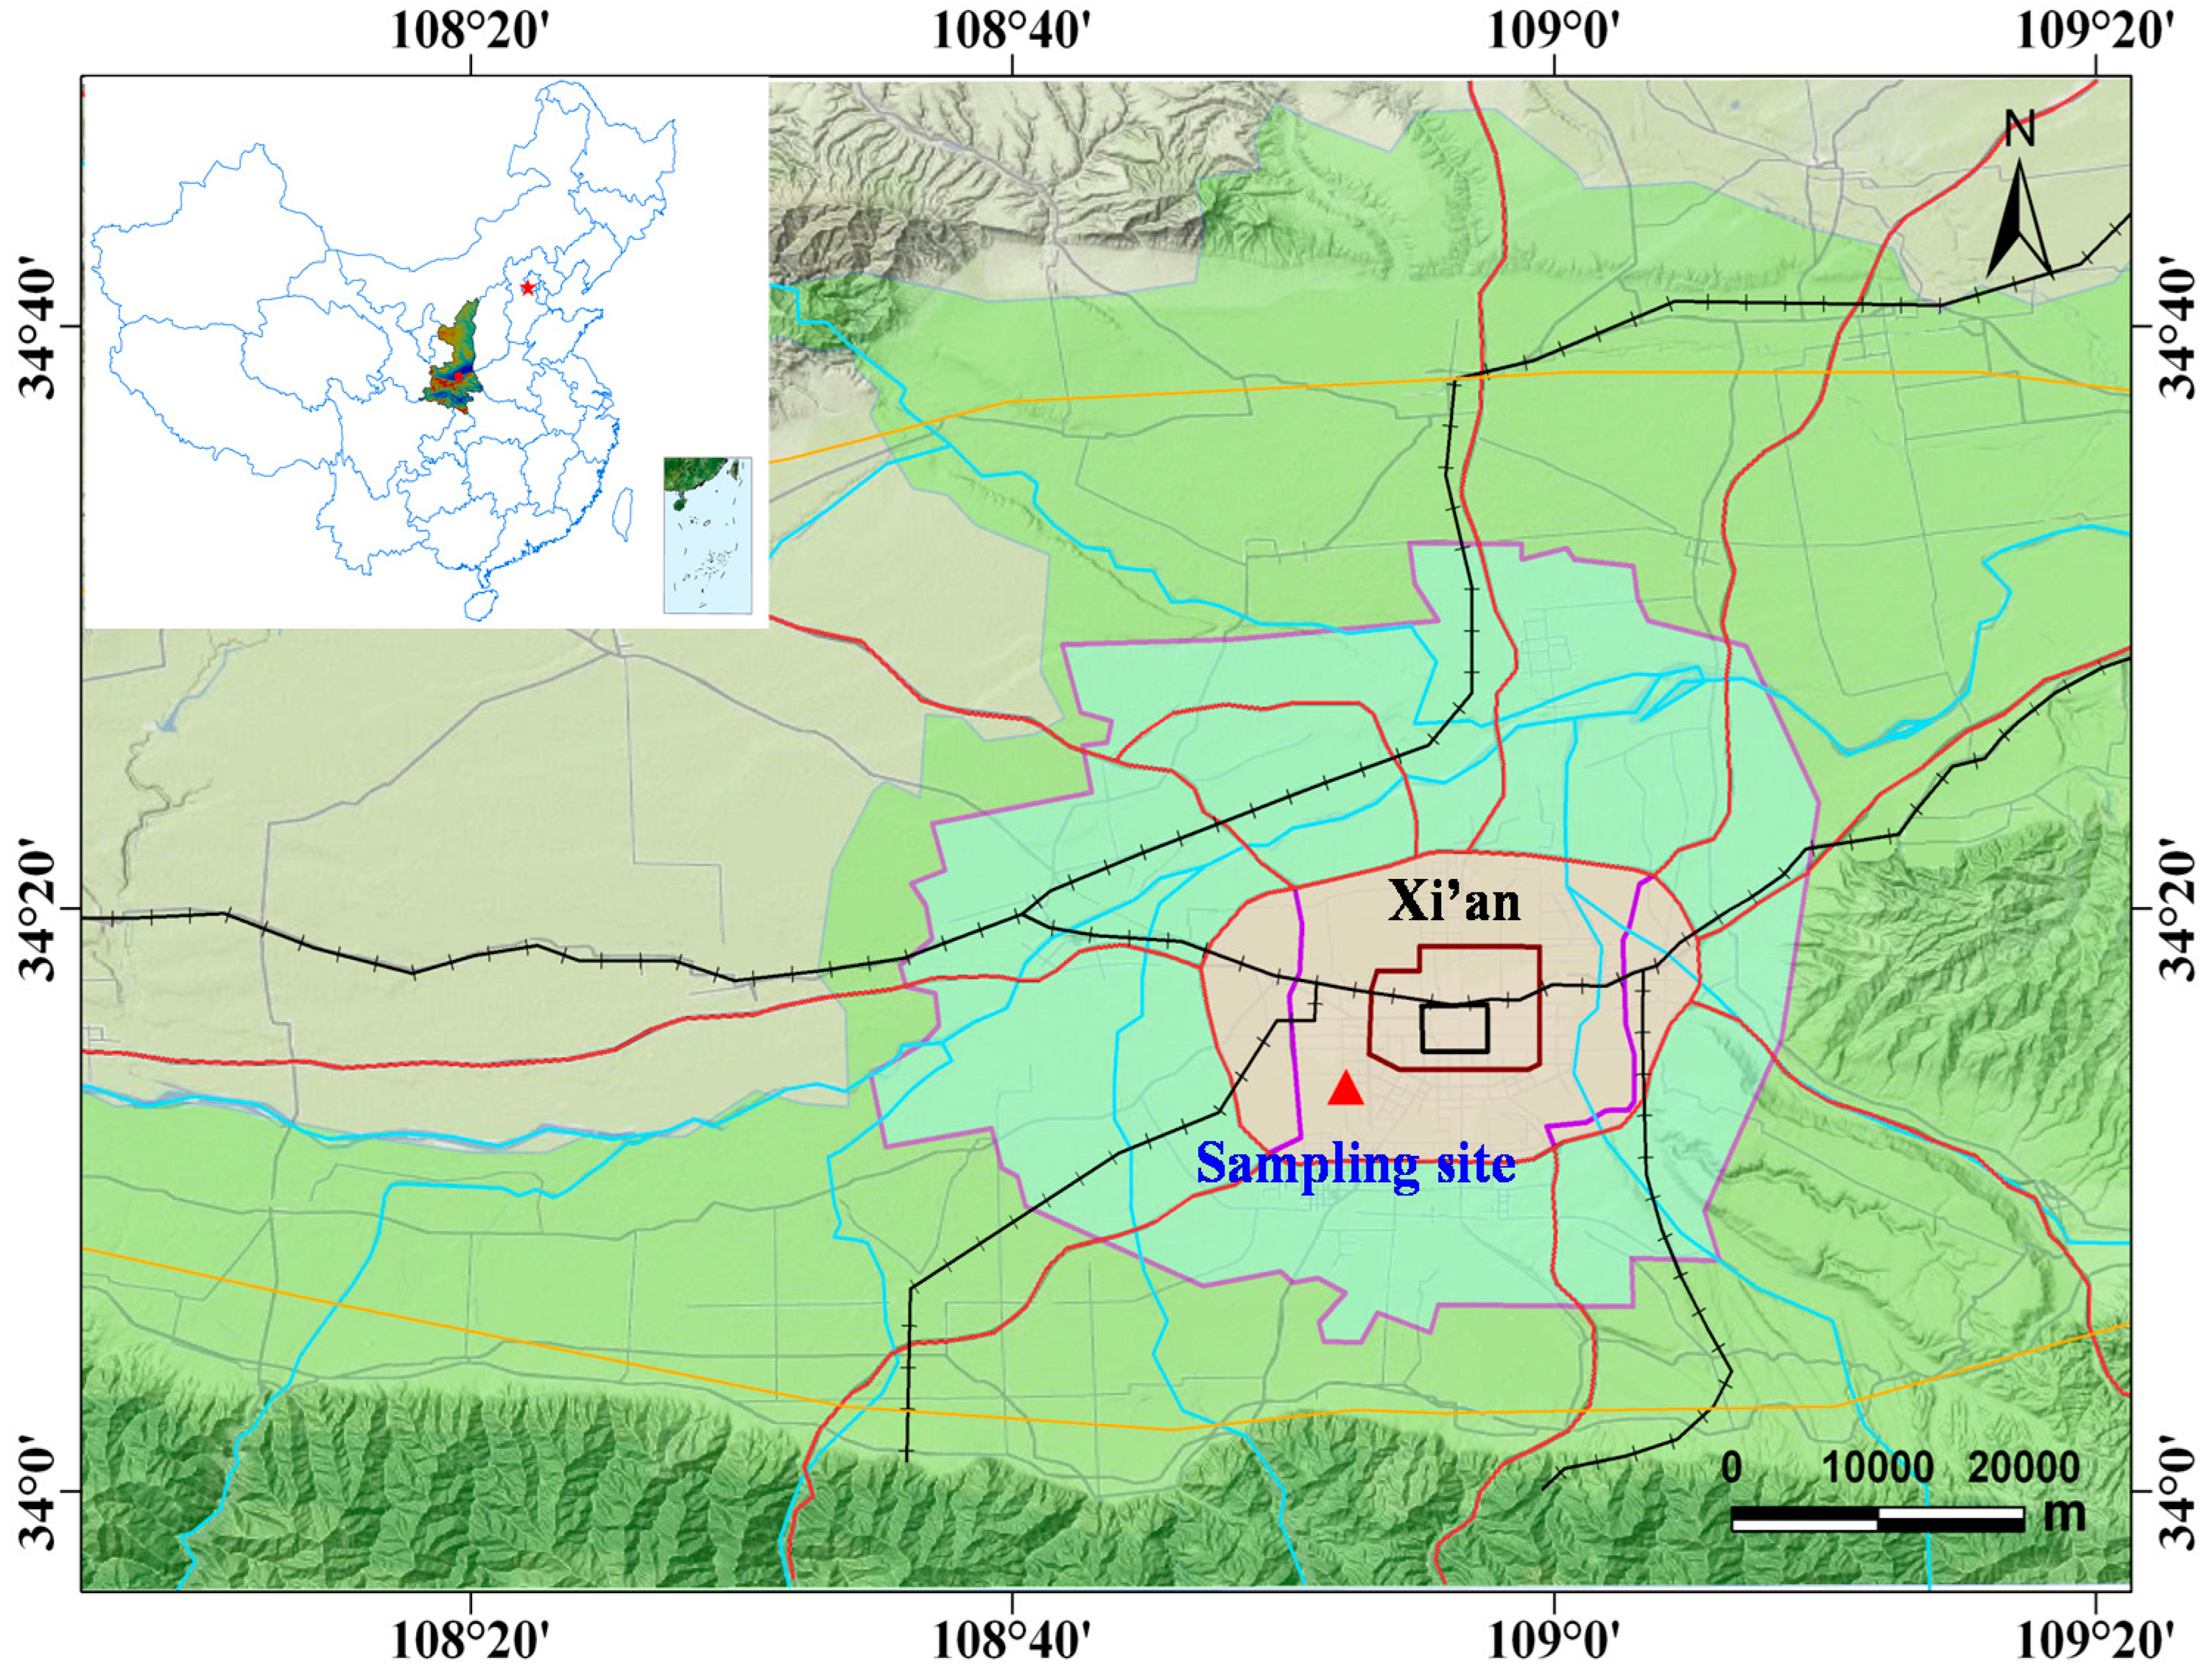
2.1. Research Site

Xi’an, one of the major tourist cities in China, is located on the Guanzhong Plain at 34°27ʹN, 108°95ʹE, and it has a population of >8 million. Measurements of rBC were made from the rooftop (~10 m above ground level) of the Institute of Earth Environment, Chinese Academy of Sciences (IEECAS; [18,19]). This monitoring site is located in an urban zone surrounded by a residential area ~15 km south of downtown Xi’an, where there are no major industrial activities or local fugitive dust sources (see Figure 1). The sampling periods were from 9 to 15 February 2013 on the Chinese Lunar Year (CLY) and from 23 December 2012 to 18 January 2013 on weekdays. The results of New Year’s Eve (9 to 10 February) are not included in the discussion in the following section to exclude the impacts of the intensive fireworks displays. Our focus is on the difference in the results due to the reduced anthropogenic emissions during the holiday.
Figure 1. Location of the Xi’an sampling site.
Atmosphere 06 00195 g001

2.2. rBC and CO Measurements

The commercially available single particle soot photometer (SP2) instrument (Droplet Measurement Technology, Boulder, CO, USA) has been proven useful for measuring rBC mass, size and mixing state [20,21,22]. The operating principles of the SP2 have been described in detail previously [23,24]. Briefly, the SP2 relies on laser-induced incandescence to quantify the rBC mass of individual particles. Continuous intracavity Nd:YAG laser light at 1064 nm is used to heat BC-containing particles to their vaporization point. The peak incandescence signal is linearly related to the rBC mass in the particle, irrespective of the particle morphology or mixing state; this holds true over most of the rBC mass range typically observed in the accumulation mode [25].
Here, the rBC mass in the range ~0.4–1000 fg, equivalent to ~70–1000 nm volume equivalent diameter (VED) is quantified, assuming a void-free density of 2.0 g·cm−3. This range covers >90% of the rBC mass in the accumulation mode. Note that the SP2 only quantifies the mass of the most refractory and most efficient light-absorbing component of combustion aerosol. We use the term “BC-containing particle” to refer to any particle containing this material, whether or not non-rBC material is present.
The incandescence signal was used to obtain the single particle rBC masses after calibration using a fullerene soot standard reference sample (Lot F12S011, AlphaAesar, Inc., Ward Hill, Massachusetts). The fullerene soot was separated by size by installing a differential mobility analyser (EPS-20 Electrical Particle Size, HCT Co. Ltd., Icheon-si, Korea) upstream of the SP2. Calibration curves were obtained from the peak intensities of the incandescence signals for the fullerene soot particles over a range of masses corresponding to rBC of ~0.35–30 fg; this was based on the mass-mobility relationships for this material described in Moteki and Kondo [26]. This mass range corresponds to ~80–450 nm VED, over which the calibration was close to purely linear: the various determinations of the mass to mobility relationship for this material are in good agreement [16,26].
The total uncertainty in the rBC mass determinations is ~25%; this is estimated by propagating the uncertainties in: (1) the rBC mass calibrations, including possible variability in the SP2’s response to ambient rBC mass (~20%, [26,27]); (2) sample flow measurements (~10%); and (3) estimates of the rBC mass outside of the SP2 detection range (~10%). The concentrations of rBC particles are corrected to standard temperature and pressure (STP: 273.15 K, 1013.25 hPa).
The SP2 has the capability of determining the rBC mixing state. The delay time between the peaks from the scattered light and incandescence signals has been used as an indicator of the amount of non-rBC material internally mixed with individual rBC particles [22,23,28]. This is a commonly-used approach for distinguishing “thinly-” from “thickly-coated” rBC particles, and it is sensitive to optically significant amounts of non-rBC material. The delay occurs because the coatings must be removed from the rBC fractions before the onset of incandescence. The number fraction of thickly-coated rBC (fBC) based on the distribution of delay times measured by the SP2 is an indication of the degree to which the rBC particles are coated with other substances. High values for fBC are consistent with more aged rBC particles, and this is due to the various processes in the ambient atmosphere that lead to the formation of coatings. In this study, the time criterion for distinguishing uncoated or thinly-coated rBC and thickly-coated rBC is 2 μs, and this is based on the observed minimum in the bimodal frequency distribution of delay times [29]. The SP2 measurement data are processed for a 1-h average for the later data analysis and discussion.
Five-minute average mixing ratios of carbon monoxide (CO) are obtained using gas-filter correlation technology with infrared photometric detection. The carbon monoxide analyser (Model EC9830T, Ecotech Pty Ltd., Knoxfield, Australia) used for these analyses has a detection limit for the CO of 20 ppbv.

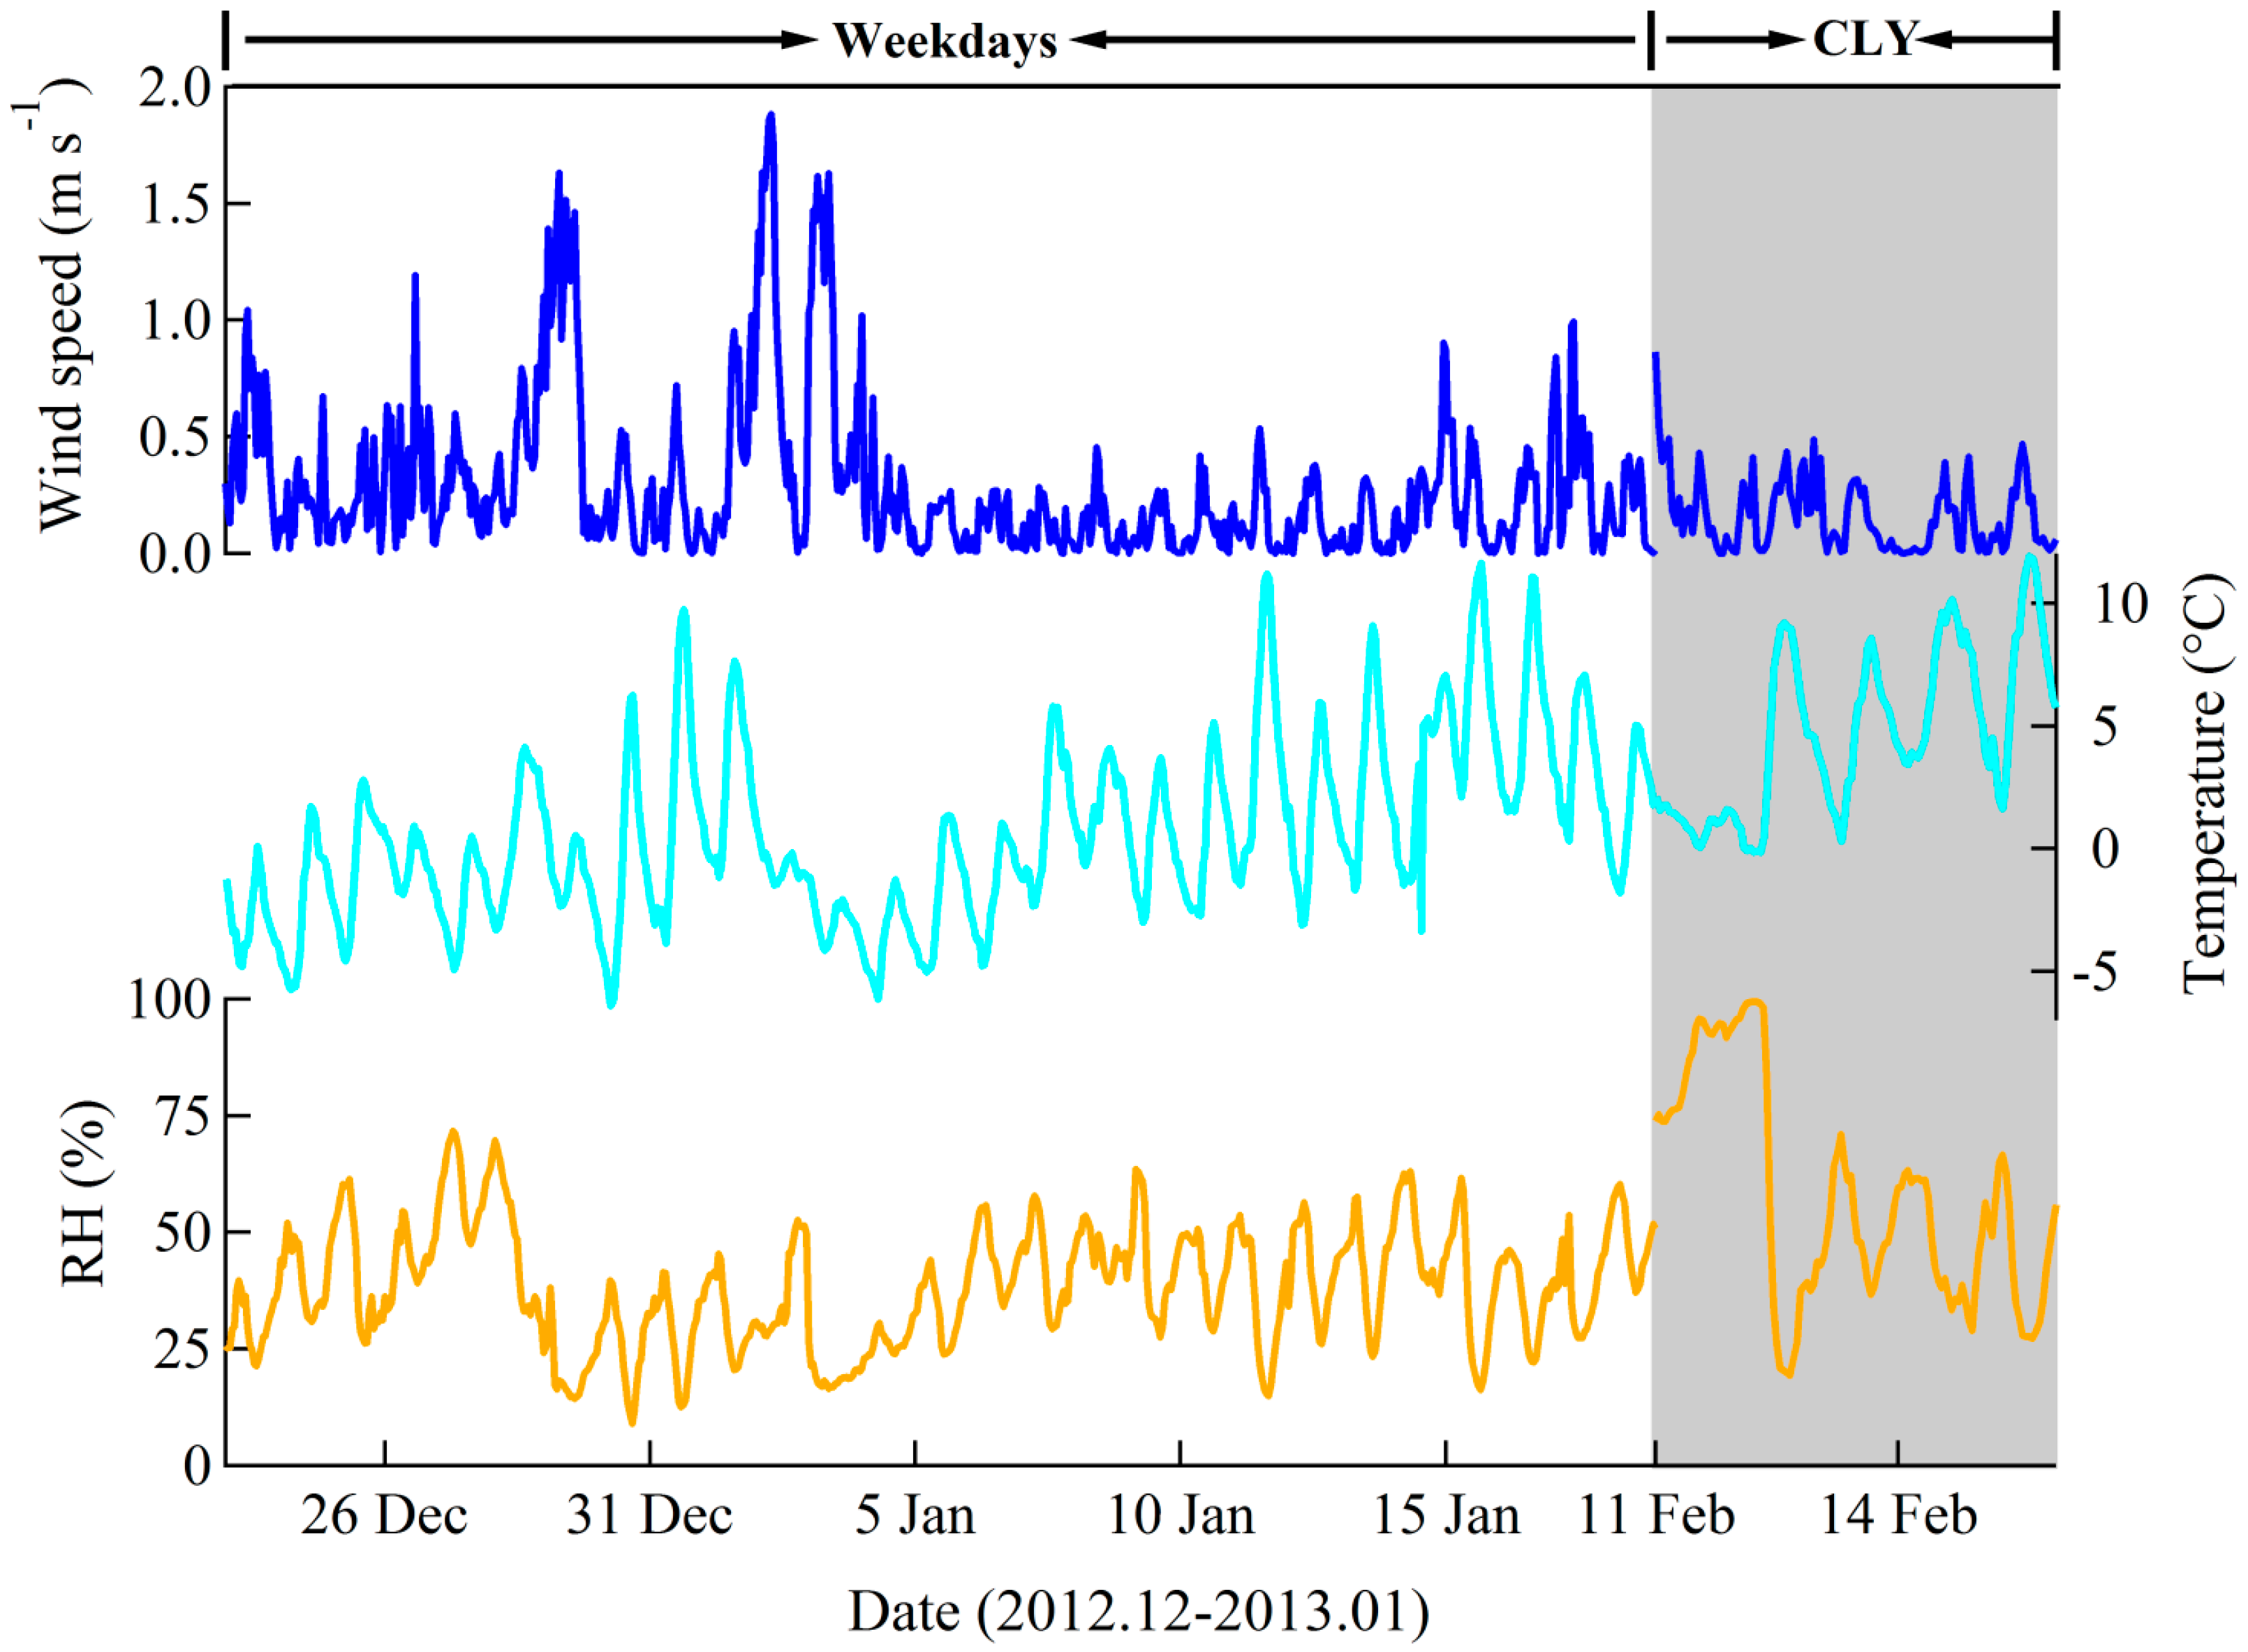
2.3. Local Meteorological Conditions

Hourly temperature, relative humidity (RH) and wind speed were measured using an automatic weather station (MAWS201, Vaisala, Vantaa, Finland) configured with an RH/temperature probe (Model QMH101) and wind sensor (Model QMW101-M2). The meteorological conditions during the campaign are presented in Figure 2. The temperature has obvious diurnal cycles, with higher values observed during the daytime. Relative humidity shows peak values during the night. The wind speed is relatively low most of the time. For CLY samples, the average temperature, RH and wind speed are 4.7 ± 3.4 °C, 57% ± 23% and 0.2 ± 0.2 m·s−1, respectively. In comparison, the average temperature, RH and wind speed are 0.6 ± 3.6 °C, 38% ± 13% and 0.3 ± 0.3·m·s−1 on weekdays, respectively.
Figure 2. Time series of hourly averaged relative humidity (RH), temperature and wind speed during the Chinese Lunar Year (CLY) and on weekdays.
Atmosphere 06 00195 g002

3. Results and Discussion
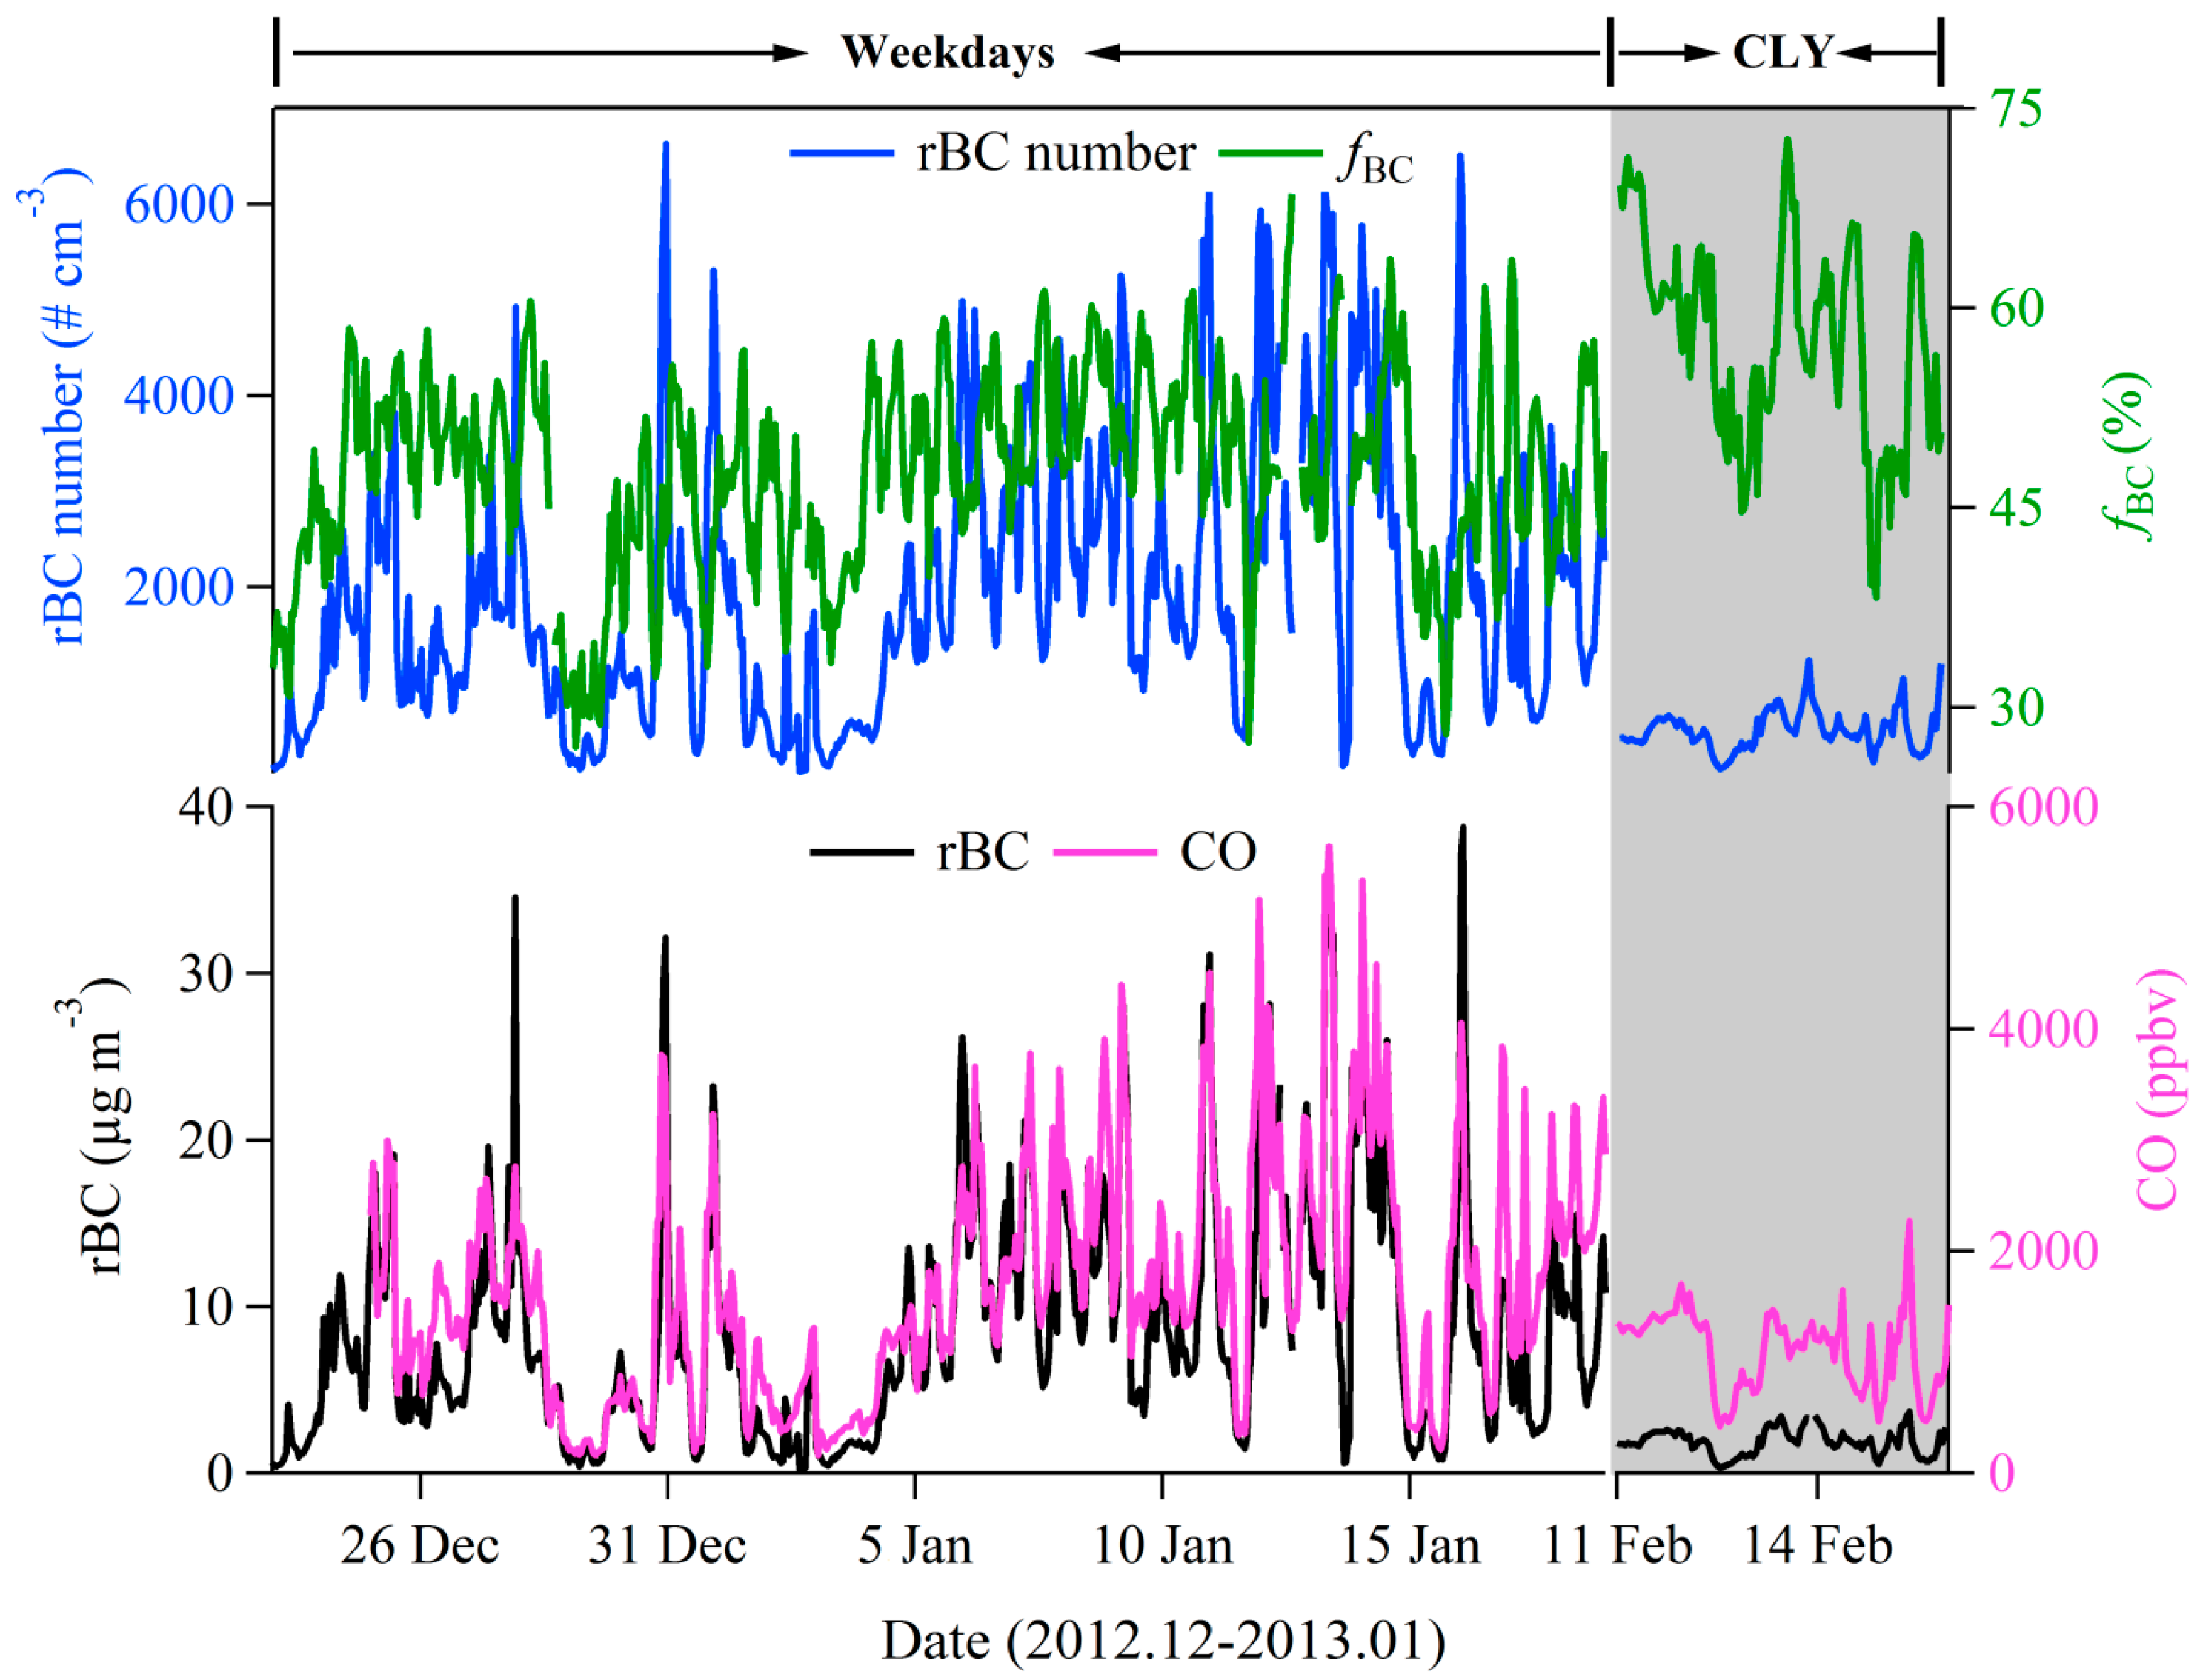
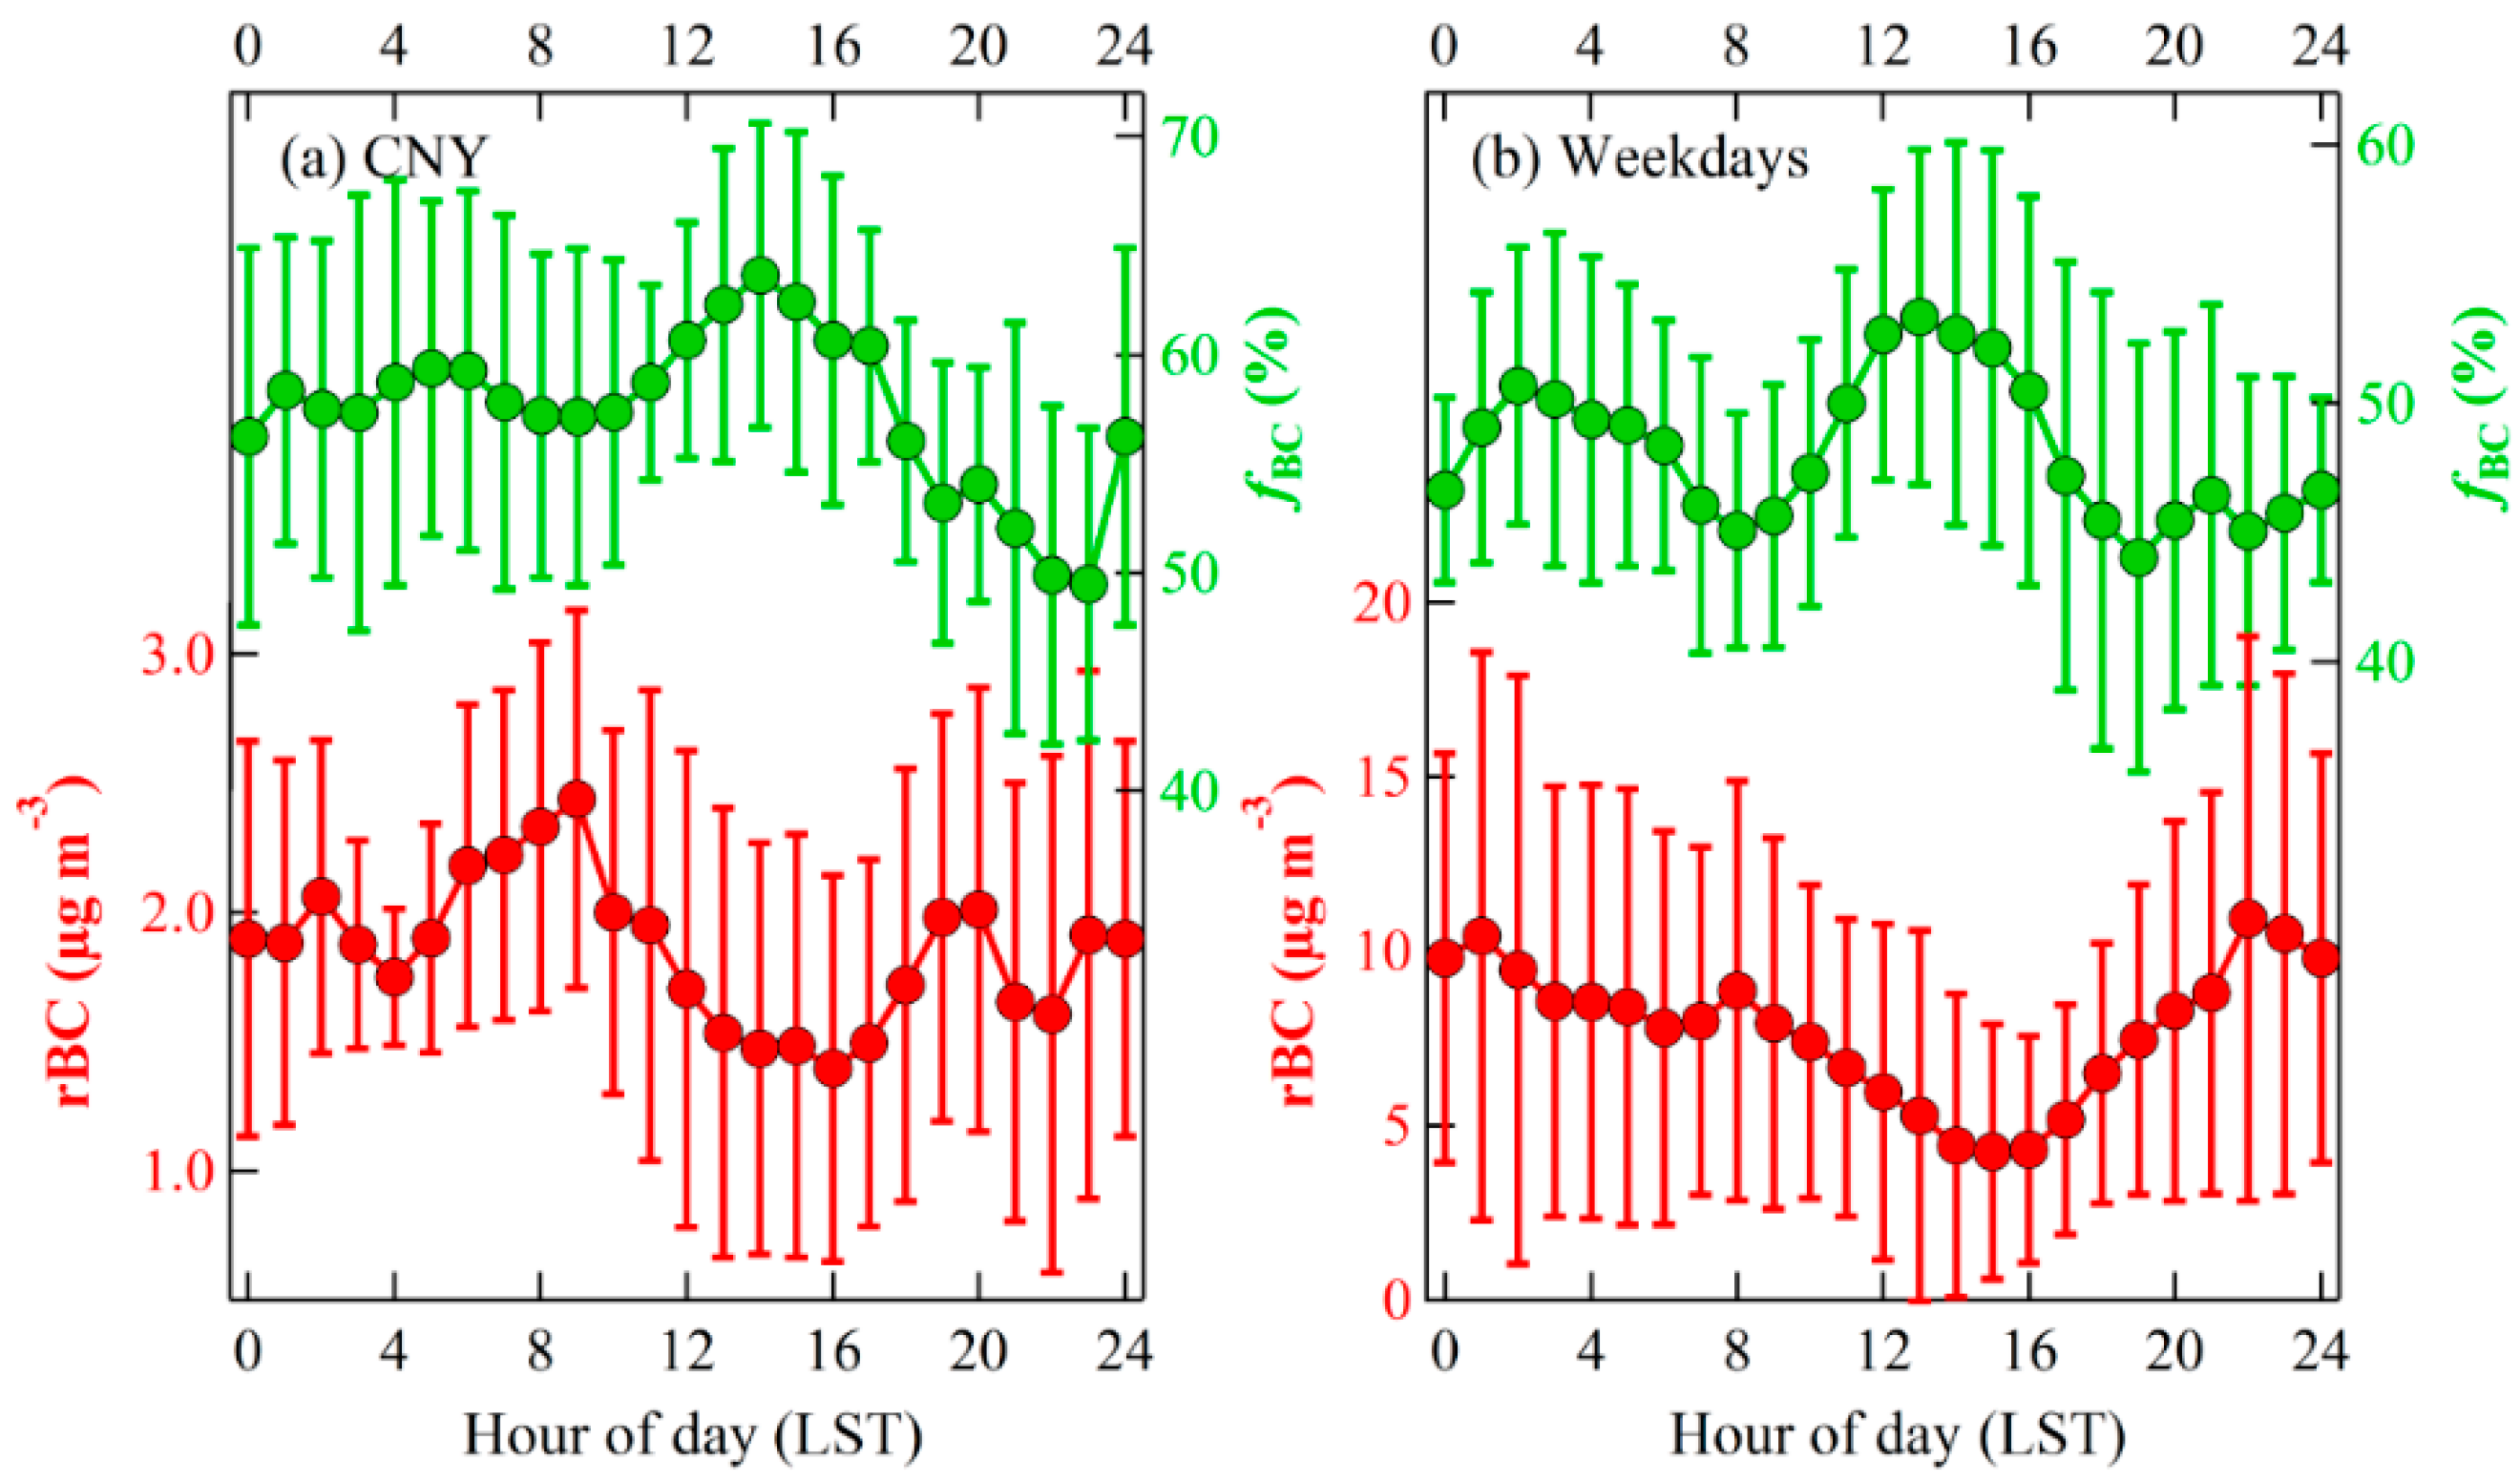
3.1. rBC Loadings

The hourly average rBC number and mass concentrations, as well as fBC values for the CLY and weekday samples are shown in Figure 3, and a statistical summary of the data is presented in Table 1. For the CLY samples, the number and mass concentrations of rBC range from 99 to 1231 cm−3 and 0.2 to 3.9 μg·m−3, with an average value of 503 ± 212 cm−3 and 1.9 ± 0.8 μg·m−3, respectively. The concentration of rBC during CLY is similar to that during clean periods, but much lower than polluted periods in Xi’an [22]. The average rBC mass concentration in this study is comparable to or lower than the values during the 2010 Shanghai World Expo (2.0 μg·m−3, measured with an SP2, [30]) and the 2008 Beijing Olympic Games (3.2 μg·m−3, measured with an Aethalometer, [31]). Anthropogenic emissions are reduced during these events in Shanghai and Beijing, because the government implements a series of air pollution control measures to improve the air quality; these include reducing emissions from coal-fired power plants and strict regulations on motor vehicle usage. In comparison, the rBC number and mass concentrations during weekdays vary from 65 to 6505 cm−3 and 0.2 to 38.8 μg·m−3, with an average value of 1,850 ± 1242 cm−3 and 8.4 ± 6.5 μg·m−3, respectively. The high standard deviation suggests that there is a large BC burden on weekdays. The average rBC value on weekdays exceeds the average value of the CLY by a factor of approximately five. The enhanced rBC loadings on weekdays are almost certainly due to the greater impacts from the ongoing anthropogenic activities that pollute the air.
Figure 3. Time series of the hourly averaged refractory black carbon (rBC) number and mass concentrations, the number fraction of thickly-coated rBC and the CO mixing ratio during the Chinese Lunar Year (CLY) and on weekdays.
Atmosphere 06 00195 g003
Table 1. Summary of the rBC number and mass concentrations, as well as the number fractions of thickly-coated rBC (fBC) during the Chinese Lunar Year and on weekdays.
Chinese Lunar YearWeekdays
rBC (cm−3)rBC (μg·m−3)fBC (%)rBC (cm−3)rBC (μg·m−3)fBC (%)
Average5031.957.518508.448.3
SD2120.88.212426.56.9
Maximum12313.976.1650538.863.6
Minimum990.226.7650.227.3
In Figure 4, the diurnal variations in rBC mass, as well as fBC measured over Xi’an during the CLY and weekdays are plotted. A clear diurnal variation in rBC concentrations is observed for the weekdays with a broad nocturnal maximum from around 22:00 to 03:00 local standard time (LST), which is consistent with rBC variation during the polluted period in Xi’an [22]. This maximum can be explained by the development of a shallow and stable boundary layer caused by nocturnal radiative cooling; this leads to the build-up of pollutants, including emissions from evening rush-hour traffic, residential heating during cold weather and diesel vehicles at midnight. The rBC loadings then are maintained at a relatively high level. This stability condition is followed by a sharp increase to the daytime peak concentrations from 08:00 to 09:00 LST, which can be attributed to the morning rush-hour traffic. The increased solar heating as the day advances produces a deeper and more turbulent boundary layer, and that leads to greater dispersion and dilution of rBC in the near surface air. Finally, the rBC concentrations decrease gradually, and a diurnal minimum is reached in the afternoon (14:00–17:00 LST). The diurnal variations in rBC mass during the CLY show different features from the weekdays, and those differences are likely linked to local dynamics. The maximum rBC mass loadings occur between 09:00 and 10:00 LST, and the high loadings are followed by a sharp decrease to daytime lows from 14:00 to 17:00 LST. The mass increases again to reach a nocturnal peak around 20:00–21:00 LST.
Figure 4. Diurnal variations of hourly averaged rBC mass (red dots) and the number fraction of thickly-coated rBC particles (fBC) (green dots) during (a) the Chinese Lunar Year and (b) on weekdays. Vertical lines indicate one standard deviation. LST stands for local standard time.
Atmosphere 06 00195 g004

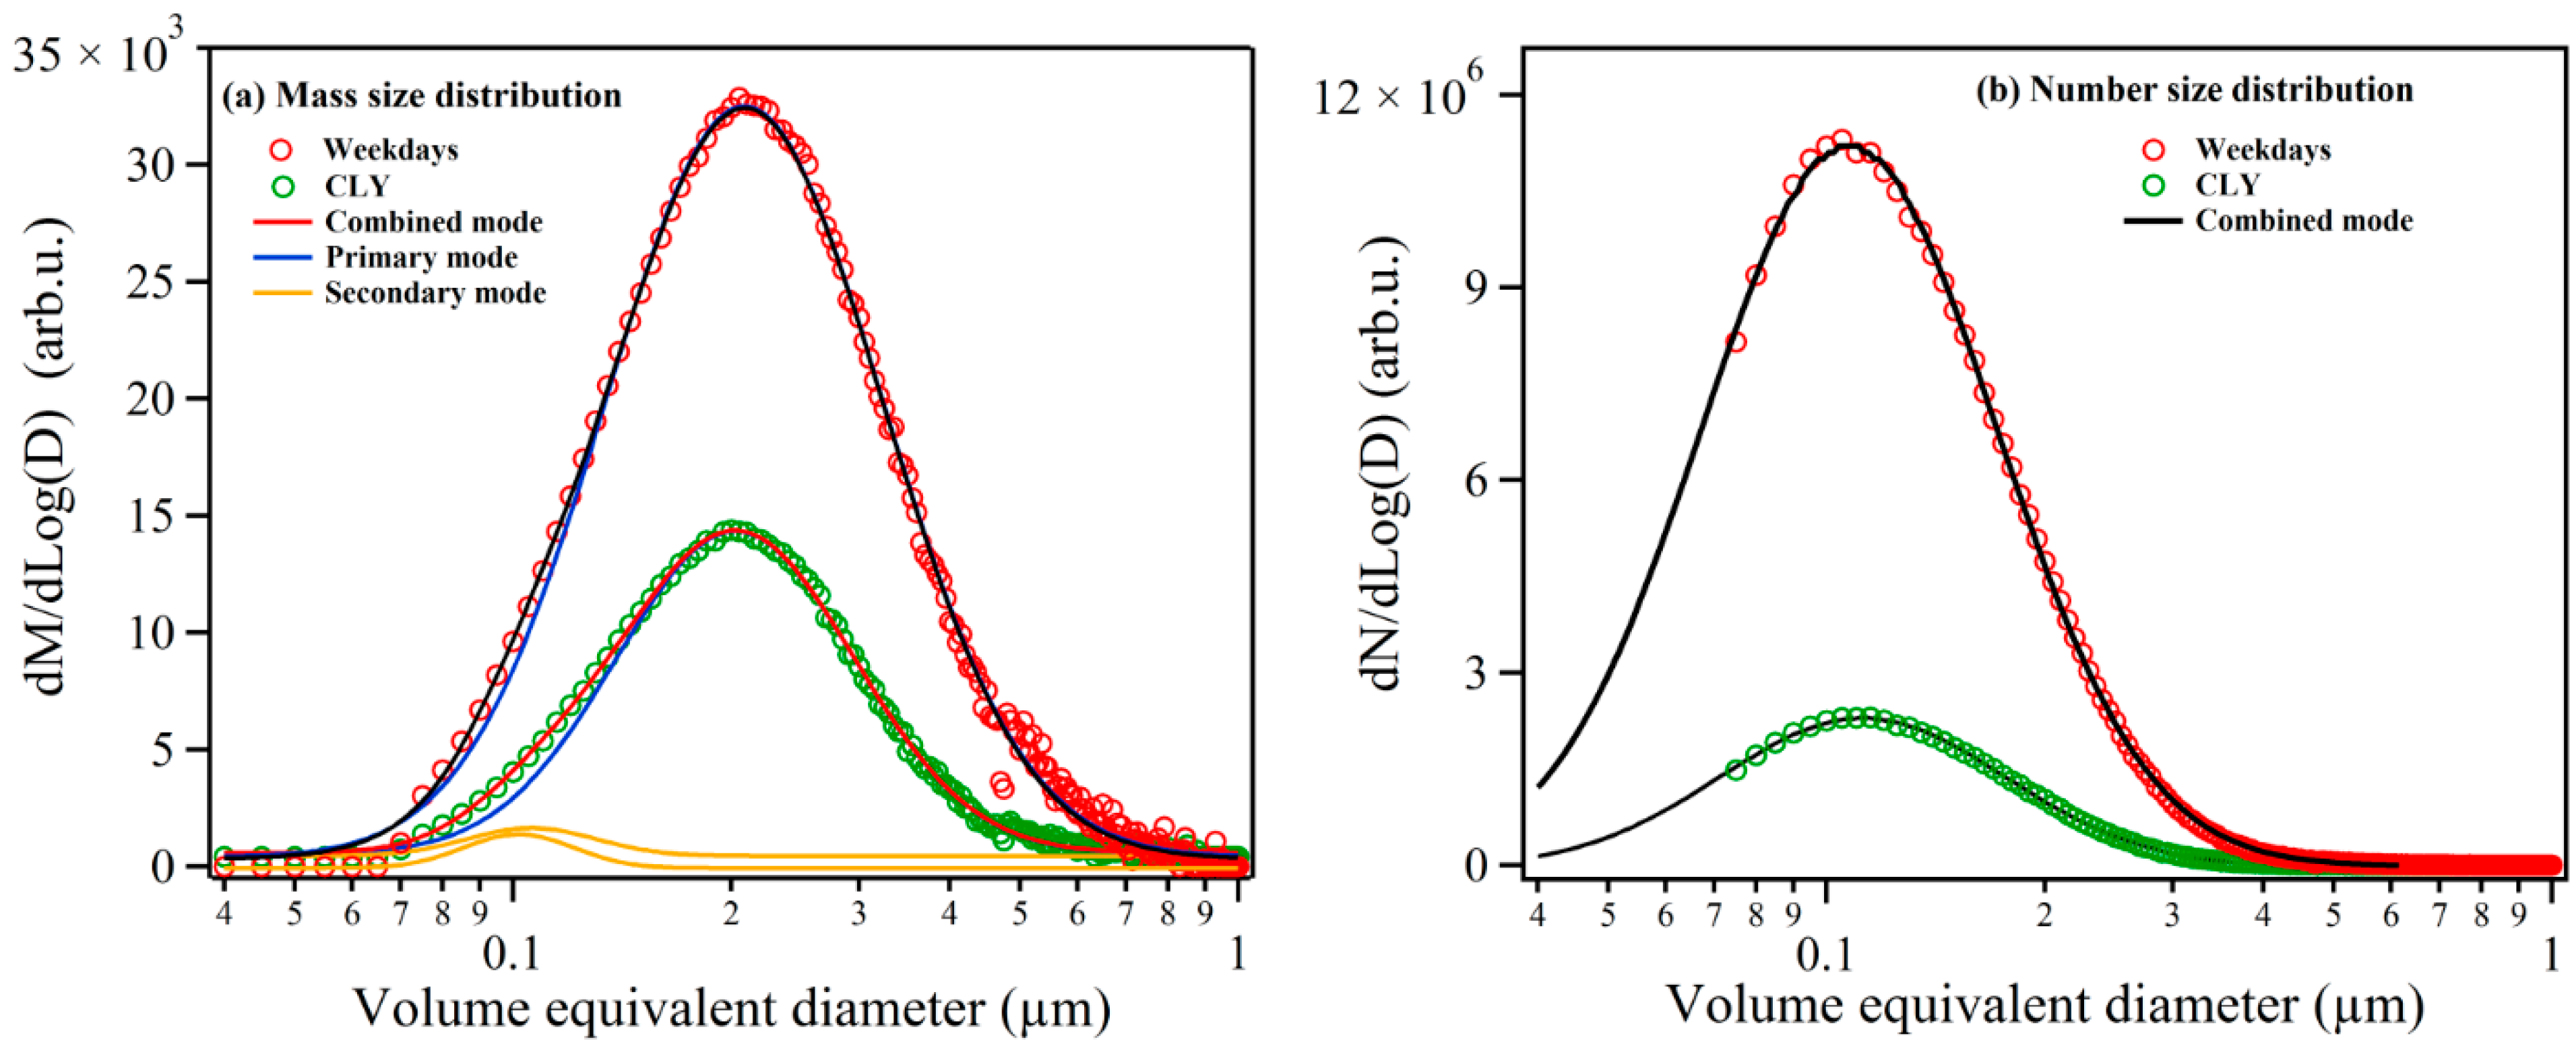
3.2. rBC Mass Size and Mixing State

The mixing state of BC aerosol is one of the major uncertainties in the models used to evaluate BC direct radiative forcing [3]. As shown in Table 1, the hourly average fBC ranges from 26.7% to 76.1%, with an average of 57.5% during the CLY; this high percentage of thickly-coated particles shows that rBC aerosol is mainly composed of aged particles during the festival. The remaining particles are classified as either “thinly-coated” or “uncoated”. In comparison, on weekdays, fBC varies from 27.3% to 63.6%, with an average of 48.3%, which is ~20% lower than during the CLY. Due to the high loadings of particulates on weekdays, the organics may be the primary contributor to rBC coatings [22].
The diurnal patterns in fBC during the CLY and weekdays show similar trends, with high values in the afternoon and low values at night (Figure 4), which is consistent with the fBC pattern during the polluted period in Xi’an [22]. Generally, the afternoon fBC peaks in both sets of samples are anti-correlated with the rBC concentrations. There are two possible mechanisms to explain this relationship. First, greater convection in the afternoon would bring more aged air masses from the upper atmosphere to the sampling site, and this aged air would tend to contain more internally-mixed rBC particles [14,15]. Second, the strong solar irradiance in the mid-afternoon would favour photochemical oxidation processes that would lead to the mixing of rBC with other chemical species. On weekdays, the low fBC in the early morning and late evening can be attributed to increases in fresh, externally-mixed, rBC particles from vehicles during rush hour.
Figure 5. (a) Mass and (b) number size distributions of rBC for the Chinese Lunar Year (CLY) and on weekdays. A two-mode lognormal function fits the data of mass size distribution, while a single-mode lognormal function fits the data of number size distribution. “M” and “D” in the vertical labels represent rBC mass and diameter, respectively.
Atmosphere 06 00195 g005
Figure 5 compares the rBC number and mass size distributions for the CLY and weekday samples. It should be noted that the rBC size as used here refers to the VED of the “core”, and that does not include the contribution of the non-rBC material to the particle diameter. It is found that the number size distributions for CLY and weekday rBC particles show a single lognormal distribution, but a two-mode lognormal function is a better fit for the mass size distribution. Furthermore, the mass size distributions during the CLY and weekdays exhibit similar patterns. The primary mode has a peak at ~205 nm, consistent with the results obtained in the lower troposphere at a site in Texas, USA [32], the surface atmosphere of San Jose, USA [14], and Shenzhen, China [28]. A secondary mode in our samples peaks at ~102 nm, and it contains ~5% of the total rBC mass. Wang et al. [33] and Huang et al. [34] find a larger secondary mode in rural areas of Qinghai Lake (mass median diameter, MMD: 495 nm) and Kaiping (MMD: 690 nm), China, where biofuel/biomass burning are the main sources for rBC. Previous studies have shown that rBC particles from biomass burning tend to be rather large [35], while motor vehicles generally emit smaller rBC particles [36,37]. Thus, the small secondary size mode in Xi’an may be the result of vehicular emissions. However, further studies of rBC emission sources should be conducted to confirm this possibility.

2.3. Relationship between rBC and CO
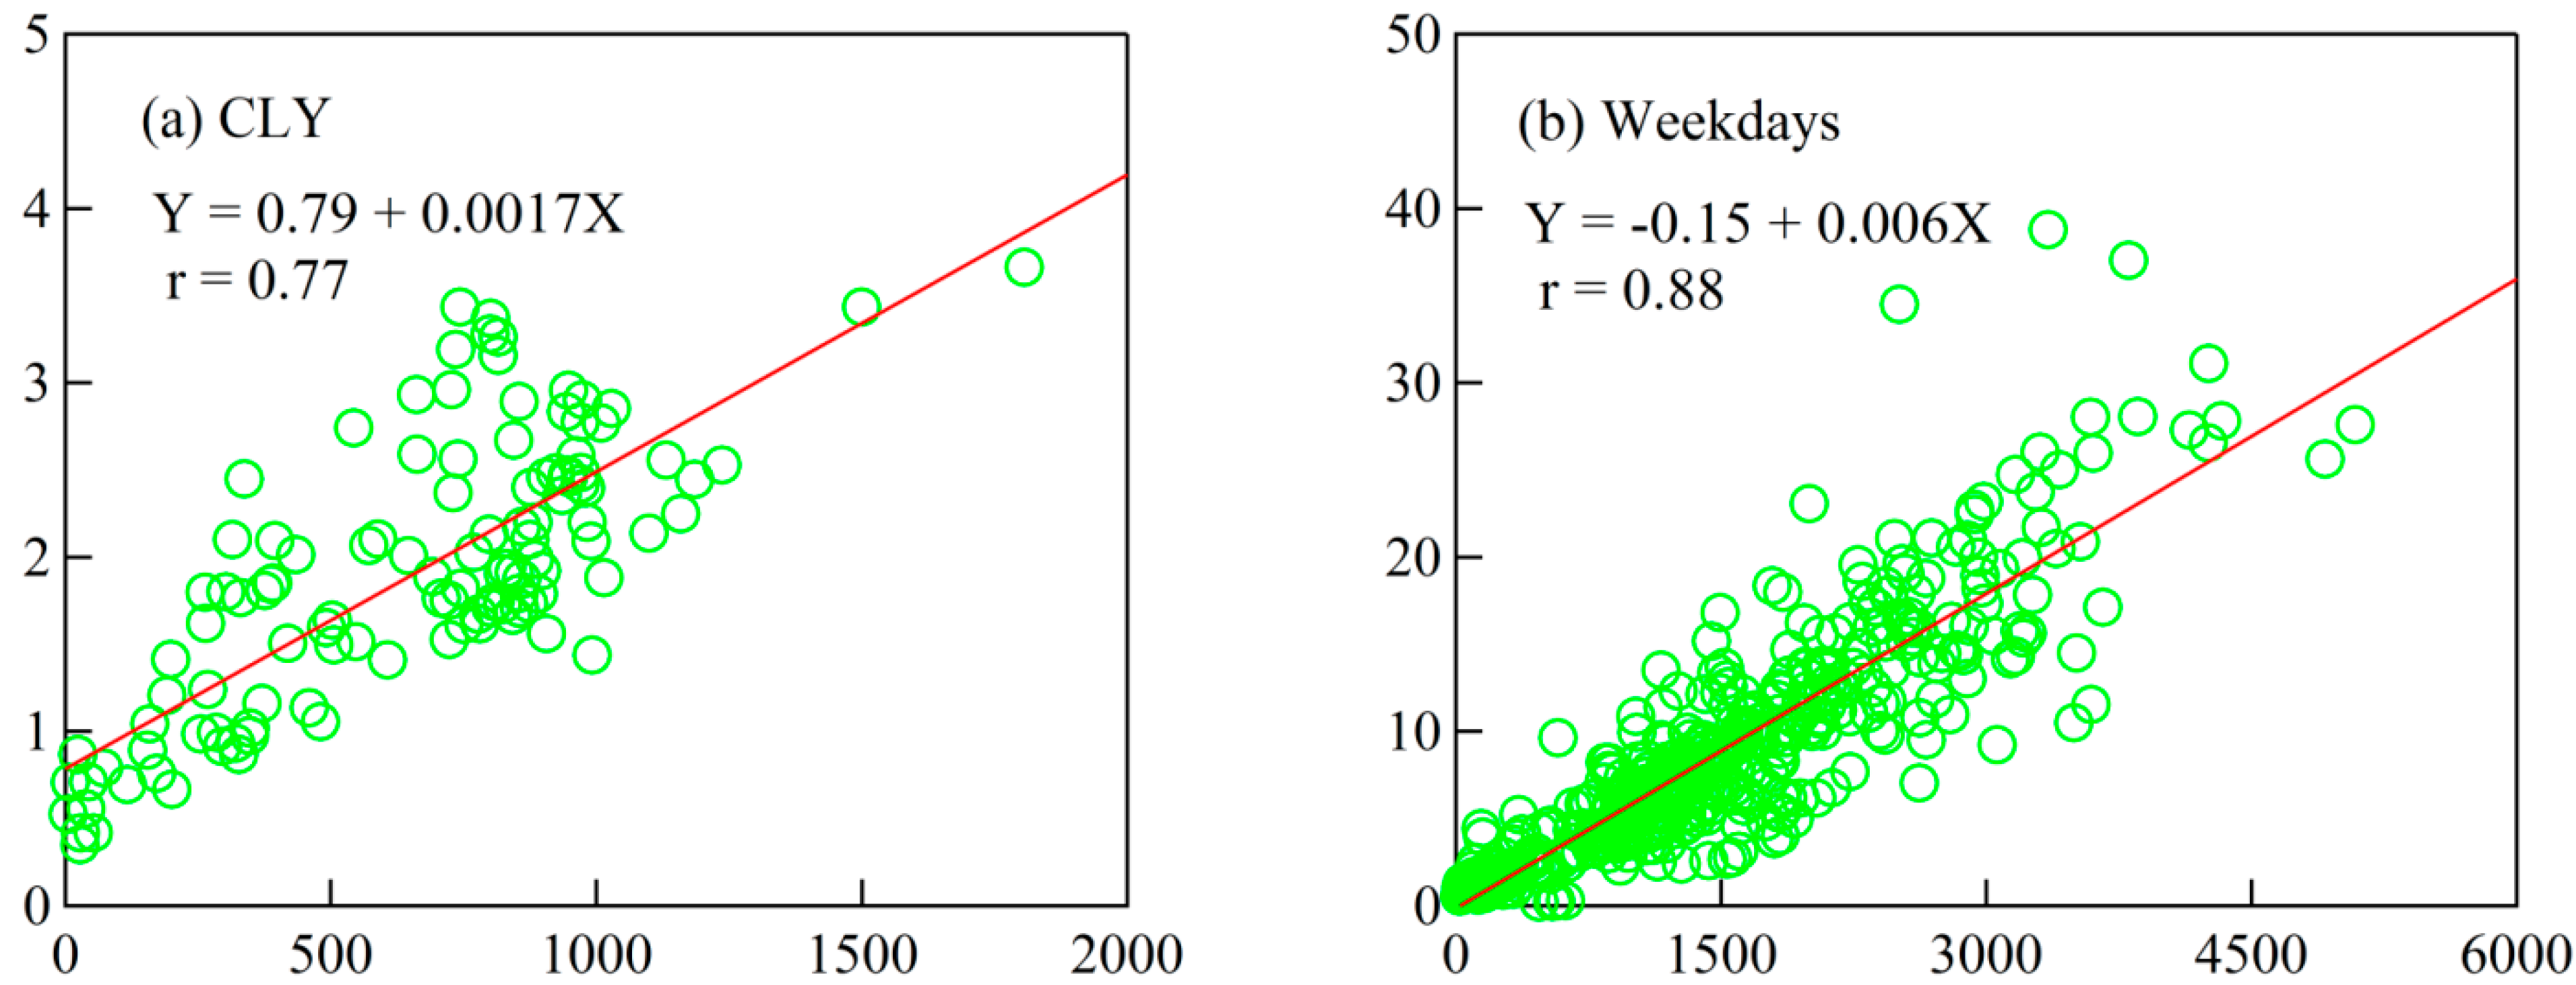
BC has been found to be correlated with CO in urban areas [12,38], and this is reasonable, because both species are produced by the incomplete combustion of carbon-based fuels. The BC and CO relationship is controlled by the balance between emission sources and sinks. The emission ratios of BC/CO also can vary significantly with the types of emission sources. For example, the BC/CO emission ratios are known to be much higher for diesel engines compared with those for gasoline engines [39]. Thus, the BC/CO ratios can indicate the relative contributions of different sources. In addition, region-specific BC/CO values can be used to evaluate the regional emission inventory of BC and CO [40], and it is also an important constraint on global and regional air quality models [41].
Figure 6. Scatter plots of hourly rBC concentrations versus ΔCO mixing ratios during the (a) Chinese Lunar Year (CLY) and (b) weekdays. The solid lines show linear fits to the data.
Atmosphere 06 00195 g006
Furthermore, the relationship between BC and CO typically changes with time; this is because the atmospheric lifetime of BC is much shorter than that of CO, primarily due to the fact that BC is removed by wet deposition, but CO is not. As a result, the rBC/CO ratios are most informative after correcting for the rBC and CO background. The background concentrations of CO for the CLY and weekdays are defined as the 1.25th percentile of the CO values [38], while the background of the rBC concentration is assumed as zero [42]. The rBC concentrations observed during the CLY and weekdays are plotted against the background-corrected CO concentrations (ΔCO) in Figure 6. A relatively strong relationship between rBC and CO is observed for the weekdays (correlation coefficient, r = 0.88), indicating that the two substances are probably controlled by similar sources. Considering the large quantities of coal burned in winter and the heavy workday traffic, the slope of 0.0060 μg·m−3·ppbv−1 presumably represents the rBC/ΔCO ratio typical of these emissions in winter. The rBC also correlates well (r = 0.77) with ΔCO during the CLY with a slope of 0.0017 μg·m−3·ppbv−1. Compared to weekdays, the rBC/ΔCO ratio is much lower during the CLY. This may be attributed to the reduced anthropogenic activities during the CLY, such as coal burning and diesel vehicles.
For further perspective, the rBC/ΔCO ratio derived from this study is compared with the results of other studies (Table 2). The rBC/ΔCO ratios during two sampling periods here are within the range (0.0008–0.0062 μg·m−3·ppbv−1) measured in the boundary layer over Europe [43]. The rBC/ΔCO ratio for the CLY is lower than the values for most of the cities listed in Table 2. The rBC/ΔCO ratio on weekdays is towards the upper limit of the values in Beijing (0.0035 to 0.0058 μg·m−3·ppbv−1; [12]). Kondo et al. [40] reports values of 0.0057 and 0.0063 μg·m−3·ppbv−1 for Tokyo and Nagoya, Japan; these are both comparable to what we observed on weekdays in Xi’an. In contrast, the rBC/CO slope on weekdays in Xi’an is higher than that of Mexico City (0.001 μg·m−3·ppbv−1; [44]) or Guangzhou, China (0.0045 μg·m−3·ppbv−1; [45]).
Table 2. Comparison of rBC concentrations to background-corrected CO mixing ratios (rBC/ΔCO) in Xi’an with other areas.
LocationSampling PeriodrBC/ΔCOMethod aReference
Xi’an, ChinaDecember 2012/January 2013 February 20130.0060 0.0017SP2This study
Beijing, ChinaNovember 2005–October 20060.0035–0.0058TOT[12]
Guangzhou, ChinaJuly 20060.0045EC-OC aerosol analyser[45]
Multiple sites in EuropeApril/May/September 20080.0008–0.0062SP2[44]
Tokyo, JapanMay 2003–February 20050.0057TOT[40]
Nagoya, JapanMarch 20030.0063Light absorption[40]
MexicoApril 2003/20050.001SP2[45]
Notes: a SP2 stands for single particle soot photometer; TOT is thermal optical transmittance; EC is elemental carbon and OC is organic carbon.

4. Conclusions

An SP2 and a CO instrument were deployed at Xi’an to: (1) characterize the rBC mass, size distribution and mixing state; and (2) investigate the relationship between rBC and CO. Comparisons were made between samples collected during the Chinese Lunar Year (CLY), when anthropogenic emissions were reduced, and samples collected on normal weekdays. The average rBC mass concentration on weekdays (8.4 μg·m−3) exceeds the average value for the CLY (1.9 μg·m−3) by almost five-fold. Different diurnal variations in rBC are observed for the CLY and weekday samples, and this can be explained by the pollution prevention measures during the holiday. The average number fraction of thickly-coated rBC (fBC) during the CLY is 57.5%, suggesting that aged particles compose the major fraction of the rBC aerosol. In comparison, the average fBC is considerably lower (48.3%) on weekdays. Higher fBC values for both sampling periods are observed in the afternoon; this is likely due to the formation of photochemical oxidation products and stronger influences from vertical transport during the afternoon. The rBC size distributions for both sampling periods are lognormal and bi-modal; both have a primary peak at ~205 nm, which most likely reflects the variety of rBC sources in Xi’an. The peak diameter of the secondary mode is ~102 nm, and this secondary peak represents only ~5% of the total rBC mass. This persistent secondary mode may be associated with motor vehicle emissions. Strong correlations are observed between rBC and CO during the CLY celebration and on weekdays, indicating that the two species are controlled by similar sources. The average rBC/ΔCO ratio on weekdays is 0.0060 μg·m−3·ppbv−1, and this is arguably representative of air masses impacted by the pervasive pollution emissions. However, reduced anthropogenic activities during the CLY lead to a decrease in the rBC/ΔCO ratio (0.0017 μg·m−3·ppbv−1) compared with weekdays.

Acknowledgments

This study is supported by the National Natural Science Foundation of China (41230641, 41271481, 40925009) and projects from the “Strategic Priority Research Program” of the Chinese Academy of Science (XDB05060500, XDA05100401), the Ministry of Science & Technology (2012BAH31B03) and the Shaanxi Government (2012KTZB03-01-01).

Author Contributions

This work has been performed in collaboration among all of the authors. Junji Cao, Yongming Han, Rujin Huang and Qiyuan Wang conceived of and designed the experiments. Qiyuan Wang, Suixin Liu, Yaqing Zhou, Haiyan Ni and Ningning Zhang performed the experiments. Qiyuan Wang carried out the main part of the writing, although all co-authors have contributed to the text.

Conflicts of Interest

The authors declare no conflict of interest.

References

  1. Ramanathan, V.; Carmichael, G. Global and regional climate changes due to black carbon. Nat. Geosci. 2008, 1, 221–227. [Google Scholar] [CrossRef]
  2. Chung, C.E.; Lee, K.; Mueller, D. Effect of internal mixture on black carbon radiative forcing. Tellus 2012, 64, 1–13. [Google Scholar] [CrossRef] [Green Version]
  3. Bond, T.C.; Doherty, S.J.; Fahey, D.W.; Forster, P.M.; Berntsen, T.; de Angelo, B.J.; Flanner, M.G.; Ghan, S.; Kärcher, B.; Koch, D.; et al. Bounding the role of black carbon in the climate system: A scientific assessment. J. Geophys. Res. 2013, 118, 5380–5552. [Google Scholar]
  4. Twohy, C.H.; Poellot, M.R. Chemical characteristics of ice residual nuclei in anvil cirrus clouds: Evidence for homogeneous and heterogeneous ice formation. Atmos. Chem. Phys. 2005, 5, 2289–2297. [Google Scholar] [CrossRef]
  5. Mordukhovich, I.; Wilker, E.; Suh, H.; Wright, R.; Sparrow, D.; Vokonas, P.S.; Schwartz, J. Black carbon exposure, oxidative stress genes, and blood pressure in a repeated-measures study. Environ. Health Perspect. 2009, 117, 1767–1772. [Google Scholar] [PubMed]
  6. Cao, J.J.; Xu, H.M.; Xu, Q.; Chen, B.H.; Kan, H.D. Fine particulate matter constituents and cardiopulmonary mortality in a heavily polluted Chinese city. Environ. Health Perspect. 2012, 120, 373–378. [Google Scholar] [CrossRef] [PubMed]
  7. Shindell, D.; Kuylenstierna, J.C.I.; Vignati, E.; van Dingenen, R.; Amann, M.; Klimont, Z.; Anenberg, S.C.; Muller, N.; Janssens-Maenhout, G.; Raes, F.; et al. Simultaneously mitigating near-term climate change and improving human health and food security. Science 2012, 335, 183–189. [Google Scholar] [CrossRef]
  8. Cao, J.J.; Wang, Q.Y.; Chow, J.C.; Watson, J.G.; Tie, X.X.; Shen, Z.X.; Wang, P.; An, Z.S. Impacts of aerosol compositions on visibility impairment in Xi’an, China. Atmos. Environ. 2012, 59, 559–566. [Google Scholar] [CrossRef]
  9. Wang, Q.Y.; Cao, J.J.; Tao, J.; Li, N.; Su, X.L.; Chen, L.A.; Wang, P.; Shen, Z.X.; Liu, S.X.; Dai, W.T. Long-term trends in visibility and at Chengdu, China. PLoS One 2013, 8, e68894. [Google Scholar] [CrossRef] [PubMed]
  10. Huang, R.-J.; Zhang, Y.; Bozzetti, C.; Ho, K.-F.; Cao, J.-J.; Han, Y.; Daellenbach, K.R.; Slowik, J.G.; Platt, S.M.; Canonaco, F.; et al. High secondary aerosol contribution to particulate pollution during haze events in China. Nature 2014, 514, 218–222. [Google Scholar]
  11. Lei, Y.; Zhang, Q.; He, K.; Streets, D. Primary anthropogenic aerosol emission trends for China. Atmos. Chem. Phys. 2011, 11, 931–954. [Google Scholar] [CrossRef]
  12. Han, S.; Kondo, Y.; Oshima, N.; Takegawa, N.; Miyazaki, Y.; Hu, M.; Lin, P.; Deng, Z.; Zhao, Y.; Sugimoto, N.; et al. Temporal variations of elemental carbon in Beijing. J. Geophys. Res. 2009, 114, D23202. [Google Scholar] [CrossRef]
  13. Cao, J.J.; Tie, X.X.; Xu, B.Q.; Zhao, Z.Z.; Zhu, C.S.; Li, G.H.; Liu, S.X. Measuring and modeling black carbon (BC) contamination in the SE Tibetan Plateau. J. Atmos. Chem. 2010, 67, 45–60. [Google Scholar] [CrossRef]
  14. Schwarz, J.P.; Spackman, J.R.; Fahey, D.W.; Gao, R.S.; Lohmann, U.; Stier, P.; Watts, L.A.; Thomson, D.S.; Lack, D.A.; Pfister, L.; et al. Coatings and their enhancement of black carbon light absorption in the tropical atmosphere. J. Geophys. Res. 2008, 113, D03203. [Google Scholar]
  15. Shiraiwa, M.; Kondo, Y.; Moteki, N.; Takegawa, N.; Sahu, L.; Takami, A.; Hatakeyama, S.; Yonemura, S.; Blake, D. Radiative impact of mixing state of black carbon aerosol in Asian outflow. J. Geophys. Res. 2008, 113, D24210. [Google Scholar] [CrossRef]
  16. Gysel, M.; Laborde, M.; Olfert, J.S.; Subramanian, R.; Gröhn, A.J. Effective density of aquadag and fullerene soot black carbon reference materials used for SP2 calibration. Atmos. Measur. Tech. 2011, 4, 2851–2858. [Google Scholar] [CrossRef] [Green Version]
  17. Kondo, Y.; Sahu, L.; Moteki, N.; Khan, F.; Takegawa, N.; Liu, X.; Koike, M.; Miyakawa, T. Consistency and traceability of black carbon measurements made by laser-induced incandescence, thermal-optical transmittance, and filter-based photo-absorption techniques. Aerosol Sci. Technol. 2011, 45, 295–312. [Google Scholar] [CrossRef]
  18. Cao, J.J.; Wu, F.; Chow, J.C.; Lee, S.C.; Li, Y.; Chen, S.W.; An, Z.S.; Fung, K.K.; Watson, J.G.; Zhu, C.S.; et al. Characterization and source apportionment of atmospheric organic and elemental carbon during fall and winter of 2003 in Xi’an, China. Atmos. Chem. Phys. 2005, 5, 3127–3137. [Google Scholar] [CrossRef]
  19. Cao, J.J.; Zhu, C.S.; Chow, J.C.; Watson, J.G.; Han, Y.M.; Wang, G.; Shen, Z.; An, Z.S. Black carbon relationships with emissions and meteorology in Xi’an, China. Atmos. Res. 2009, 94, 194–202. [Google Scholar] [CrossRef]
  20. Gao, R.S.; Schwarz, J.P.; Kelly, K.K.; Fahey, D.W.; Watts, L.A.; Thompson, T.L.; Spackman, J.R.; Slowik, J.G.; Cross, E.S.; Han, J.H.; et al. A novel method for estimating light-scattering properties of soot aerosols using a modified single-particle soot photometer. Aerosol Sci. Technol. 2007, 41, 125–135. [Google Scholar] [CrossRef]
  21. Moteki, N.; Kondo, Y. Effects of mixing state on black carbon measurements by laser-induced incandescence. Aerosol Sci. Technol. 2007, 41, 398–417. [Google Scholar] [CrossRef]
  22. Wang, Q.Y.; Huang, R.-J.; Cao, J.J.; Han, Y.M.; Wang, G.H.; Li, G.H.; Wang, Y.C.; Dai, W.T.; Zhang, R.J.; Zhou, Y.Q. Mixing state of black carbon aerosol in a heavily polluted urban area of China: Implications for light absorption enhancement. Aerosol Sci. Technol. 2014, 48, 689–697. [Google Scholar] [CrossRef]
  23. Schwarz, J.P.; Gao, R.S.; Fahey, D.W.; Thomson, D.S.; Watts, L.A.; Wilson, J.C.; Reeves, J.M.; Darbeheshti, M.; Baumgardner, D.G.; Kok, G.L.; et al. Single-particle measurements of midlatitude black carbon and light-scattering aerosols from the boundary layer to the lower stratosphere. J. Geophys. Res. 2006, 111, D16207. [Google Scholar] [CrossRef]
  24. Stephens, M.; Turner, N.; Sandberg, J. Particle identification by laser-induced incandescence in a solid-state laser cavity. Appl. Opt. 2003, 42, 3726–3736. [Google Scholar] [CrossRef] [PubMed]
  25. Slowik, J.G.; Cross, E.S.; Han, J.H.; Davidovits, P.; Onasch, T.B.; Jayne, J.T.; Williams, L.R.; Canagaratna, M.R.; Worsnop, D.R.; Chakrabarty, R.K.; et al. An inter-comparison of instruments measuring black carbon content of soot particles. Aerosol Sci. Technol. 2007, 41, 295–314. [Google Scholar] [CrossRef] [Green Version]
  26. Moteki, N.; Kondo, Y. Dependence of laser-induced incandescence on physical properties of black carbon aerosols: Measurements and theoretical interpretation. Aerosol Sci. Technol. 2010, 44, 663–675. [Google Scholar] [CrossRef]
  27. Laborde, M.; Mertes, P.; Zieger, P.; Dommen, J.; Baltensperger, U.; Gysel, M. Sensitivity of the single particle soot photometer to different black carbon types. Atmos. Measur. Tech. 2012, 5, 1031–1043. [Google Scholar] [CrossRef]
  28. Huang, X.F.; Sun, T.L.; Zeng, L.W.; Yu, G.H.; Luan, S.J. Black carbon aerosol characterization in a coastal city in South China using a single particle soot photometer. Atmos. Environ. 2012, 51, 21–28. [Google Scholar] [CrossRef]
  29. Moteki, N.; Kondo, Y.; Miyazaki, Y.; Takegawa, N.; Komazaki, Y.; Kurata, G.; Shirai, T.; Blake, D.; Miyakawa, T.; Koike, M. Evolution of mixing state of black carbon particles: Aircraft measurements over the western Pacific in March 2004. Geophys. Res. Lett. 2007, 34, L11803. [Google Scholar] [CrossRef]
  30. Huang, X.F.; He, L.Y.; Xue, L.; Sun, T.L.; Zeng, L.W.; Gong, Z.H.; Hu, M.; Zhu, T. Highly time-resolved chemical characterization of atmospheric fine particles during 2010 Shanghai World Expo. Atmos. Chem. Phys. 2012, 12, 4897–4907. [Google Scholar] [CrossRef]
  31. Okuda, T.; Matsuura, S.; Yamaguchi, D.; Umemura, T.; Hanada, E.; Orihara, H.; Tanaka, S.; He, K.; Ma, Y.; Cheng, Y.; et al. The impact of the pollution control measures for the 2008 Beijing Olympic Games on the chemical composition of aerosols. Atmos. Environ. 2011, 45, 2789–2794. [Google Scholar] [CrossRef]
  32. Schwarz, J.P.; Stark, H.; Spackman, J.R.; Ryerson, T.B.; Peischl, J.; Swartz, W.H.; Gao, R.S.; Watts, L.A.; Fahey, D.W. Heating rates and surface dimming due to black carbon aerosol absorption associated with a major U.S. city. Geophys. Res. Lett. 2009, 36, L15807. [Google Scholar] [CrossRef]
  33. Wang, Q.Y.; Schwarz, J.P.; Cao, J.J.; Gao, R.S.; Fahey, D.W.; Hu, T.F.; Huang, R.-J.; Han, Y.M.; Shen, Z.X. Black carbon aerosol characterization in a remote area of Qinghai-Tibetan Plateau, western China. Sci. Total Environ. 2014, 479, 151–158. [Google Scholar] [CrossRef] [PubMed]
  34. Huang, X.F.; Gao, R.S.; Schwarz, J.P.; He, L.Y.; Fahey, D.W.; Watts, L.A.; McComiskey, A.; Cooper, O.R.; Sun, T.L.; Zeng, L.W.; et al. Black carbon measurements in the Pearl River Delta region of China. J. Geophys. Res. 2011, 116, D12208. [Google Scholar] [CrossRef]
  35. Schwarz, J.P.; Gao, R.S.; Spackman, J.R.; Watts, L.A.; Thomson, D.S.; Fahey, D.W.; Ryerson, T.B.; Peischl, J.; Holloway, J.S.; Trainer, M.; et al. Measurement of the mixing state, mass, and optical size of individual black carbon particles in urban and biomass burning emissions. Geophys. Res. Lett. 2008, 35, L13810. [Google Scholar] [CrossRef]
  36. Moffet, R.C.; Prather, K.A. In-situ measurements of the mixing state and optical properties of soot with implications for radiative forcing estimates. Proc. Natl. Acad. Sci. USA 2009, 106, 11872–11877. [Google Scholar] [CrossRef] [PubMed]
  37. Liggio, J.; Gordon, M.; Smallwood, G.; Li, S.M.; Stroud, C.; Staebler, R.; Lu, G.; Lee, P.; Taylor, B.; Brook, J.R. Are emissions of black carbon from gasoline vehicles underestimated? Insights from near and on-road measurements. Environ. Sci. Technol. 2012, 46, 4819–4828. [Google Scholar] [CrossRef] [PubMed]
  38. Kondo, Y.; Komazaki, Y.; Miyazaki, Y.; Moteki, N.; Takegawa, N.; Kodama, D.; Deguchi, S.; Nogami, M.; Fukuda, M.; Miyakawa, T.; et al. Temporal variations of elemental carbon in Tokyo. J. Geophys. Res. 2006, 111, D12205. [Google Scholar]
  39. Baumgardner, D.; Raga, G.; Peralta, O.; Rosas, I.; Castro, T.; Kuhlbusch, T.; John, A.; Petzold, A. Diagnosing black carbon trends in large urban areas using carbon monoxide measurements. J. Geophys. Res. 2002. [Google Scholar] [CrossRef]
  40. Dickerson, R.R.; Andreae, M.O.; Campos, T.; Mayol-Bracero, O.L.; Neusuess, C.; Streets, D.G. Analysis of black carbon and carbon monoxide observed over the Indian Ocean: Implications for emissions and photochemistry. J. Geophys. Res. 2002. [Google Scholar] [CrossRef]
  41. Spackman, J.R.; Schwarz, J.P.; Gao, R.S.; Watts, L.A.; Thomson, D.S.; Fahey, D.W.; Holloway, J.S.; de Gouw, J.A.; Trainer, M.; Ryerson, T.B. Empirical correlations between black carbon aerosol and carbon monoxide in the lower and middle troposphere. Geophys. Res. Lett. 2008, 35, L19816. [Google Scholar] [CrossRef]
  42. Pna, X.L.; Kanaya, Y.; Wang, Z.F.; Liu, Y.; Pochanart, P.; Akimoto, H.; Sun, Y.L.; Dong, H.B.; Li, J.; Irie, H.; et al. Correlation of black carbon aerosol and carbon monoxide in the high-altitude environment of Mt. Huang in Eastern China. Atmos. Chem. Phys. 2011, 11, 9735–9747. [Google Scholar] [CrossRef]
  43. McMeeking, G.; Hamburger, T.; Liu, D.; Flynn, M.; Morgan, W.; Northway, M.; Highwood, E.; Krejci, R.; Allan, J.; Minikin, A.; et al. Black carbon measurements in the boundary layer over western and northern Europe. Atmos. Chem. Phys. 2010, 10, 9393–9414. [Google Scholar] [CrossRef]
  44. Baumgardner, D.; Kok, G.; Raga, G. On the diurnal variability of particle properties related to light absorbing carbon in Mexico City. Atmos. Chem. Phys. 2007, 7, 2517–2526. [Google Scholar] [CrossRef]
  45. Verma, R.L.; Sahu, L.K.; Kondo, Y.; Takegawa, N.; Han, S.; Jung, J.S.; Kim, Y.J.; Fan, S.; Sugimoto, N.; Shammaa, M.H.; et al. Temporal variations of black carbon in Guangzhou, China, in summer 2006. Atmos. Chem. Phys. 2010, 10, 6471–6485. [Google Scholar] [CrossRef]

