Abstract
Daily average monitoring data for PM10, PM2.5 and PM1.0 and meteorological parameters at Chengdu from 2009 to 2011 are analyzed using statistical methods to replicate the effect of urban air pollution in Chengdu metropolitan region of the Sichuan Basin. The temporal distribution of, and correlation between, PM10, PM2.5 and PM1.0 particles are analyzed. Additionally, the relationships between particulate matter (PM) and certain meteorological parameters are studied. The results show that variations in the average mass concentrations of PM10, PM2.5 and PM1.0 generally have the same V-shaped distributions (except for April), with peak/trough values for PM average mass concentrations appearing in January/September, respectively. From 2009 to 2011, the inter-annual average mass concentrations of PM10, PM2.5 and PM1.0 fall year on year. The correlation coefficients of daily concentrations of PM10 with PM2.5, PM10 with PM1.0, and PM2.5 with PM1.0 were high, reaching 0.91, 0.83 and 0.98, respectively. In addition, the average ratios of PM2.5/PM10, PM1.0/PM10 and PM1.0/PM2.5 were 85%, 78% and 92%, respectively. From this, fine PM is determined to be the principal pollutant in the Chengdu region. Except for averaged air pressure values, negative correlations exist between other meteorological parameters and PM. Temperature and air pressure influenced the transport and accumulation of PM by affecting convection. Winds promoted PM dispersion. Precipitation not only accelerated the deposition of wet PM, but also inhibited surface dust transport. There was an obvious correlation between PM and visibility; the most important cause of visibility degradation was due to the light extinction of aerosol particles.
1. Introduction
Atmospheric particulate matter (PM) consists of minuscule particles of solid or liquid matter, with diameters ranging from 0.001 µm to 100 µm. The time for which PM is suspended in the atmosphere ranges from a few hours to a few weeks. The smaller a particle is, the longer it will stay in the air. Atmospheric particles can affect the climate by both direct and indirect radiative forcing [1], and serve as cloud condensation or ice nuclei modifying the microphysical characters of clouds [2,3]. Atmospheric PM concentrations exceeding guidelines may cause poor visibility [4,5] and induce the regional hazy weather frequently seen in China [6,7,8]. In addition, fine particles also damage respiratory and cardiovascular health, and even DNA [9].
There is a nationwide research focus on PM as the principal pollutant in China, including its physical, chemical and optical properties [10,11,12]. Most studies have focused on northern China [13,14,15], the Yangtze River delta [16,17], and the Pearl River delta [18]. As a measure of this concern, the latest ambient air quality standards published in 2012 (GB3095–2012) gave PM2.5 values for the first time [19].
The Sichuan Basin is located east of the Tibetan Plateau, with the Qin Mountains to the north and the Yunnan-Guizhou Plateau to the south. Due to the particular topography of the basin, average wind speeds in Sichuan are low. Sichuan is a wet, foggy area and mass concentrations of atmospheric particles are therefore always high there [20,21]. The 2009–2011 Environmental Conditions Bulletin (Sichuan Environment Condition Communique) [22,23,24] from 2009 to 2011 issued by the Department of Environmental Protection of Sichuan Province showed that the average mass concentration of inhalable particles (PM10) in Sichuan was greater than 60 µg/m3 for each of these three years. Although these values were in the second highest national pollution band, they do not fully reflect the PM levels resulting from the rapid economic development that has occurred in Sichuan over recent years.
Chengdu, in the central Sichuan Plain, is the provincial capital of Sichuan. Its present development and future economic trajectory is ideal for representing PM pollution in the Sichuan Basin [25,26,27]. The Chengdu Environmental Quality Gazette (2009, 2010, 2011, 2012) [28,29,30,31] shows that mean annual concentrations of inhalable particles (PM10) in Chengdu exceeded 100 µg/m3, and that daily rates exceeded the set standards by more than 14% (more than 24% regarding to the latest standards issued in 2012). Tao et al. [32] found that average mass concentrations of PM2.5 reached 165 μg/m3 from April 2009 to January 2010 at the Chengdu Institute of Plateau Meteorology. Based on the average daily monitored data for PM10, PM2.5 and PM1.0 at Mt. Chengdu from January 2009 to December 2011, this paper analyzes the correlations between PM10, PM2.5 and PM1.0 and their temporal distribution characteristics. Additionally, the relations between PM and meteorological factors are studied. The results of this study could be used as a reference point for analyzing the pollution sources and composition of atmospheric particulates in urban areas of the Sichuan Basin as well as formulating measures to counteract them. Subsequent observations of variations in mass concentrations of atmospheric PM could then highlight any deficiencies in pollution control.
2. Methodology
PM10, PM2.5 and PM1.0 data were collected from a building rooftop next to the Chengdu City Meteorological Bureau (104°02′E, 30°39′N; 587.0 m), 91 m above the ground, from 2009 to 2011. The PM monitoring station is located in the west urban area of Chengdu city. Aerosol samples collected from a 91 m-tall building. There are few factories around. The sampling height is above the urban canopy without much local pollution disturbance. Thus the sampling could be representative the pollution level of Chengdu region. Chengdu region belongs to the subtropical monsoon climate. The average annual temperature is around 16.5 degrees centigrade with an average annual rainfall of 1124.6 mm. The wind speed is low with the average annual wind speed is 1–1.5 m/s. The annual sunshine averages 1042–1412 h. The data were measured using a Grimm-180 device (German online PM monitor). This instrument uses an optical method to measure PM concentration of PM10, PM2.5, and PM1.0. The measuring range is 1–1500 μg/m3 with an accuracy of ±2%. The instrument monitored for 24 h at a time, and transferred data once every five minutes. The measuring principle of Grimm-180 is the scattering light measurement of the single particles, where a semiconductor laser serves as light source. The 90° scattered light with an opening angle of about 60° is being lead via a mirror onto a receiver diode. When particles cross the laser beam they emit a light pulse. This electric signal of the diode will be classified into 31 different size channels after an adequate amplification. This enables a size determination of the particles and establishes also a weighting curve for PM10 and PM2.5. The sample air is being volume controlled sucked through the optical measurement chamber and a fine filter. The pump also provides the rinsing air, which is generated via the pumps exhaust air and a subsequent fine filter. It is being held constant by a rinsing air controller. The rinsing air prevents the laser optics and measurement chamber from pollution and furthermore being used as particle-free reference air during the self-test. During the January 2009 to December 2011 period, 833 valid samples were acquired (excluding calibration instrument failures, missing data, abnormal data and instrument calibration times). The meteorological data, from the Chengdu Meteorology Observatory (104°01′E, 30°40′N; 507.3 m), included daily wind speed, air pressure, temperature, precipitation, relative humidity (RH) and visibility from 2009 to 2011. The Chengdu Meteorology Observatory is located in the west suburban region of Chengdu. And it is surrounded by the farmland and 15 km west from the PM monitoring station. Chengdu Meteorology Observatory is a national principal station and the observations are used to present the meteorological features of Chengdu region.
A linear correlation method was used to analyze the correlation between PM10 and PM2.5, and between PM10 and PM1.0. The total average concentrations of these three particle sizes were calculated using the sum of their daily average mass concentrations divided by the sum of valid days.
3. Results and Discussion
3.1. Monthly, Seasonal and Inter-Annual Variations in Mass Concentrations of PM10, PM2.5 and PM1.0
Variations in the monthly, seasonal and inter-annual average mass concentrations of PM10, PM2.5 and PM1.0 are shown in Figure 1. Figure 1a presents the monthly average mass concentrations of PM10, PM2.5 and PM1.0. Trends for these three PM sizes are similar, presenting a concave parabolic shape for January to April, and April to December. Peak monthly values for average mass concentrations of PM10, PM2.5 and PM1.0 appeared in January, reaching 118 µg/m3, 101 µg/m3 and 93 µg/m3, respectively. The lowest values were in September and reached 45 µg/m3, 42 µg/m3 and 39 µg/m3, respectively. The highest monthly average concentrations were 2.64 times (PM10), 2.42 times (PM2.5) and 2.37 (PM1.0) times the lowest monthly average concentrations, respectively. Concentrations of PM2.5 in December and January significantly exceeded daily average PM10 and PM2.5 concentrations by 150 µg/m3 and 75 µg/m3 as defined by the ambient air quality standard GB3095-2012, indicating PM2.5 pollution in the Chengdu urban area is severe during the winter.
Figure 1b shows clear variations in the seasonal average mass concentrations of PM10, PM2.5 and PM1.0. The seasons were demarcated as spring (March to May), summer (June to August), fall (September to November) and winter (December to February). Seasonal variations evidenced a concave parabola shape. PM10, PM2.5 and PM1.0 maxima appeared in winter, reaching 98 µg/m3, 83 µg/m3 and 77 µg/m3, respectively. Minimum PM10, PM2.5 and PM1.0 values of 49 µg/m3, 43 µg/m3 and 40 µg/m3, respectively, occurred during the summer.
The higher concentrations of PM10, PM2.5 and PM1.0 in December and January are probably related to geographic factors. Tao et al. [25] showed that that the higher PM concentrations during winter in Sichuan Basin are due to the lower mixing height and low wind speeds. Additionally, the sampling point was located at a busy city intersection with high levels of vehicle exhaust emissions: Chen et al. [33] states that lower wet particulate deposition is the major cause of pollution in winter. PM concentrations increased in the spring, most likely because Chengdu is occasionally affected by northerly sand and dust storms. Due to the larger size of dust particles, PM10 concentrations increased significantly, contrary to fine PM concentrations. In the summer there are more intensive convective air currents and more rainfall, so PM is more effectively removed, leading to minimum PM concentrations. The mixing ventilation coefficient is larger, so contaminant dispersion is rapid. In addition, rainwater aids the removal of coarse particles, but has less effect on fine particles [34]. This could account for PM2.5 concentrations being higher in summer. In September, atmospheric RH decreases and the hygroscopic growth of particles is correspondingly inhibited, a contributory factor for the minimum PM concentration. Conversely, owing to the influence of fall rain in West China after September, atmospheric RH increases and the hygroscopic growth of particles is strengthened, leading to a recovery in mass concentration values for all three PM sizes [35].
Figure 1c shows that the annual average mass concentrations of PM10, PM2.5 and PM1.0 declined significantly from 2009 to 2011. This could be attributed to the efficacy of pollution control measures introduced in Chengdu, such as limiting the number of cars on the road, closing the worst-polluting factories and banning straw-burning [32].
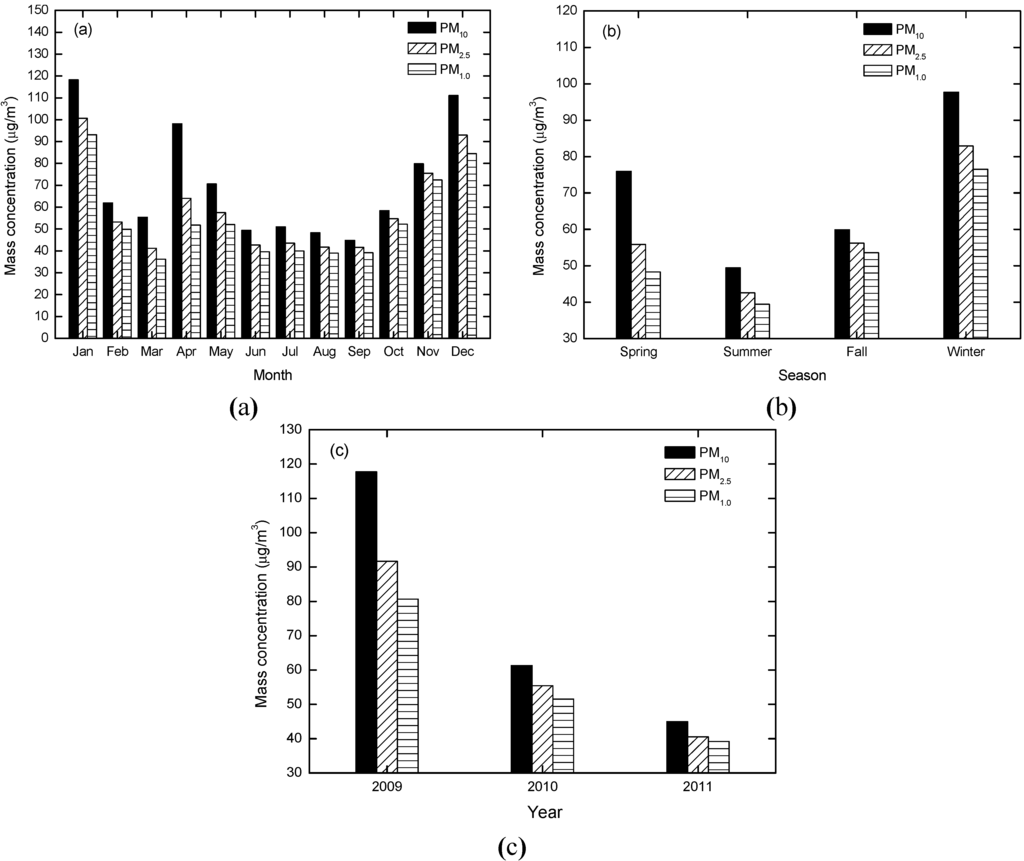
Figure 1.
Monthly (a), seasonal (b) and inter-annual (c) average mass concentration variations of PM10, PM2.5 and PM1.0 values.
3.2. Relations between PM10, PM2.5 and PM1.0
The relations between PM10 and PM2.5, PM10 and PM1.0, and PM2.5 and PM1.0 are shown in Figure 2a–c, respectively. The correlation coefficients between them were 0.92, 0.84 and 0.98, meaning the correlations between PM10, PM2.5 and PM1.0 were significant. This result is consistent with previous findings by Deng et al. [36]. The ratios of PM2.5 to PM10, PM1.0 to PM10, and PM1.0 to PM2.5 are illustrated in Figure 3. The average PM2.5/PM10, PM1.0/PM10 and PM1.0/PM2.5 values were 85%, 78% and 92%, respectively, and ranged between 74%–94%, 64%–89% and 87%–95%, respectively. The proportions of PM2.5 contained within PM10 were quite high, further proving that fine particles were the greatest contributor to PM air pollution in Chengdu. The average PM2.5/PM10 and PM1.0/PM10 ratios were 72% and 61% in spring, lower than in other seasons. Northerly dust and sandstorms may be a possible cause.
3.3. The Relation between Concentrations of PM10, PM2.5 and PM1.0 and Meteorological Factors
Previous studies have indicated that atmospheric particle pollution is influenced by both the emissions of particles and meteorological factors [37,38,39]. When particle emissions in urban areas are stable, atmospheric PM pollution is principally caused by meteorological factors, such as the dispersion and transport by wind, and an acceleration of the scavenging by precipitation, of atmospheric PM. Additionally, photochemical reactions depend upon favorable temperature, RH, solar radiation and other conditions. The accumulation and transport of particles is closely related to the synoptic system and atmospheric circulation.
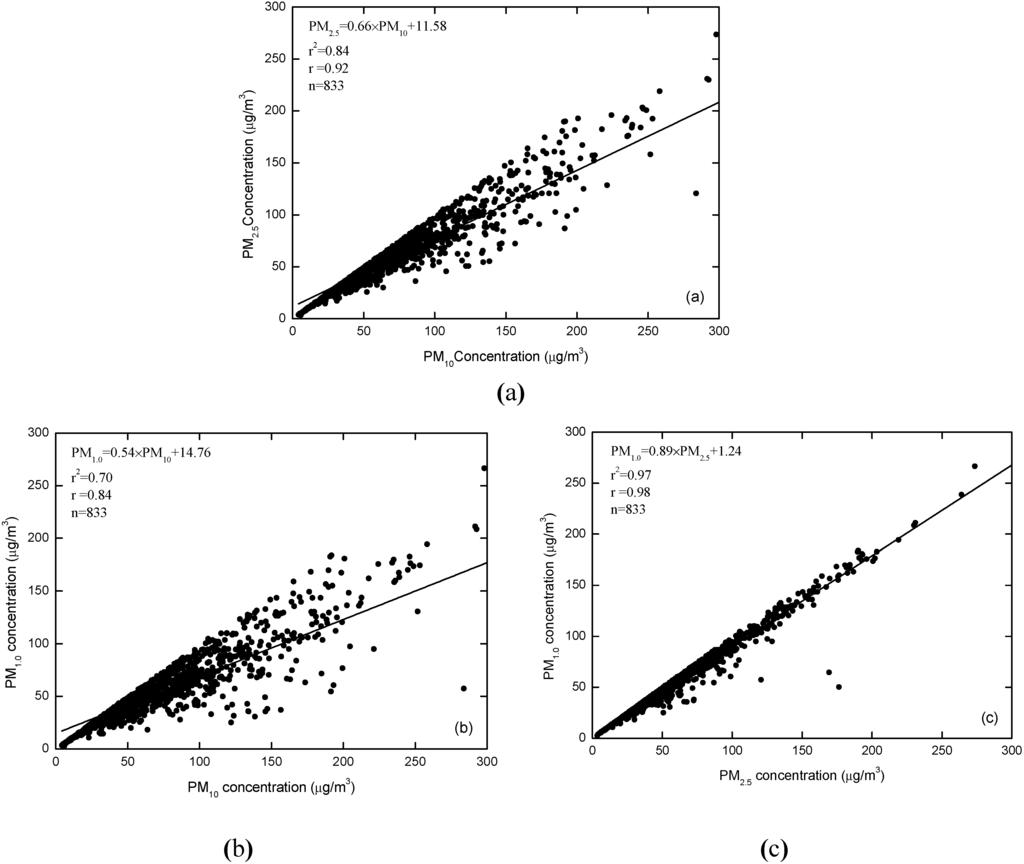
Figure 2.
Correlation between average mass concentrations of PM10, PM2.5 and PM1.0: (a) PM10 vs. PM2.5, (b) PM10 vs. PM1.0, (c) PM2.5 vs. PM1.0.
Table 1 shows that mass concentration of atmospheric PM has a positive relation with air pressure and negative relations with other meteorological factors. The relation between mass concentration of atmospheric PM and visibility is the clearest. The correlations between meteorological factors of air pressure, temperature, precipitation and atmospheric PM pollution are also obvious. However, the correlations between wind speed, RH and PM concentration are not a simple linear one. For example, RH displays no clear correlation with PM concentration.
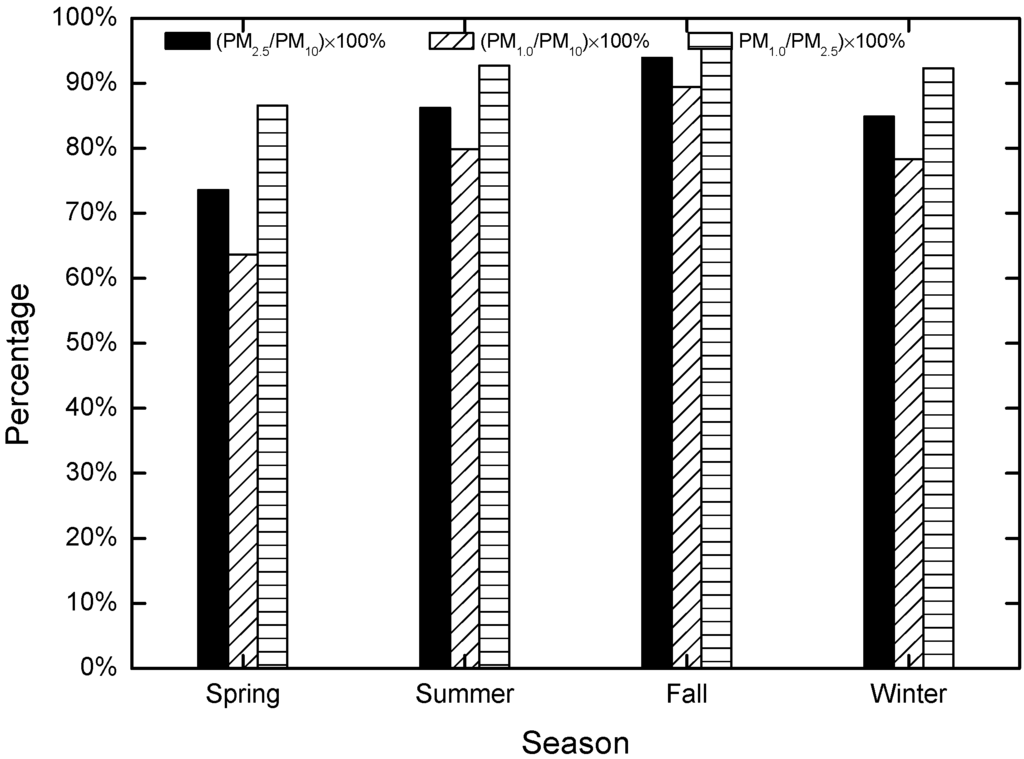
Figure 3.
PM2.5/PM10; PM1.0/PM2.5; and PM10/PM2.5 ratios.

Table 1.
Correlation coefficients between mass concentrations of PM10, PM2.5 and PM1.0 and average meteorological factors: wind speed, air pressure, air temperature, precipitation, RH and visibility.
| Correlation Coefficient | PM10 | PM2.5 | PM1.0 |
|---|---|---|---|
| Average wind speed | −0.35 | −0.56 | −0.62 * |
| Average air pressure | 0.71 * | 0.77 ** | 0.77 ** |
| Average air temperature | −0.73 ** | −0.75 ** | −0.75 ** |
| Monthly precipitation | −0.59 * | −0.58 * | −0.57 |
| Average RH | −0.25 | −0.06 | −0.00 |
| Visibility | −0.75 ** | −0.88 ** | −0.91 ** |
The * means significance of p < 0.05, the ** means significance of p < 0.01.
As shown in Figure 4, the wind speed range in Chengdu was very small (0.8–1.4 m/s), thus, mass PM concentrations in the Chengdu urban area were high but changed little with wind speed. There was a negative correlation between wind speed and PM10, PM2.5 and PM1.0, with correlation coefficients of −0.35, −0.56 and −0.62, respectively (Table 1) in the Chengdu urban area. The correlation coefficients of the win speed with atmospheric PM follow the pattern PM1.0 > PM2.5 > PM10. However, the correlation coefficients between wind speed and PM10, PM2.5 were not significantly obvious with p > 0.05. But the coefficient between wind speed and PM1.0 showed clear correlation with p < 0.05.
As shown in Figure 5, air pressure values first decreased from January to July, then increased from July to December, showing an inverted parabolic distribution. Mass PM concentrations display a positive relation with air pressure, with significant correlation coefficients (p < 0.05) for PM10, PM2.5 and PM1.0 of 0.71, 0.77 and 0.77, respectively. The surface experiences a convergence up draft when controlled by low pressure; the up draft promotes the dispersion of PM from the ground up into the air, and PM concentrations at the sampling point are subsequently reduced. Conversely, when there was high pressure, the down draft restrains the upward movement of PM, causing an accumulation of particles [40].
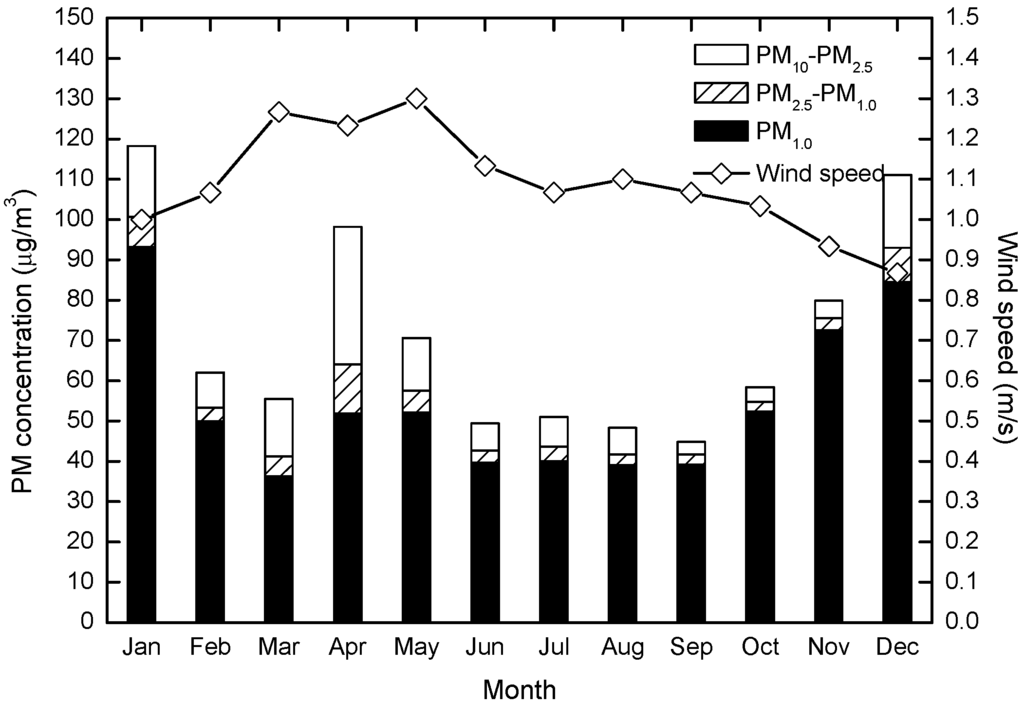
Figure 4.
Variations in monthly mass concentrations of PM10, PM2.5 and PM1.0 related to average wind speed.
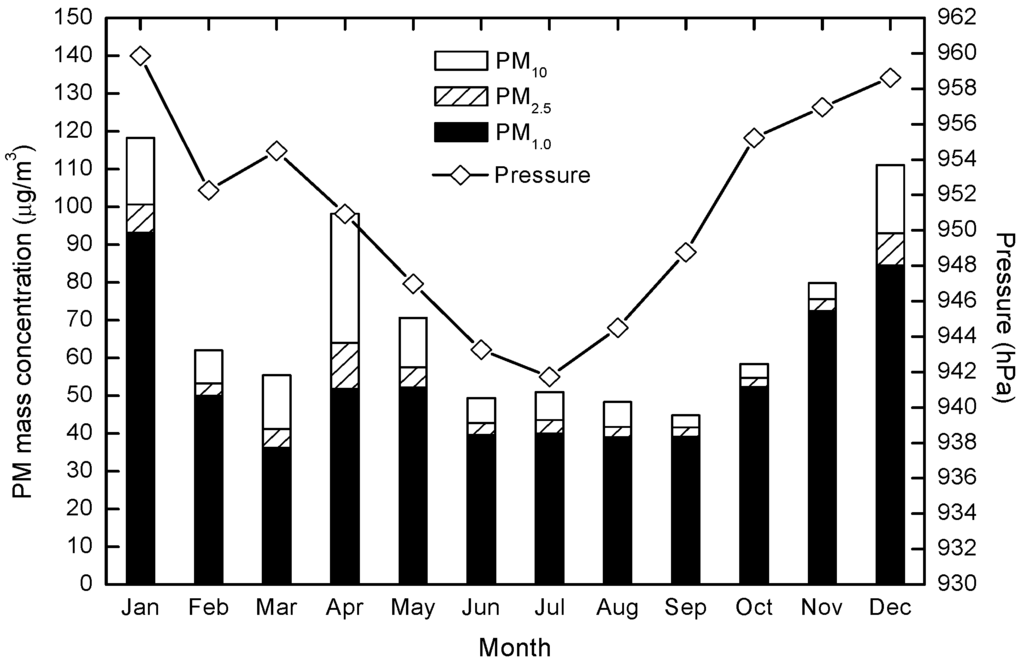
Figure 5.
Variations in monthly mass concentrations of PM10, PM2.5 and PM1.0 related to air pressure.
Figure 6 clearly shows that there was a negative relation between the temperature and PM concentrations, with correlation coefficients (p < 0.01) of −0.73, −0.75 and −0.75 for PM10, PM2.5 and PM1.0, respectively. High temperatures are clearly conducive to intense convection: Atmospheric PM is transported quickly and effectively, allowing its accelerated dispersion, and thus decreasing local mass concentrations. Conversely, low temperatures and the temperature inversion layer caused by radiative cooling weakens convection [41]; in these circumstances, atmospheric PM remains suspended under the inversion layer, leading to higher atmospheric PM concentrations.
Figure 7 shows that PM concentrations have a negative correlation with precipitation, especially in winter (January and December) and summer (July), with correlation coefficients of −0.59 (p < 0.05), −0.58 (p < 0.05), and −0.57 (p > 0.05), respectively. The influence of precipitation on atmospheric PM is twofold. First, the effect of the microphysical processes of raindrops upon PM, including adsorption and collision, lead to the wet deposition of PM. Second, after rainy weather dust and fugitive dust previously suspended in the atmosphere is notably reduced, leading to a significant decrease in mass PM concentrations [42].
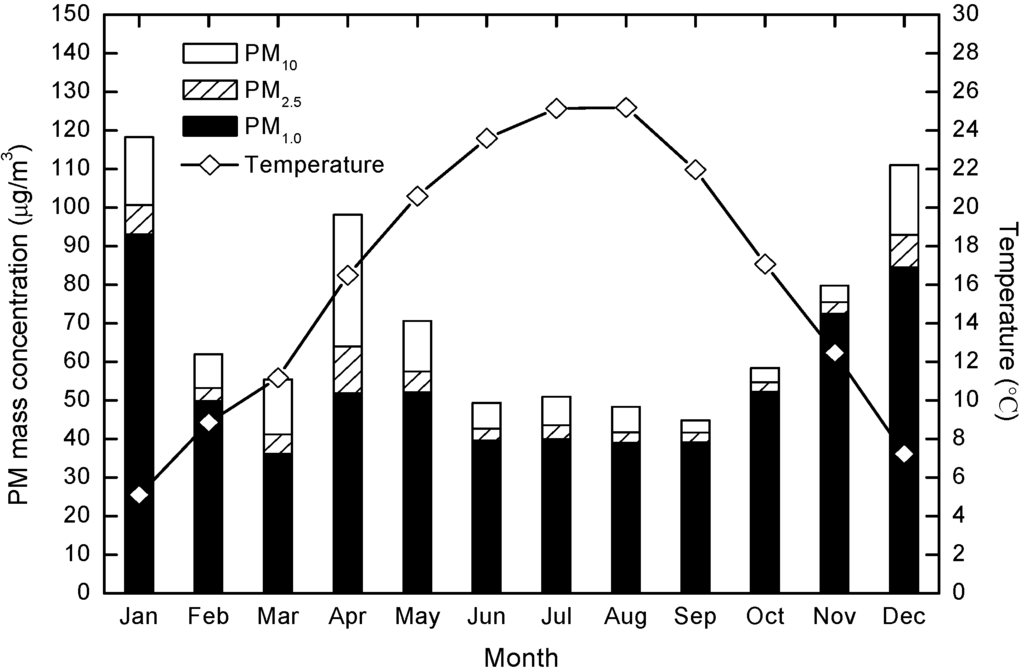
Figure 6.
Variations in monthly mass concentrations of PM10, PM2.5 and PM1.0 related to temperature.
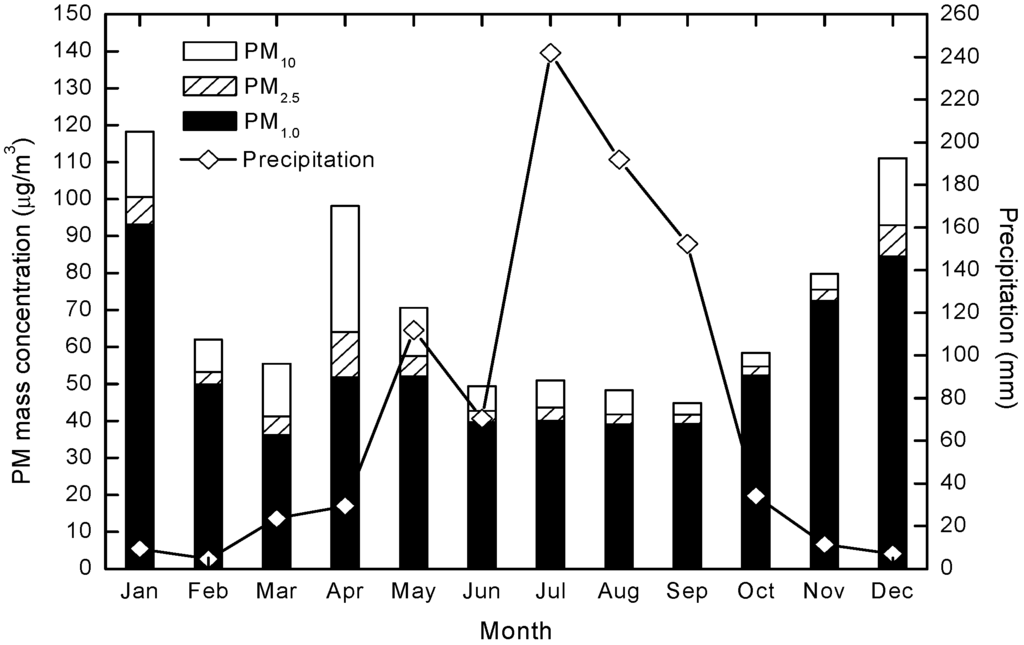
Figure 7.
Variations in monthly mass concentrations of PM10, PM2.5 and PM1.0 related to precipitation.
The relation between concentrations of PM10, PM2.5 and PM1.0 and RH are illustrated in Figure 8. It shows that RH in the Chengdu urban area was >70% all year round and that there were higher RH values in fall and summer than that in spring. There was no apparent correlation all year around. The correlation coefficients between RH and PM10, PM2.5 and PM1.0 were less than −0.25. In late summer and early fall, RH values remained high, but because of the high temperatures, unstable atmosphere, intense convection and abundant rainfall, the dispersion of atmospheric PM, wet deposition and cloud condensation nuclei played a leading role. PM pollution, which was caused by the growth of hygroscopicity under high RH conditions, usually in the stable atmospheric strata, but also sometimes when there was a gentle breeze, or within the thermal inversion layer [43].
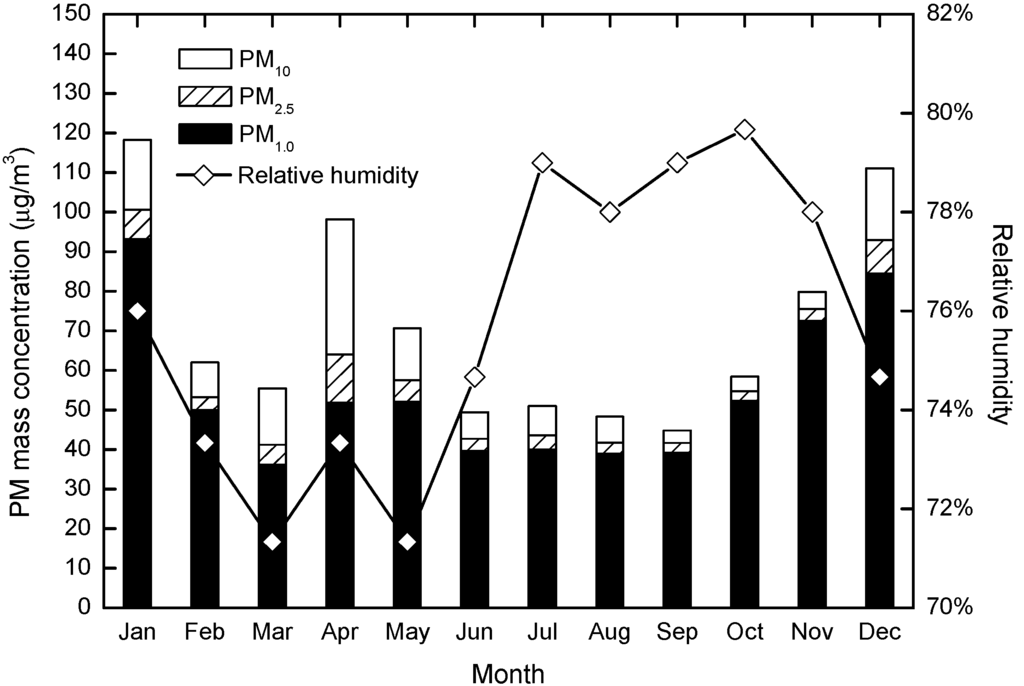
Figure 8.
Variations in monthly mass concentrations of PM10, PM2.5 and PM1.0 related to RH.
3.4. Relation between PM10, PM2.5, PM1.0 and Horizontal Visibility
There are various ways in which atmospheric visibility can be affected, such as through light scattering and absorption caused by high concentrations of fine particles and the sulfate, nitrate and carbonate matter attached to them [44,45]. In addition, particles experiencing hygroscopic growth affect light extinction through their impact on the atmosphere’s particle scattering efficiency. Combining Figure 9 and Table 1, we see that horizontal visibility in the Chengdu urban area is generally low, ranging from 7.5 km in January to 11.0 km in August. There was a negative correlation between horizontal visibility and concentrations of PM10, PM2.5 and PM1.0, with significant correlation coefficients (p < 0.01) of −0.75, −0.88 and −0.91, respectively. When mass concentrations of these three PM sizes exceed 100 µg/m3, visibility is <8.0 km; when concentrations are <40 µg/m3, visibility exceeds 11.0 km.
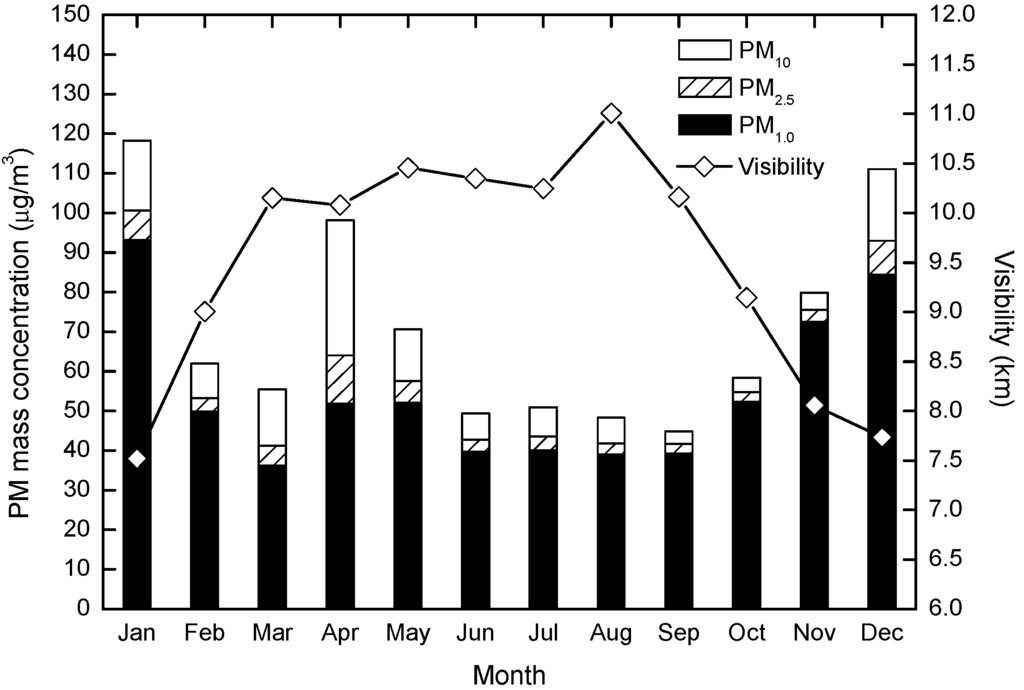
Figure 9.
Variations in monthly mass concentrations of PM10, PM2.5, and PM1.0 related to horizontal visibility.
4. Conclusions
(1) Mass concentrations of PM10, PM2.5 and PM1.0 were higher in winter and lower in summer from 2009 to 2011 in the Chengdu urban area. Peak average mass concentrations of PM10, PM2.5 and PM1.0 appeared in January and were 118 µg/m3, 101 µg/m3 and 93 µg/m3 for 2009, 2010 and 2011, respectively. Minimum values occurred in September and were 45 µg/m3, 42 µg/m3 and 39 µg/m3 for 2009–2011, respectively. This shows an improvement in atmospheric PM pollution accompanied by annual falls in PM10, PM2.5 and PM1.0 concentrations.
(2) Analysis of the correlation between PM10, PM2.5 and PM1.0 shows that PM10 /PM2.5, PM10/PM1.0 and PM2.5/PM1.0 mass concentration correlation coefficients were generally high, reaching 0.92, 0.84 and 0.98, respectively. In addition, PM2.5 and PM1.0 account for 66% and 54% of PM10, respectively, and PM1.0 to PM2.5 mass loading reached 89%. This indicates that fine particles are the major contributor to PM air pollution, especially fine particles with an aerodynamic diameter <1 µm.
(3) Except for the relation with air pressure values, significant negative correlations existed between the other meteorological factors (e.g., temperature and precipitation) and PM. Temperature and air pressure influenced the transport and accumulation of PM through convection. Precipitation not only accelerated the wet deposition of PM, but also constricted the movement of surface dust. The correlation between RH and PM concentrations was not obvious. There was an obviously negative correlation between PM and visibility rates. Visibility degradation was primarily attributed to light extinction caused by PM.
This study makes a preliminary analysis of PM pollution and its relation to meteorological factors in Chengdu, representative of the Sichuan Basin urban area, relevant to improving local air quality. The results may support future policies directed at emissions control in China. However, there are still some limitations of the study. There is only one single site PM monitoring in this study because of the instruments limitation. More detailed observations, not only of PM mass concentrations but also of the chemical components and optical properties, from industrial areas, residential areas, and outlying suburbs of the Sichuan Basin are still needed to further study the PM pollution of this region. Also long term observations are needed to study the variation of aerosol in Sichuan Basin. In this study it just analyzed the relationship between the RH and PM basically. Actually, the RH has obvious effect on aerosol particle formation and conversion, more detailed works about the reaction of water vapor on aerosol particles at Sichuan Basin are needed in future.
Acknowledgements
This work is financially supported by grants from the National Key Project of Basic Research (2014CB441201), the Project (41475124 & 41475037) supported by NSFC, CAMS Basis Research Project (2014R17 & 2013Z007).
Author Contributions
Yang Li conceived and designed the experiment. The paper was written by Yang Li with a significant contribution by Quanliang Chen and Hujia Zhao. Lin Wang and Ran Tao analyzed the data and presented the results.
Conflicts of Interest
The authors declare no conflict of interest.
References
- Charlson, R.J.; Schwartz, S.E.; Hales, J.M.; Cess, D.; Coakley, J.A.; Hansen, J.E. Climate forcing by anthropogenic aerosols. Science 1992, 255, 423–430. [Google Scholar] [CrossRef] [PubMed]
- Twomey, S.A.; Piepgrass, M.; Wolfe, T.L. An assessment of the impact of pollution on the global cloud albedo. Tellus 1984, 36, 356–366. [Google Scholar] [CrossRef]
- Tao, J.; Chen, J.M.; Chen, X. Impacts of new particle formation on aerosol Cloud Condensation Nuclei (CCN) activity in Shanghai: Case study. Atmos. Chem. Phys. Discuss. 2014, 14, 18641–18677. [Google Scholar] [CrossRef]
- Sloane, C.S.; Watson, J.; Chow, J.; Pritchett, L.; Willard, R.L. Size-segregated fine particle measurements by chemical species and their impact on visibility impairment in Denver. Atmos. Environ. 1991, 25, 1013–1024. [Google Scholar] [CrossRef]
- Chang, D.; Song, Y.; Liu, B. Visibility trends in six megacities in China 1973–2007. Atmos. Res. 2009, 94, 161–167. [Google Scholar] [CrossRef]
- Che, H.Z.; Zhang, X.Y.; Li, Y.; Zhou, Z.J.; Qu, J.J.; Hao, X.J. Haze trends over the capital cities of 31 provinces in China, 1981–2005. Theor. Appl. Climatol. 2009, 97, 235–242. [Google Scholar] [CrossRef]
- Leng, C.P.; Cheng, T.T.; Zhang, R.J.; Tao, J.; Chen, J.M.; Zha, S.P.; Zhang, Y.W.; Zhang, D.Q.; Li, X.; Kong, L.D. Variation of Cloud Condensation Nuclei (CCN) and aerosol activity during fog-haze episode: A case study from Shanghai. Atmos. Chem. Phys. Discuss. 2014, 14, 16997–17036. [Google Scholar] [CrossRef]
- Du, H.H.; Kong, L.D.; Cheng, T.T.; Li, L.; Du, J.F.; Chen, J.M.; Xia, X.A.; Leng, C.P.; Huang, G.H. Insights into summertime haze pollution events over Shanghai based on online water-soluble ionic composition of aerosols. Atmos. Environ. 2011, 45, 5131–5137. [Google Scholar] [CrossRef]
- Hong, Y.C.; Lee, J.T.; Kim, H.; Ha, E.H.; Schwartz, J.; Christiani, D.C. Effects of air pollutants on acute stroke mortality. Environ. Health Persp. 2002, 110, 187–191. [Google Scholar] [CrossRef]
- Zhang, R.; Jing, J.; Tao, J.; Hsu, S.C.; Wang, G.; Cao, J.; Lee, C.S.L.; Zhu, L.; Chen, Z.; Zhao, Y.; Shen, Z. Chemical characterization and source apportionment of PM2.5 in Beijing: Seasonal perspective. Atmos. Chem. Phys. 2013, 13, 7053–7074. [Google Scholar] [CrossRef]
- Zhang, R.J.; Tao, J.; Ho, K.F.; Shen, Z.X.; Wang, G.H.; Cao, J.J.; Liu, S.X.; Zhang, L.M.; Lee, S.C. Characterization of atmospheric organic and elemental carbon of PM2.5 in a typical semi-arid area of Northeastern China. Aerosol Air Qual. Res. 2012, 12, 792–802. [Google Scholar]
- Zhao, H.J.; Che, H.Z.; Zhang, X.Y. Characteristics of visibility and Particulate Matter (PM) in an urban area of Northeast China. Atmos. Pollut. Res. 2013, 40, 427–434. [Google Scholar]
- Cheng, T.T.; Wang, H.; Xu, Y.F.; Li, H.Y. Climatology of aerosol optical properties in Northern China. Atmos. Environ. 2006, 40, 1495–1509. [Google Scholar] [CrossRef]
- Cheng, T.T.; Zhang, R.J.; Han, Z.W.; Fang, W. Relationship between ground-based particle component and column aerosol optical property in dusty days over Beijing. Geophys. Res. Lett. 2008. [Google Scholar] [CrossRef]
- Wang, X.; Huang, J.; Zhang, R.; Chen, B.; Bi, J. Surface measurements of aerosol properties over Northwest China during ARM China 2008 deployment. J. Geophys. Res. 2010. [Google Scholar] [CrossRef]
- Jia, X.; Cheng, T.T.; Chen, J.M.; Xu, J.W.; Chen, Y.H. Columnar optical depth and vertical distribution of aerosols over Shanghai. Aerosol Air Qual. Res. 2012, 12, 316–326. [Google Scholar]
- Xu, J.W.; Tao, J.; Zhang, R.J.; Cheng, T.T.; Leng, C.P.; Chen, J.M.; Huang, G.H.; Li, X.; Zhu, Z.Q. Measurements of surface aerosol optical properties in winter of Shanghai. Atmos. Res. 2012, 109–110, 25–35. [Google Scholar]
- Cao, J.J.; Lee, S.C.; Ho, K.F.; Zhang, X.Y.; Zou, S.C.; Fung, K.; Chow, J.C.; Watson, J.G. Characteristics of carbonaceous aerosol in Pearl River Delta Region, China during 2001 winter period. Atmos. Environ. 2003, 37, 1451–1460. [Google Scholar] [CrossRef]
- GB3095–2012 Ambient Air Quality Standards. Available online: http://kjs.mep.gov.cn/hjbhbz/bzwb/dqhjbh/dqhjzlbz/201203/t20120302_224165.htm (accessed on 10 November 2014). (In Chinese)
- Luo, Y.F.; Li, W.L.; Zhou, X.J.; He, Q.; Qing, J.Z. Analysis of the atmospheric aerosol optical depth over China in 1980s. Acta Meteorol. Sini. 2000, 14, 490–502. [Google Scholar]
- Li, C.C.; Mao, J.T.; Lau, K.H. Characteristics of the aerosol optical depth distributions over Sichuan Basin derived from MODIS data. J. Appl. Meteorol. 2003, 14, 1–17. (In Chinese) [Google Scholar]
- Sichuan Environment Condition Communique of 2009. Available online: http://www.schj.gov.cn/cs/hjjc/zkgg/ (accessed on 10 November 2014).
- Sichuan Environment Condition Communique of 2010. Available online: http://www.schj.gov.cn/cs/hjjc/zkgg/ (accessed on 10 November 2014).
- Sichuan Environment Condition Communique of 2011. Available online: http://www.schj.gov.cn/cs/hjjc/zkgg/ (accessed on 10 November 2014).
- Tao, J.; Zhang, L.M.; Engling, G.; Zhang, R.J.; Yang, Y.H.; Cao, J.J.; Zhu, C.S.; Wang, Q.Y.; Luo, L. Chemical composition of PM2.5 in an urban environment in Chengdu, China: Importance of springtime dust storms and biomass burning. Atmos. Res. 2013, 122, 270–283. [Google Scholar] [CrossRef]
- Tao, J.; Gao, J.; Zhang, L.; Zhang, R.; Che, H.; Zhang, Z.; Lin, Z.; Jing, J.; Cao, J.; Hsu, S.-C. PM2.5 pollution in a megacity of southwest China: Source apportionment and implication. Atmos. Chem. Phys. 2014, 14, 8679–8699. [Google Scholar] [CrossRef]
- Tao, R.; Che, H.Z.; Chen, Q.L.; Tao, J.; Wang, Y.Q.; Sun, J.Y.; Wang, H.; Zhang, X.Y. Study of aerosol optical properties based on ground measurements over Sichuan Basin, China. Aerosol Air Qual. Res. 2014, 14, 905–915. [Google Scholar]
- Bulletin on the State of the Environment in Chengdu in 2009. Available online: http://www.cdepb.gov.cn/upload/ (accessed on 10 November 2014).
- Bulletin on the State of the Environment in Chengdu in 2010. Available online: http://www.cdepb.gov.cn/upload/ (accessed on 10 November 2014).
- Bulletin on the State of the Environment in Chengdu in 2011. Available online: http://www.cdepb.gov.cn/upload/ (accessed on 10 November 2014).
- Bulletin on the State of the Environment in Chengdu in 2012. Available online: http://www.cdepb.gov.cn/upload/ (accessed on 10 November 2014).
- Tao, J.; Cheng, T.T.; Zhang, R.J.; Cao, J.J.; Zhu, L.H.; Wang, Q.Y.; Luo, L.; Zhang, L.M. Chemical composition of PM2.5 at an urban site of Chengdu in Southwestern China. Adv. Atmos. Sci. 2013, 30, 1070–1084. [Google Scholar] [CrossRef]
- Chen, B.H.; Li, Y.Q. Relationships between air particle and meteorological elements in Chengdu. Urban Environ. Urban. Ecol. 2006, 19, 18–24. [Google Scholar]
- Hu, M.; Liu, S.; Wu, Z.J. Effects of high temperature, high relative humidity and rain process on particle size distributions in the summer of Beijing. Environ. Sci. 2006, 27, 2293–2298. [Google Scholar]
- Yuan, Y.; Liu, D.; Che, R. Research on the pollution situation of atmospheric particulates during autumn in Beijing City. Ecol. Environ. 2007, 16, 18–25. [Google Scholar]
- Deng, L.Q.; Qian, J.; Liao, R.X. Pollution characteristics of atmospheric particulates in Chengdu from August to September in 2009 and their relationship with meteorological conditions. China Environ. Sci. 2012, 32, 1433–1438. (In Chinese) [Google Scholar]
- Yao, Q.; Cai, Z.Y.; Zhang, C.C. Variety characteristics and influence factors of aerosol mass concentrations in Tianjin City. Ecol. Environ. Sci. 2010, 19, 2225–2231. [Google Scholar]
- Galindo, N.; Varea, M.; Gil-Moltó, J.; Yubero, E.; Nicolás, J. The influence of meteorology on particulate matter concentrations at an urban mediterranean location. Water Air Soil Pollut. 2011, 215, 365–372. [Google Scholar] [CrossRef]
- Pateraki, S.; Asimakopoulos, D.N.; Flocas, H.A.; Maggos, T.; Vasilakos, C. The role of meteorology on different sized aerosol fractions (PM10, PM2.5, PM2.5–10). Sci. Total Environ. 2012, 419, 124–135. [Google Scholar] [CrossRef] [PubMed]
- Ren, Z.H.; Su, F.Q.; Chen, Z.H. Influence of synoptic systems on the distribution and evolution process of PM10 concentration in the boundary layer in summer and autumn. Chin. J. Atmos. Sci. 2008, 32, 741–751. [Google Scholar]
- Lin, J.; Liu, W.; Yan, I. Relationship between meteorological conditions and particle size distribution of atmospheric aerosols. J. Meteorol. Environ. 2009, 25, 1–5. [Google Scholar]
- Shen, Z.Y.; Lu, B.; Chen, H.B. Effects of meteorology condition in precipitation on aerosol concentration in Zhengzhou. Meteorol. Environ. Sci. 2009, 32, 55–58. [Google Scholar]
- Mu, C.Y.; Tu, Y.Q.; Feng, Y. Effect analysis of meteorological factors on the inhalable particle matter concentration of atmosphere in Hami. Meteorol. Environ. Sci. 2011, 34, 75–79. [Google Scholar]
- Lin, J.J. Characterization of water-soluble ion species in urban ambient particles. Environ. Int. 2002, 28, 55–61. [Google Scholar] [CrossRef] [PubMed]
- Qu, W.J.; Wang, J.; Zhang, X.Y.; Wang, D.; Sheng, L.F. Influence of relative humidity on aerosol composition: Impacts on light extinction and visibility impairment at two sites in coastal area of China. Atmos. Res. 2015, 153, 500–511. [Google Scholar] [CrossRef]
© 2015 by the authors; licensee MDPI, Basel, Switzerland. This article is an open access article distributed under the terms and conditions of the Creative Commons Attribution license (http://creativecommons.org/licenses/by/4.0/).