
Seasonal Variations in Health Hazards from Polycyclic Aromatic Hydrocarbons Bound to Submicrometer Particles at Three Characteristic Sites in the Heavily Polluted Polish Region

Abstract
:1. Introduction
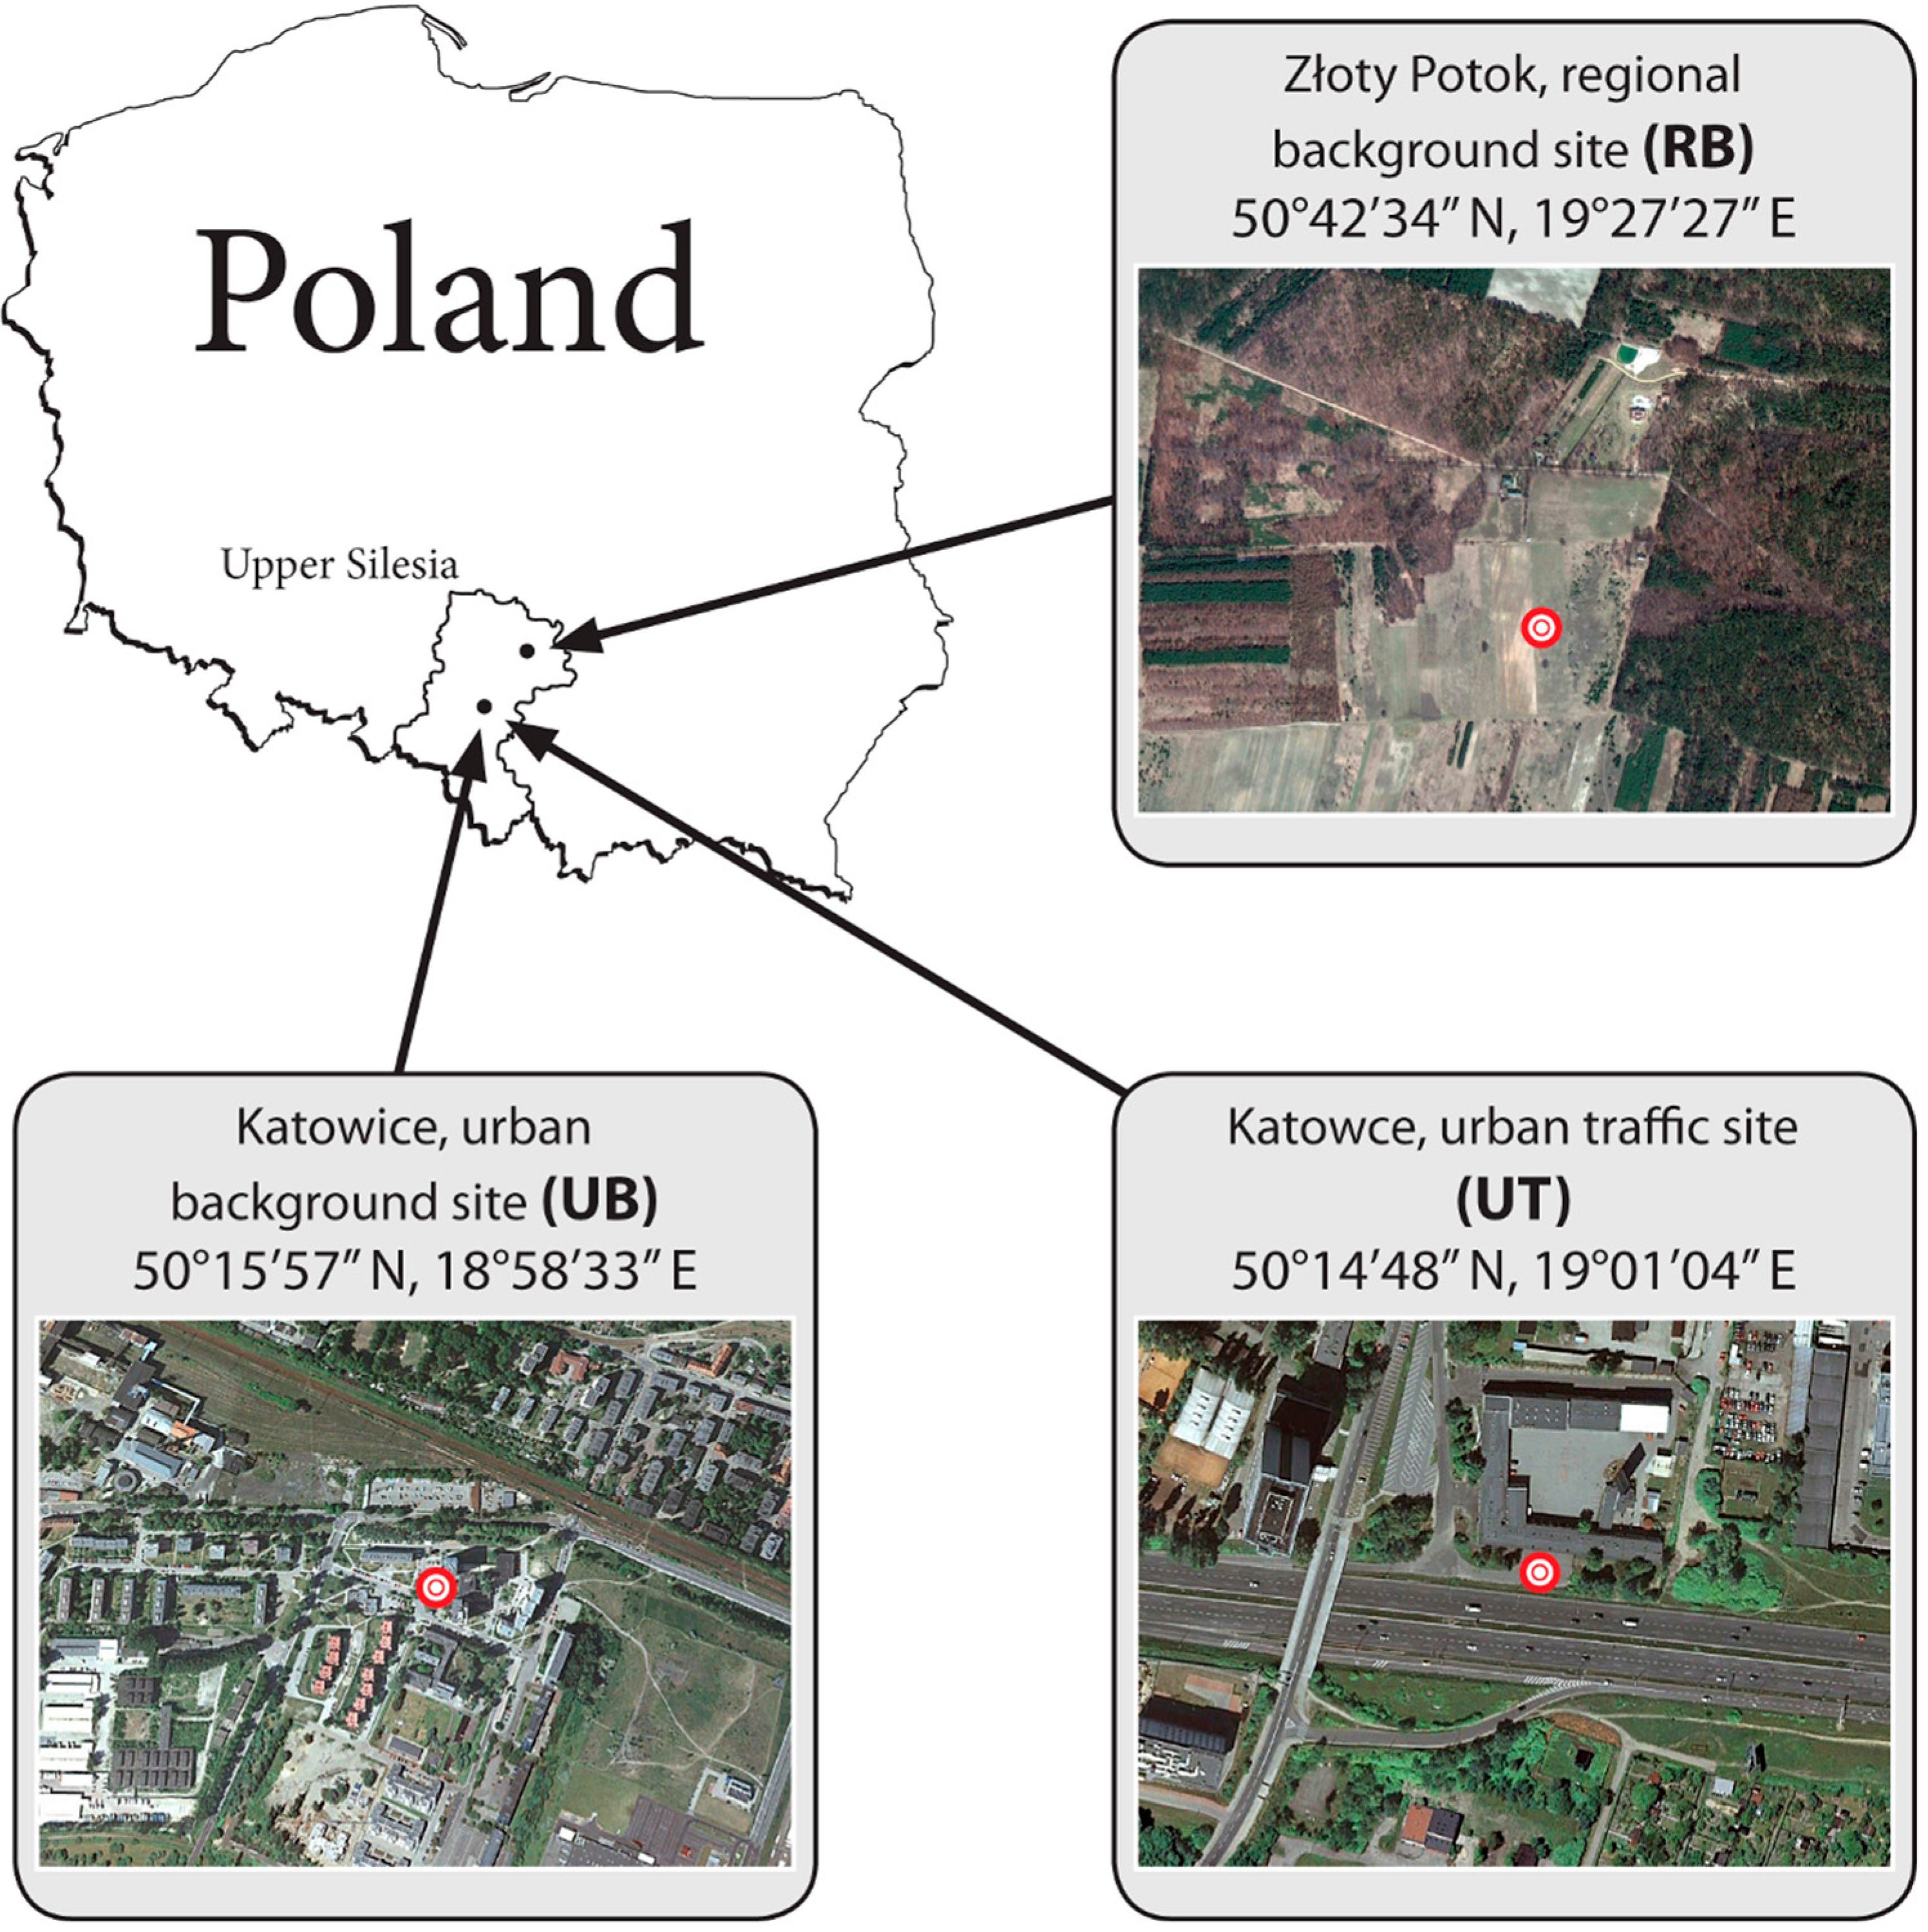
2. Materials and Methods
3. Results and Discussion

| Regional Background (RB) | Urban Background (UB) | Traffic Point (UT) | ||||||||||||||||
|---|---|---|---|---|---|---|---|---|---|---|---|---|---|---|---|---|---|---|
| Heating Season (N = 20) | Non-Heating Season (N = 20) | Heating Season (N = 20) | Non-Heating Season (N = 20) | Heating Season (N = 20) | Non-Heating season (N = 20) | |||||||||||||
| Min Max | Avrg ± SD | 50% * | Min Max | Avrg ± SD | 50% | Min Max | Avrg ± SD | 50% | Min Max | Avrg ± SD | 50% | Min Max | Avrg ± SD | 50% | Min Max | Avrg ± SD | 50% | |
| PM1 | 3.49 71.41 | 16.37± 14.42 | 14.40 | 4.82 16.06 | 10.32 ± 3.51 | 10.17 | 17.33 73.59 | 40.70 ± 14.82 | 36.64 | 7.99 34.86 | 20.83 ± 8.50 | 24.24 | 20.50 88.34 | 41.55 ± 16.56 | 36.60 | 11.83 27.72 | 18.40 ± 4.48 | 17.17 |
| 16PAH | 6.74 82.25 | 23.10 ± 17.82 | 17.49 | 3.48 45.32 | 18.57 ± 11.75 | 13.86 | 31.32 400.14 | 138.74 ± 87.07 | 116.28 | 16.18 58.59 | 30.26 ± 11.15 | 27.28 | 20.23 695.67 | 186.12 ± 162.63 | 132.42 | 8.23 179.89 | 56.02 ± 43.79 | 42.31 |
| Na | 0 0 | 0 ± 0 | 0 | 0 0.48 | 0.02 ± 0.11 | 0 | 0 0 | 0 ± 0 | 0 | 0 0 | 0 ± 0 | 0 | 0 0 | 0 ± 0 | 0 | 0 0 | 0 ± 0 | 0 |
| Acy | 0 3.40 | 0.51 ± 0.81 | 0.11 | 0 1.74 | 0.35 ± 0.50 | 0 | 0 0.39 | 0.02 ± 0.09 | 0 | 0 4.52 | 0.62 ± 1.04 | 0.32 | 0 3.36 | 0.17 ± 0.75 | 0 | 0 0.42 | 0.02 ± 0.09 | 0 |
| Ace | 0 5.29 | 0.35 ± 1.18 | 0 | 0 1.16 | 0.12 ± 0.28 | 0 | 0 1.26 | 0.28 ± 0.38 | 0 | 0 16.32 | 2.64 ± 3.87 | 0.80 | 0 2.20 | 0.11 ± 0.49 | 0 | 0 1.45 | 0.14 ± 0.38 | 0 |
| Flu | 0.40 14.82 | 2.55 ± 3.28 | 1.61 | 0 7.97 | 2.81 ± 2.60 | 1.67 | 0.33 12.11 | 2.88 ± 3.37 | 1.10 | 0.40 1.44 | 0.82 ± 0.29 | 0.76 | 0 15.51 | 3.54 ± 4.16 | 2.16 | 0.77 25.06 | 6.11 ± 7.44 | 2.85 |
| Ph | 0 2.63 | 0.64 ± 0.92 | 0 | 0 2.19 | 0.93 ± 0.78 | 1.10 | 2.53 32.67 | 9.98 ± 8.29 | 6.64 | 0.53 16.97 | 3.62 ± 4.37 | 1.81 | 0 97.13 | 15.55 ± 23.31 | 7.54 | 0 18.16 | 1.69 ± 3.93 | 0.93 |
| An | 0 5.42 | 0.64 ± 1.34 | 0 | 0 6.61 | 0.75 ± 1.58 | 0 | 0 16.28 | 3.53 ± 4.73 | 1.73 | 0.28 12.91 | 2.16 ± 3.28 | 0.90 | 0 40.88 | 6.31 ± 9.85 | 2.63 | 0.35 17.24 | 4.84 ± 5.45 | 2.07 |
| Fl | 1.29 29.88 | 3.42 ± 6.25 | 1.96 | 1.33 6.37 | 2.65 ± 1.53 | 2.07 | 3.02 71.89 | 23.36 ± 17.22 | 18.76 | 1.23 6.01 | 2.01 ± 1.01 | 1.79 | 1.86 109.03 | 26.69 ± 28.30 | 15.20 | 0.55 8.91 | 3.62 ± 2.02 | 3.60 |
| Py | 0 4.73 | 1.86 ± 1.39 | 1.73 | 0 4.24 | 1.64 ± 1.14 | 1.49 | 3.53 60.49 | 20.30 ± 14.40 | 16.02 | 0.40 6.24 | 1.87 ± 1.47 | 1.17 | 1.67 90.12 | 21.51 ± 22.04 | 13.89 | 0.66 78.64 | 10.90 ± 19.18 | 2.98 |
| BaA | 0 13.16 | 2.05 ± 2.98 | 0.95 | 0 9.54 | 1.57 ± 2.63 | 0 | 3.78 51.28 | 17.67 ± 11.37 | 14.25 | 5.08 10.73 | 7.81 ± 1.83 | 7.75 | 1.72 76.14 | 19.02 ± 17.22 | 14.03 | 2.60 24.01 | 10.41 ± 4.46 | 9.44 |
| Ch | 0.62 8.60 | 3.26 ± 2.15 | 2.38 | 0.76 5.66 | 2.81 ± 1.78 | 2.71 | 5.19 37.56 | 17.30 ± 7.62 | 17.30 | 1.70 3.82 | 2.48 ± 0.50 | 2.34 | 2.24 59.95 | 19.85 ± 13.83 | 18.24 | 1.01 12.68 | 3.86 ± 2.34 | 3.23 |
| BbF | 0 6.61 | 1.55 ± 1.46 | 1.25 | 0 3.34 | 0.80 ± 1.13 | 0.42 | 3.17 24.64 | 9.95 ± 4.92 | 8.89 | 0 1.78 | 0.76 ± 0.67 | 0.62 | 1.29 35.88 | 14.23 ± 8.66 | 11.86 | 0 6.94 | 3.38 ± 2.46 | 3.83 |
| BkF | 0 3.09 | 1.24 ± 0.92 | 1.18 | 0 2.98 | 0.68 ± 0.96 | 0.22 | 3.22 26.09 | 10.74 ± 5.21 | 9.51 | 0 7.13 | 1.87 ± 1.58 | 1.56 | 1.79 34.51 | 13.80 ± 7.77 | 11.97 | 0 6.01 | 0.97 ± 1.38 | 0.68 |
| BaP | 0.80 28.23 | 4.03 ± 5.97 | 2.40 | 0 9.52 | 2.46 ± 2.61 | 1.51 | 4.52 32.28 | 12.48 ± 6.36 | 11.29 | 0.41 5.14 | 2.97 ± 1.39 | 3.15 | 1.48 46.70 | 14.27 ± 11.27 | 11.87 | 0 19.45 | 4.73 ± 3.92 | 4.13 |
| IP | 0 5.52 | 0.49 ± 1.25 | 0 | 0 5.15 | 0.38±1.17 | 0 | 0.77 18.70 | 5.03 ± 4.18 | 3.95 | 0 1.07 | 0.35 ± 0.36 | 0.43 | 0 13.36 | 5.57 ±3.83 | 5.89 | 0 6.59 | 0.51 ± 1.48 | 0 |
| DBA | 0 2.37 | 0.21 ± 0.58 | 0 | 0 5.25 | 0.37 ± 1.19 | 0 | 0 3.71 | 0.27 ± 0.85 | 0 | 0 0.94 | 0.24 ± 0.38 | 0 | 0 47.91 | 17.21 ± 12.92 | 11.59 | 0 57.64 | 4.77 ± 12.80 | 0.40 |
| BghiP | 0 1.82 | 0.30 ± 0.59 | 0 | 0 4.73 | 0.24 ± 1.06 | 0 | 0 17.17 | 4.95 ± 4.43 | 3.98 | 0 0.59 | 0.05 ± 0.16 | 0 | 0 23.00 | 8.29 ± 5.82 | 7.97 | 0 1.12 | 0.09 ± 0.28 | 0 |


| City, Country | Sampling Point | Sampling Period | BaP | CEQ | MEQ | TEQ | ∑PAHcarc/∑PAH | Reference |
|---|---|---|---|---|---|---|---|---|
| ng∙m−3 | pg∙m−3 | |||||||
| Złoty Potok, Poland 1 | regional background | heating season 2009/2010 | 4.03 | 5.85 | 4.87 | 7.36 | 0.52 | This study |
| Katowice, Poland 1 | urban background | 12.48 | 18.46 | 20.47 | 91.95 | 0.56 | ||
| traffic point | 14.27 | 106.00 | 29.54 | 147.79 | 0.63 | |||
| Złoty Potok, Poland 1 | regional background | non-heating season 2009/2010 | 2.46 | 4.50 | 4.29 | 13.80 | 0.50 | |
| Katowice, Poland 1 | urban background | 2.97 | 5.29 | 4.23 | 13.71 | 0.59 | ||
| traffic point | 4.73 | 15.46 | 6.45 | 20.42 | 0.55 | |||
| Zabrze, Poland 1 | urban background | Winter 2007/2008 | 16.09 | 25.04 | 25.24 | 116.03 | 0.66 | [6] |
| Zabrze, Poland 2 | crossroads | June–August 2006 | 1.1 | 1.48 | 1.90 | 10.29 | 0.48 | [10] |
| Ruda Śląska 2 | roadside | 0.3 | 1.57 | 0.87 | 6.62 | 0.84 | ||
| Brno, Czech Republic 1 | large city | Winter 2009 | 1.39 | 5.35 | 3.19 | 9.65 | 0.55 | [14] |
| Winter 2010 | 2.82 | 8.71 | 5.85 | 15.81 | 0.57 | |||
| Summer 2009 | 0.35 | 3.17 | 0.84 | 2.74 | 0.58 | |||
| Summer 2010 | 0.15 | 0.45 | 0.29 | 0.83 | 0.54 | |||
| Šlapanice, Czech Republic 1 | small town | Winter 2009 | 1.65 | 5.94 | 3.72 | 10.63 | 0.67 | |
| Winter 2010 | 2.84 | 9.24 | 5.98 | 16.56 | 0.58 | |||
| Summer 2009 | 0.39 | 3.08 | 0.93 | 2.93 | 0.58 | |||
| Summer 2010 | 0.15 | 0.35 | 0.27 | 0.79 | 0.57 | |||
| Madrid, Spain 1 | roadside | Winter 2009 | 0.24 | 0.51 | 0.51 | 2.55 | 0.47 | [26] |
| urban background | 0.054 | 0.12 | 0.11 | 0.62 | 0.56 | |||
| roadside | Summer 2009 | 0.034 | 0.12 | 0.09 | 0.43 | 0.47 | ||
| urban background | 0.022 | 0.10 | 0.05 | 0.26 | 0.57 | |||
| Bumardas, Algeria 1 | urban | October 2006 | 0.111 | 0.43 | 0.26 | 0.37 | 0.44 | [28] |
| Rouiba-Réghaia, Algeria 1 | industrial district | 0.296 | 1.48 | 0.70 | 1.33 | 0.62 | ||
| Chréa, Algeria 1 | forested mountains | 0.018 | 0.11 | 0.04 | 0.08 | 0.39 | ||
| Florence, Italy 2 | urban background | Cold 2009–2010 | 0.47 | 2.72 | 0.99 | 5.39 | 0.78 | [29] |
| urban traffic | 1.0 | 5.43 | 2.17 | 11.79 | 0.74 | |||
| Livorno, Italy 2 | suburban background | 0.20 | 0.83 | 0.44 | 2.10 | 0.63 | ||
| Florence, Italy 2 | urban background | Warm 2009–2010 | 0.049 | 0.41 | 0.14 | 1.01 | 0.61 | |
| urban traffic | 0.21 | 1.54 | 0.54 | 3.47 | 0.60 | |||
| Livorno, Italy 2 | suburban background | 0.02 | 0.09 | 0.07 | 0.37 | 0.46 | ||
| Urumqi, China 2 | urban | Winter 2010/2011 | 2.21 | 43.18 | 13.39 | 63.40 | 0.77 | [30] |
| Autumn 2010 | 0.53 | 10.09 | 2.56 | 12.77 | 0.93 | |||
| Chennai City, India 2 | commercial region | Winter 2009/2010 | 6.5 | 13.44 | 25.77 | 111.22 | 0.31 | [31] |
| urban region | 8.1 | 20.72 | 37.42 | 136.13 | 0.28 | |||
| residential region | 16.2 | 19.68 | 24.28 | 37.32 | 0.13 | |||
| industrial region | 24.4 | 39.78 | 58.52 | 242.65 | 0.21 | |||
| Chennai City, India 2 | commercial region | Summer 2009 | 10.3 | 16.88 | 25.96 | 79.58 | 0.29 | |
| urban region | 25.6 | 44.29 | 77.37 | 246.68 | 0.47 | |||
| residential region | 6.2 | 13.85 | 26.64 | 94.19 | 0.39 | |||
| industrial region | 8.5 | 38.37 | 91.24 | 516.48 | 0.33 | |||
| Delhi, India 2 | traffic point | Winter 2007 | 9.9 | 28.92 | 24.27 | 125.43 | 0.67 | [32] |
| Summer 2007/2008 | 5.1 | 17.64 | 10.60 | 57.76 | 0.62 | |||
| Atlanta, USA 2 | urban | April–June 2004 | 0.04 | 0.10 | 0.12 | 0.48 | 0.47 | [33] |
| suburban-highway | 0.066 | 0.15 | 0.18 | 0.66 | 0.51 | |||
| rural | 0.015 | 0.05 | 0.05 | 0.23 | 0.44 | |||
| urban | October–December 2004 | 0.265 | 0.53 | 0.59 | 2.27 | 0.64 | ||
| suburban-highway | 0.492 | 0.90 | 0.97 | 3.52 | 0.68 | |||
| rural | 0.199 | 0.48 | 0.46 | 2.12 | 0.70 | |||
4. Conclusions
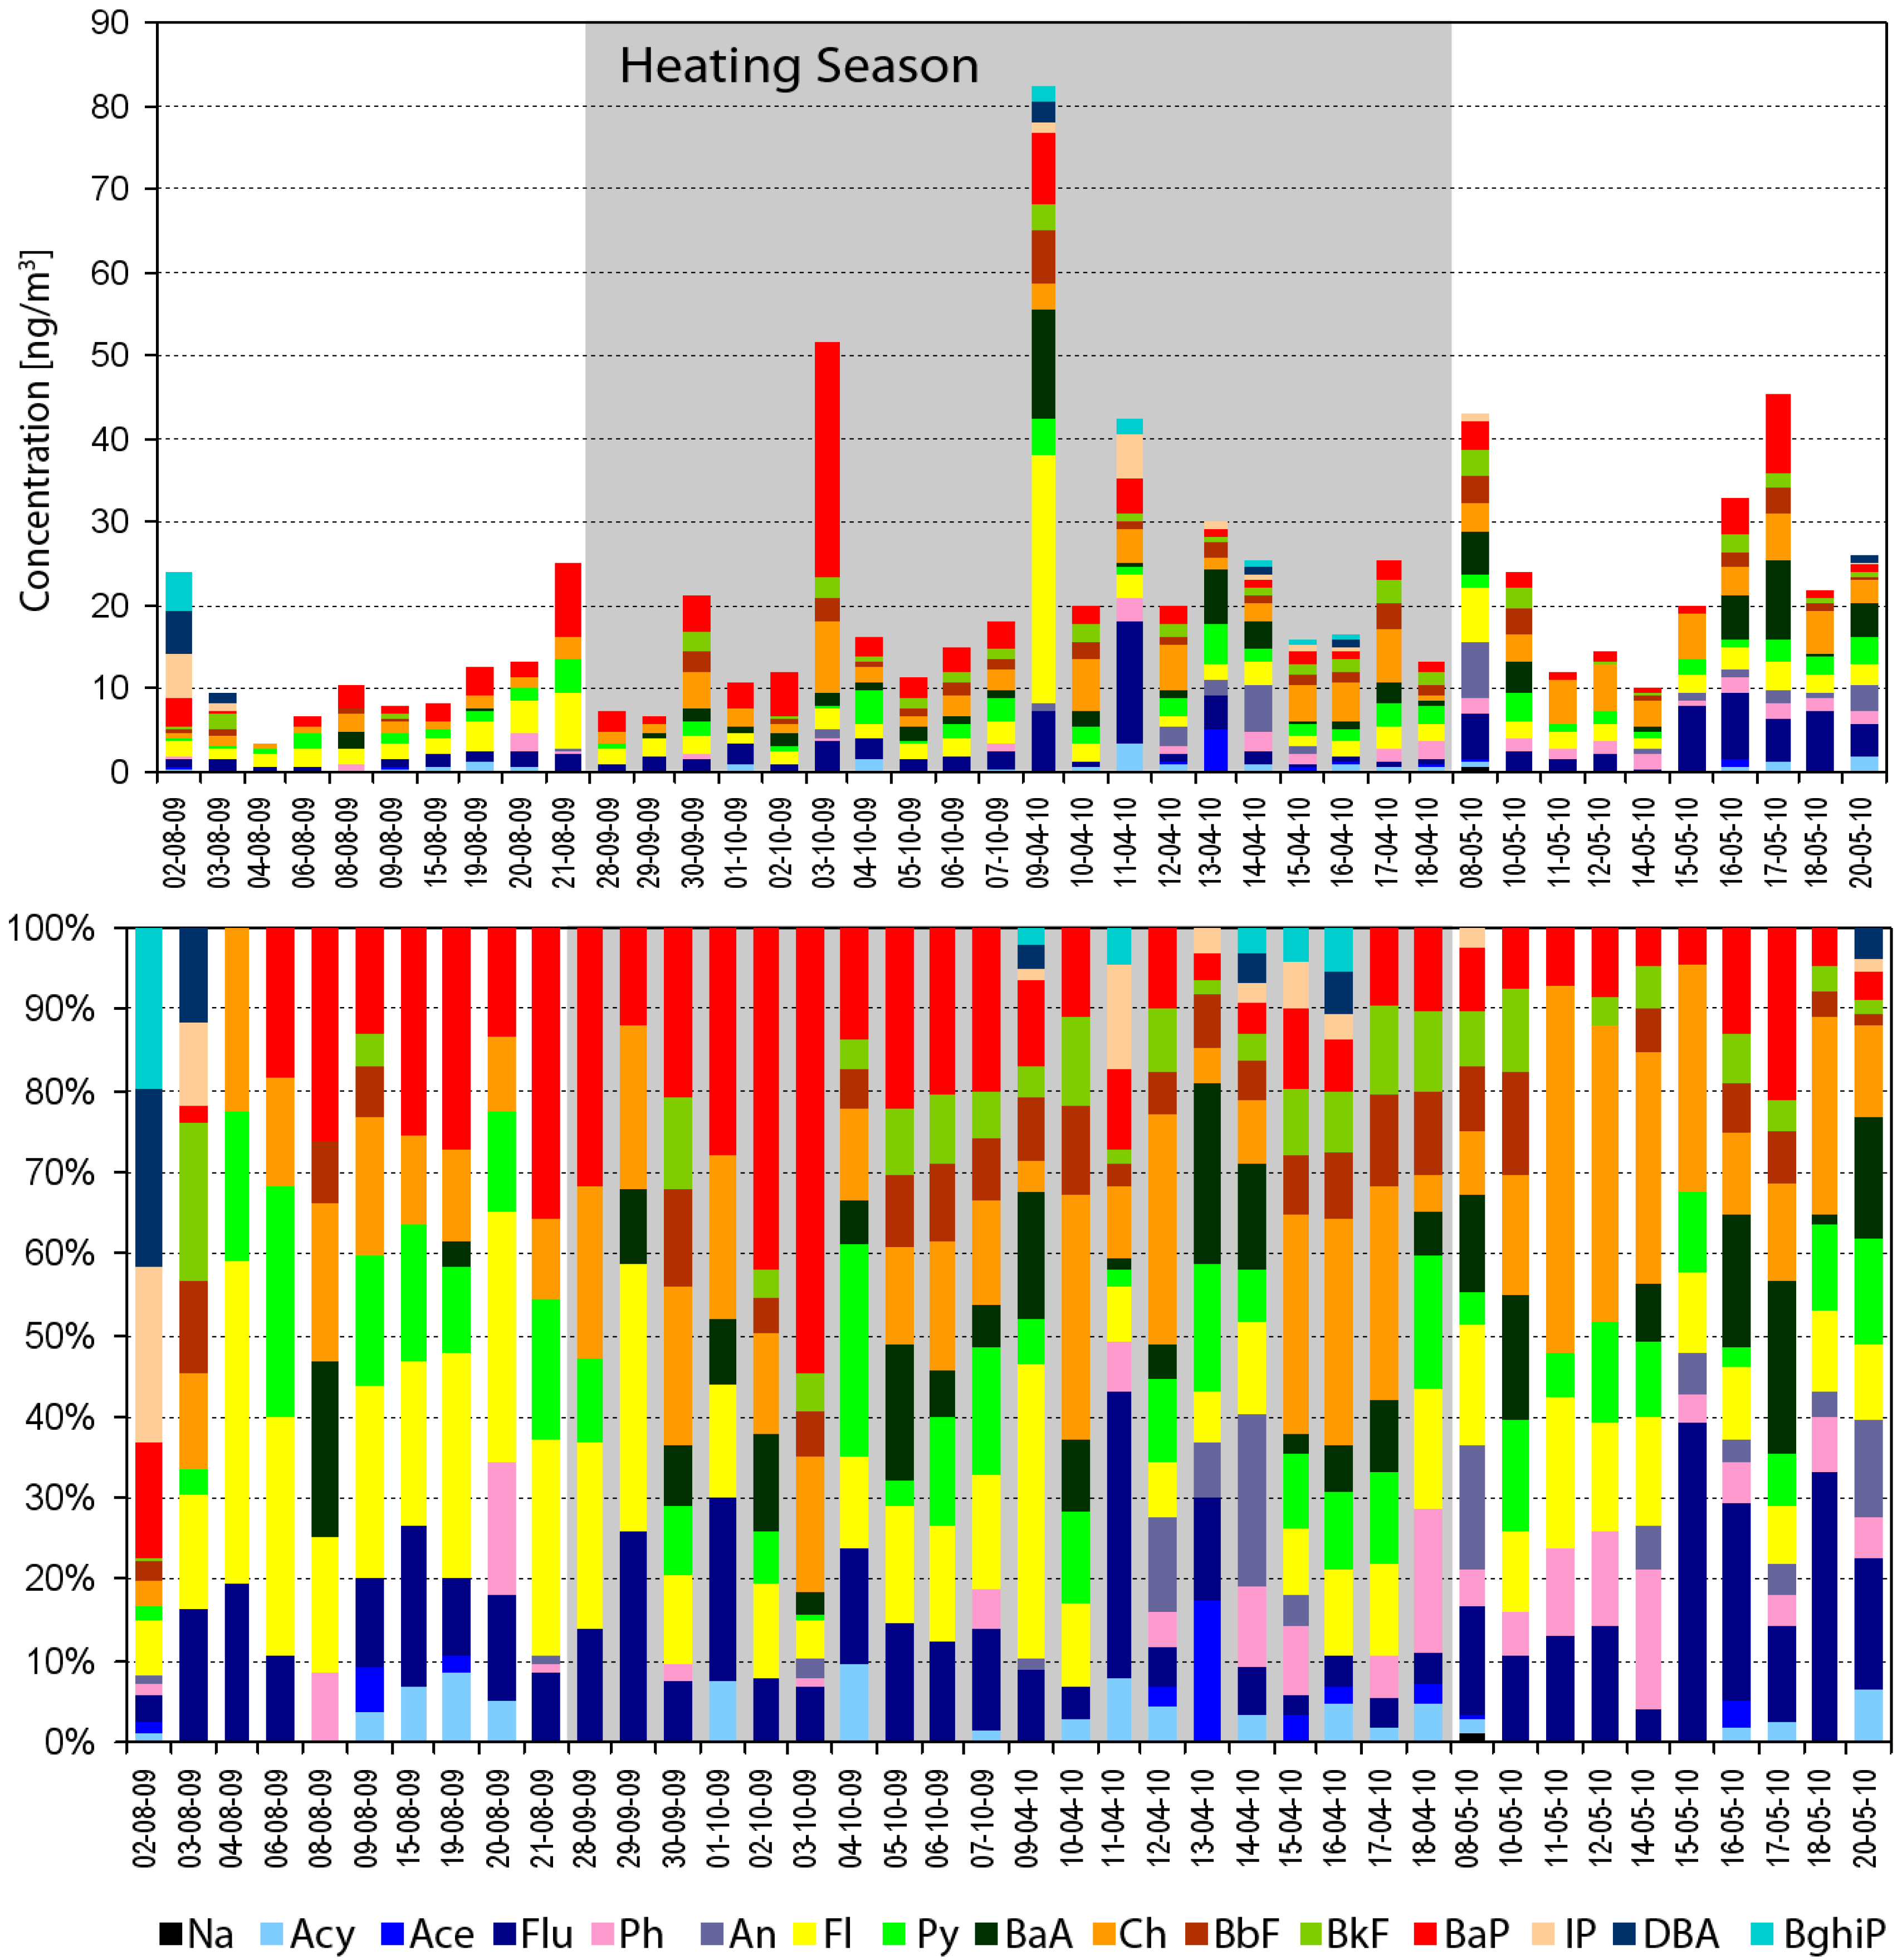
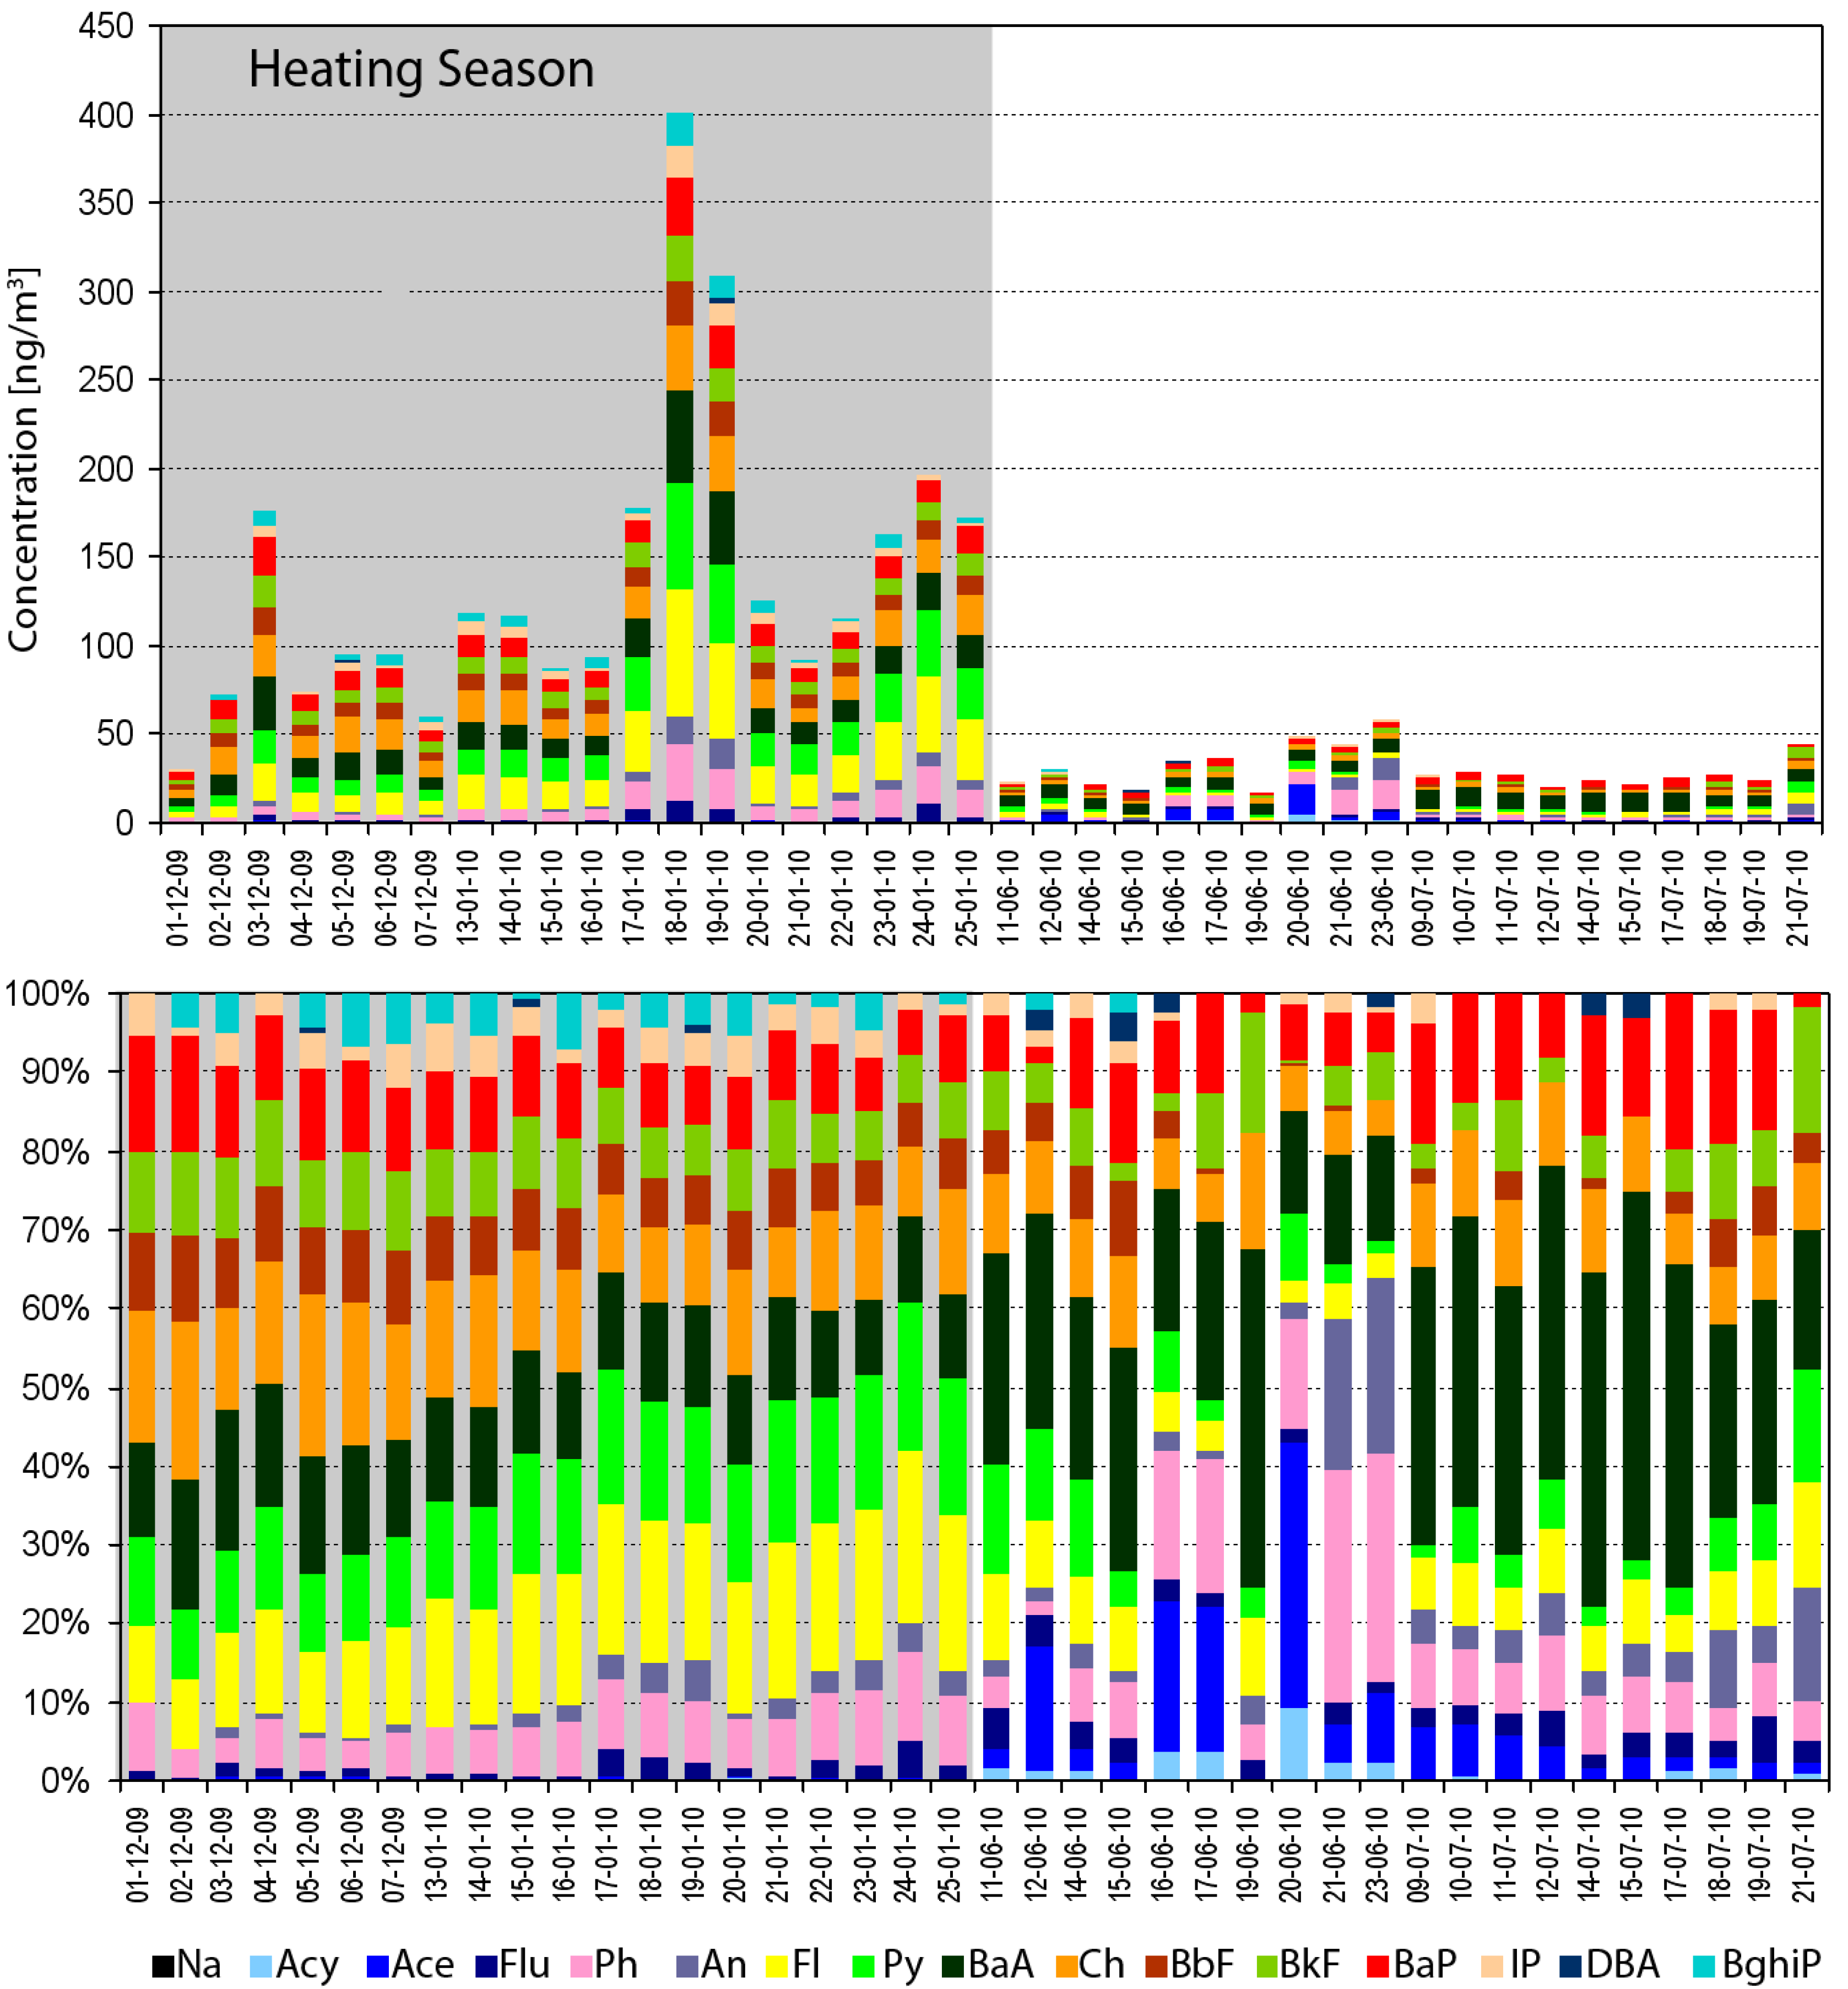
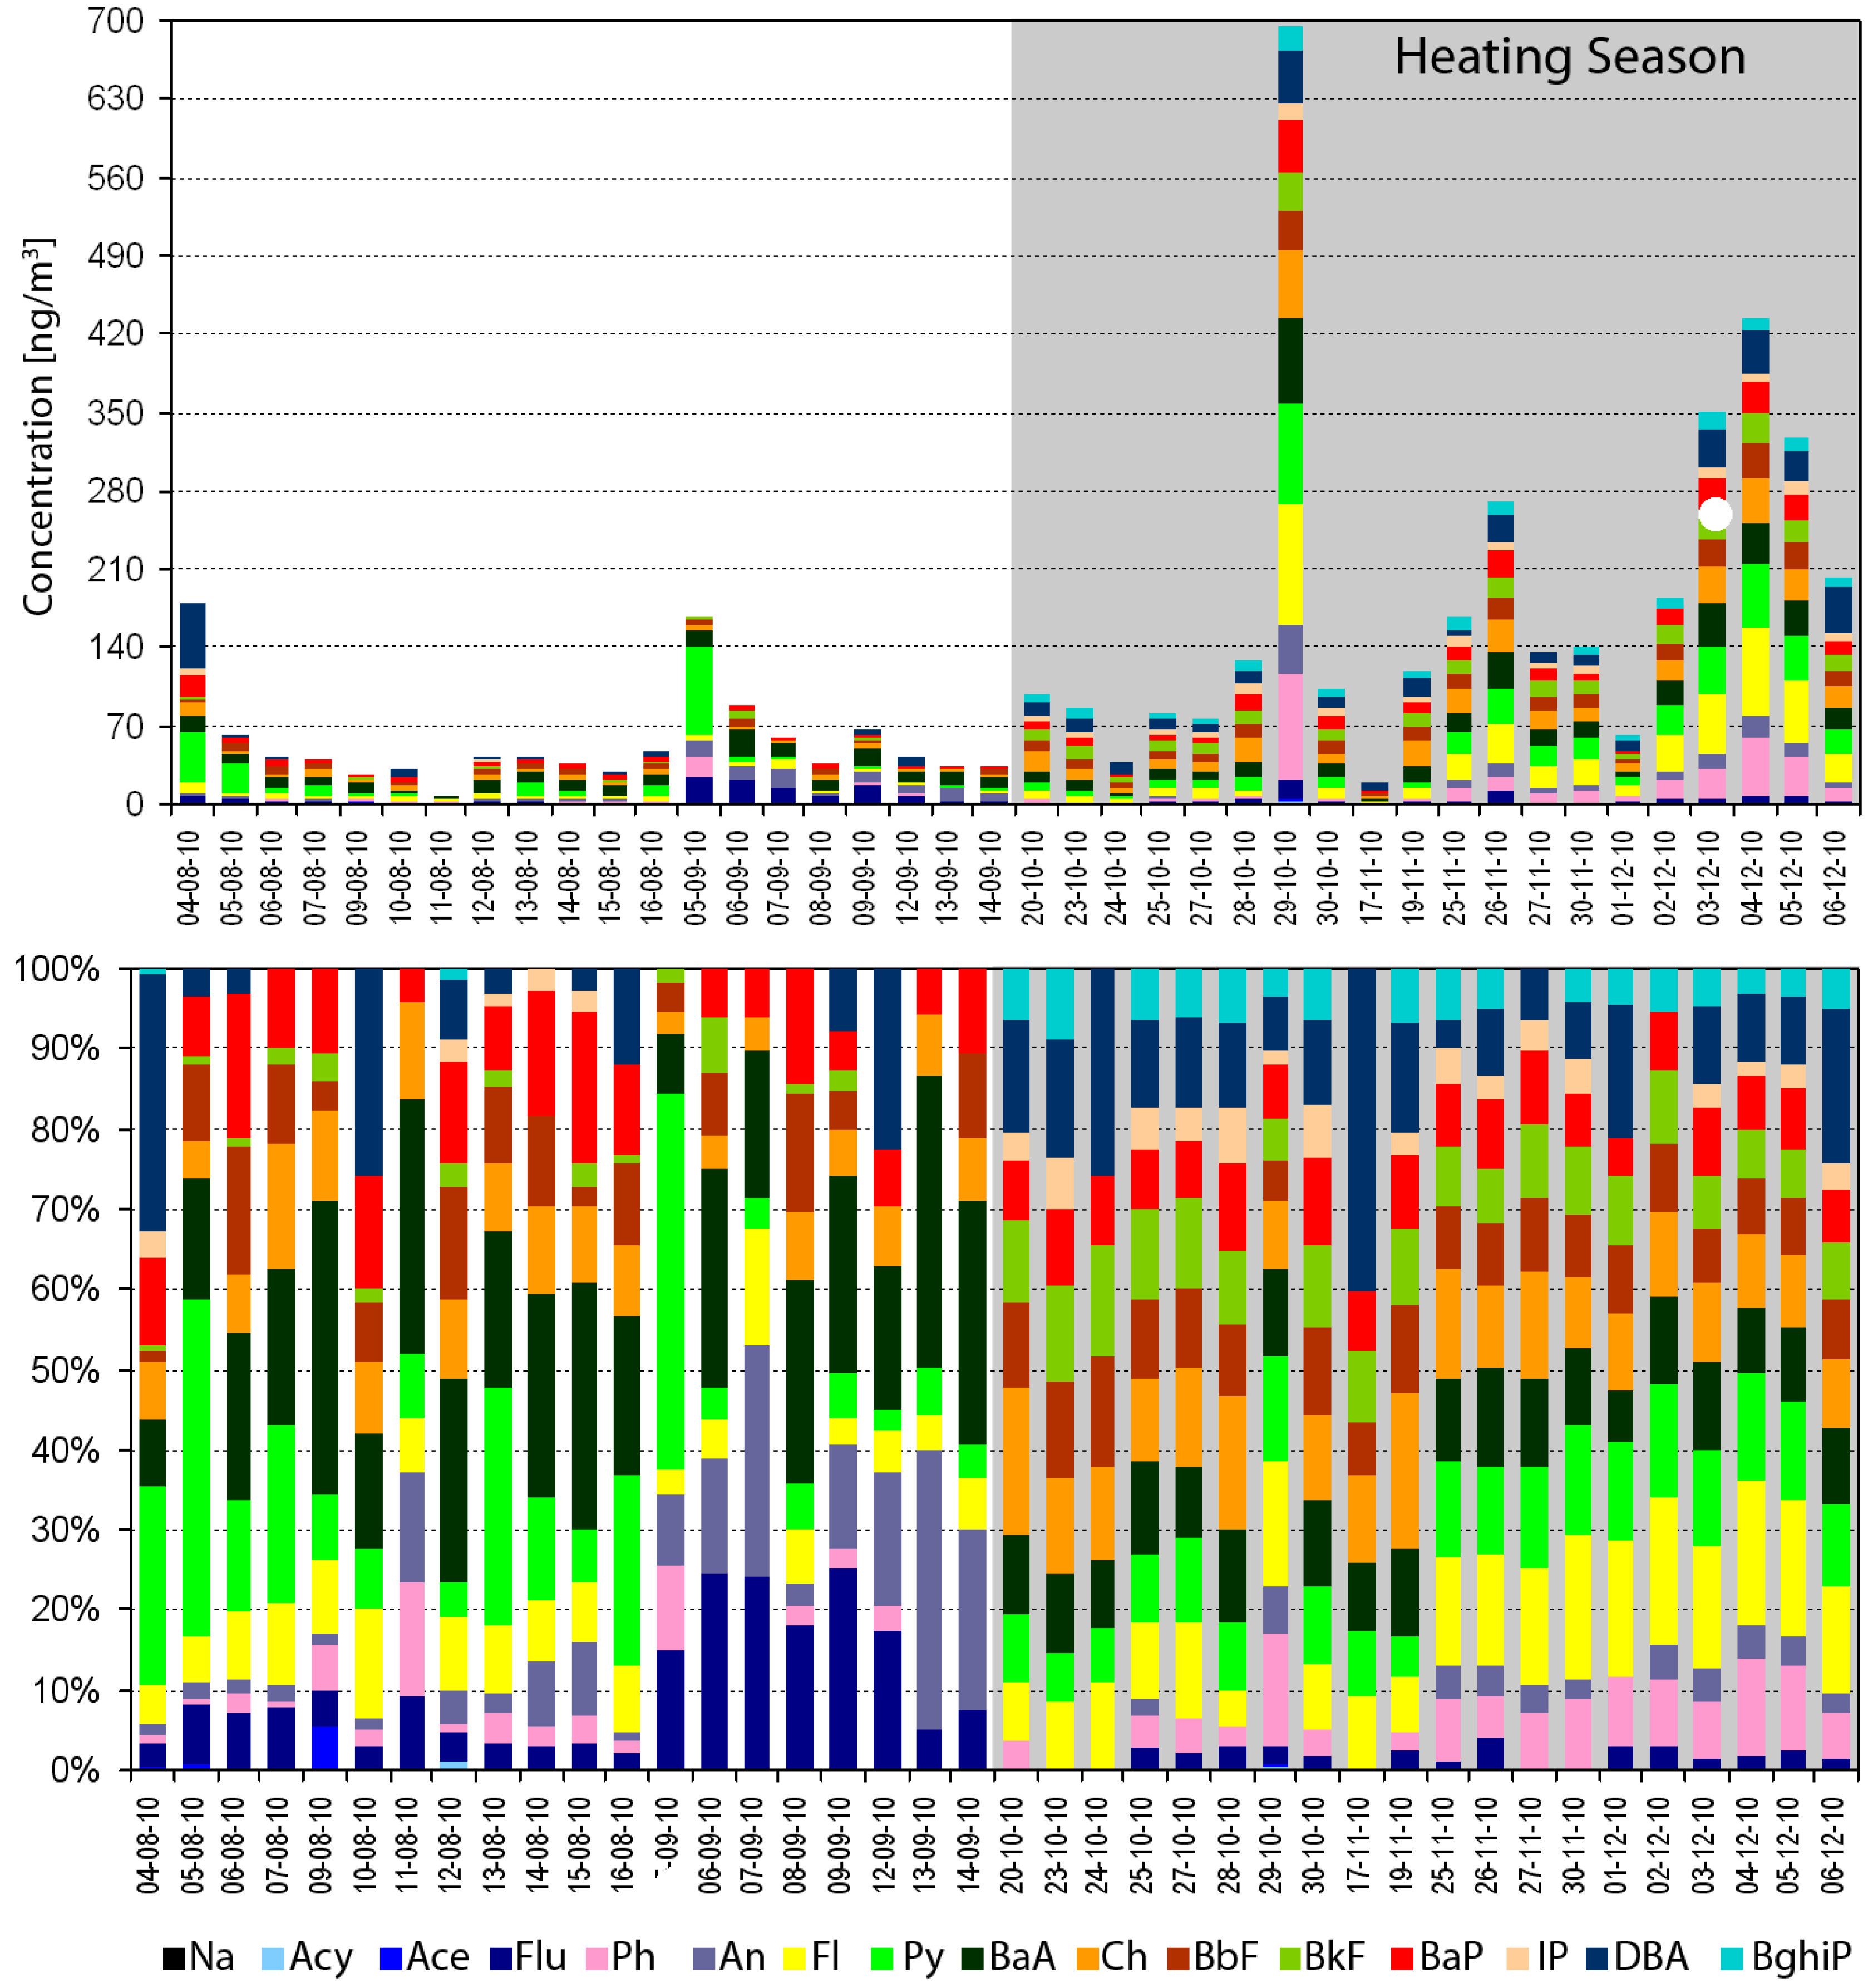
- over the whole measurement period, mean concentrations of the PM1-bound PAH sum and particular compounds within this group were high at each of the three selected points in Silesia; particularly high values were observed for the heating season;
- concentrations of the sum of 16 PM1-related PAHs and BaP in the air in Silesia were higher than most values observed in other regions of the world; nonetheless, they did not differ from the concentrations measured in this area previously;
- the highest concentrations of most PAHs were observed at UT point, both in the heating and in the non-heating seasons;
- in the typical urban background area, mainly municipal emissions (burning coal, biomass, waste and rubbish in home furnaces) and energy production (mainly based on hard and brown coal combustion) influence PAH concentrations in the air; in the urban site located near highway, the same sources were active as in the urban background area; additionally, there was a strong influence of the traffic emission. In RB, mainly local and dispersed sources and the inflow of pollutants from other, more polluted regions, affected the air pollution with PAHs in both seasons;
- high percentage of BaP in the PAH sum (9%–13%) and very high ambient concentrations of the PM1-bound BaP, particularly in the heating season (4–14 ng∙m−3), may pose a serious threat to the Silesia inhabitants; the risk does not only concern the residents of large cities and regions located close to important traffic emission sources, it also involves people who dwell in the “clean” areas far away from large urban agglomerations (regional/rural background);
- in the heating season, the mean CEQs for the whole monitoring period were 5.85 ng∙m−3 in RB, 18.46 ng∙m−3 in UB, and 106 ng∙m−3 in UT; they were unquestionably higher than the non-heating season values and definitely higher than the values obtained in other European regions;
- MEQ, TEQ and ∑PAHcarc/∑PAH, proposed by the authors as other indicators of the exposure to the PAH mixture, were very high in the Upper Silesian urban area when compared to other regions; the highest indicator values were observed in the heating season;
- it may be suspected that in Central, Central-East and East Europe traffic is not the primary PAH source; the PM-bound PAHs come mainly from the fossil fuel combustion for heat and power production.
Acknowledgments
Author Contributions
Conflicts of Interest
References
- Nikolaou, K.; Masclet, P.; Mouvier, G. Sources and chemical reactivity of polynuclear aromatic hydrocarbons in the atmosphere—A critical review. Sci. Total Environ. 1984, 32, 103–132. [Google Scholar] [CrossRef]
- Durant, J.L.; Busby, W.F., Jr.; Lafleur, A.L.; Penman, B.W.; Crespi, C.L. Human cell mutagenicity of oxygenated, nitrated and unsubstituted polycyclic aromatic hydrocarbons associated with urban aerosols. Mutat. Res. Genetic Toxicol. 1996, 371, 123–157. [Google Scholar] [CrossRef]
- Saunders, C.R.; Ramesh, A.; Shockley, D.C. Modulation of neurotoxic behavior in F-344 rats by temporal disposition of benzo(a)pyrene. Toxicol. Lett. 2002, 129, 33–45. [Google Scholar] [CrossRef] [PubMed]
- Ravindra, K.; Sokhi, R.; van Grieken, R. Atmospheric polycyclic aromatic hydrocarbons: Source attribution, emission factors and regulation. Atmos. Environ. 2008, 42, 2895–2921. [Google Scholar] [CrossRef] [Green Version]
- Nisbet, I.C.T.; LaGoy, P.K. Toxic Equivalency Factors (TEFs) for Polycyclic Aromatic Hydrocarbons (PAHs). Regul. Toxicol. Pharmacol. 1992, 16, 290–300. [Google Scholar] [CrossRef] [PubMed]
- Rogula-Kozłowska, W.; Kozielska, B.; Klejnowski, K. Concentration, origin and health hazard from fine particle-bound PAH at three characteristic sites in Southern Poland. Bull. Environ. Contam. Toxicol. 2013, 91, 349–355. [Google Scholar] [CrossRef] [PubMed]
- Majewski, G.; Kleniewska, M.; Brandyk, A. Seasonal variation of particulate matter mass concentration and content of metals. Pol. J. Environ. Stud. 2011, 20, 417–427. [Google Scholar]
- Rogula-Kozłowska, W.; Klejnowski, K.; Rogula-Kopiec, P.; Mathews, B.; Szopa, S. A study on the seasonal mass closure of ambient fine and coarse dusts in Zabrze, Poland. Bull. Environ. Contam. Toxicol. 2012, 88, 722–729. [Google Scholar] [CrossRef] [PubMed]
- Kozielska, B.; Rogula-Kozłowska, W.; Pastuszka, J.S. Traffic emission effects on ambient air pollution by PM2.5-related PAH in Upper Silesia, Poland. Int. J. Environ. Pollut. 2013, 53, 245–264. [Google Scholar]
- Rogula-Kozłowska, W.; Klejnowski, K.; Rogula-Kopiec, P.; Ośródka, L.; Krajny, E.; Błaszczak, B.; Mathews, B. Spatial and seasonal variability of the mass concentration and chemical composition of PM2.5 in Poland. Air Qual. Atmos. Health 2014, 7, 41–58. [Google Scholar] [CrossRef] [PubMed]
- Viana, M.; Kuhlbusch, T.A.J.; Querol, X.; Alastuey, A.; Harrison, R.M.; Hopke, P.K.; Winiwarter, W.; Vallius, M.; Szidat, S.; Prévôt, A.S.H.; et al. Source apportionment of particulate matter in Europe: A review of methods and results. J. Aerosol. Sci. 2008, 39, 827–849. [Google Scholar] [CrossRef]
- Willett, K.L.; Gardinali, P.R.; Sericano, J.L.; Wade, T.L.; Safe, S.H. Characterization of the H4IIE rat hepatoma cell bioassay for evaluation of environmental samples containing Polynuclear Aromatic Hydrocarbons (PAHs). Arch. Environ. Contam. Toxicol. 1997, 32, 442–448. [Google Scholar] [CrossRef] [PubMed]
- USEPA (Environmental Protection Agency). Polycyclic Aromatic Hydrocarbons (PAHs)—EPA Fact Sheet; National Center for Environmental Assessment, Office of Research and Development: Washington, DC, USA, 2008.
- Křůmal, K.; Mikuška, P.; Večeřa, Z. Polycyclic aromatic hydrocarbons and hopanes in PM1 aerosols in urban areas. Atmos. Environ. 2013, 67, 27–37. [Google Scholar] [CrossRef]
- Perrone, M.R.; Dinoi, A.; Becagli, S.; Udisti, R. Chemical composition of PM1 and PM2.5 at a suburban site in southern Italy. Int. J. Environ. Anal. Chem. 2014, 94, 127–150. [Google Scholar] [CrossRef]
- Gholampour, A.; Nabizadeh, R.; Yunesian, M.; Naseri, S.; Taghipour, H.; Rastkari, N.; Nazmara, S.; Mahvi, A.H. Physicochemical characterization of ambient air particulate matter in Tabriz, Iran. Bull. Environ. Contam. Toxicol. 2014, 92, 738–744. [Google Scholar] [CrossRef] [PubMed]
- Shi, Y.; Chen, J.; Hu, D.; Wang, L.; Yang, X.; Wang, X. Airborne submicron particulate (PM1) pollution in Shanghai, China: Chemical variability, formation/dissociation of associated semi-volatile components and the impacts on visibility. Sci. Total Environ. 2014, 473–474, 199–206. [Google Scholar] [CrossRef] [PubMed]
- Duan, J.; Tan, J.; Wang, S.; Chai, F.; He, K.; Hao, J. Roadside, urban, and rural comparison of size distribution characteristics of PAHs and carbonaceous components of Beijing, China. J. Atmos. Chem. 2012, 69, 337–349. [Google Scholar] [CrossRef]
- Pachauri, T.; Satsangi, A.; Singla, V.; Lakhani, A.; Maharaj Kumari, K. Characteristics and sources of carbonaceous aerosols in PM2.5 during wintertime in Agra, India. Aerosol Air Qual. Res. 2013, 13, 977–991. [Google Scholar]
- Hassan, S.K.; Khoder, M.I. Gas-particle concentration, distribution, and health risk assessment of polycyclic aromatic hydrocarbons at a traffic area of Giza, Egypt. Environ. Monit. Assess. 2012, 184, 3593–3612. [Google Scholar] [CrossRef] [PubMed]
- Šišović, A.; Pehnec, G.; Jakovljević, I.; Šilović Hujić, M.; Vacrossed D Signić, V.; Bešlić, I. Polycyclic aromatic hydrocarbons at different crossroads in Zagreb, Croatia. Bull. Environ. Contam. Toxicol. 2012, 88, 438–442. [Google Scholar] [CrossRef] [PubMed]
- Tang, N.; Hattori, T.; Taga, R.; Igarashi, K.; Yang, X.; Tamura, K.; Kakimoto, H.; Mishukov, V.F.; Toriba, A.; Kizu, R.; et al. Polycyclic aromatic hydrocarbons and nitropolycyclic aromatic hydrocarbons in urban air particulates and their relationship to emission sources in the Pan-Japan Sea countries. Atmos. Environ. 2005, 39, 5817–5826. [Google Scholar] [CrossRef]
- Kuo, C.-Y.; Chien, P.-S.; Kuo, W.-C.; Wei, C.-T.; Rau, J.-Y. Comparison of polycyclic aromatic hydrocarbon emissions on gasoline- and diesel-dominated routes. Environ. Monit. Assess. 2013, 185, 5749–5761. [Google Scholar] [CrossRef] [PubMed]
- WHO. Air Quality Guidelines for Europe; World Health Organization Regional Office for Europe: Copenhagen, Denmark, 2000. [Google Scholar]
- EC. Council Directive 2004/107/EC Relating to Arsenic, Cadmium, Mercury, Nickel and Polycyclic Aromatic Hydrocarbons in Ambient Air. Available online: http://eur-lex.europa.eu/LexUriServ/LexUriServ.do?uri=OJ:L:2005:023:0003:0016:EN:PDF (accessed on 17 December 2014).
- Mirante, F.; Alves, C.; Pio, C.; Pindado, O.; Perez, R.; Revuelta, M.A.; Artiñano, B. Organic composition of size segregated atmospheric particulate matter, during summer and winter sampling campaigns at representative sites in Madrid, Spain. Atmos. Res. 2013, 132–133, 345–361. [Google Scholar] [CrossRef]
- Rogula-Kozłowska, W.; Kozielska, B.; Błaszczak, B.; Klejnowski, K. The mass distribution of particle-bound PAH among aerosol fractions: A case-study of an urban area in Poland. In Organic Pollutants Ten Years after the Stockholm Convention—Environmental and Analytical Update; Puzyn, T., Mostrag-Szlichtyng, A., Eds.; InTech: Rijeka, Croatia, 2012; pp. 163–190. [Google Scholar]
- Ladji, R.; Yassa, N.; Balducci, C.; Cecinato, A.; Meklati, B.Y. Distribution of the solvent-extractable organic compounds in fine (PM1) and coarse (PM1–10) particles in urban, industrial and forest atmospheres on Northern Algeria. Sci. Total Environ. 2009, 409, 415–424. [Google Scholar] [CrossRef]
- Martellini, T.; Giannoni, M.; Lepri, L.; Katsoyiannis, A.; Cincinelli, A. One year intensive PM2.5 bound polycyclic aromatic hydrocarbons monitoring in the area of Tuscany, Italy. Concentrations, source understanding and implications. Environ. Pollut. 2012, 164, 252–258. [Google Scholar] [CrossRef] [PubMed]
- Da Limu, Y.L.M.A.B.; LiFu, D.L.N.T.; Miti, A.B.L.Y.; Wang, X.; Ding, X. Autumn and wintertime polycyclic aromatic hydrocarbons in PM2.5 and PM2.5–10 from Urumqi, China. Aerosol Air Qual. Res. 2013, 13, 407–414. [Google Scholar]
- Mohanraj, R.; Solaraj, G.; Dhanakumar, S. Fine particulate phase PAHs in ambient atmosphere of Chennai metropolitan city, India. Environ. Sci. Pollut. Res. 2011, 18, 764–771. [Google Scholar] [CrossRef]
- Singh, D.P.; Gadi, R.; Mandal, T.K. Characterization of particulate-bound polycyclic aromatic hydrocarbons and trace metals composition of urban air in Delhi, India. Atmos. Environ. 2011, 45, 7653–7663. [Google Scholar] [CrossRef]
- Li, Z.; Porter, E.N.; Sjödin, A.; Needham, L.L.; Lee, S.; Russell, A.G.; Mulholland, J.A. Characterization of PM2.5-bound polycyclic aromatic hydrocarbons in Atlanta-Seasonal variations at urban, suburban, and rural ambient air monitoring sites. Atmos. Environ. 2009, 43, 4187–4193. [Google Scholar] [CrossRef]
© 2014 by the authors; licensee MDPI, Basel, Switzerland. This article is an open access article distributed under the terms and conditions of the Creative Commons Attribution license (http://creativecommons.org/licenses/by/4.0/).
Share and Cite
Kozielska, B.; Rogula-Kozłowska, W.; Klejnowski, K. Seasonal Variations in Health Hazards from Polycyclic Aromatic Hydrocarbons Bound to Submicrometer Particles at Three Characteristic Sites in the Heavily Polluted Polish Region. Atmosphere 2015, 6, 1-20. https://doi.org/10.3390/atmos6010001
Kozielska B, Rogula-Kozłowska W, Klejnowski K. Seasonal Variations in Health Hazards from Polycyclic Aromatic Hydrocarbons Bound to Submicrometer Particles at Three Characteristic Sites in the Heavily Polluted Polish Region. Atmosphere. 2015; 6(1):1-20. https://doi.org/10.3390/atmos6010001
Chicago/Turabian StyleKozielska, Barbara, Wioletta Rogula-Kozłowska, and Krzysztof Klejnowski. 2015. "Seasonal Variations in Health Hazards from Polycyclic Aromatic Hydrocarbons Bound to Submicrometer Particles at Three Characteristic Sites in the Heavily Polluted Polish Region" Atmosphere 6, no. 1: 1-20. https://doi.org/10.3390/atmos6010001
APA StyleKozielska, B., Rogula-Kozłowska, W., & Klejnowski, K. (2015). Seasonal Variations in Health Hazards from Polycyclic Aromatic Hydrocarbons Bound to Submicrometer Particles at Three Characteristic Sites in the Heavily Polluted Polish Region. Atmosphere, 6(1), 1-20. https://doi.org/10.3390/atmos6010001