Local Climate Classification and Dublin’s Urban Heat Island

Abstract
:
1. Introduction

| Energy Balance Term (Relative to Rural Areas) | Urban Feature within UCL (LCZ) | Urban Effect | Selected Study on Specific Feature |
|---|---|---|---|
| Increased K* | Canyon Geometry | Increased surface area and trapping of radiation | [11,12] |
| Increased L↓ | Air Pollution | Greater absorption and re-emission | [11,12] |
| Decreased L* | Canyon Geometry | Reduced Sky View Factor (less nocturnal loss) | [12] |
| Addition of QF | Buildings and Traffic | Direct addition of heat | [13,14,15] |
| Increased ∆QS | Construction Materials | Increased thermal admittance | [16,17] |
| Decreased QE | Construction Materials | Increased water-proofing | [17,18] |
| Decreased QA | Canyon Geometry | Reduces wind speed | [11] |
- (i)
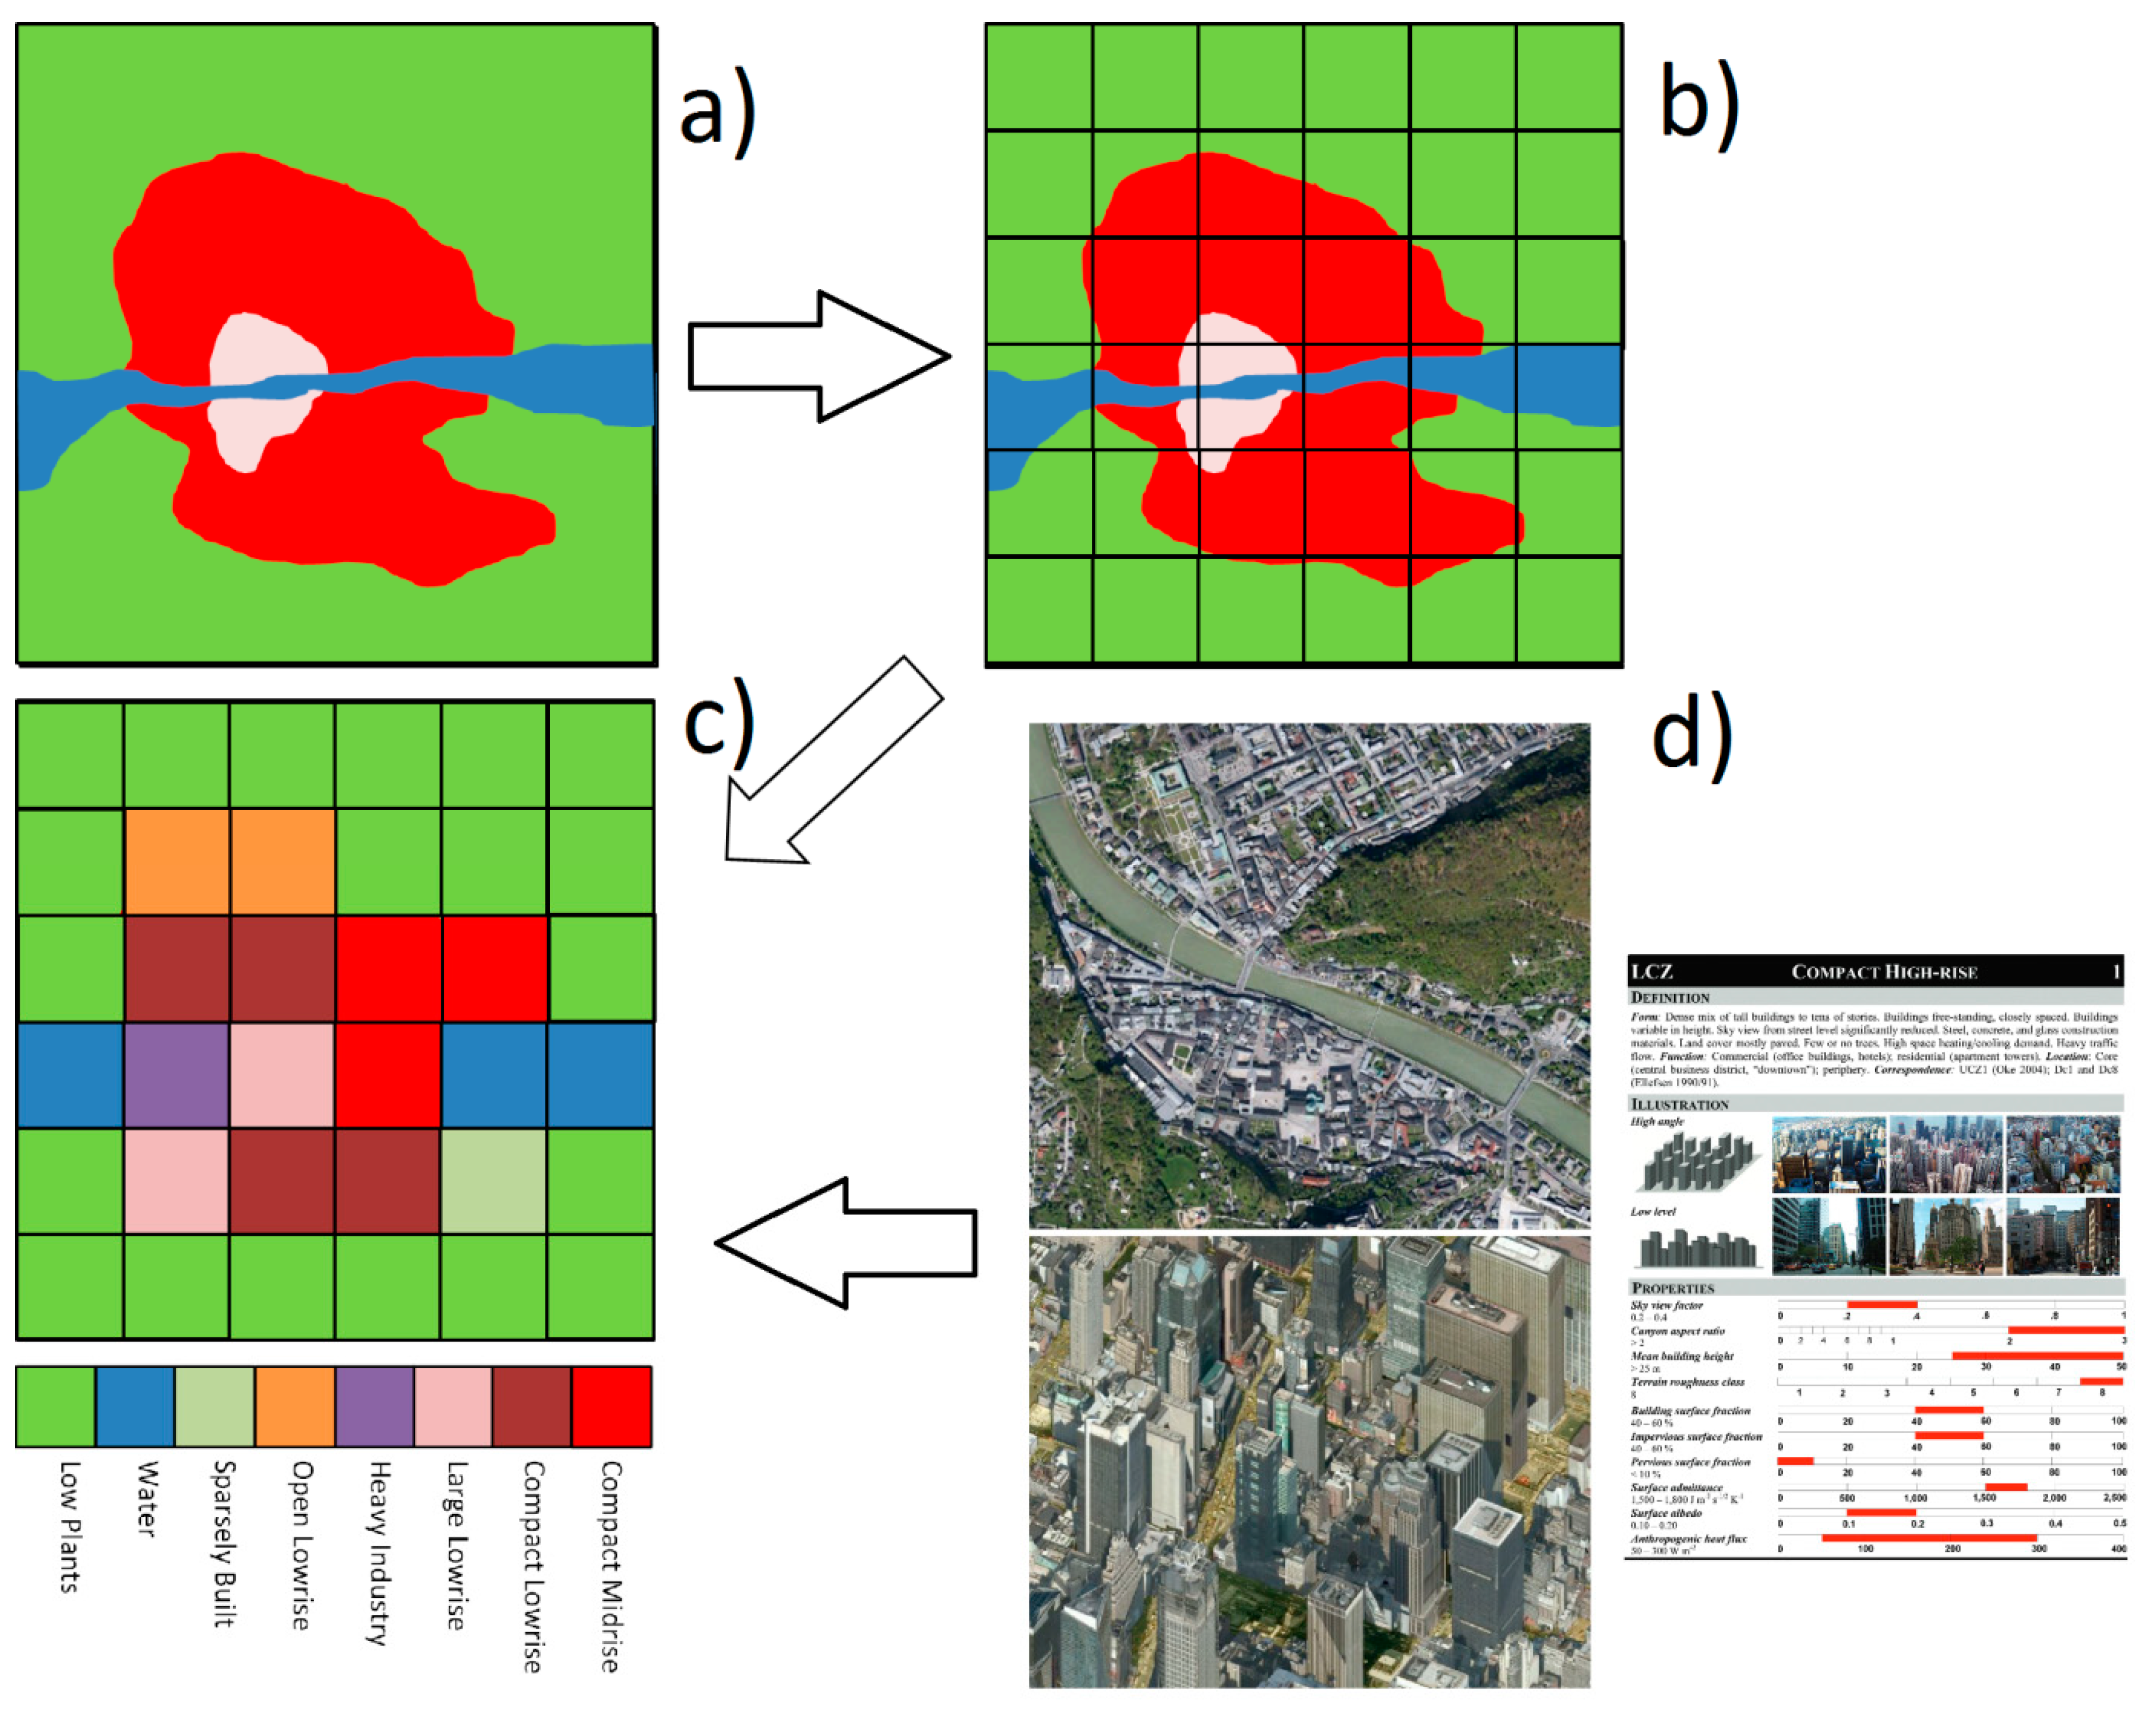
- The urban area can be decomposed into LCZ types using widely available data;
- (ii)
- The LCZ map is a useful first step for structuring a UHI study and;
- (iii)
- The LCZ type provides a physically-based context for explaining near-surface air temperature variations over space.
2. Methodology
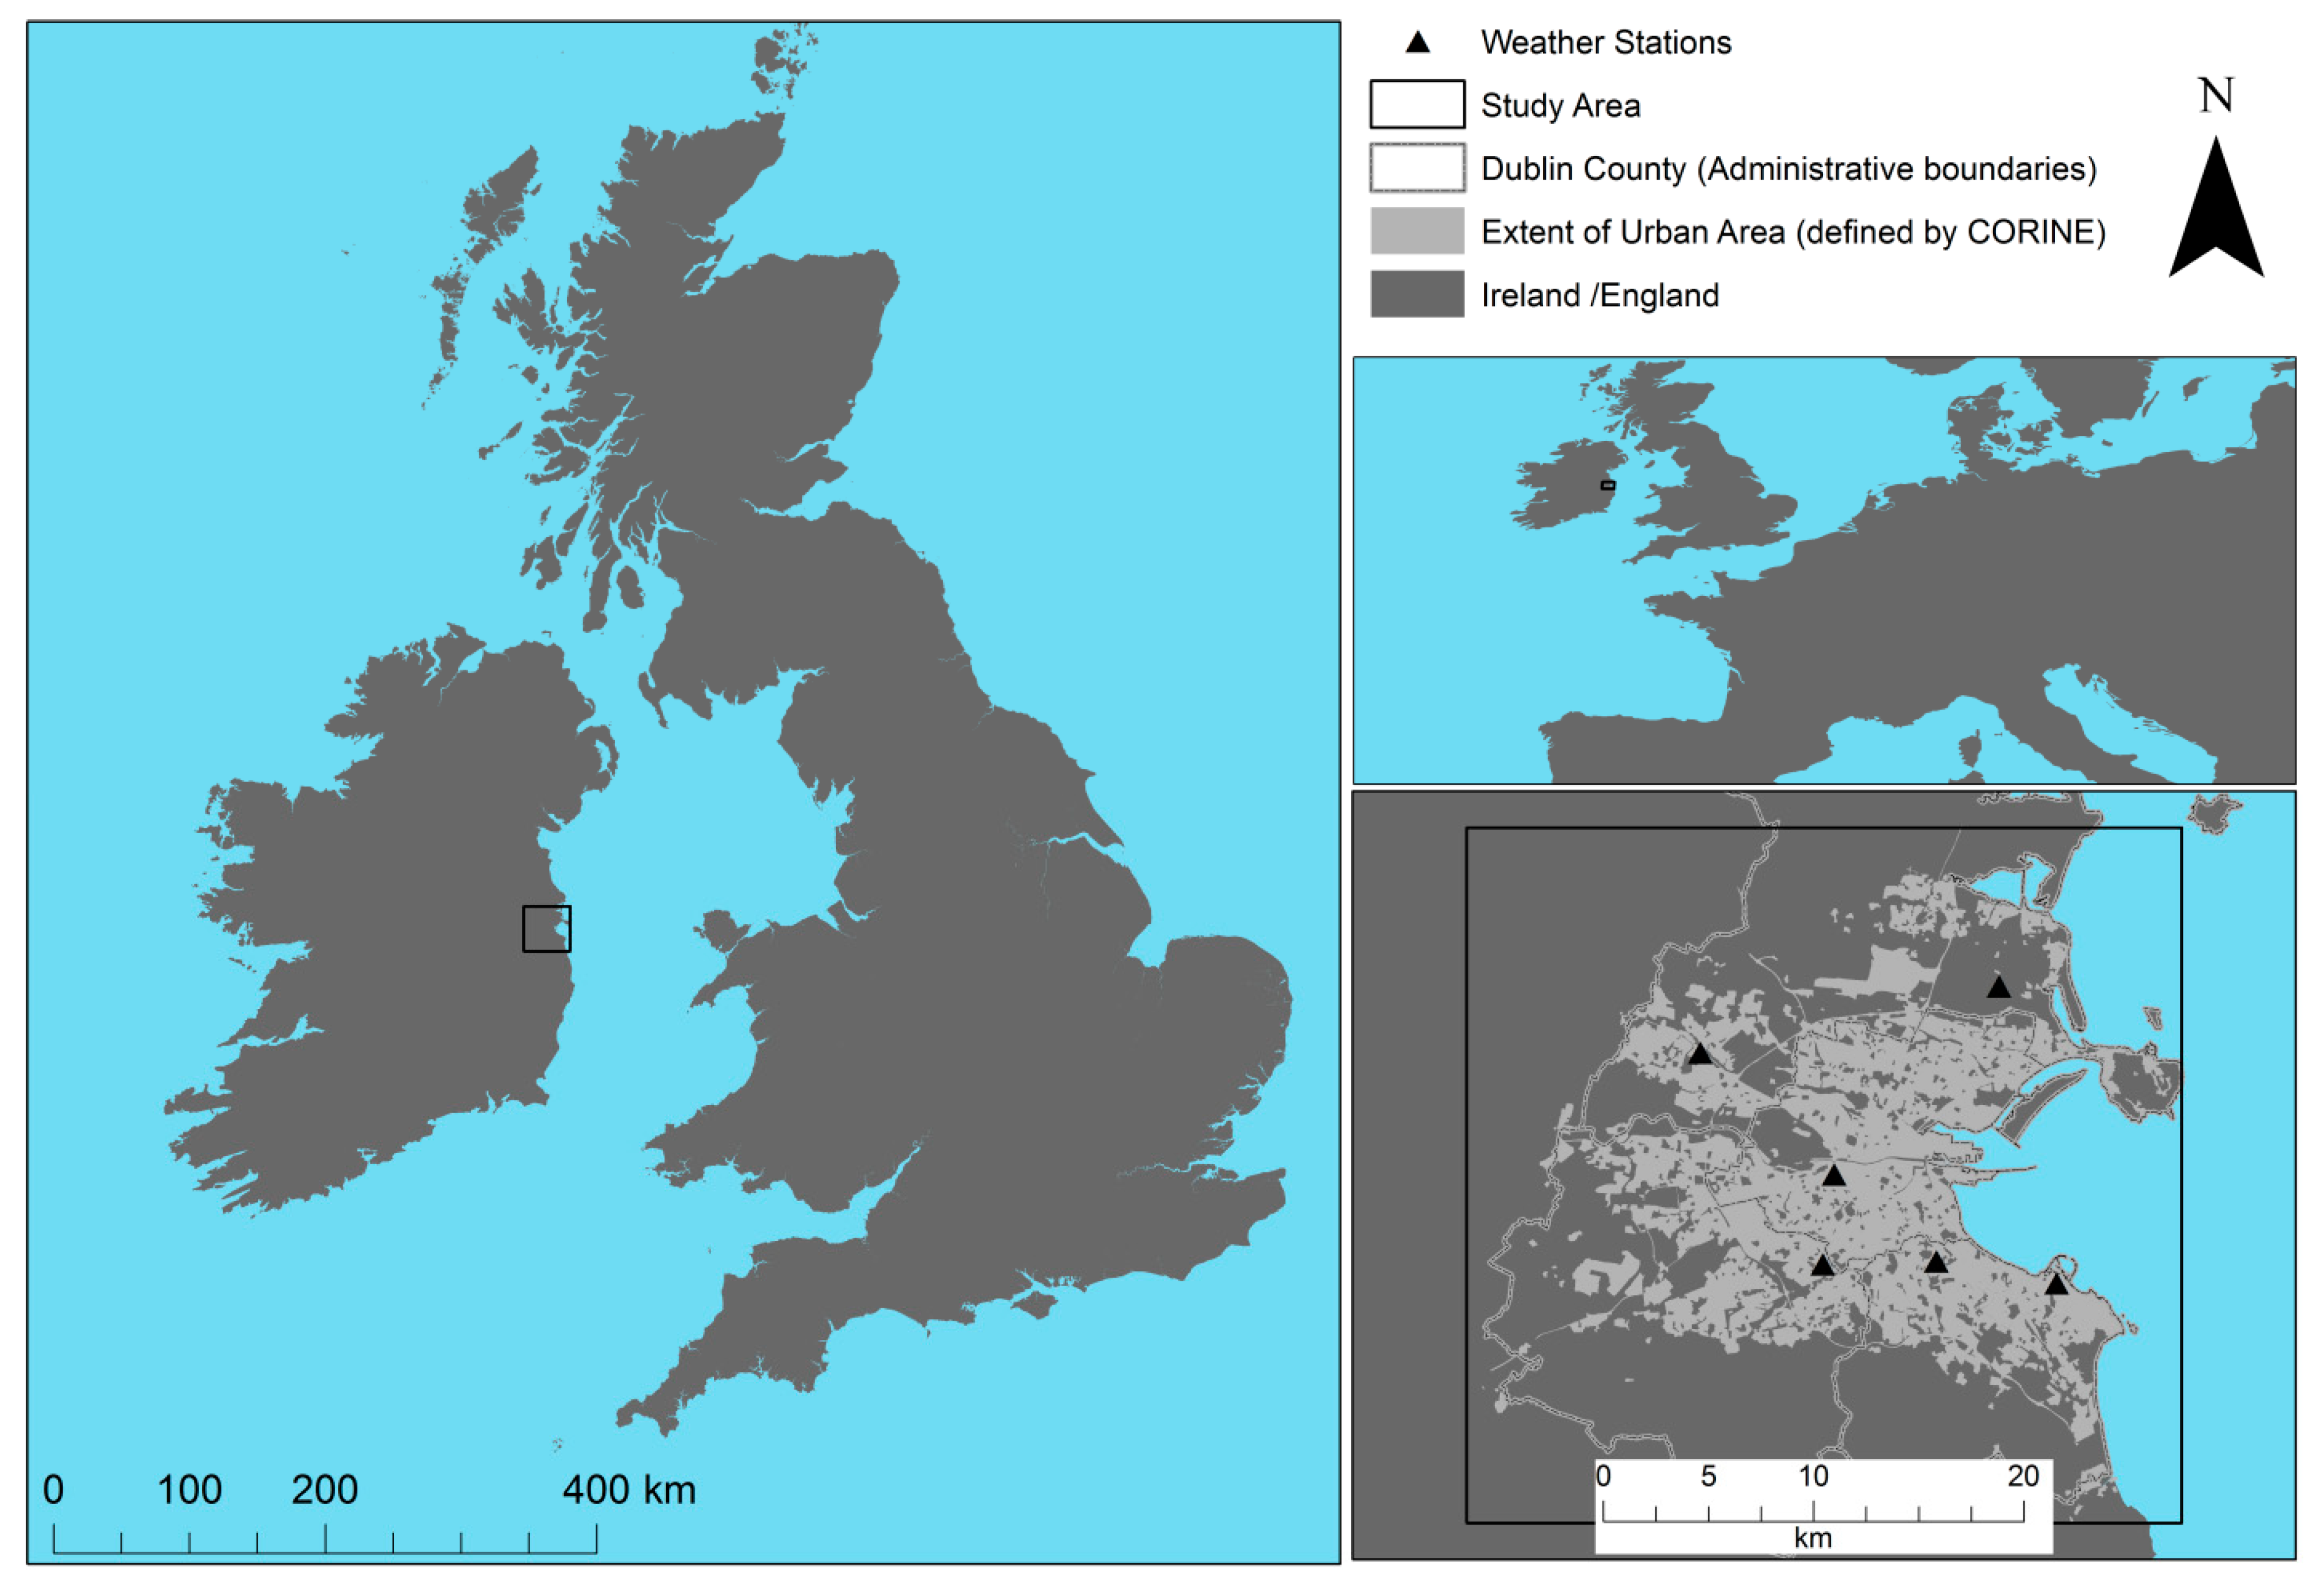
2.1. Study Area
2.2. Study Design
- (i)
- Mapped the study area into Local Climate Zone types (Section 2.3)
- (ii)
- Devised an observational campaign to explore Dublin’s UHI under ideal conditions using the LCZ map. This included:
- (a)
- Positioning six identical weather stations across the study area (Section 2.4/Table 2)
- (b)
- Planning traverse routes through specific LCZ types (Section 2.4)
- (iii)
- Analyzed air temperature observations in the context of LCZ type, that is, derive TLCZ (Section 2.5)
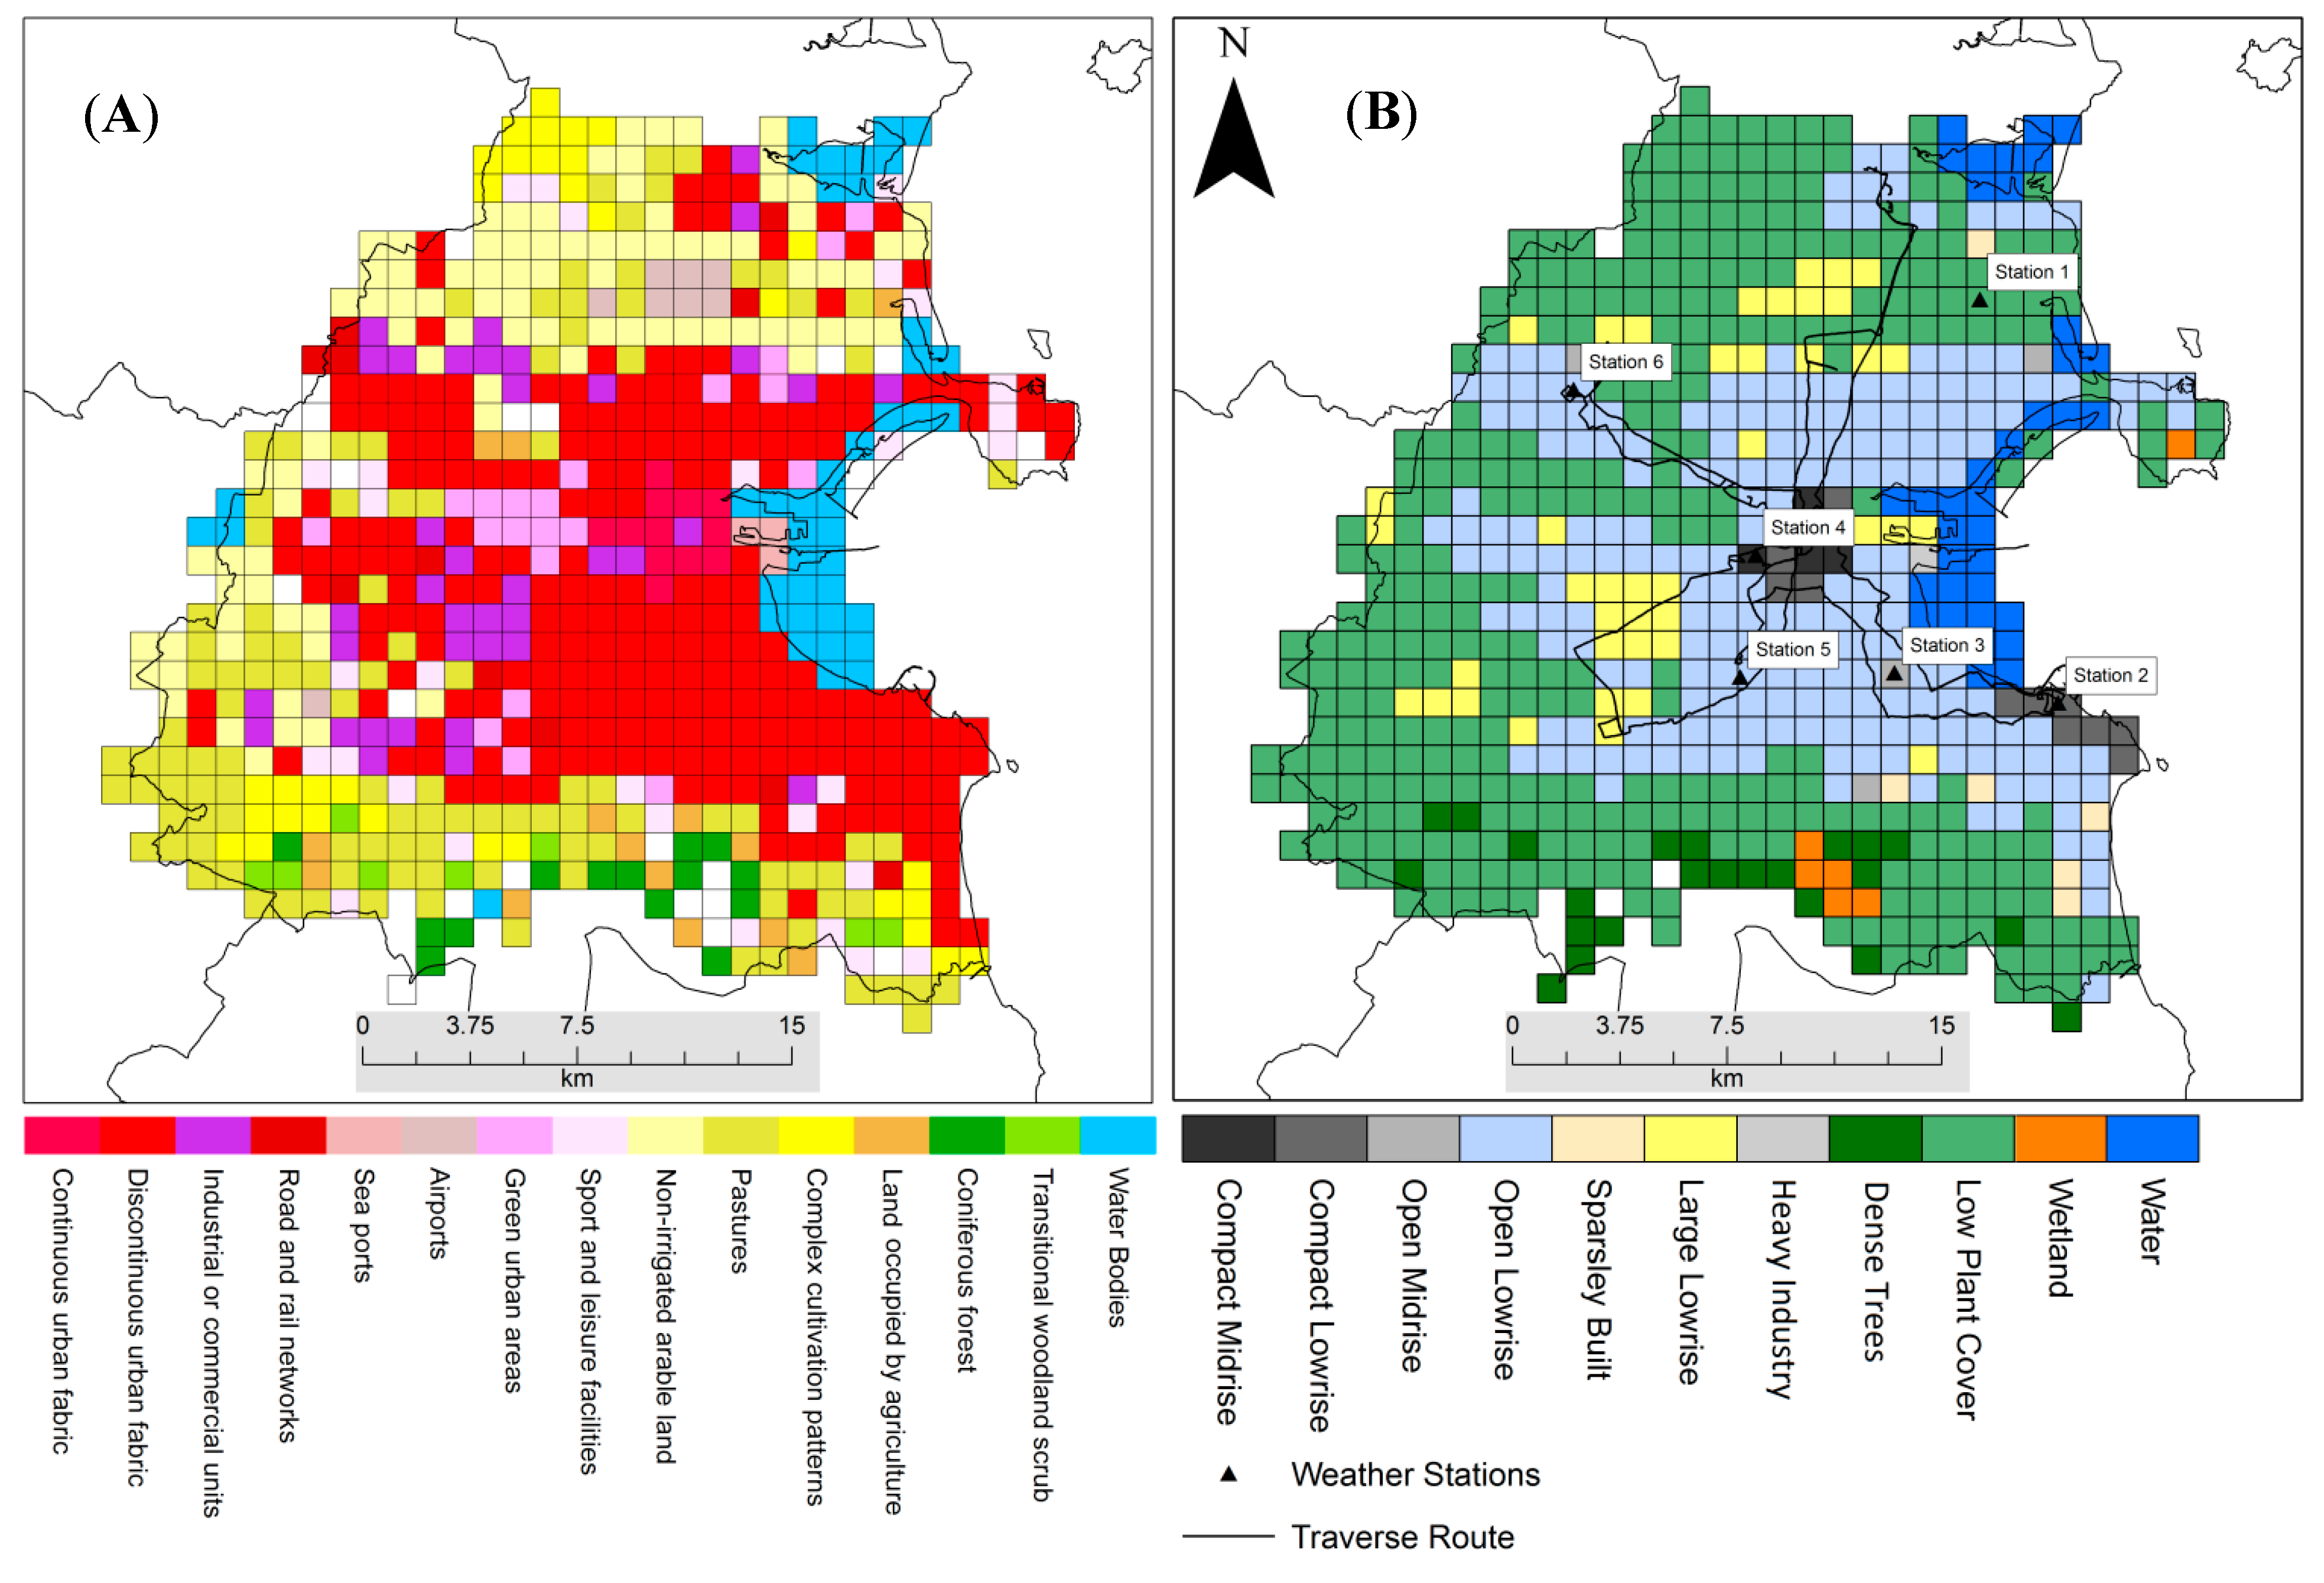
2.3. Mapping the Study Area
2.4. Observation Campaign
| LCZ | Station Description | Aerial View (Extent ~ 500 × 500 m) | |
|---|---|---|---|
Low Plants Located off grounds of laboratory run by national agriculture research institute | Station 1—North East | 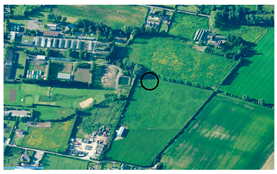 | |
| Station AG Height | 1.9 | ||
| Station ASL Height | 3.6 | ||
| Average Building Height | 6.5 | ||
| Surface below sensor | Grass | ||
| Dominant Surface around site | Grass/Roads | ||
Compact Lowrise Located on grounds of school Located on grounds of school | Station 2—South East |  | |
| Station AG Height | 3.7 | ||
| Station ASL Height | 47 | ||
| Average Building Height | 7.0 | ||
| Surface below sensor | Pavement | ||
| Dominant Surface around site | Pave/Buldings | ||
Open Midrise Located on grounds of university | Station 3—South Central |  | |
| Station AG Height | 3.7 | ||
| Station ASL Height | 22 | ||
| Average Building Height | 14.5 | ||
| Surface below sensor | Grass/Pavement | ||
| Dominant Surface around site | Grass/Pave/Build | ||
Compact Midrise Located in housing estate in inner city | Station 4—Central | 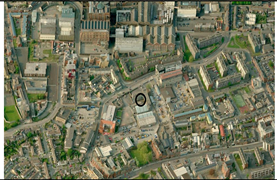 | |
| Station AG Height | 4.3 | ||
| Station ASL Height | 25 | ||
| Average Building Height | 15 | ||
| Surface below sensor | Pavement | ||
| Dominant Surface around site | Pave/Build | ||
Open Lowrise Located on grounds of school | Station 5—South West | 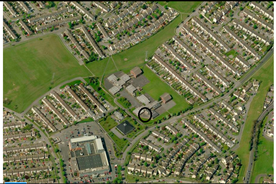 | |
| Station AG Height | 1.9 | ||
| Station ASL Height | 60 | ||
| Average Building Height | 4.5 | ||
| Surface below sensor | Grass/Pave | ||
| Dominant Surface around site | Grass/Pave/Build | ||
| Open Lowrise Located on grounds of school | Station 6—North West | 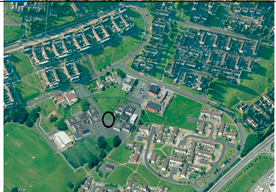 | |
| Station AG Height | 1.9 | ||
| Station ASL Height | 67 | ||
| Average Building Height | 5.4 | ||
| Surface below sensor | Grass/Pave | ||
| Dominant Surface around site | Grass/Pave/Build | ||

| Station | LCZ | 26-August | 27-August | 28-August | 29-August | 30-August | 31-August | 1-September |
|---|---|---|---|---|---|---|---|---|
| 1 | Low Plants | 0.4 (0) | 2.3 (0) | 4.2 (0) | 1.3 (0) | 0.2 (10) | 0.2 (4) | 0.4 (6) |
| 2 | Compact Low | 0.4 (0) | 0.8 (0) | 1.4 (0) | 0.6 (0) | 0.4 (2) | 0.3 (2) | 0.1 (0) |
| 3 | Open Midrise | 0.3 (0) | 2.5 (0) | 2.8 (0) | 1.1 (0) | 0.7 (0) | 0.4 (2) | 0.4 (4) |
| 4 | Compact Midrise | 0.4 (0) | 3.8 (0) | 1.4 (0) | 3.6 (0) | 0.8 (0) | 0.6 (4) | 0.9 (5) |
| 5 | Open Lowrise | 0.4 (0) | 2.1 (0) | 3.3 (0) | 0.9 (0) | 0.6 (0) | 0.6 (0) | 0.3 (0) |
| 6 | Open Lowrise | 0.5 (0) | 1.8 (0) | 2.7 (0) | 0.4 (0) | 0.9 (0) | 0.2 (5) | 0.5 (5) |
| Dublin Airport | 0.7 | 2.4 | 3.4 | 1.1 | 0.5 | 0.8 | 0.8 | |
| Cloud cover | 20% | 80% | 100% | 20% | <10% | <10% | 15% |
2.5. Analysis
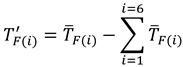
 ) was calculated as the difference between the station mean and the group mean,
3. Results
3.1. Unfavorable UHI Conditions (26–29 August)
 < 1.0 °C) were present in compact urban LCZ (stations 2 and 4); however, the direction of this signal remained positive throughout the period (see Figure 4). In relation to stations 5 and 6, which can be described as the suburban stations (LCZ 6), generally both exhibited a negative (0.2–1.0 °C) signal relative to the group mean.
3.2. Favorable UHI Conditions (30 August–1 September)
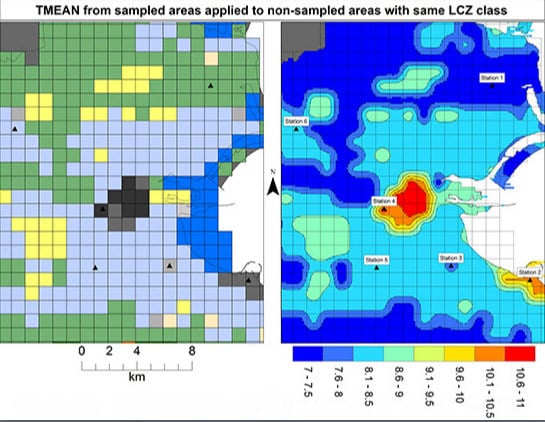
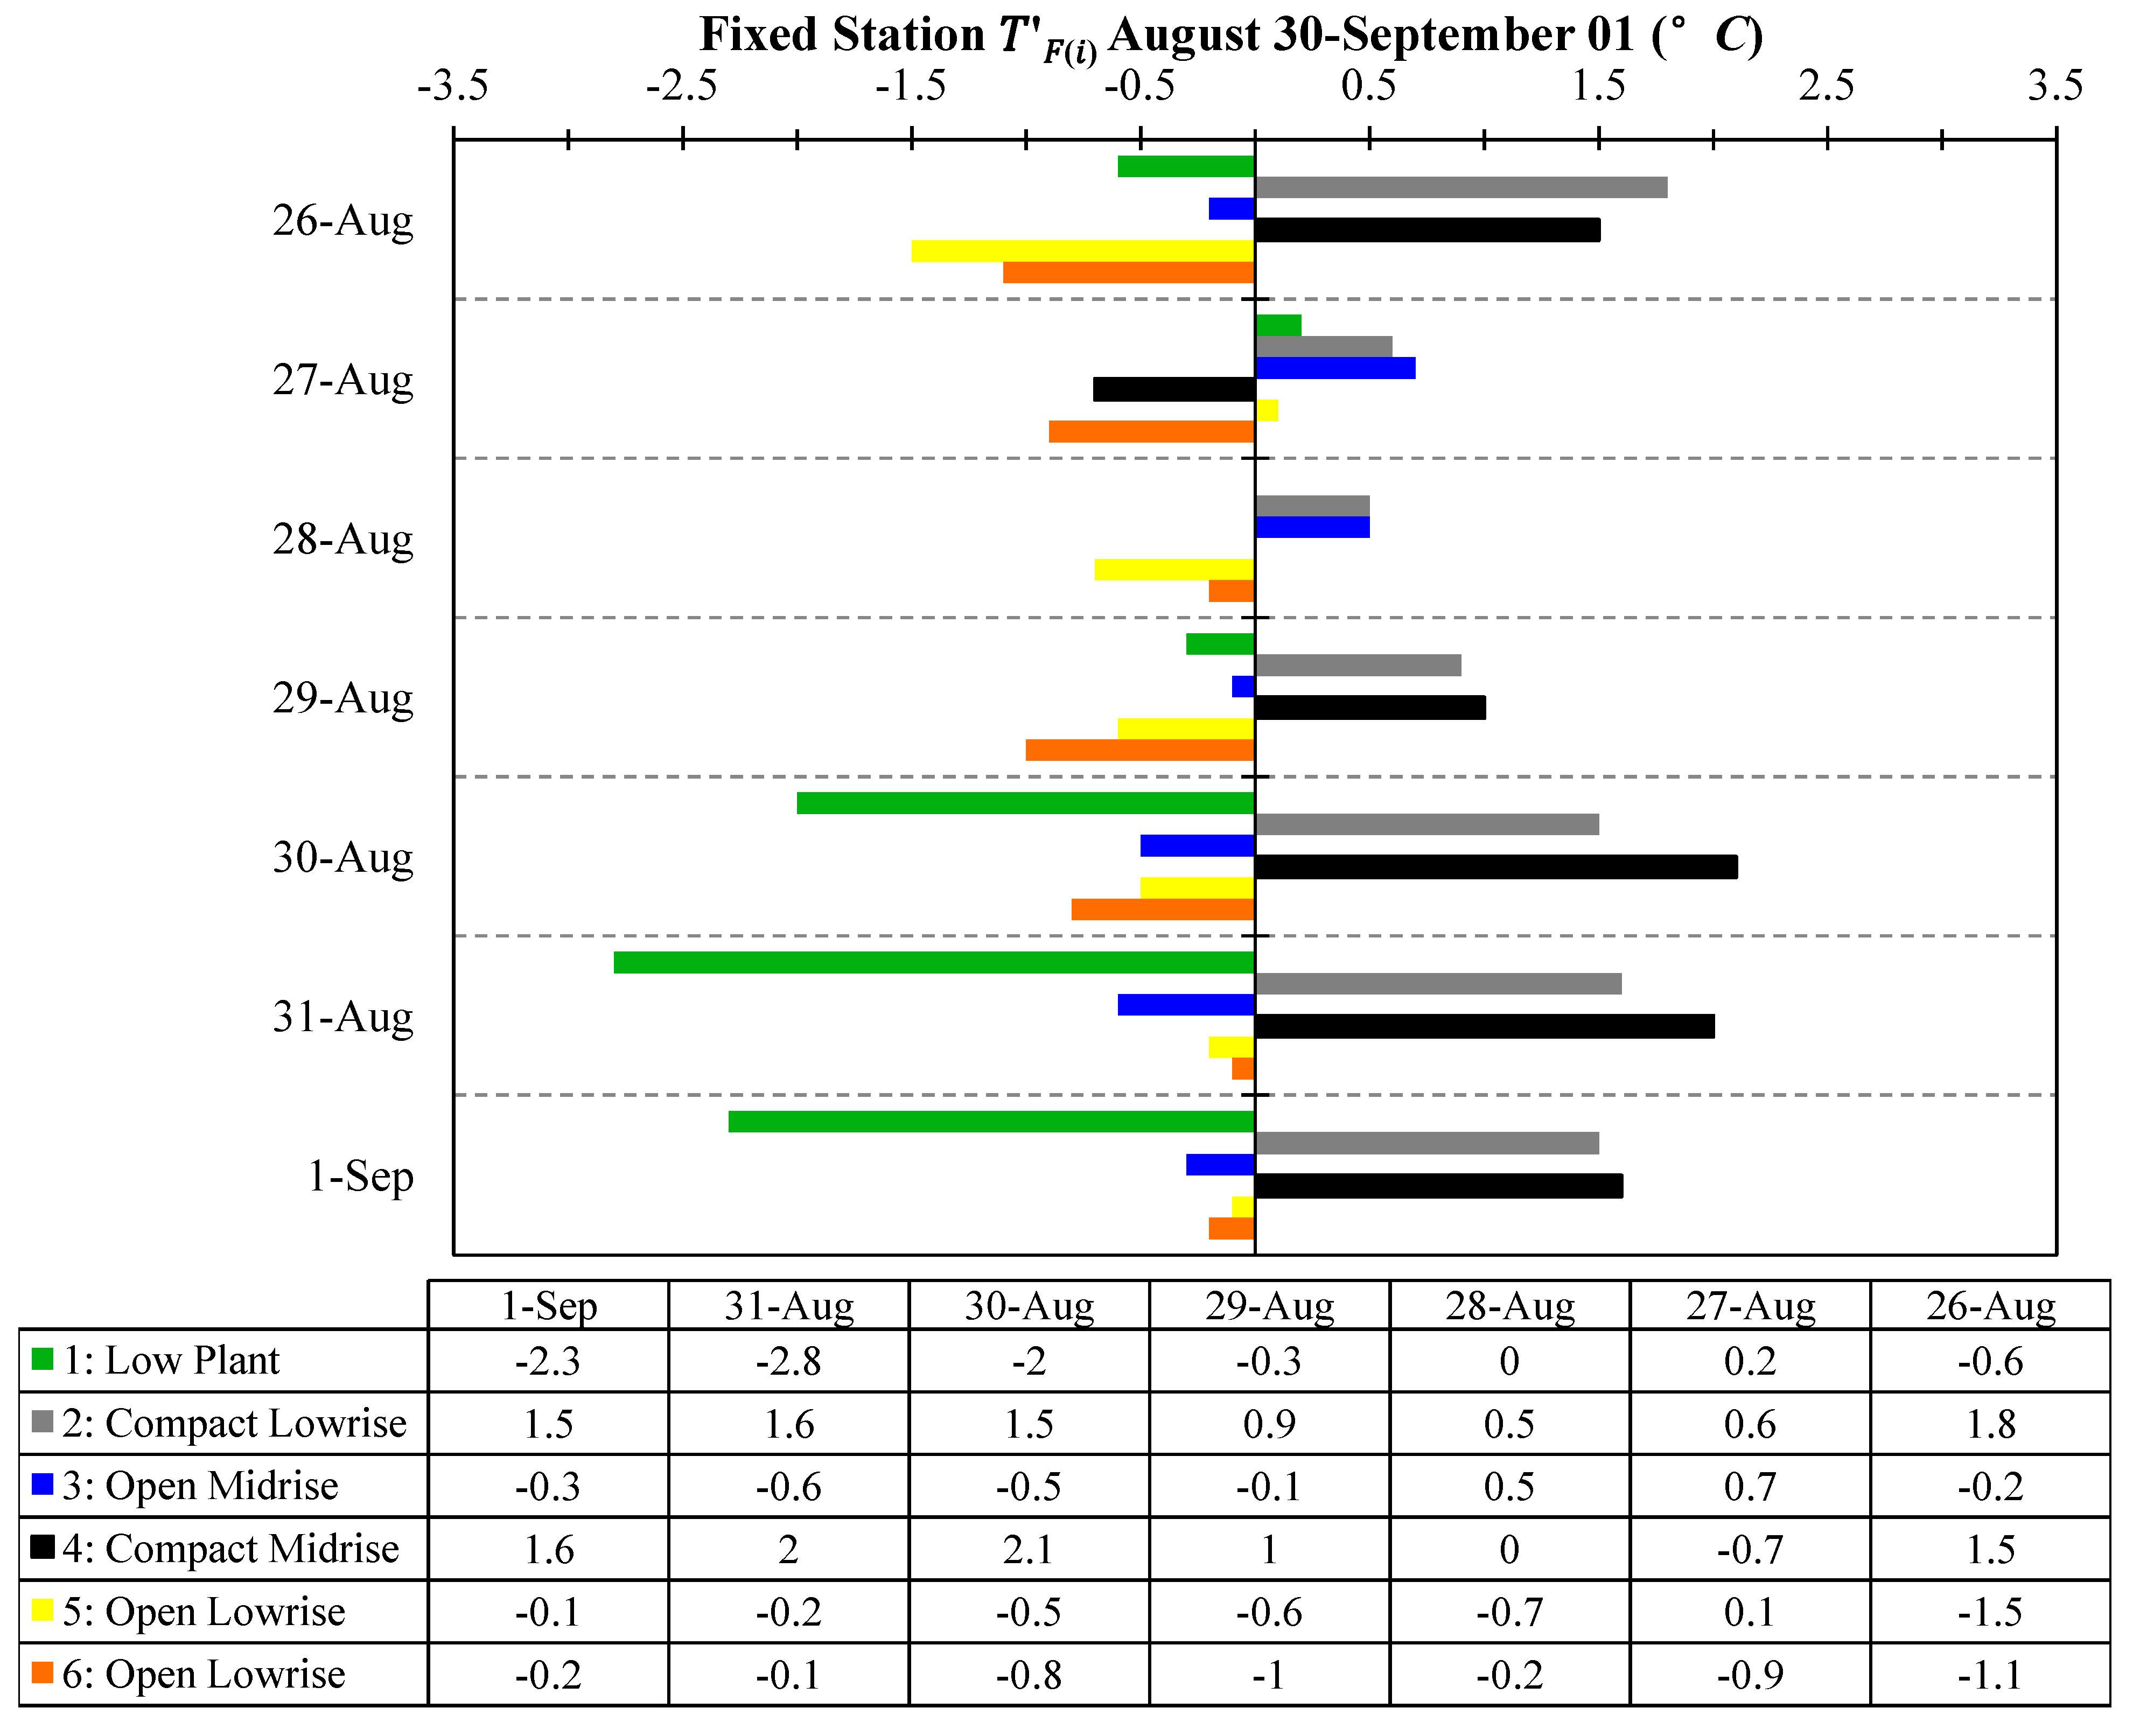
. The largest TLCZ (4.8 °C) difference occurred between station 1 (LCZ D Low Plants) and station 4 (LCZ 2 Compact Midrise) on August 31. Throughout the latter part of the period, these two stations exhibited the largest difference as would be expected a priori. In terms of the traverse data, a difference of ~4.3 °C between the compact LCZ and non-urban LCZ between 01:00 and 02:00 h was recorded across all three nights (based on ~6000 sampled points) though the largest difference recorded was on 29 August rather than 31 August as was the case with the fixed stations. Nevertheless, the consistency of the signal suggests the effect of building density and artificial surface coverage on air temperatures was efficiently captured by the routes chosen. Differences between the periphery (beyond the suburban fringe) and urban core are expected to have been higher—though these areas were not explicitly sampled due to the range that could be covered in 60 min travelling time.) for the six fixed stations for night of 26/27 August to night of 1/2 September. Each station (1–6) is represented by a bar below and identified by the LCZ in which they are placed. Note the latter part of the week (30 August–1 September) show the largest TLCZ, i.e., the range covering the min to max.
) for the six fixed stations for night of 26/27 August to night of 1/2 September. Each station (1–6) is represented by a bar below and identified by the LCZ in which they are placed. Note the latter part of the week (30 August–1 September) show the largest TLCZ, i.e., the range covering the min to max.
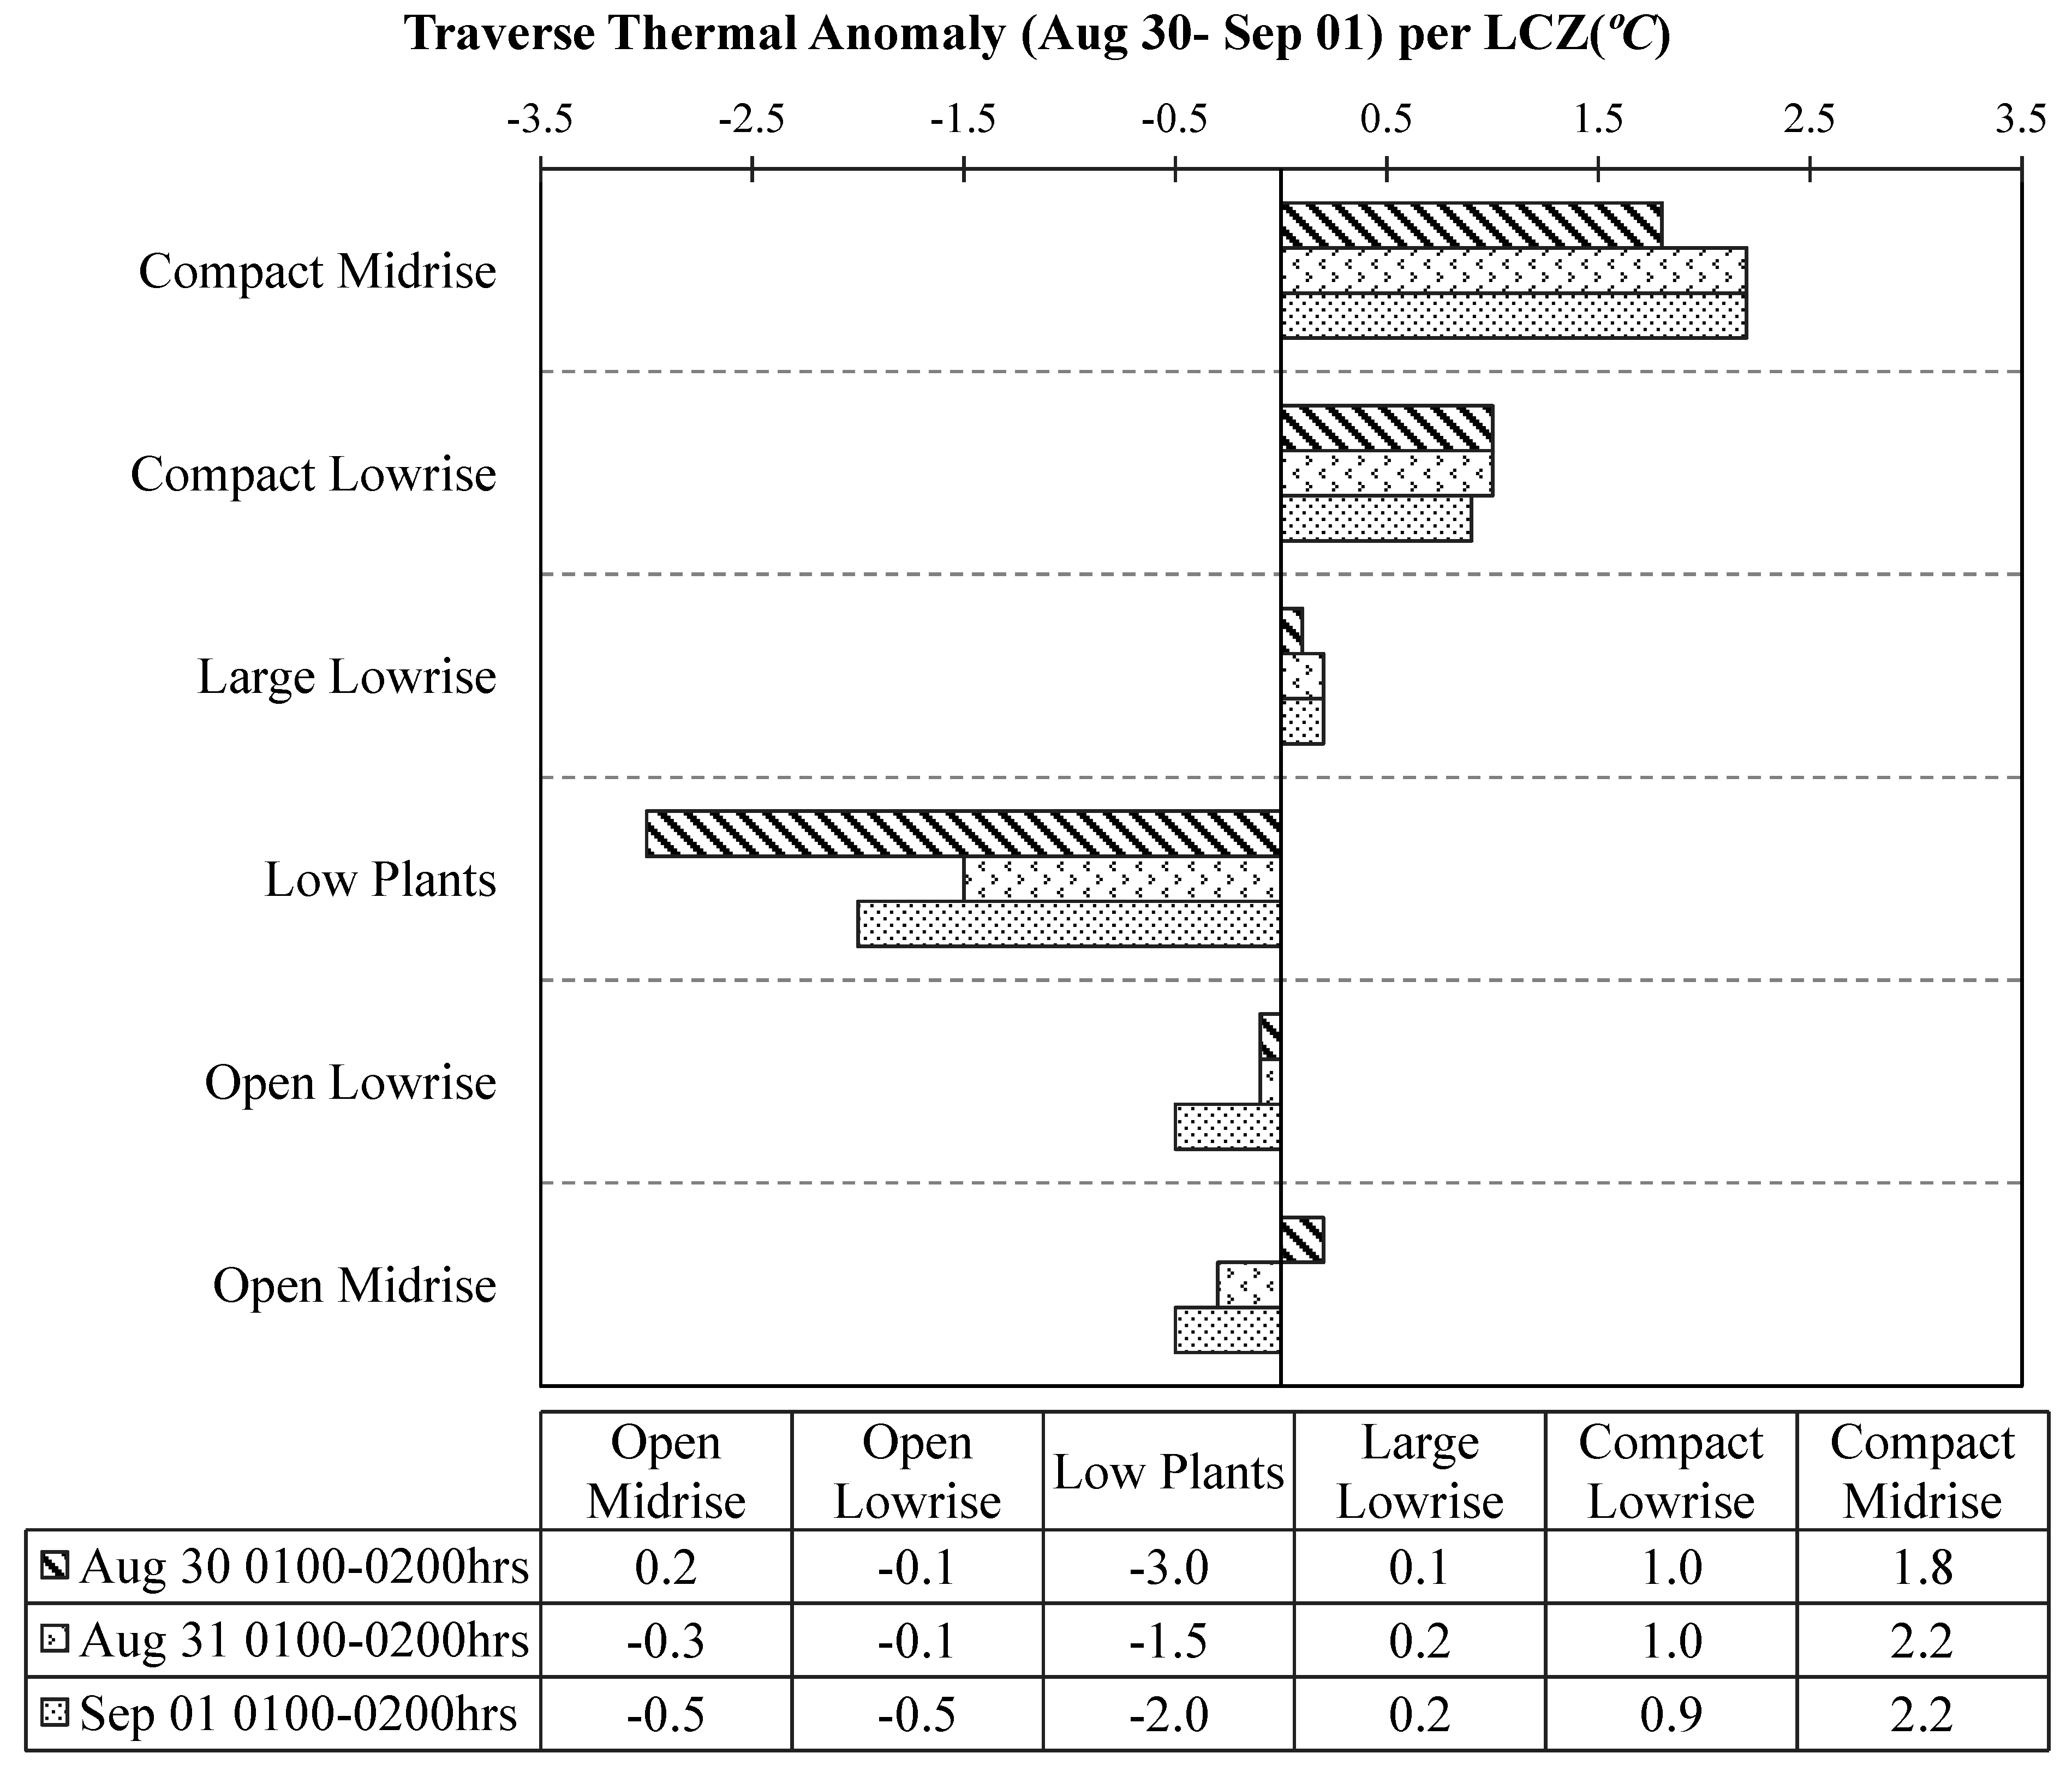 values for the period 21:00–06:00 h; note that the stations located within LCZ with the highest impervious/built coverage (stations 2 and 4) consistently exhibit positive thermal anomalies each night throughout the week of observation compared to stations with higher pervious (vegetated) coverage. Moreover, towards the latter part of the week, again when settled conditions began to dominate, the relationship between station 1, 2 and 4 which represent low and high levels of urban development respectively becomes apparent. The effect of extensive vegetation can be seen in the open lowrise and low plant LCZ stations. Similar results are seen in the traverse data (Figure 5) which examined nocturnal temperatures in the latter part of the week in more detail. These values are derived from LCZ at different geographic locations across the domain rather than the fixed stations which each observe one location. They compare favorably with the fixed station results in terms of the direction of the thermal signal. A consistent trend over the three nights of above average temperatures were recorded in the most urbanized LCZ classes in Dublin, whereas the non-urban and less-urban LCZ exhibited below average temperatures across the domain. Again, the magnitudes between the fixed station and traverses appear to show slight disparity. For the traverses, 30 August exhibited the strongest TLCZ difference which occurred between Compact Midrise (inner-city locations) and Low Plant LCZ (non-urban areas) though this relationship was consistent on all three nights. The ranking of the LCZ (in terms of + or − thermal signals) sampled by the traverses appears to follow a logical pattern whereby areas containing a larger coverage of artificial materials exhibited positive thermal signals similar to modeling results obtained during the development of the LCZ system [38].
| LCZ | Number of Areas Sampled (km2) | TMEAN | TMIN | TMAX |
|---|---|---|---|---|
| Compact Midrise | 7 | 10.6 | 8.1 | 12.9 |
| Compact Lowrise | 6 | 9.9 | 8.4 | 12.5 |
| Open Midrise | 1 | 7.7 | 6.9 | 8.1 |
| Open Lowrise | 70 | 8.2 | 6.0 | 11.0 |
| Large Lowrise | 12 | 8.9 | 6.2 | 10.4 |
| Low Plants | 17 | 6.9 | 6.0 | 8.5 |
4. Discussion
4.1. Inter-LCZ Relationships
| Dublin | Analogous Result from Other Cities | ||||||
|---|---|---|---|---|---|---|---|
| Intra-urban | Fixed | Mobile | Berlin 1 | Nancy 2 | Nagano 3 | Vancouver 4 | Uppsala 5 |
| LCZ2-LCZ3 | 0.5 | 1.1 | --- | --- | 1.7 | --- | --- |
| LCZ2-LCZ6 | 2.2 | 2.3 | --- | 1.8 | 2 | * 2.3 | ** 1.5 |
| Inter-Urban | |||||||
| LCZ2-LCZD | 4.2 | 4.2 | --- | 4.4 | 3.2 | * 6.3 | 3.3 |
| LCZ3-LCZD | 3.9 | 3.1 | ** 1.5 | --- | 1.5 | --- | --- |
| LCZ6-LCZD | 2 | 1.9 | 0.8 | 2.4 | 1.2 | 4 | ** 1.8 |
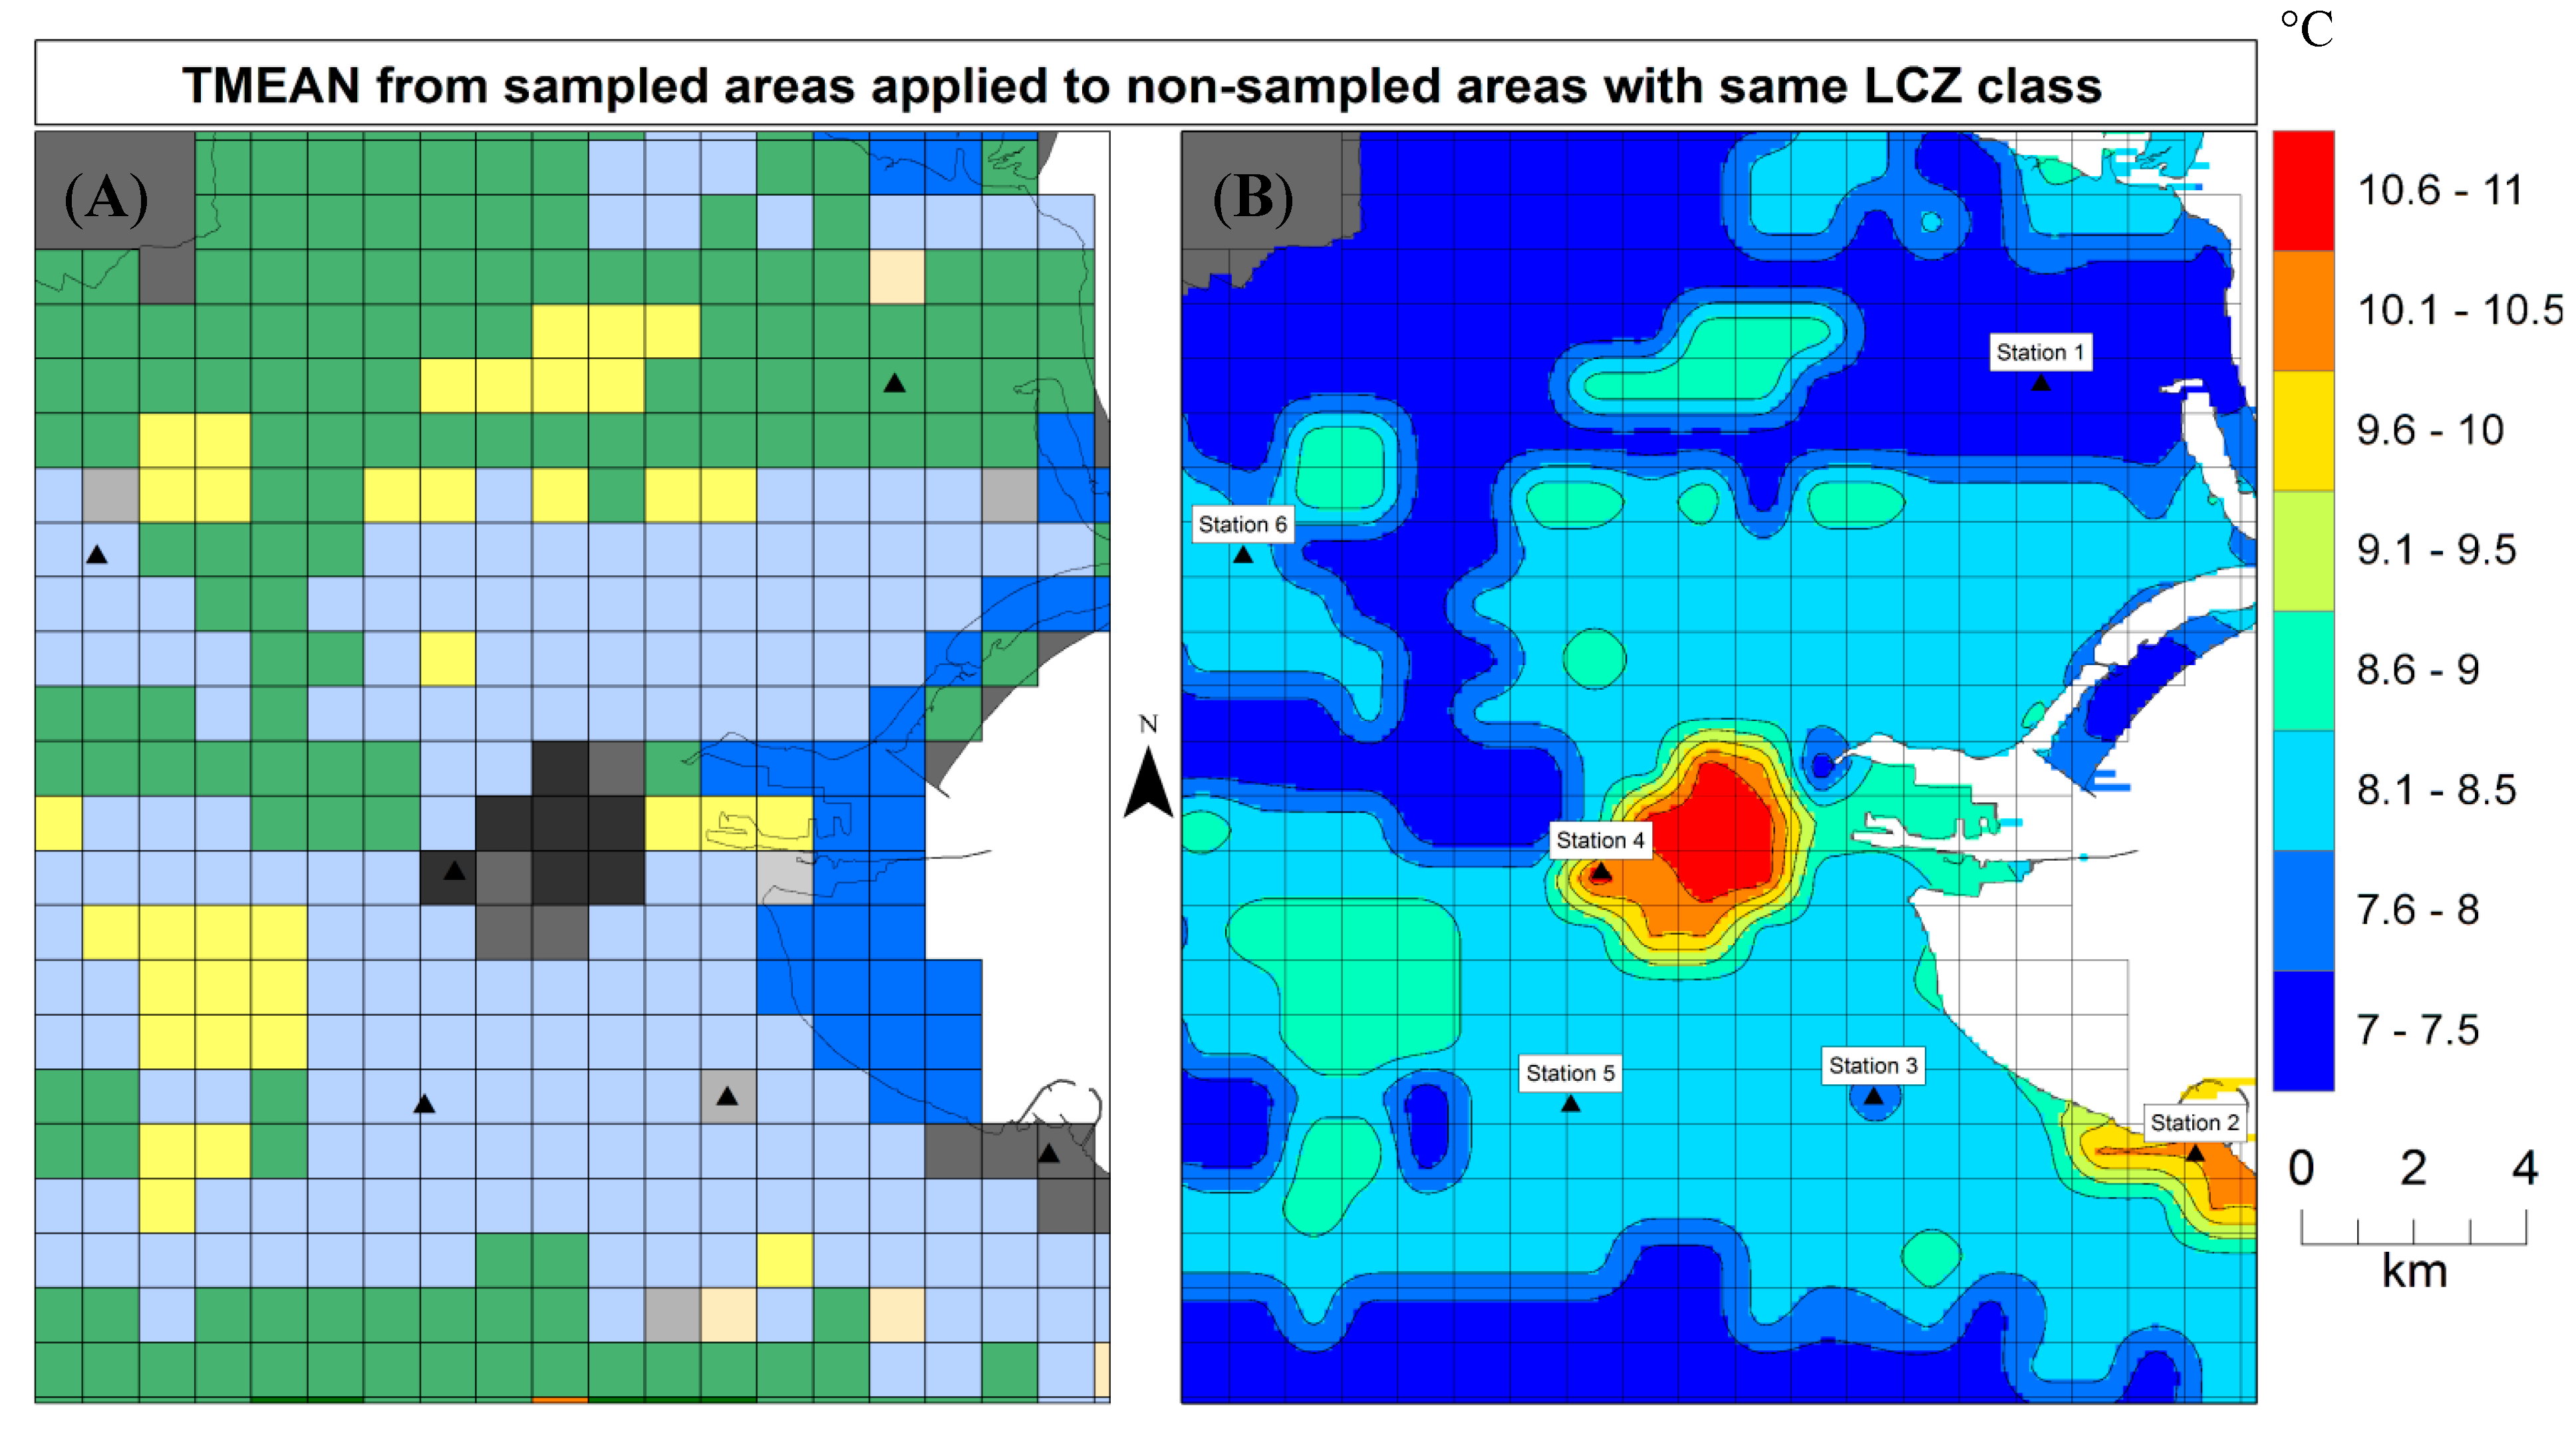
4.2. Mapping Dublin’s Canopy-Layer UHI
4.3. Mitigating Factors
5. Conclusions
Acknowledgments
Author Contributions
Conflicts of Interest
References
- Oke, T.R. The distinction between canopy and boundary-layer urban heat islands. Atmosphere 1976, 14, 269–277. [Google Scholar]
- Mills, G. Luke Howard and the climate of London. Weather 2008, 63, 153–157. [Google Scholar]
- Jauregui, E. Heat Island Development in Mexico City. Atmos. Environ. 1997, 31, 3821–3831. [Google Scholar]
- Magee, N.; Curtis, J.; Wendler, G. The urban heat island effect at Fairbanks, Alaska. Theor. Appl. Climatol. 1999, 64, 39–47. [Google Scholar]
- Hicks, B.; Callahan, W.; Hoekzema, M. On the heat islands of Washington, DC, and New York city, NY. Bound. Layer Meteorol. 2010, 135, 291–300. [Google Scholar]
- Kim, Y.; Baik, J. Maximum urban heat island intensity in Seoul. J. Appl. Meteorol. 2002, 41, 651–659. [Google Scholar]
- Fortuniak, K.; Klysik, K.; Wibig, J. Urban–rural contrasts of meteorological parameters in Lodz. Theor. Appl. Climatol. 2006, 84, 91–101. [Google Scholar]
- Kolokotroni, M.; Giridharan, R. Urban heat island intensity in London: An investigation of the impact of physical characteristics on changes in outdoor air temperature during summer. Sol. Energy 2008, 82, 986–998. [Google Scholar]
- Oke, T.R. The energetic basis of the urban heat island. Q. J. R. Meteorol. Soc. 1982, 455, 1–24. [Google Scholar]
- Oke, T.R. Towards better scientific communications in urban climate. Theor. Appl. Climatol. 2006, 84, 179–190. [Google Scholar]
- Nunez, M.; Oke, T.R. The energy balance of an urban canyon. J. Appl. Meteorol. 1977, 16, 11–19. [Google Scholar]
- Kondo, A.; Ueno, M.; Kaga, A.; Yamaguchi, K. The influence of urban canopy configuration on urban albedo. Bound. Layer Meteorol. 2001, 100, 225–242. [Google Scholar]
- Grimmond, C.S.B.; Oke, T.R. Comparison of heat fluxes from summertime observations in the suburbs of four North American cities. J. Appl. Meteorol. 1995, 34, 873–889. [Google Scholar]
- Ichinose, T.; Shimodozono, K.; Hanaki, K. Impact of anthropogenic heat on urban climate in Tokyo. Atmos. Environ. 1999, 33, 3897–3909. [Google Scholar]
- Offerle, B.; Grimmond, C.S.B.; Fortuniak, K. The energy balance of a central European city centre. Int. J. Climatol. 2005, 25, 1405–1419. [Google Scholar]
- Grimmond, C.S.B.; Oke, T.R. Turbulent heat fluxes in urban areas: Observations and a Local-Scale Urban Meteorological Parameterization Scheme (LUMPS). J. Appl. Meteorol. 2002, 41, 792–810. [Google Scholar]
- Grimmond, C.S.B.; Oke, T.R. Heat storage in urban areas: Local-scale observations and evaluation of a simple model. J. Appl. Meteorol. 1999, 38, 922–940. [Google Scholar]
- Sailor, D.J. Anthropogenic heat and moisture emissions in the urban environment. In Proceedings of the Seventh International Conference on Urban Climate, Yokohama, Japan, 29 June–3 July 2009.
- Stewart, I.D.; Oke, T.R. Local climate zones for urban temperature studies. Bull. Am. Meteorol. Soc. 2012, 93, 1879–1900. [Google Scholar]
- Stewart, I.D.; Oke, T.R. Overview of the local climate zone classification system: Origins, development, and application to urban heat islands. In Proceedings of the Association of American Geographers Annual Meeting, Seattle, WA, USA, 12–16 April 2011.
- Kovács, A.; Németh, Á. Tendencies and differences in human thermal comfort in distinct urban areas in Budapest, Hungary. Acta Climatol. Chorol. 2012, 46, 115–124. [Google Scholar]
- Puliafito, S.; Bochaca, F.; Allende, D.; Fernandez, R. Green areas and microscale thermal comfort in arid environments: A case study in Mendoza, Argentina. Atmos. Clim. Sci. 2013, 3, 372–384. [Google Scholar]
- Stewart, I.D. A systematic review and scientific critique of methodology in modern urban heat island literature. Int. J. Climatol. 2011, 31, 200–217. [Google Scholar]
- Walsh, S. A Summary of Climate Averages for Ireland 1981–2010. Available online: http://www.met.ie/climate-ireland/30year-averages.asp (accessed on 24 September 2014).
- Central Statistics Office (CSO). Ireland (2012) Census of Ireland 2011. Available online: http://www.cso.ie/en/census/ (accessed on 18 April 2013).
- Sweeney, J. The urban heat island of Dublin city. J. Ir. Geogr. 1987, 20, 1–10. [Google Scholar]
- Graham, E. The urban heat island of Dublin city during the summer months. J. Ir. Geogr. 1993, 26, 43–57. [Google Scholar]
- Unger, J.; Lelovics, E.; Gál, T. Local climate zone mapping using GIS methods in Szeged. Hung. Geogr. Bull. 2014, 63, 29–41. [Google Scholar]
- Bechtel, B. Multitemporal Landsat data for urban heat island assessment and classification of local climate zones. In Proceedings of the 2011 Joint Urban Remote Sensing Event (JURSE), Munich, Germany, 11–13 April 2011; pp. 129–132.
- Bechtel, B.; Daneke, C. Classification of local climate zones based on multiple earth observation data. IEEE J. Sel. Top. Appl. Earth Obs. Remote Sens. 2012, 5, 1191–1202. [Google Scholar]
- EEA. CLC2006 Technical Guidelines. Available online: http://www.eea.europa.eu/publications/COR0-landcover (accessed on 24 September 2014).
- Arnfield, J. Two Decades of Urban Climate Research: A review of turbulence, exchanges of energy and water, and the urban heat island. Int. J. Climatol. 2003, 23, 1–26. [Google Scholar]
- Oke, T.R. Urban Observation. Chapter 11 in Guide to Meteorological Instruments and Methods of Observation, 7th ed.; No. 8; WMO: Geneva, Switzerland, 2008. [Google Scholar]
- Chandler, T.J. City growth and urban climates. Weather 1964, 19, 170–171. [Google Scholar]
- Runnalls, K.E.; Oke, T.R. A technique to detect microclimatic inhomogeneities in historical records of screen-level air temperature. J. Clim. 2006, 19, 959–978. [Google Scholar]
- Hart, M.; Sailor, D.J. Assessing causes in spatial variability in urban heat island magnitude. In Proceedings of the Seventh Symposium on the Urban Environment, San Diego, CA, USA, 10–13 September 2007.
- Tso, C.P. A survey of urban heat island studies in two tropical cities. Atmos. Environ. 1996, 30, 507–519. [Google Scholar]
- Stewart, I.D.; Oke, T.R.; Krayenhoff, E.S. Evaluation of the “local climate zone” scheme using temperature observations and model simulations. Int. J. Climatol. 2014, 34, 1062–1080. [Google Scholar]
- Morris, C.J.G.; Simmonds, I.; Plummer, N. Quantification of the influences of wind and cloud on the nocturnal urban heat island of a large city. J. Appl. Meteorol. 2001, 40, 169–182. [Google Scholar]
- Fenner, D.; Meier, F.; Scherer, D.; Polze, A. Spatial and temporal air temperature variability in Berlin, Germany, during the years 2001–2010. Urban Clim. 2014. [Google Scholar] [CrossRef]
- Leconte, F.; Bouyer, J.; Claverie, R.; Pétrissans, M. Using local climate zone scheme for UHI assessment: Evaluation of the method using mobile measurements. Build. Environ. 2014. [Google Scholar] [CrossRef]
- Ching, J. A perspective on urban canopy layer modeling for weather, climate and air quality applications. J. Urban Clim. 2013, 3, 13–39. [Google Scholar]
- Oke, T.R.; Hannell, F.G. The Form of the Urban Heat Island in Hamiliton, Canada; Technical Note; World Meteorological Organisation: Geneva, Switzerland, 1970; Volume 108, pp. 113–126. [Google Scholar]
© 2014 by the authors; licensee MDPI, Basel, Switzerland. This article is an open access article distributed under the terms and conditions of the Creative Commons Attribution license (http://creativecommons.org/licenses/by/4.0/).
Share and Cite
Alexander, P.J.; Mills, G. Local Climate Classification and Dublin’s Urban Heat Island. Atmosphere 2014, 5, 755-774. https://doi.org/10.3390/atmos5040755
Alexander PJ, Mills G. Local Climate Classification and Dublin’s Urban Heat Island. Atmosphere. 2014; 5(4):755-774. https://doi.org/10.3390/atmos5040755
Chicago/Turabian StyleAlexander, Paul J., and Gerald Mills. 2014. "Local Climate Classification and Dublin’s Urban Heat Island" Atmosphere 5, no. 4: 755-774. https://doi.org/10.3390/atmos5040755
APA StyleAlexander, P. J., & Mills, G. (2014). Local Climate Classification and Dublin’s Urban Heat Island. Atmosphere, 5(4), 755-774. https://doi.org/10.3390/atmos5040755