1. Introduction
CO
2 is a greenhouse gas with a long life span (hundreds of years) that absorbs infrared radiation in the 12 µm to 17 µm waveband and contributes ~60% global of the greenhouse gas warming potential in the atmosphere [
1,
2,
3]. Since the industrial revolution, the mole fraction of CO
2 has been rising and has accelerated in recent years, reaching 400 µmol∙mol
−1 at Mauna Loa Observatory, Hawaii, in March 2014, up from 275 µmol∙mol
−1 prior to the industrial revolution [
4,
5,
6,
7]. The continuous increase in the mole fraction of all greenhouse gases has elevated atmospheric radiative forcing (climate warming potential) by 34% from 1990 to 2013 [
8,
9,
10,
11,
12].
This increase is mainly caused by human activities and has attracted the attention of governments and the scientific community around the world [
13,
14]. Far away from major combustion sources that are the main drivers of increasing global atmospheric CO
2 mole fraction, Antarctica is an ideal area for observing the background levels of greenhouse gases in the global atmosphere [
15]. Through flask sampling of air collected at the South Pole station, and later lab analysis in California, Keeling
et al. [
16] pointed out that the mole fraction of CO
2 in the Antarctic atmosphere increased by 3.7% from 1957 through 1971, at an average annual increase of 1.3 µmol∙mol
−1∙yr
−1, from 315 µmol∙mol
−1 in 1958 to 380 µmol∙mol
−1 in 2007 [
17]. Morimoto
et al. [
18] indicated that the mole fraction of CO
2 at Syowa station increased from 342 µmol∙mol
−1 in 1984 to 368 µmol∙mol
−1 in 2000, with an average annual increase of 1.49 µmol∙mol
−1∙yr
−1. Ghude
et al. [
19] observed that around the Antarctic Circle, over the past 22 years, the increase in the rate of CO
2 mole fraction from 1992 through 2004 is 1.2 times faster than that during 1983 through 1991.
Flask sampling and lab analyses have a long history in the monitoring of greenhouse gases at Antarctic stations. As such, flask sampling frequency is usually once a week. With the support of the 4th International Polar Year (2008/2009) China Action Plan, continuous CO2 monitoring was instituted at Zhongshan Station, Antarctica, by the 24th Antarctic expedition team. In this paper, an analysis of CO2 mole fractions, measured continuously from 2010 through 2013, along with associated surface meteorological observations at Zhongshan Station, are presented and discussed.
3. Data Processing
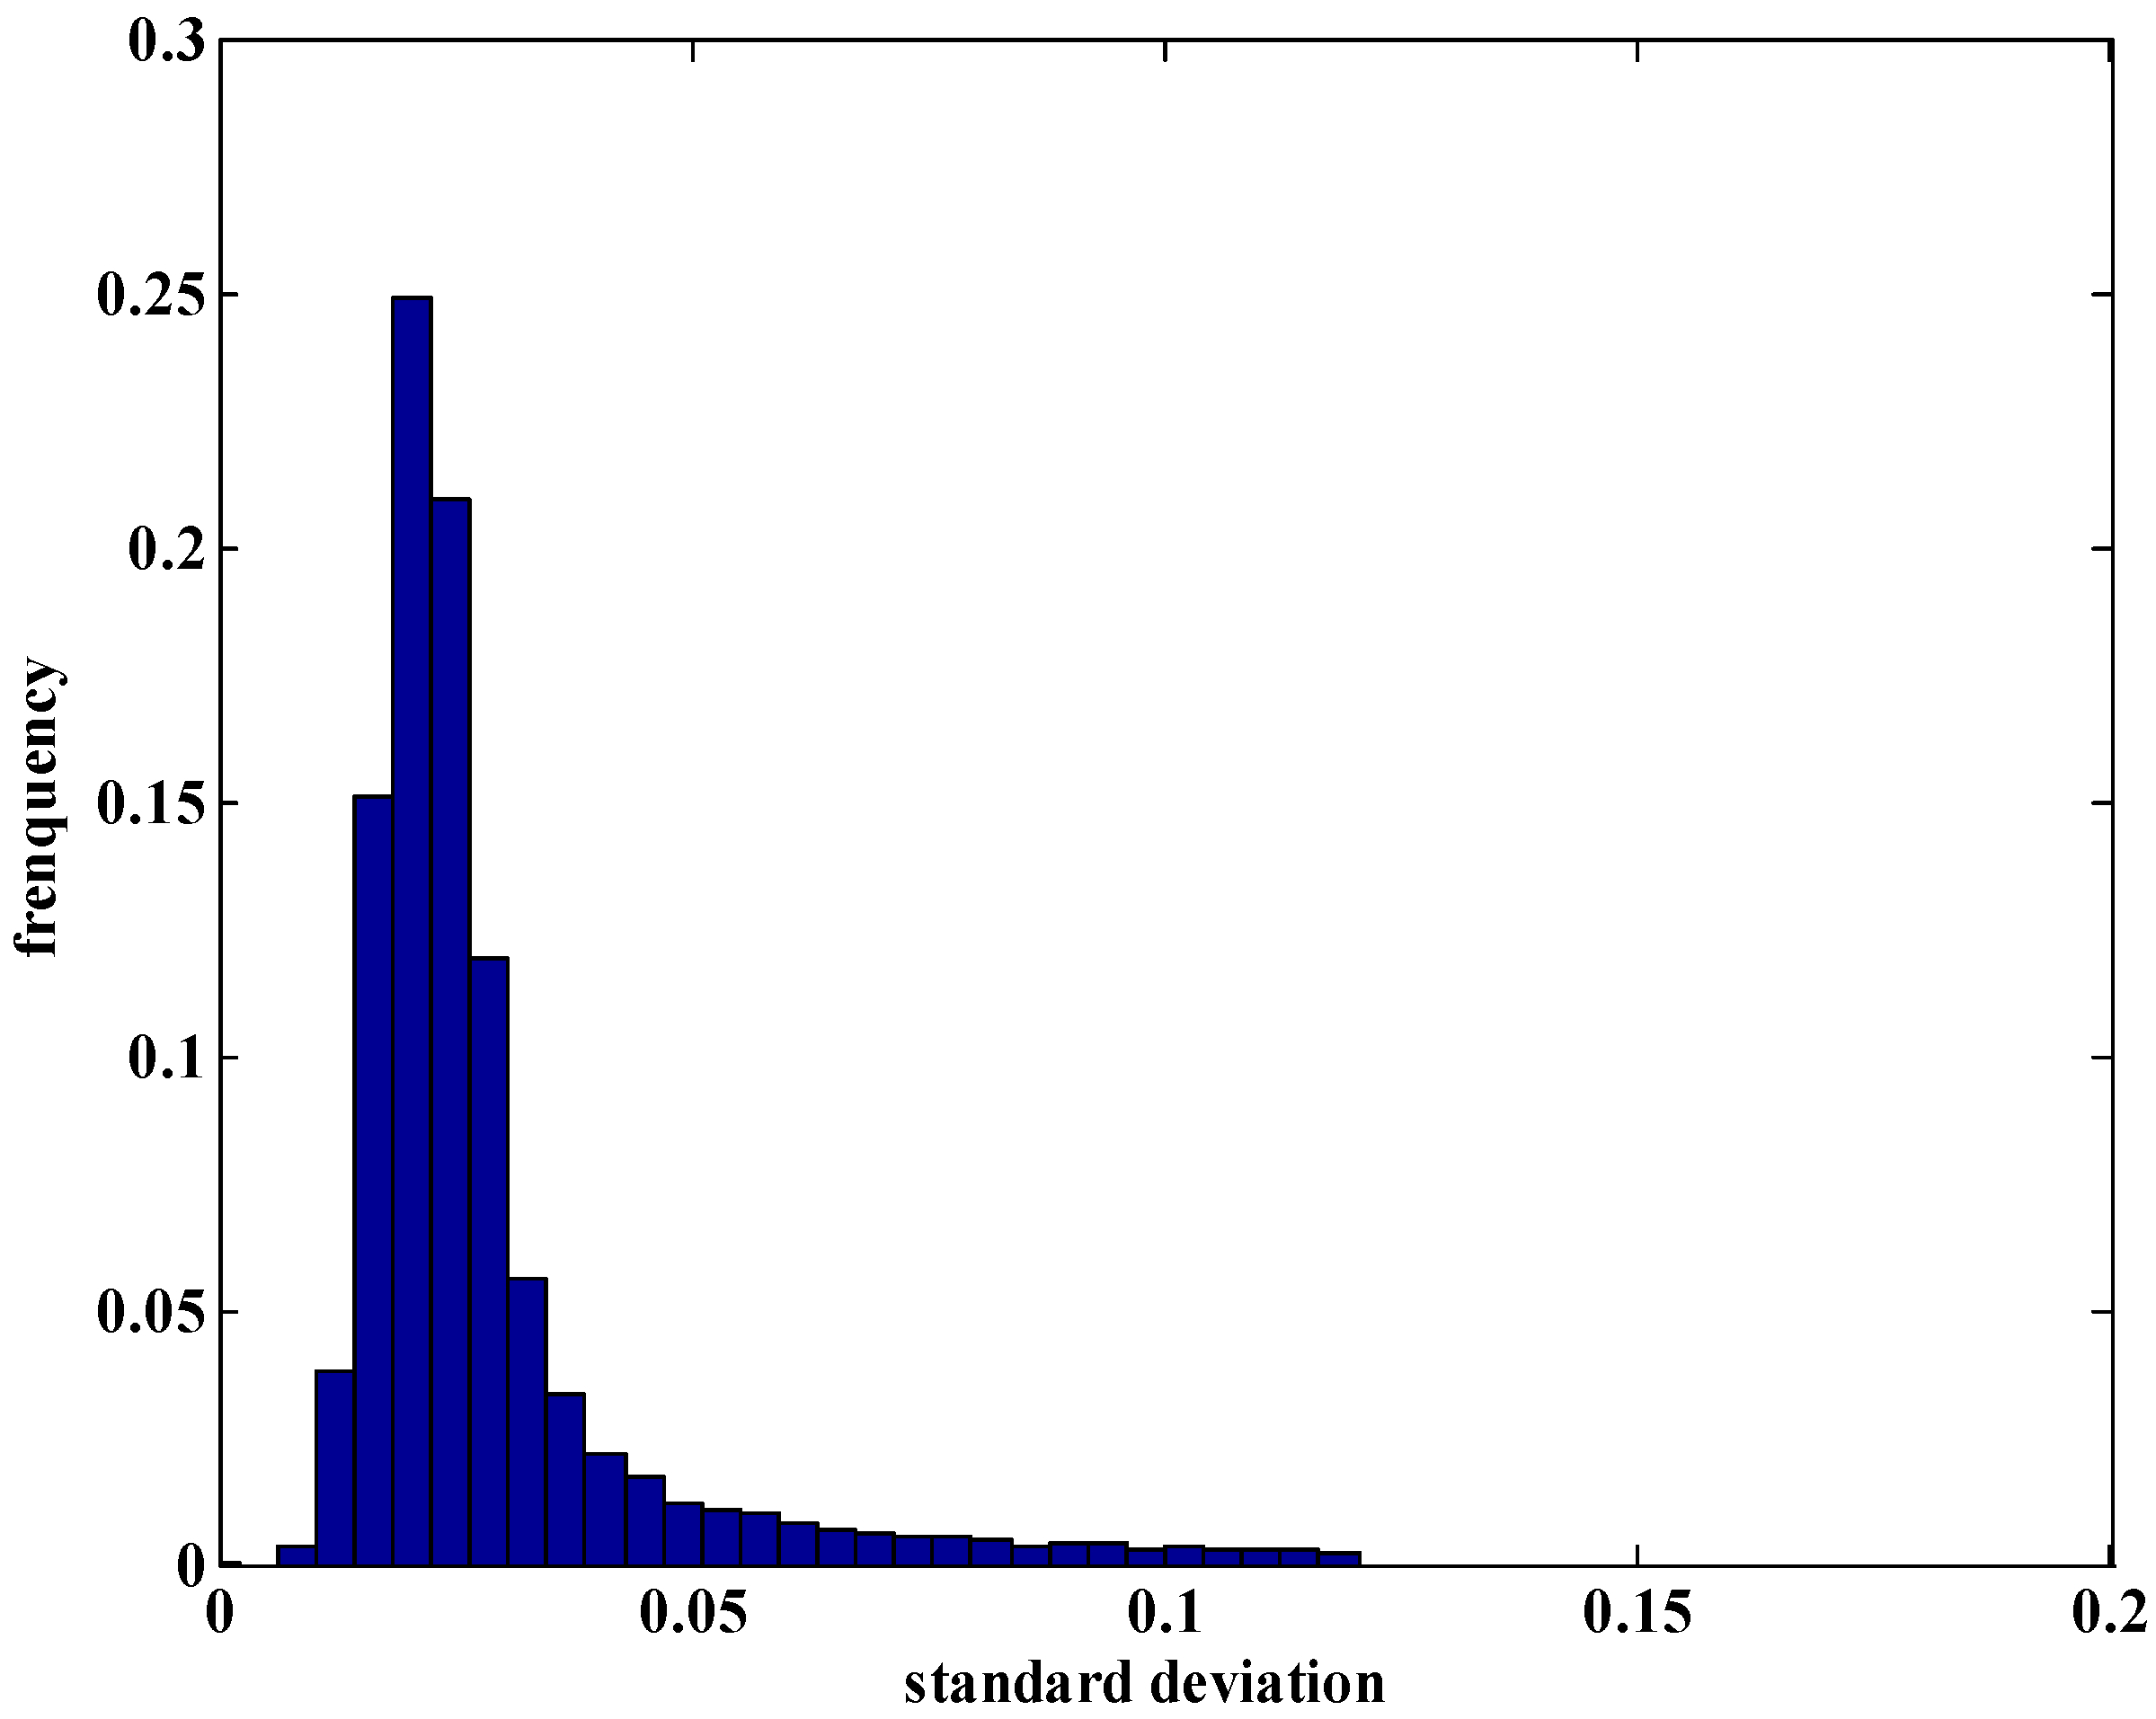
Before processing the raw data, periods of zero gas, short-time power failures and equipment maintenance were deleted. Then the daily check value and the calibration data obtained every three months were used to correct the raw data. The hourly standard deviations of CO
2 mole fraction, thus obtained, are shown in
Figure 2. As seen in this figure, the distribution of the standard deviation is extremely sharp. We first rejected the hourly means with standard deviations of more than 0.1 µmol∙mol
−1 within an hour. Abnormal values were then removed on the basis of the formula , where is measured value, is the mean value and σ is the standard deviation of the hourly means. After processing, 92% of the hourly mean data was retained.
Figure 2.
Distribution of hourly standard deviations of CO2 mole fraction observed at Zhongshan Station for the period of 2010–2013.
Figure 2.
Distribution of hourly standard deviations of CO2 mole fraction observed at Zhongshan Station for the period of 2010–2013.
This processing cannot completely exclude the impact of emissions from the station area. Wind is an important factor that causes fluctuations in observation [
26,
27]. Ten meter wind data at Zhongshan station was used to work out the frequency, corresponding average speed and CO
2 mole fraction in 16 directions.
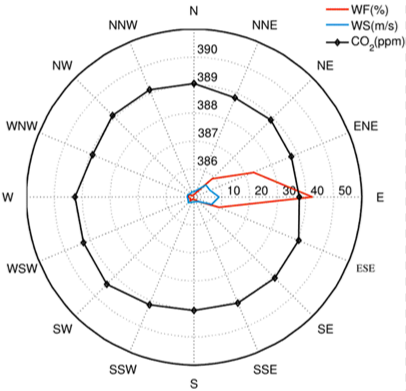
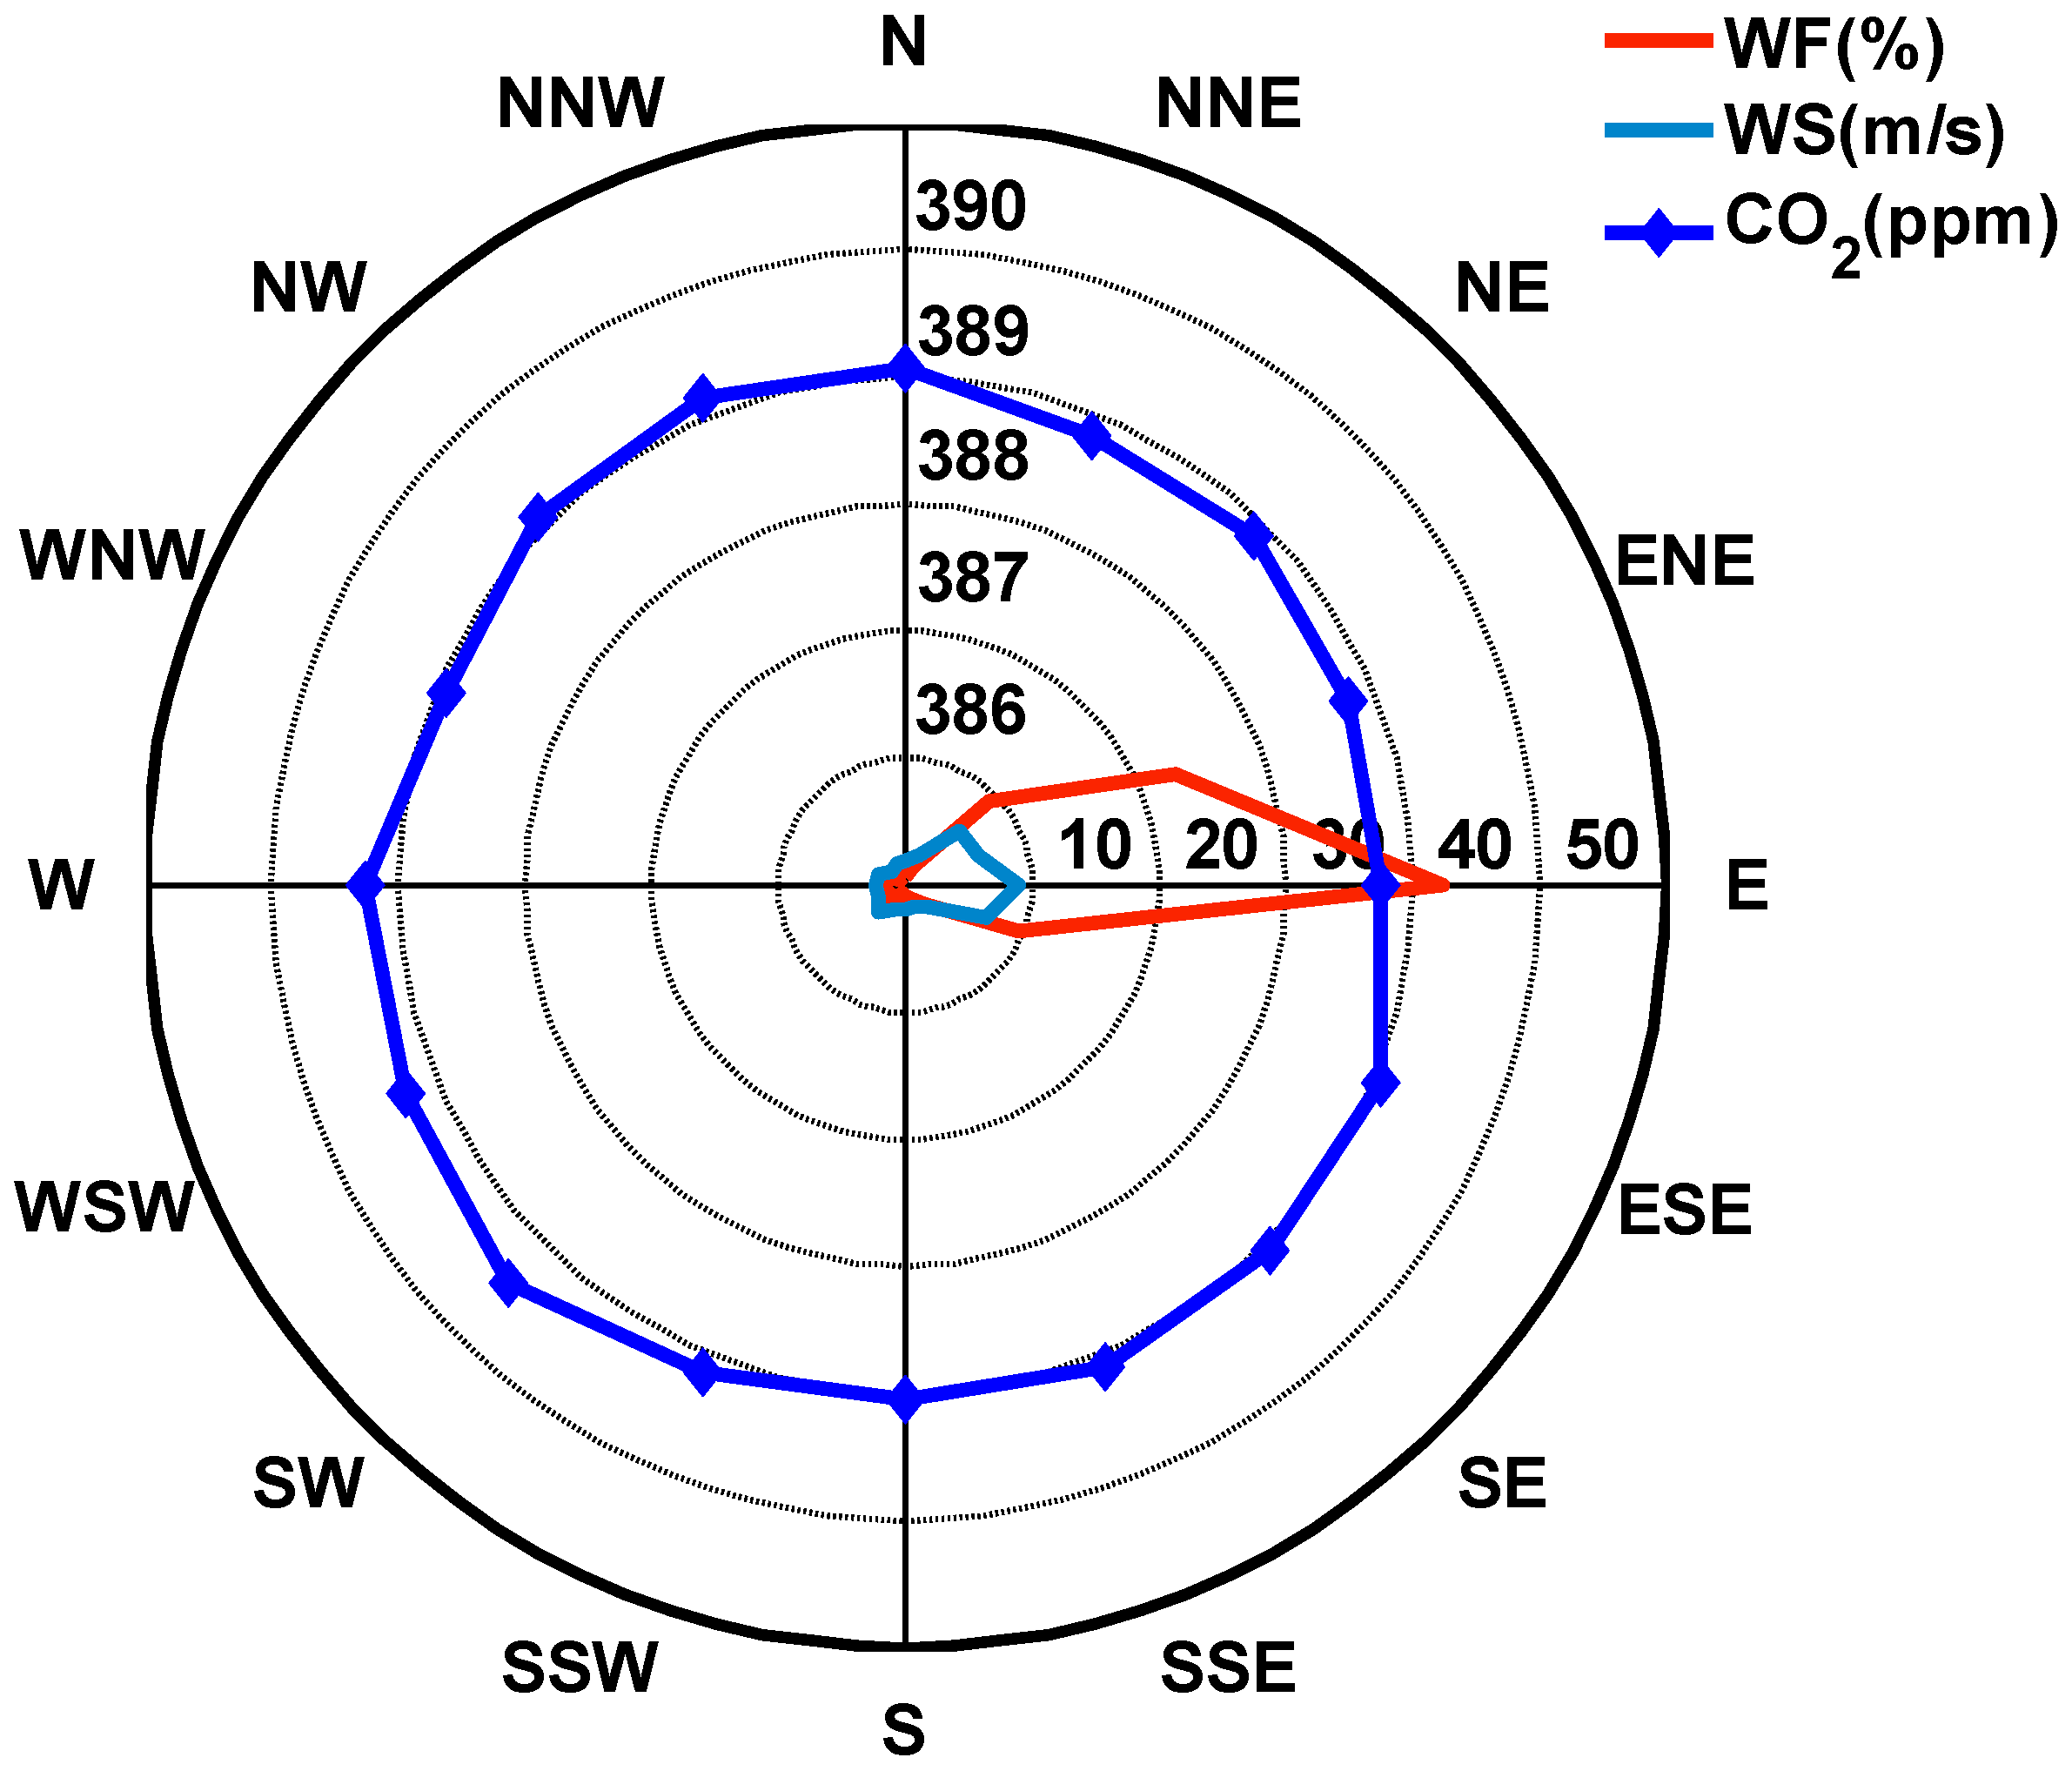
Figure 3 presents the Wind Frequency (WF), average Wind Speed (WS), and average CO
2 mole fraction under each wind direction category during 2010 through 2013. From this figure, it can be observed that the prevailing winds are persistent easterly winds with 83.1%, coming from the quadrant in the ENE, E and ESE. This indicates that the observation sampling point is located well in the direction of upstream airflow. This airflow mainly comes from the Antarctic continent sea ice cover and easterly sea areas. The mole fraction of CO
2 under easterly winds is 388.8 µmol∙mol
−1, whereas, for westerly winds it is relatively higher at 389.3 µmol∙mol
−1, followed by north (389.2 µmol∙mol
−1) and south winds (389.1 µmol∙mol
−1), respectively. Mole fractions in winds from other directions are within the range of 388.9–389.1 µmol∙mol
−1. On the whole, the wind direction does not influence the CO
2 mole fraction significantly.
Figure 3.
Wind Frequency, Wind Speed and CO2 mole fractions under 16 wind directions (2010 through 2013). Scale 10–50 is used for WF and WS and Scale 386–390 for CO2.
Figure 3.
Wind Frequency, Wind Speed and CO2 mole fractions under 16 wind directions (2010 through 2013). Scale 10–50 is used for WF and WS and Scale 386–390 for CO2.
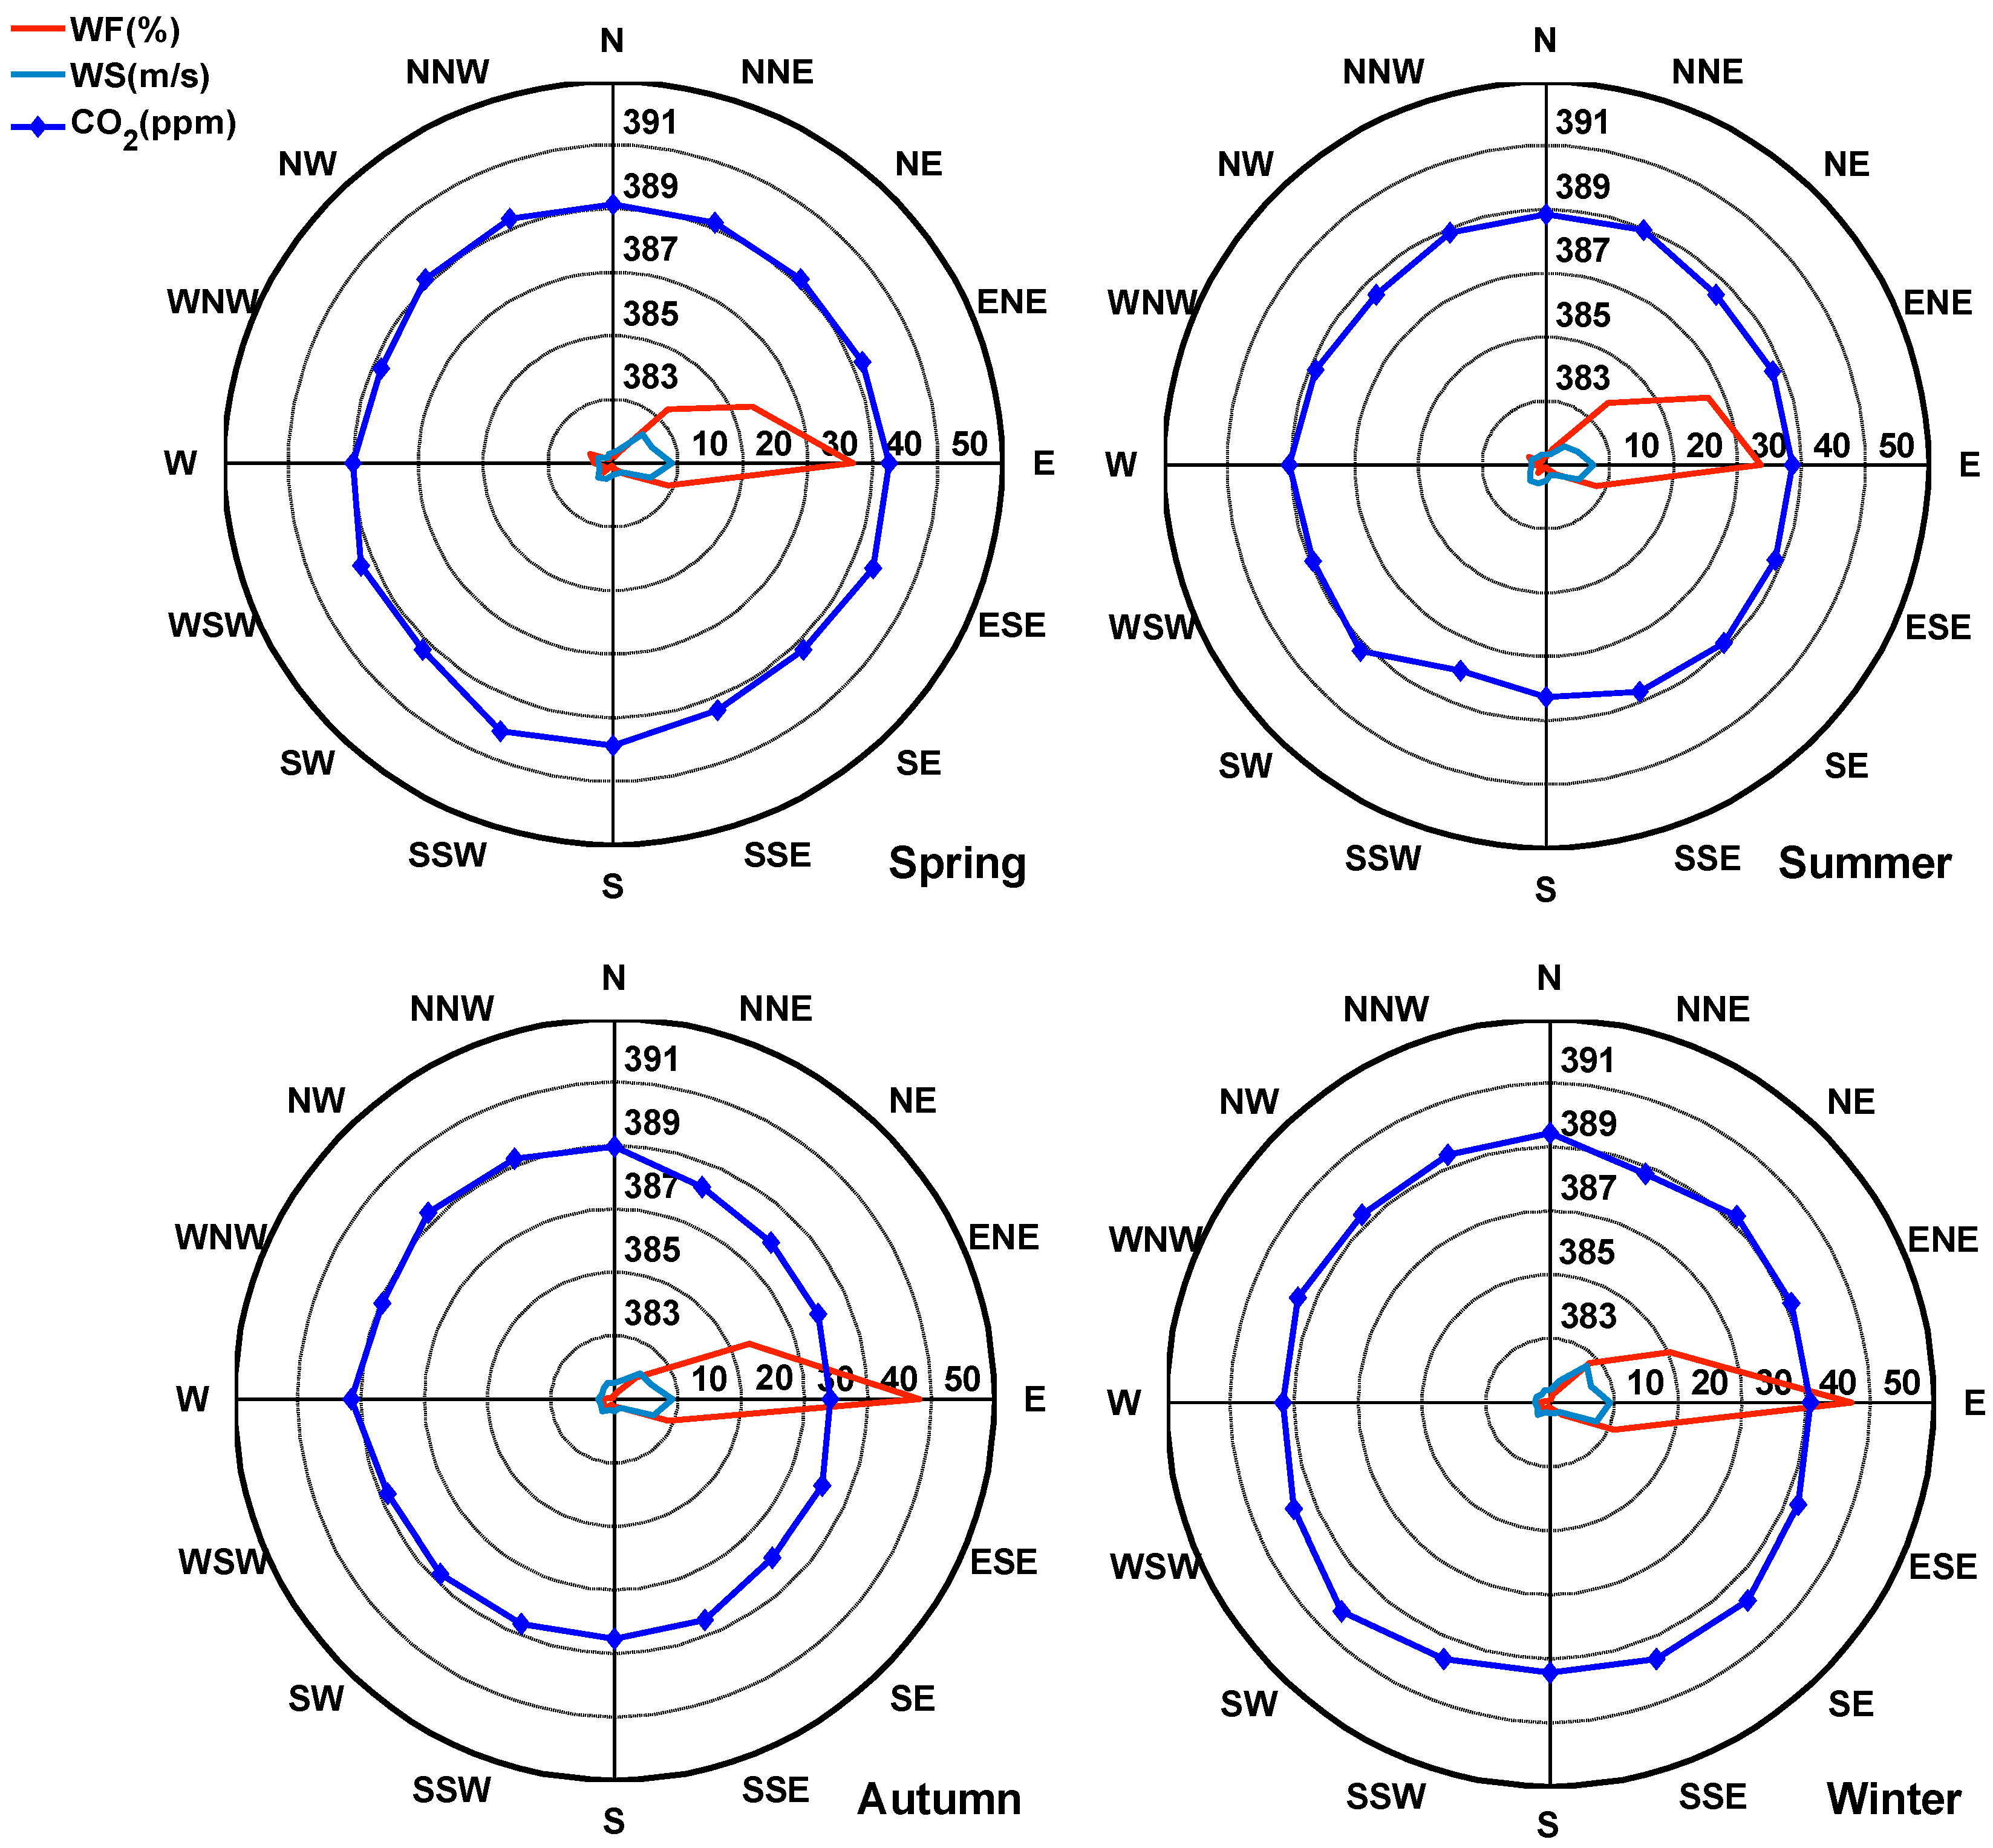
Figure 3 displays the WF, WS and CO
2 mole fraction under different wind directions in Spring (September–November), Summer (December–February.), Autumn (March–May), and Winter (June–August) during 2010 through 2013. From
Figure 4 it may be observed that there is little difference between the prevailing wind directions in the four seasons: only the frequency of NE winds increases in spring and summer. The distribution of wind speed in each season differs insignificantly from that throughout the year: the maximum wind speed appears under easterly winds of which frequency is also the highest. CO
2 mole fractions are similar to each other under different wind directions, although in winds from the S-SSW the CO
2 mole fraction rises in spring and reduces in summer. That may be somewhat influenced by the relatively limited samples in this wind direction. Under easterly winds, CO
2 mole fractions in autumn go down slightly probably signifying the influx of northern hemisphere air or depletions of CO
2 by the growth of marine plankton.
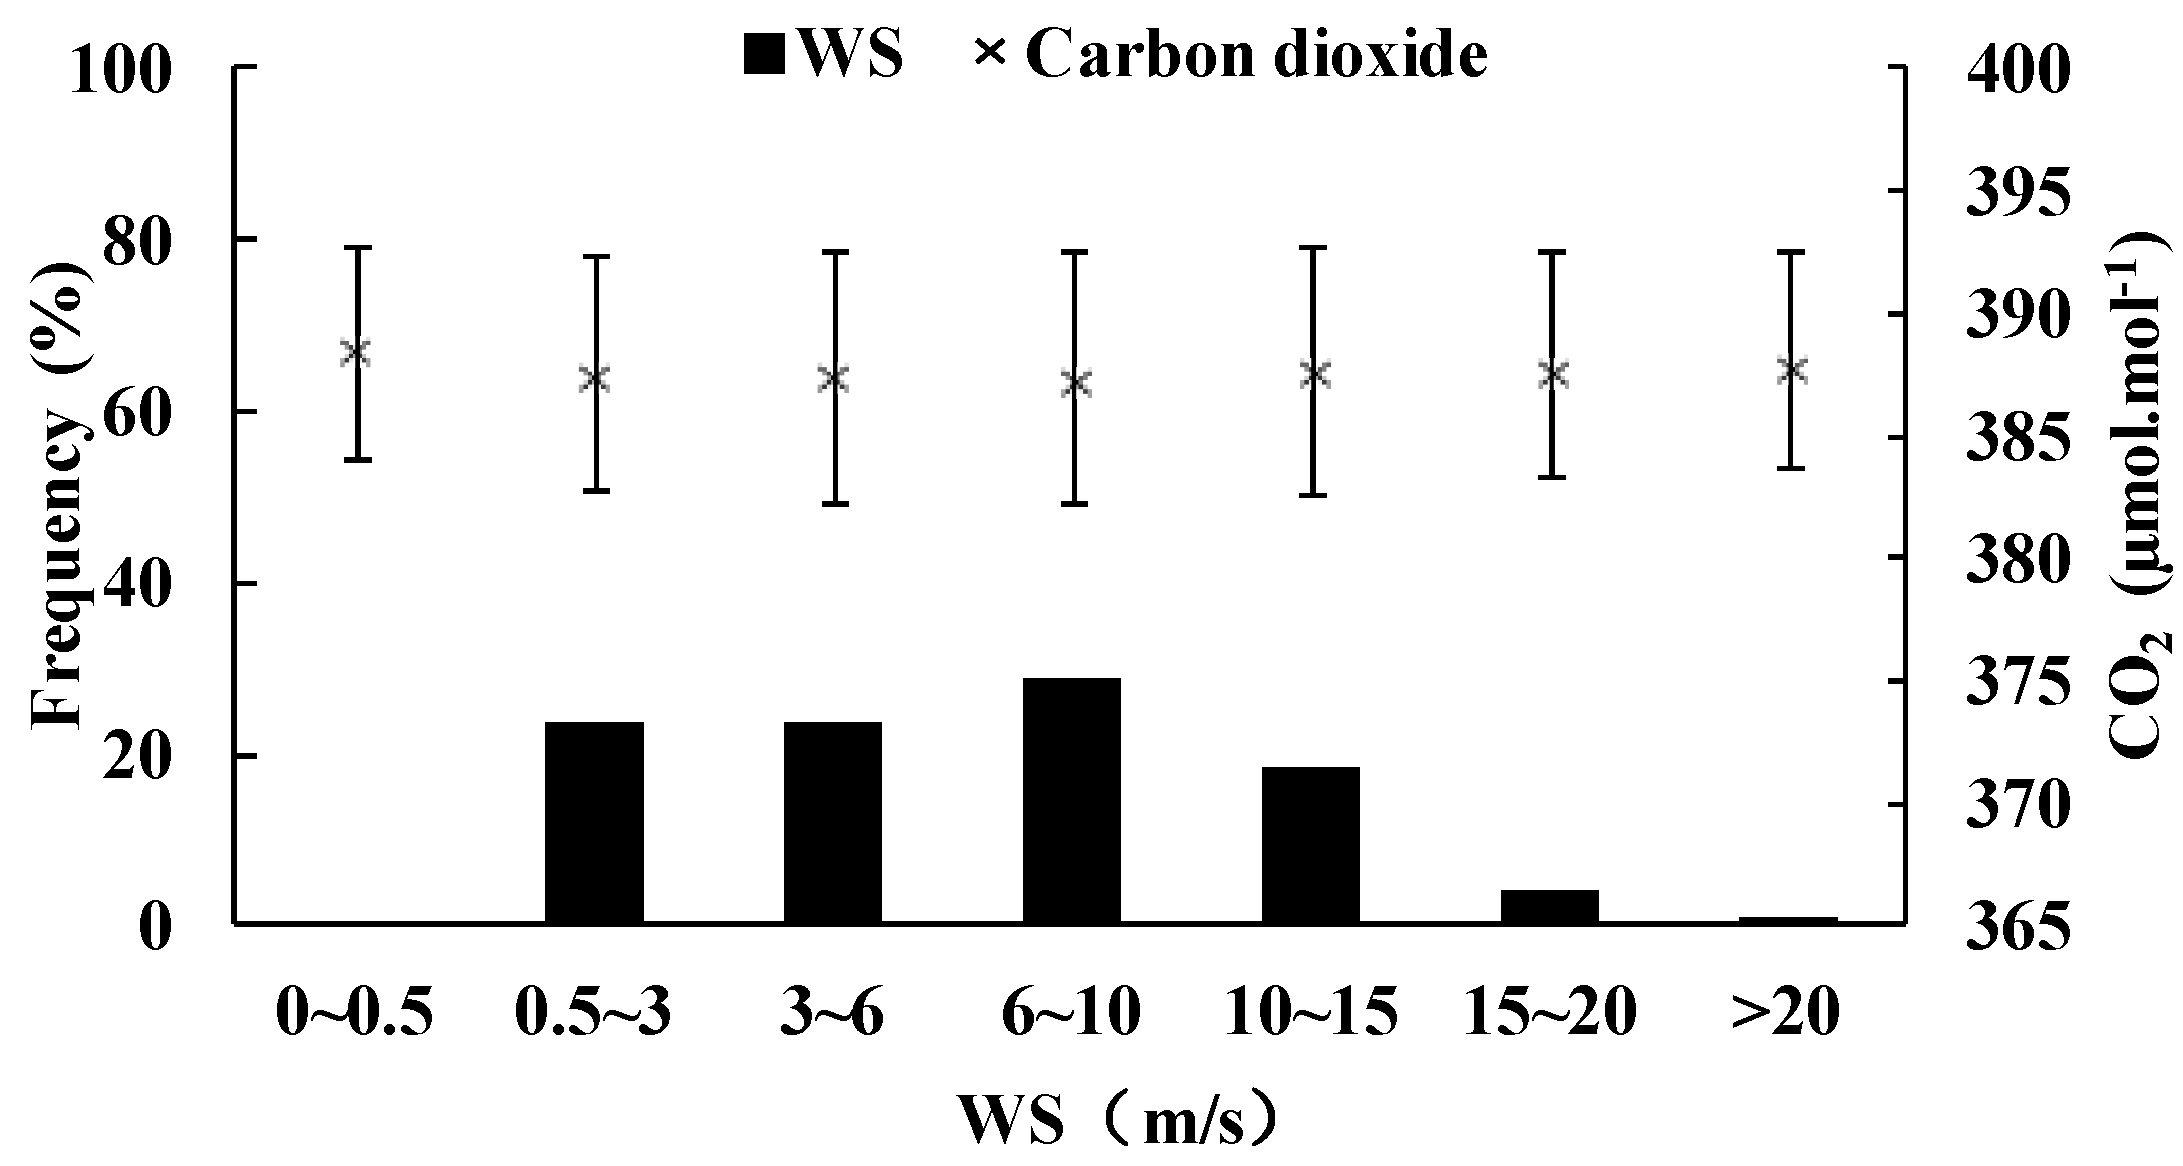
Slow and variable direction winds are not conducive to the diffusion and mixing of pollutants. As such, wind speed data from 2010 through 2013 were divided into seven groups as follow: ≤0.5 m∙s
−1, 0.5–3 m∙s
−1, 3–6 m∙s
−1, 6–10 m∙s
−1, 10–15 m∙s
−1, 15–20 m∙s
−1, and >20 m∙s
−1.
Figure 5 displays the CO
2 mole fraction in each wind speed scale, where it may be observed that 94.7% of winds fall in the 0.5 m∙s
−1 to 15 m∙s
−1 range with only 1% of winds above 20 m∙s
−1. The wind can be classified as calm at ≤0.5 m∙s
−1 of which frequency of occurrence is 0.3% when the CO
2 mole fraction is slightly elevated. In order to keep the background CO
2 mole fraction data free from possible contaminated values, the data during calm wind condition has been removed from CO
2 mole fraction analyses.
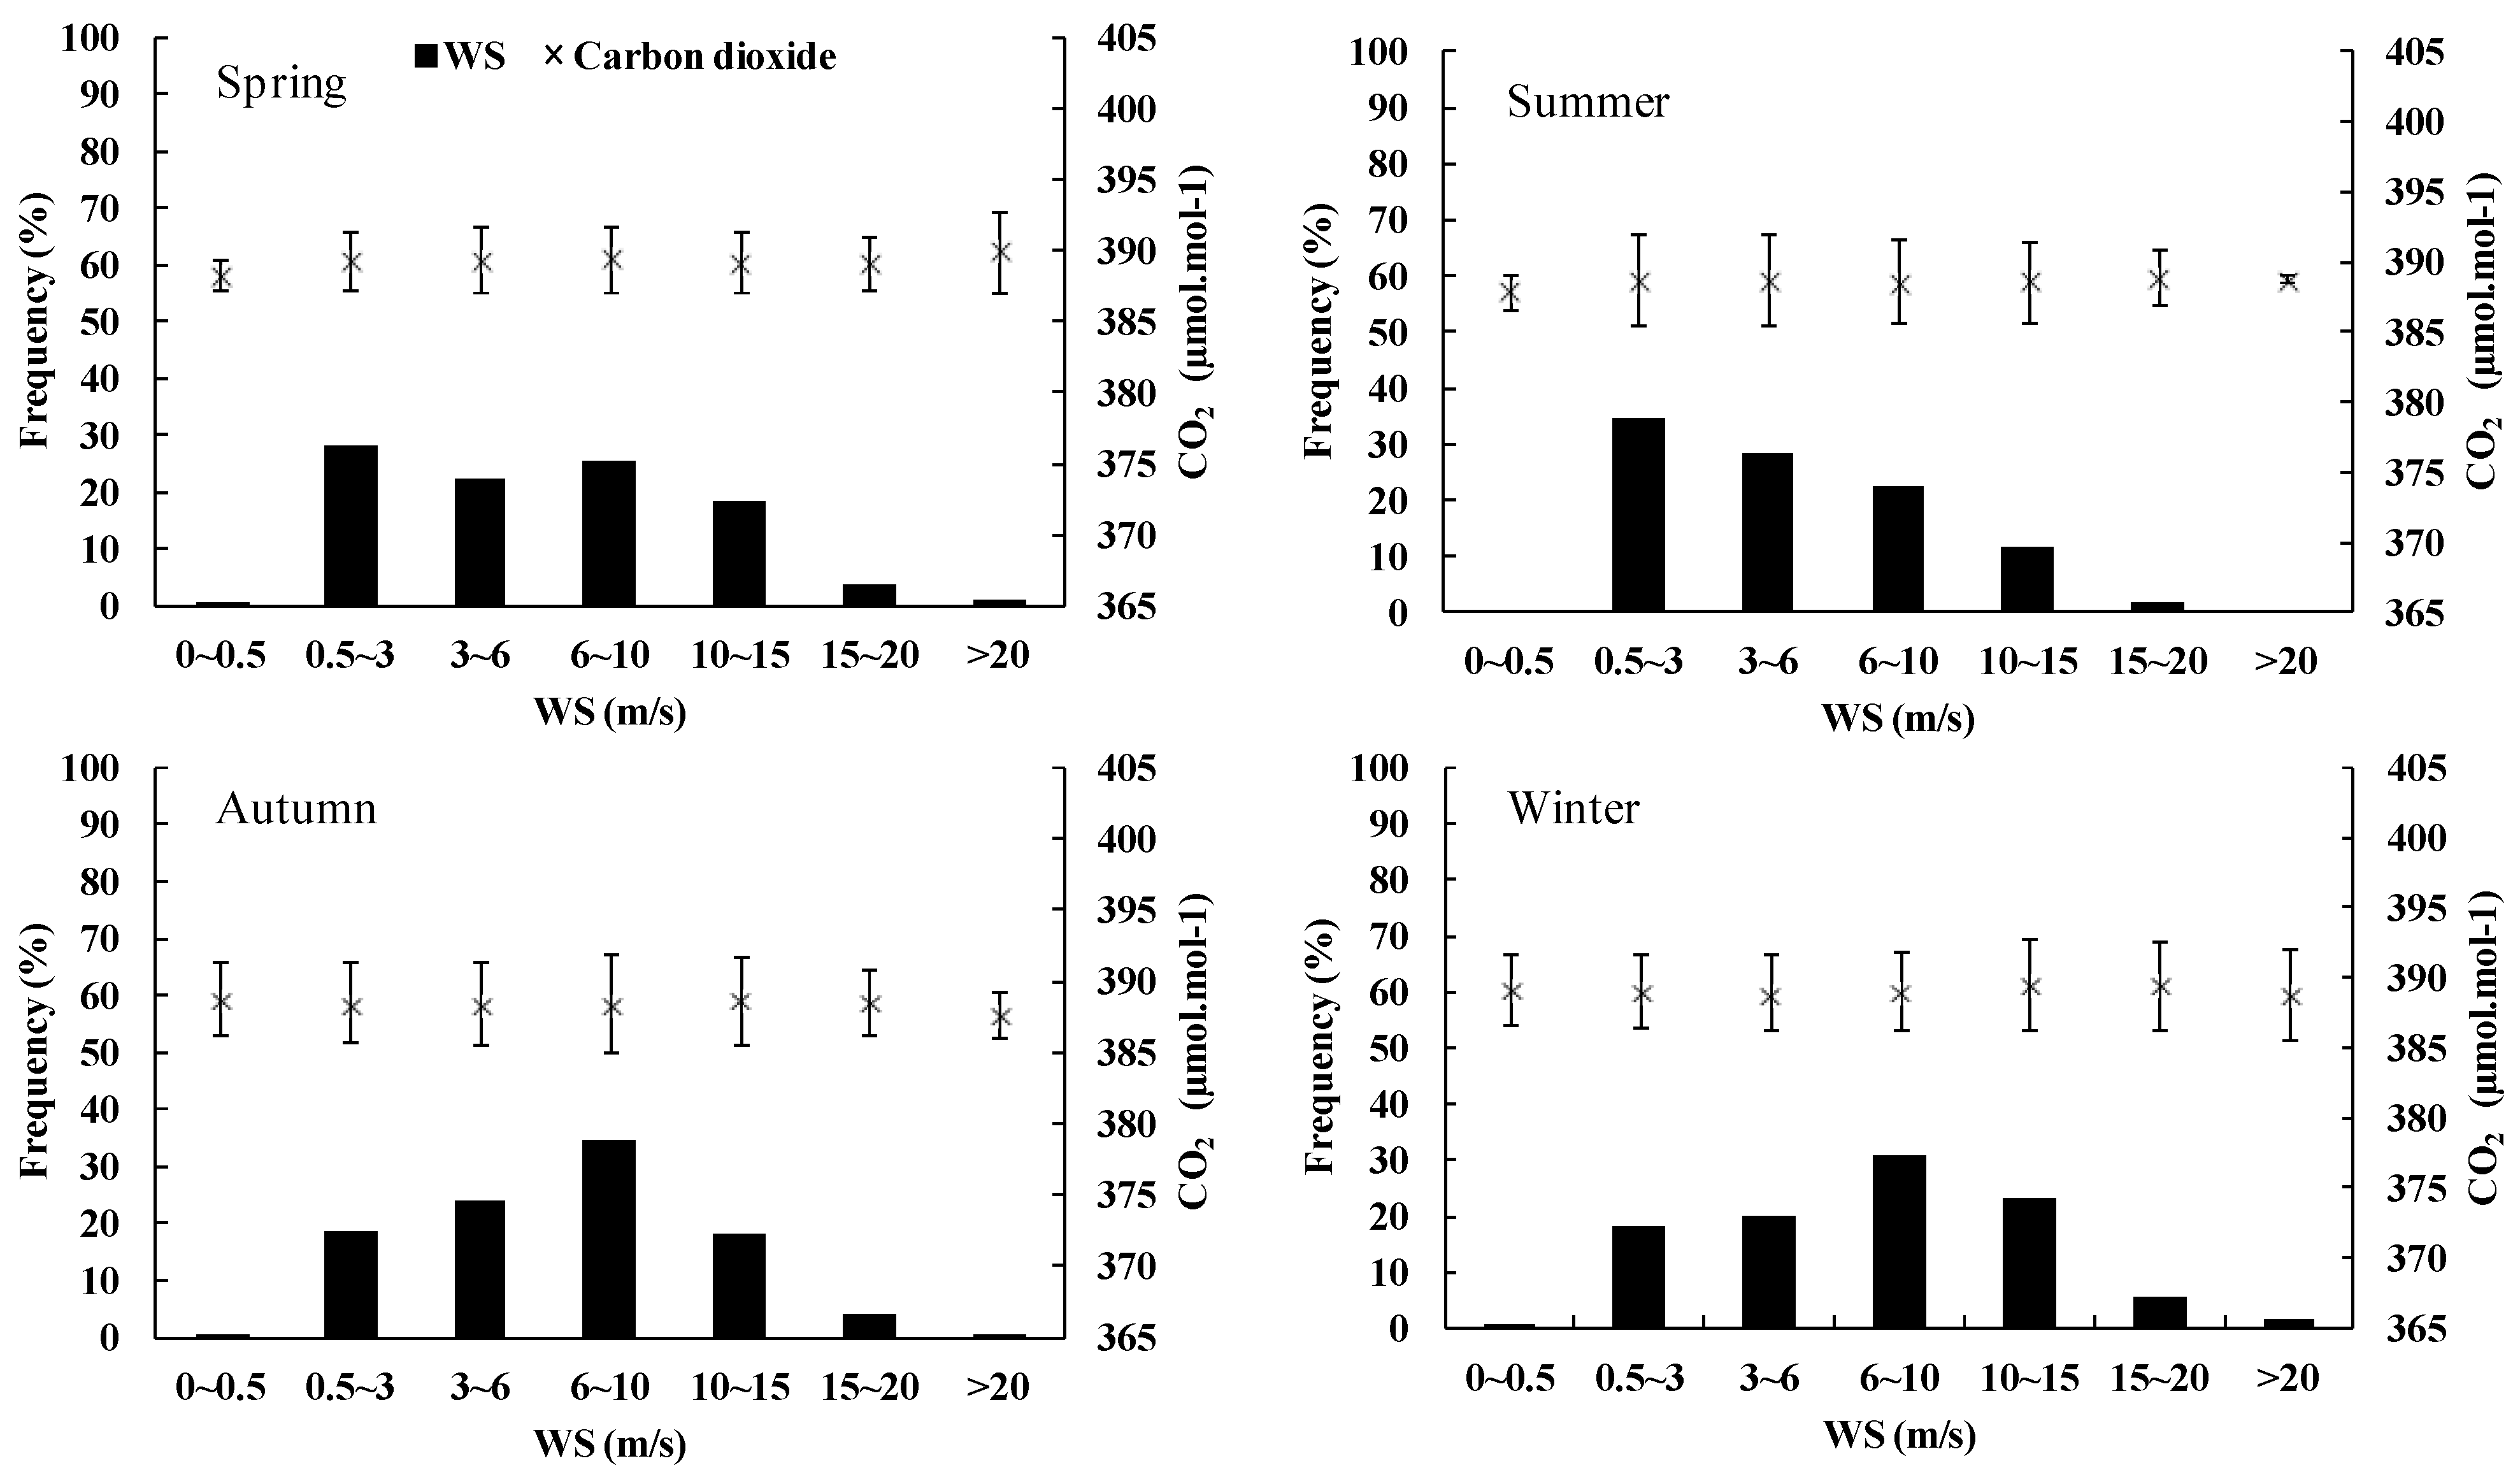
The frequency of each wind speed scale in four seasons, and the respective change in CO
2 mole fractions, are shown in
Figure 6. In autumn and winter, when the wind speed is ≤0.5 m∙s
−1, CO
2 mole fractions are unstable, which is probably caused by local influence from the station area. In spring and summer, under similar wind conditions, the CO
2 mole fraction changes little. This indicates that although the CO
2 observation point is only 500 m away from the station, wind speed exerts a relatively small influence on the observed CO
2 mole fractions since the total emissions from the station are limited. After the processing and analysis above, 1.7% of the data was removed. Thus, the processed data may be used to represent the background CO
2 mole fractions in the region.
Figure 4.
WF, WS, and CO2 mole fraction under 16 wind directions in four seasons. Scale 10–50 is used for WF and WS and Scale 386–390 for CO2.
Figure 4.
WF, WS, and CO2 mole fraction under 16 wind directions in four seasons. Scale 10–50 is used for WF and WS and Scale 386–390 for CO2.
Figure 5.
Frequency of occurrence of different wind speed scale and corresponding CO2 mole fraction (2010 through 2013). The black bars stand for frequency of occurrence. The vertical bars stand for the amplitude of CO2 mole fractions under the condition of same wind speed scale.
Figure 5.
Frequency of occurrence of different wind speed scale and corresponding CO2 mole fraction (2010 through 2013). The black bars stand for frequency of occurrence. The vertical bars stand for the amplitude of CO2 mole fractions under the condition of same wind speed scale.
Figure 6.
Frequency of occurrence of different wind speed scales and corresponding CO2 mole fractions in four seasons at Zhongshan Station (2010 through 2013). The black bars stand for frequency of occurrence. The vertical bars stand for the amplitude of CO2 mole fractions under the condition of same wind speed scale.
4. Background Characteristics of CO2 Mole fractions and Seasonal Variation
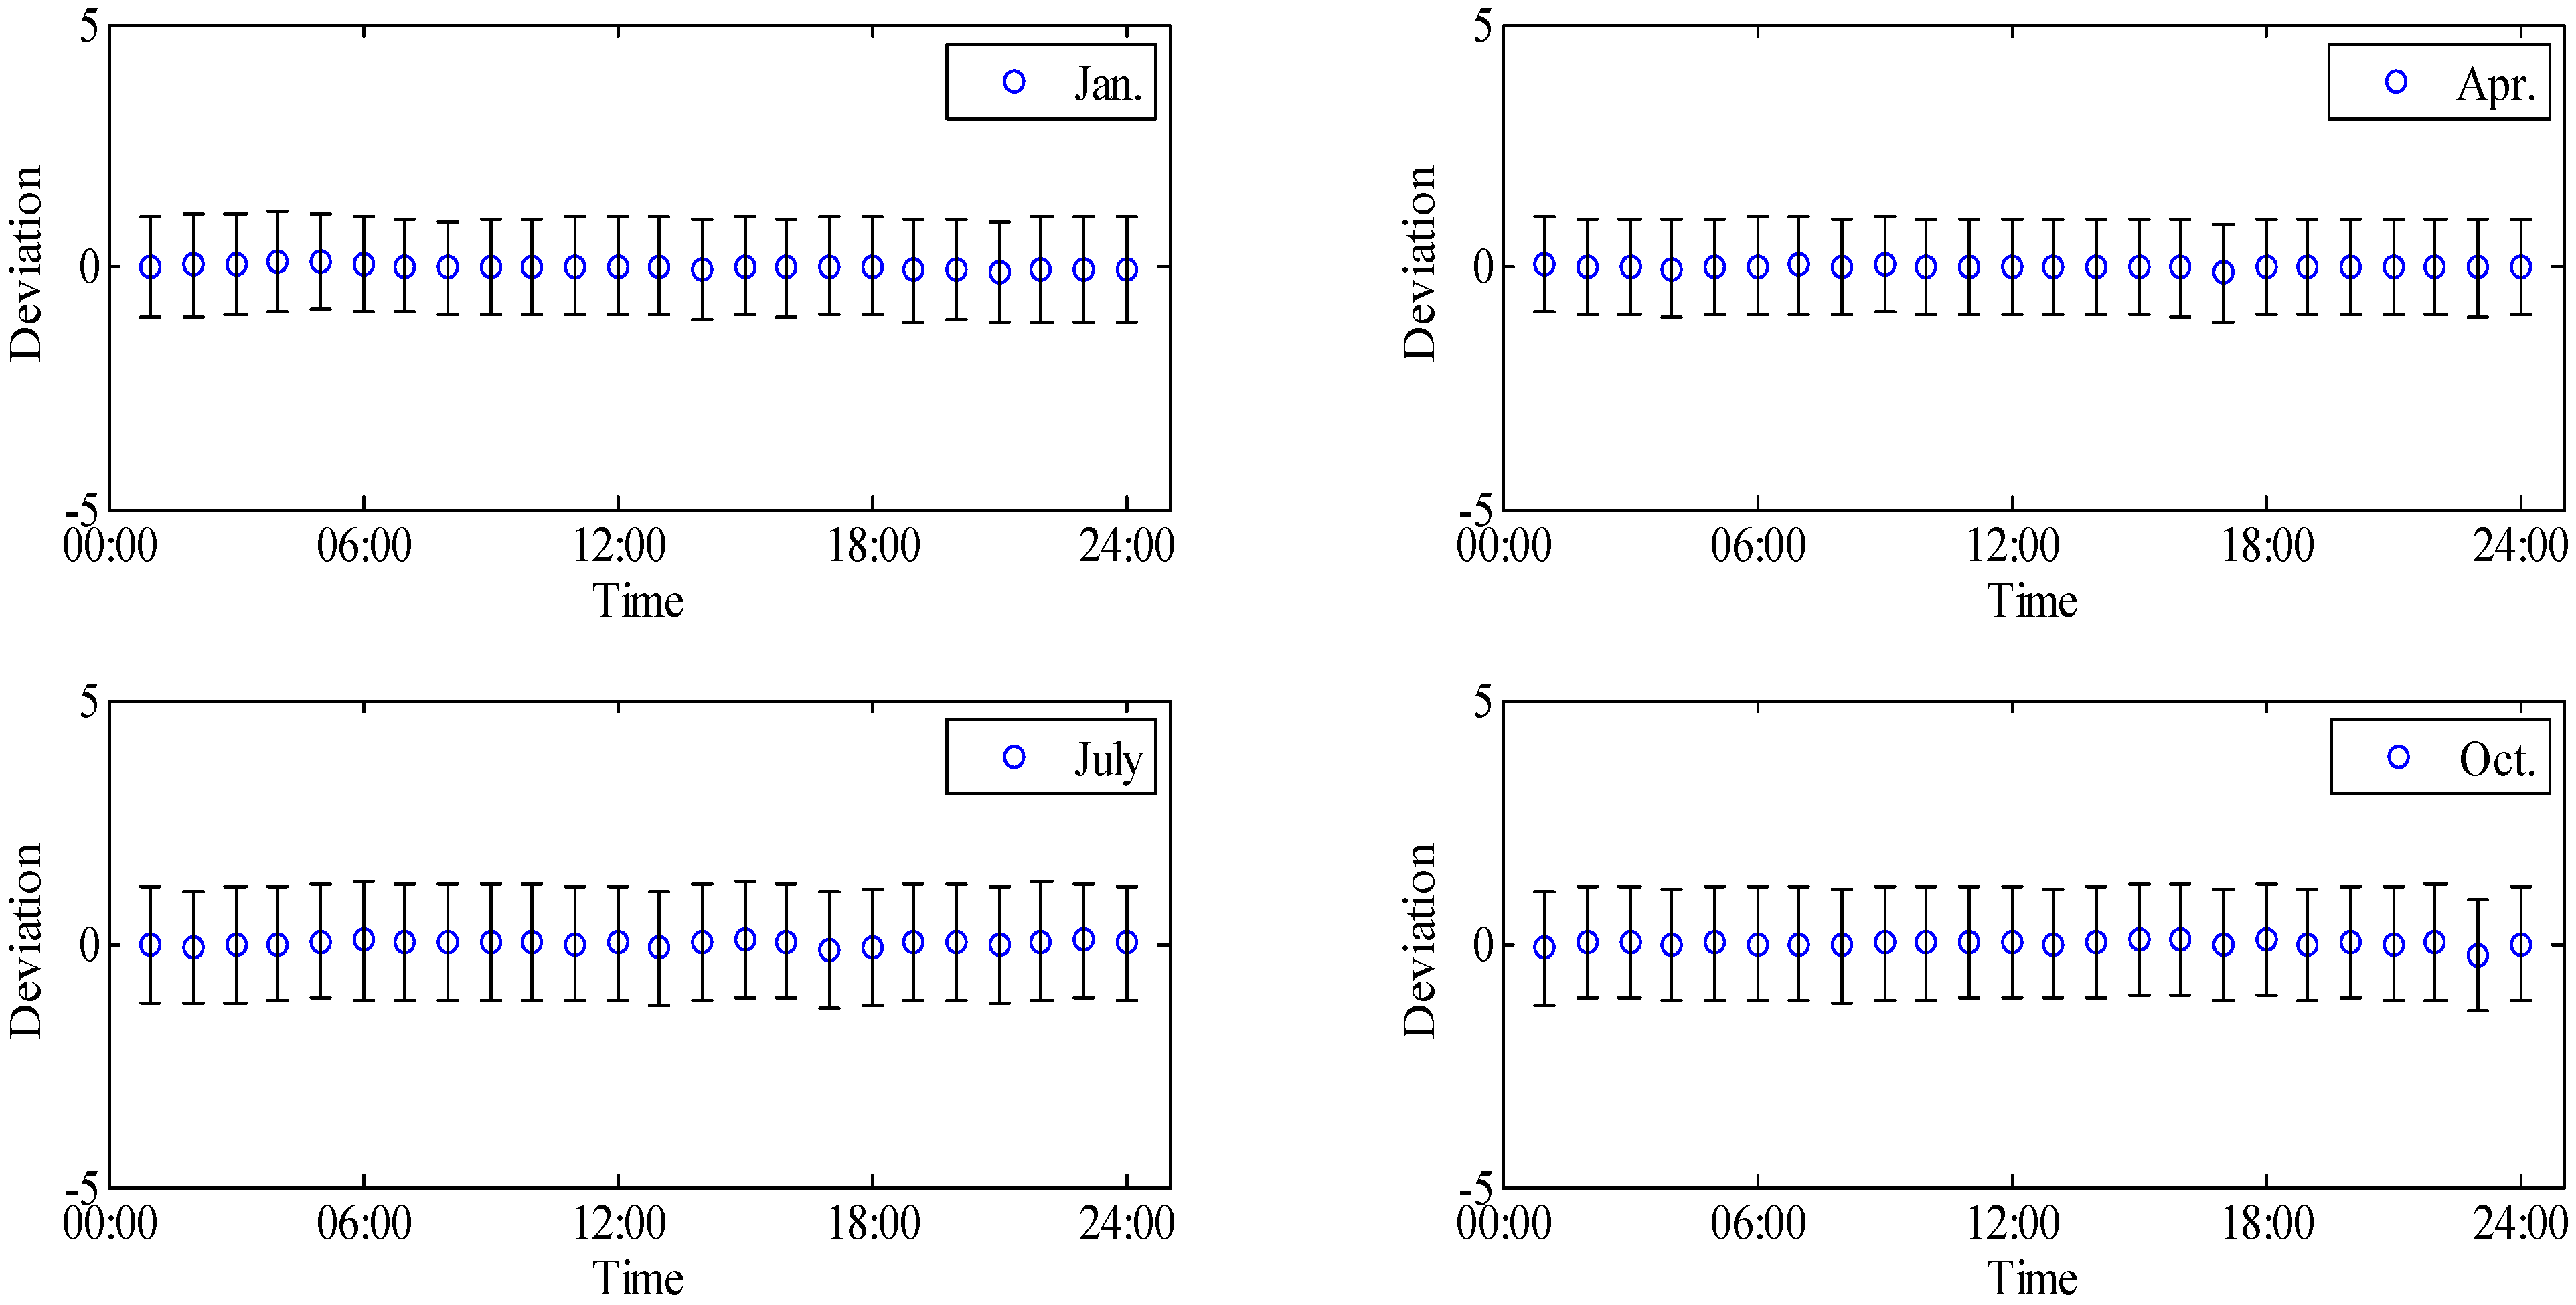
Monthly averaged deviations of hourly mean CO
2 mole fractions from daily means at Zhongshan Station in January, April, July and October, representing four seasons respectively, are shown in
Figure 7. It can be seen that the daily changes in four seasons are all quite small, and only subtle daily amplitude exists, which are 0.22 µmol∙mol
−1, 0.19 µmol∙mol
−1, 0.18 µmol∙mol
−1 and 0.30 µmol∙mol
−1, respectively. The results, therefore, suggest that there are no strong CO
2 sources and diurnal changes in the characteristics of the CO
2 sinks upwind of the station. This also indicates that the observation point on the east coast of Antarctica on a rocky outcropping without vegetation in summer and covered by snow in the other three seasons does not have a regional influence on the observations of background CO
2.
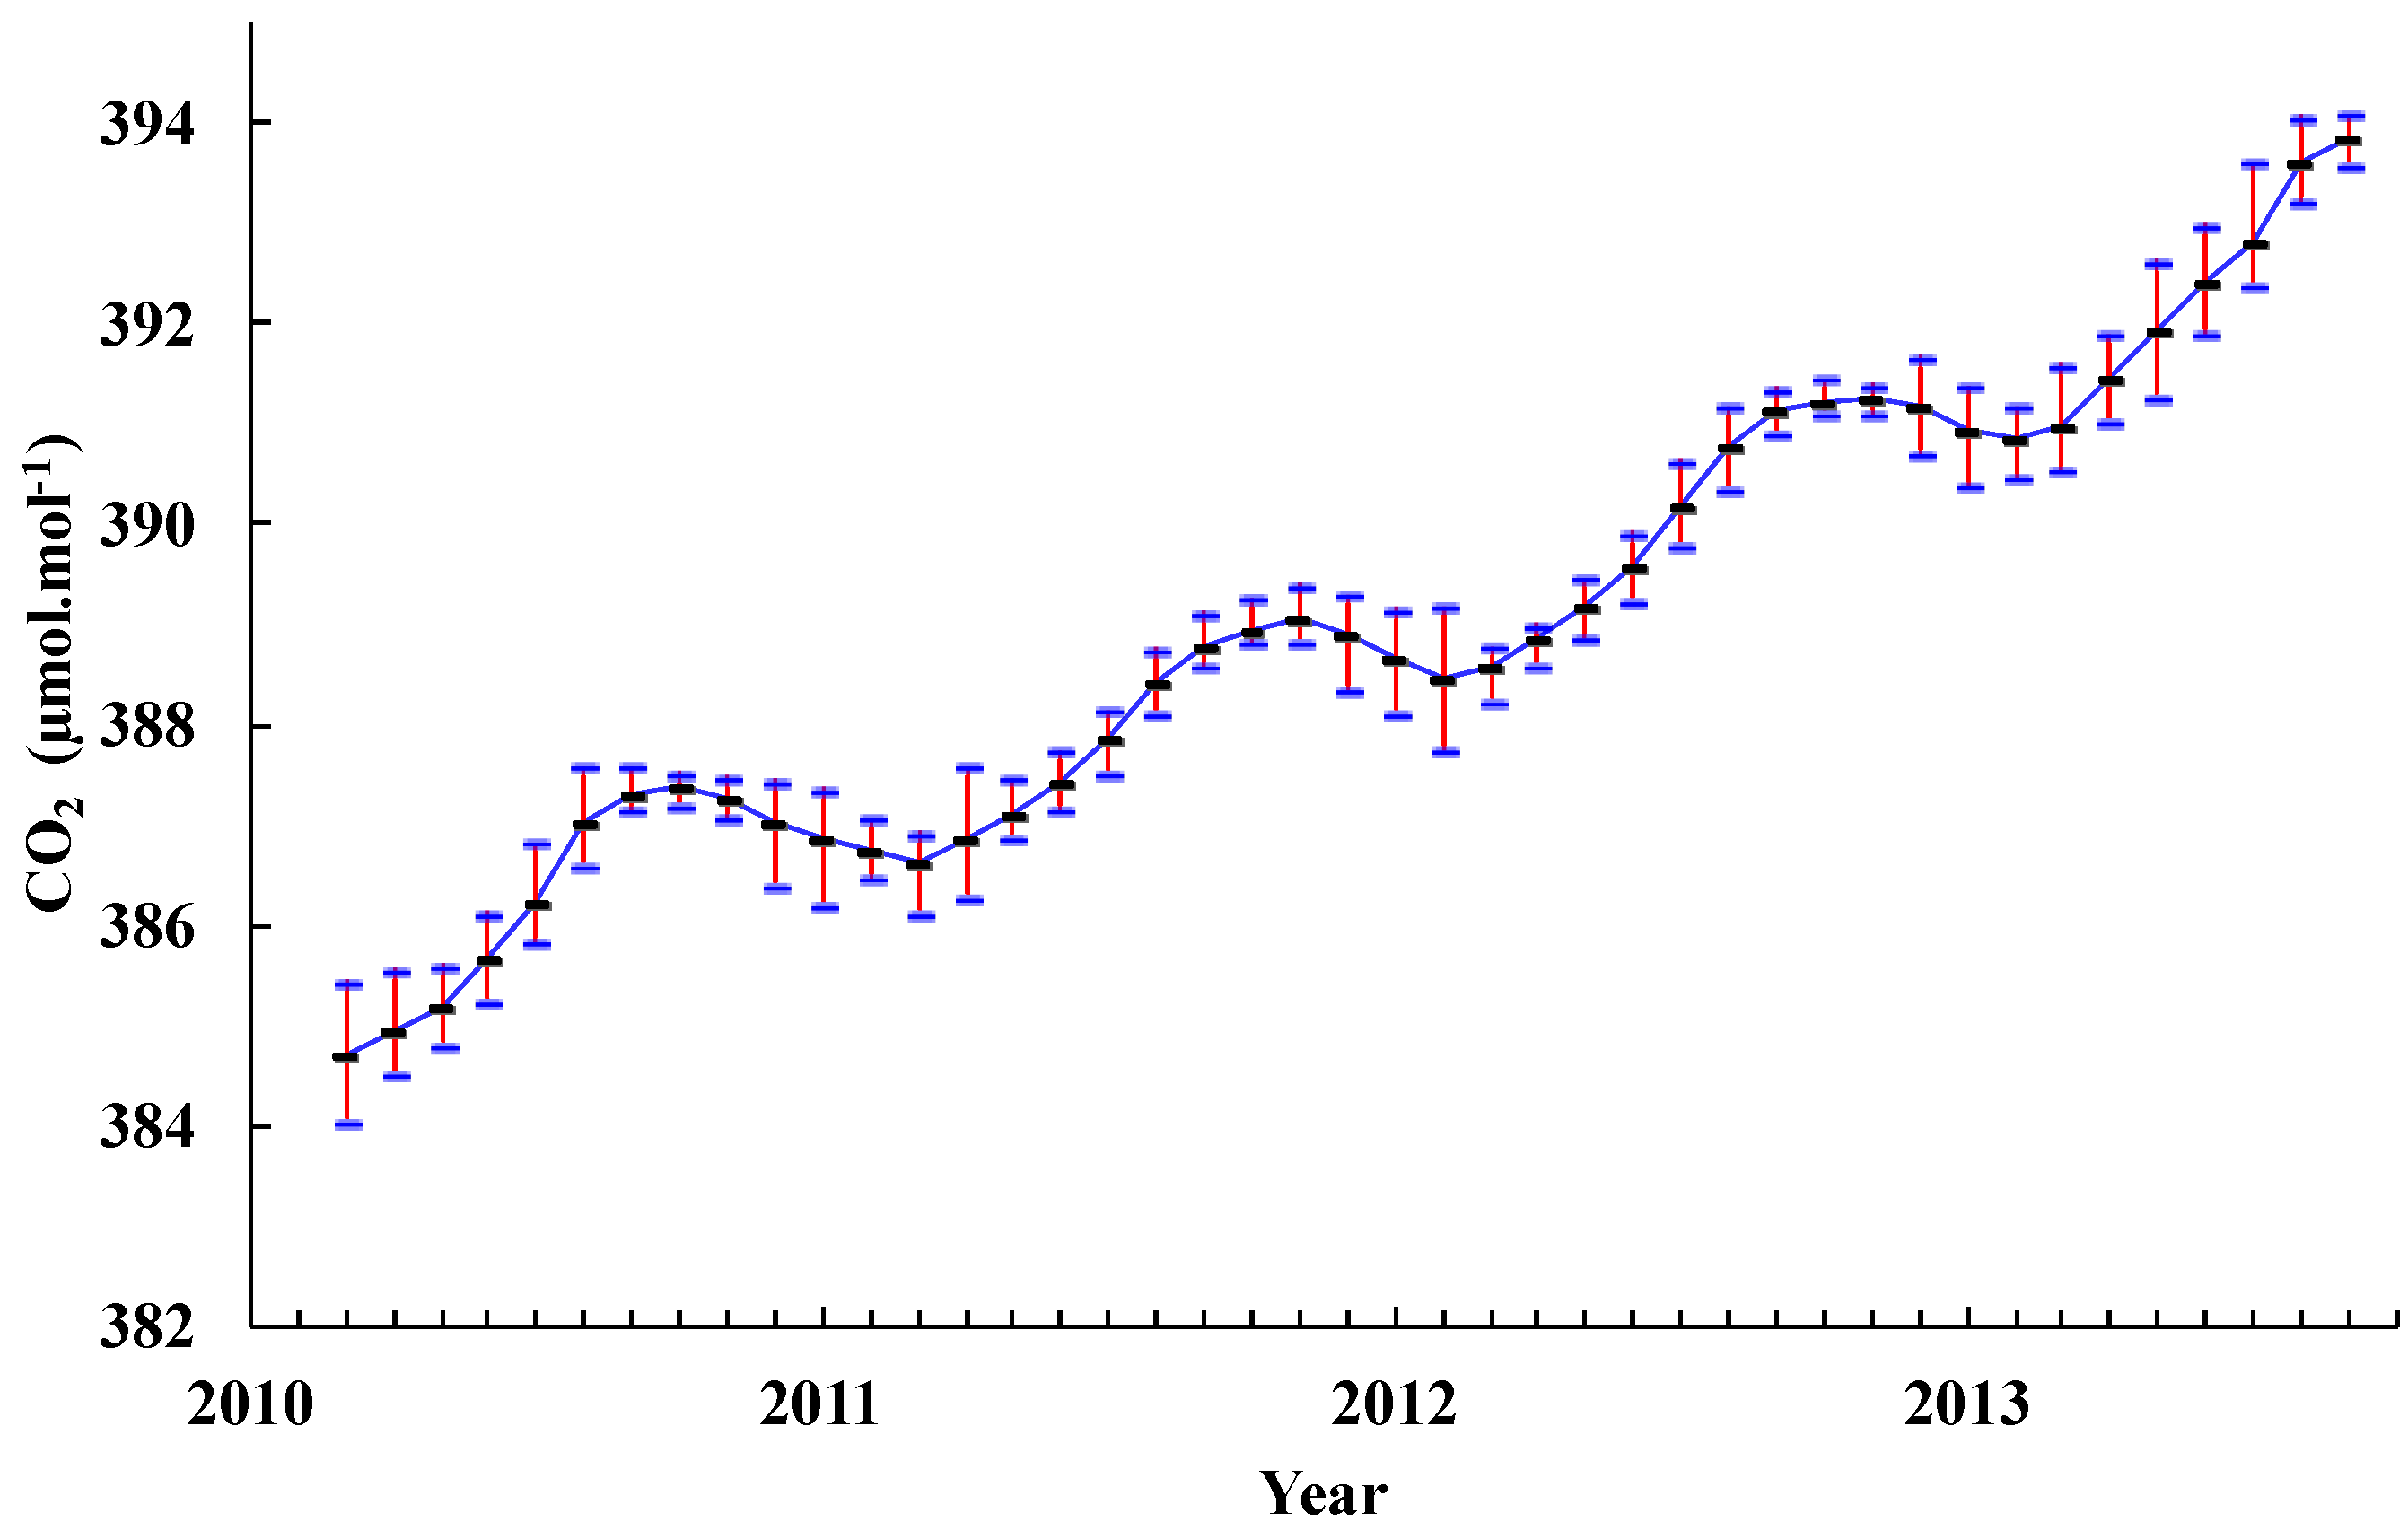
Figure 8 displays the average monthly CO
2 mole fraction month-by-month and the time sequence of minimum and maximum CO
2 values from 2010 through 2013 at Zhongshan Station. From this figure, the average monthly mole fraction changes exhibit a seasonal pattern as well as a steady increase in background CO
2 mole fractions. The amplitude of CO
2 mole fractions variability is higher in the austral summer. Similar phenomenon has been found at the Syowa and South Pole Stations, that is related to the large-scale transport of CO
2-depleted air masses to the Antarctic Continent [
17]. From
Figure 9, it can be seen that the seasonal variation of CO
2 mole fractions at Zhongshan reaches a minimum in March with a peak in November. As such, from Austral autumn through winter into spring (March-November), the cycle period for CO
2 mole fractions is largest while the CO
2 cycle in spring is noticeably slower than that in autumn and winter. Summer (December-March) is the period when the mole fractions are the lowest.
Figure 7.
Monthly averaged deviations of hourly mean CO2 mole fractions from daily means at Zhongshan Station in January, April, July and October. The mole fraction is averaged over 2011–2012. Vertical bars represent the standard deviations.
Figure 7.
Monthly averaged deviations of hourly mean CO2 mole fractions from daily means at Zhongshan Station in January, April, July and October. The mole fraction is averaged over 2011–2012. Vertical bars represent the standard deviations.
Figure 8.
Average monthly CO2 mole fraction at Zhongshan Station and the time sequence of its maximum and minimum values indicated by the red/blue lines (2010 through 2013). The vertical bars stand for the amplitude of CO2 mole fractions variability of every month, which is higher in the austral summer.
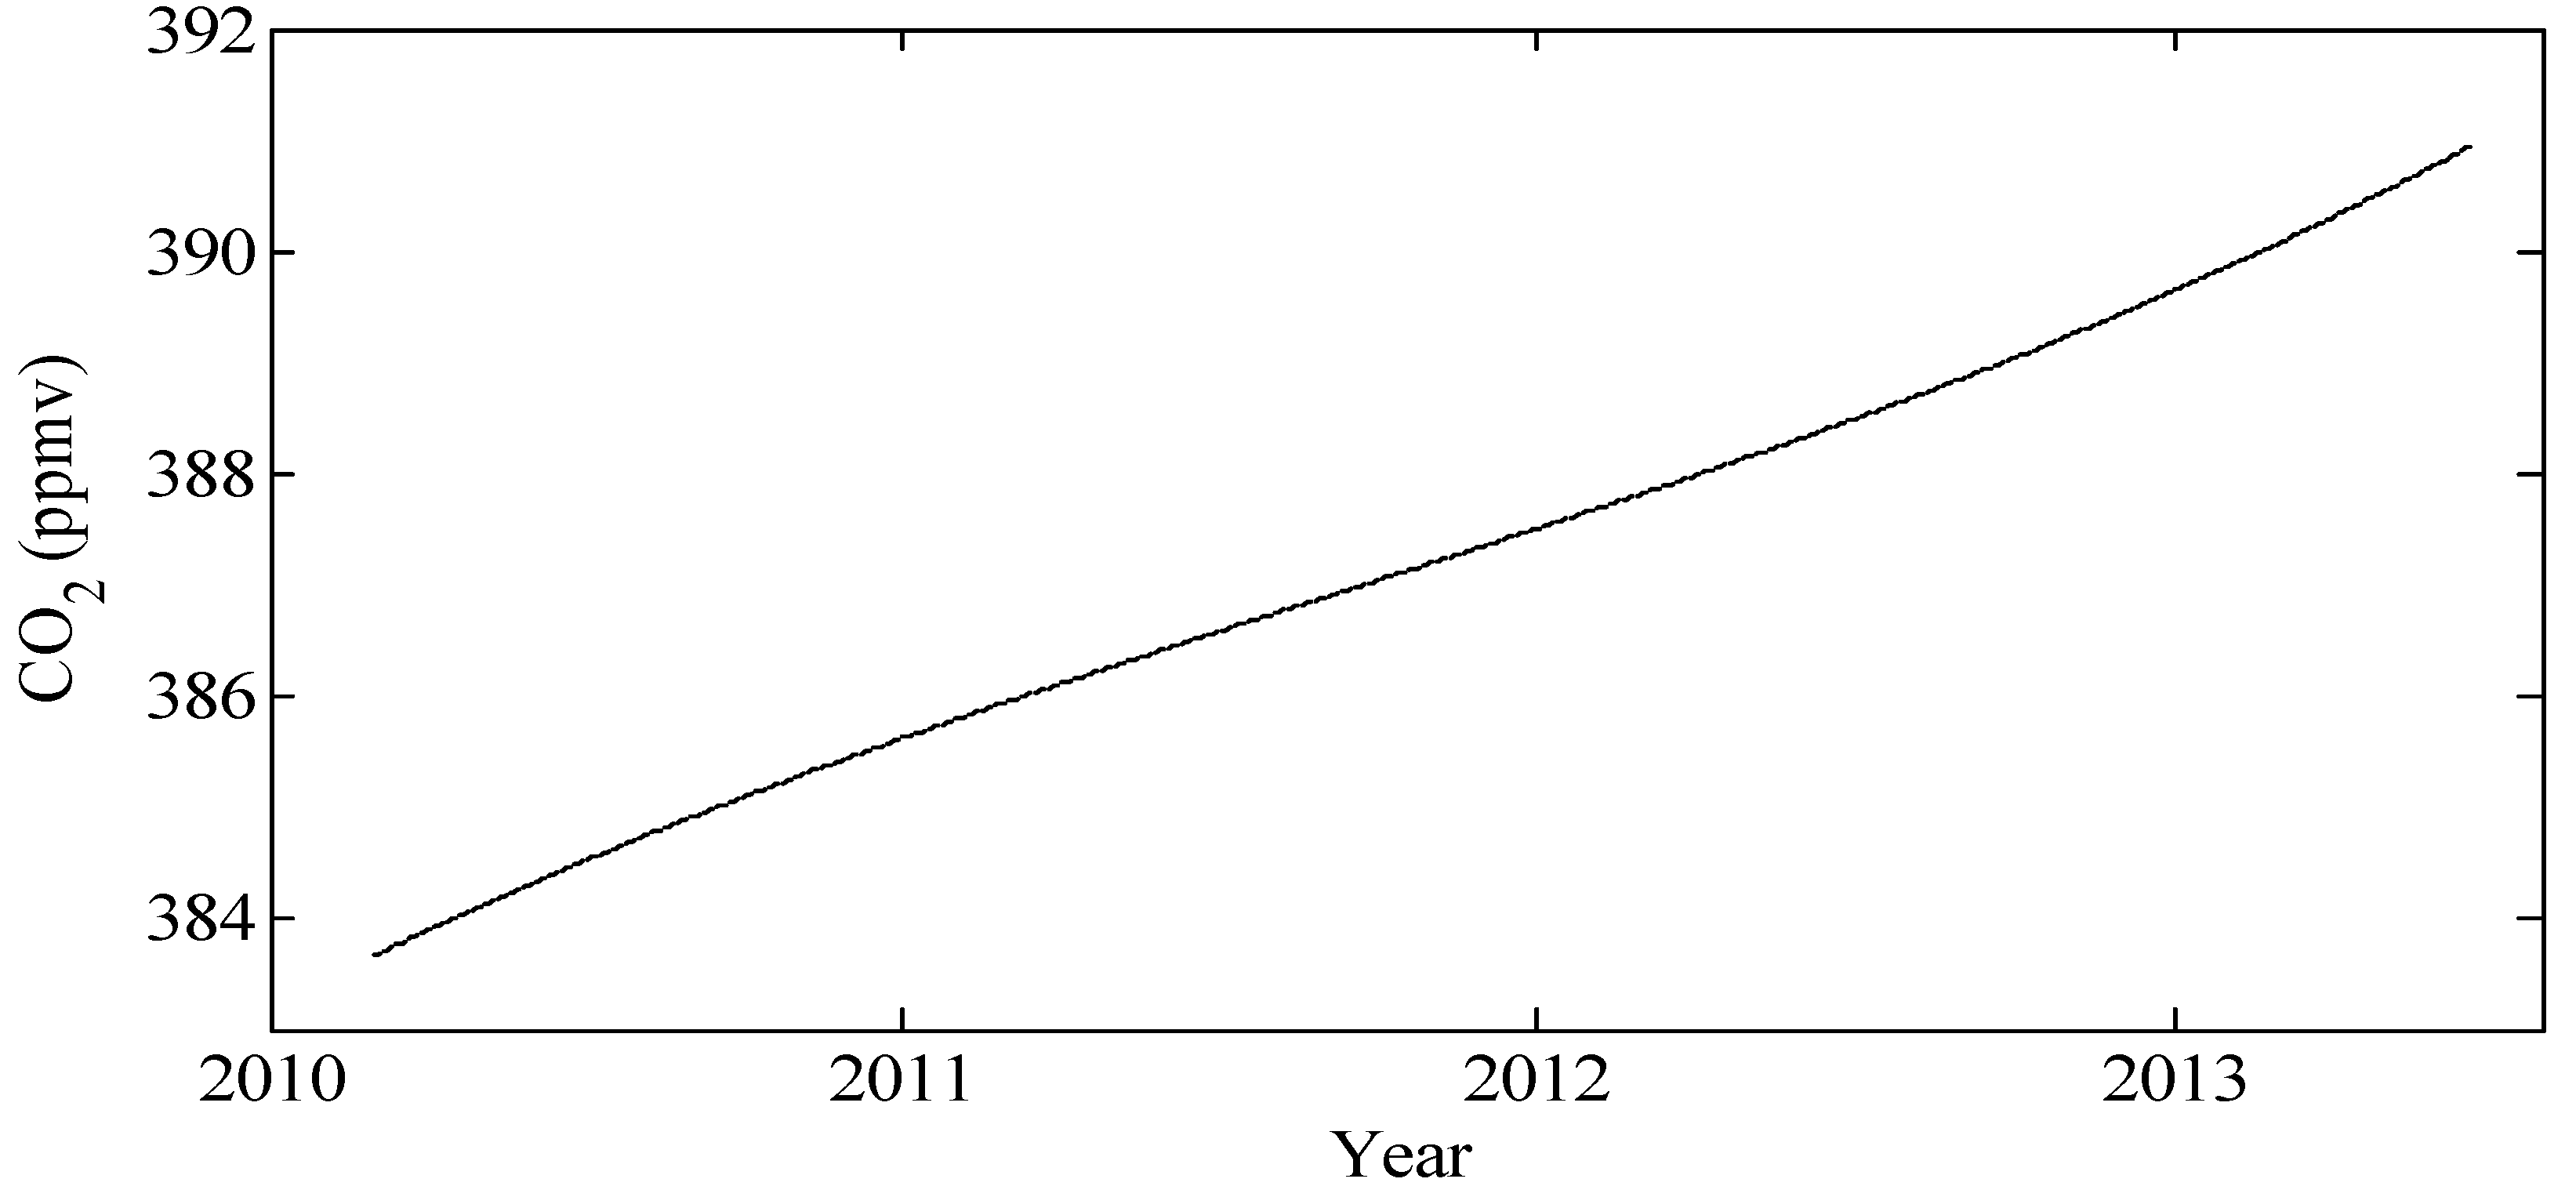
In order to separate the long-term trend from the data set after processing, a digital filtering technique was applied to the daily mean CO
2 data to obtain the curve fit. Details of this fitting procedure have been presented by Nakazawa
et al. [
28].
Figure 9 shows the long-trend of the CO
2 mole fraction at Zhongshan Station from 2010 through 2013. It can be seen that the CO
2 mole fraction increased year by year from about 384 µmol∙mol
−1 in 2010 to 393 µmol∙mol
−1 in 2013.
Figure 9 shows the upward trend of CO
2 mole fraction during 2010 through 2013. To analyze the trend of CO
2 mole fraction in different seasons,
Table 1 presents average mole fraction and increases in four seasons. In each season, the average mole fraction is increasing year-by-year; the increase in winter is the highest at 0.57% on average, followed by that in spring and autumn at 0.56%, and the rate in summer is the lowest at 0.50%. The data presented in
Table 1 initially suggest that the mole fraction of CO
2 measured at Zhongshan Station is increasing annually at an accelerating rate.
Figure 9.
Long-term trend (dotted line) of the CO2 mole fraction at Zhongshan Station (2010 through 2013).
Figure 9.
Long-term trend (dotted line) of the CO2 mole fraction at Zhongshan Station (2010 through 2013).
Table 1.
Average CO2 mole fraction (µmol∙mol−1; upper portion of the graph) and increase (lower portion of the graph) in four Seasons at Zhongshan Station.
Table 1.
Average CO2 mole fraction (µmol∙mol−1; upper portion of the graph) and increase (lower portion of the graph) in four Seasons at Zhongshan Station.
| Year | Spring | Summer | Autumn | Winter |
|---|
| 2010 | 387.32 | 384.86 | 384.94 | 386.30 |
| 2011 | 388.93 | 386.56 | 386.86 | 387.90 |
| 2012 | 391.20 | 388.66 | 388.87 | 390.17 |
| 2013 | 393.87 | 390.99 | 391.45 | 392.95 |
| 2010–2011 | 0.42% | 0.44% | 0.50% | 0.41% |
| 2011–2012 | 0.58% | 0.46% | 0.52% | 0.58% |
| 2012–2013 | 0.68% | 0.60% | 0.66% | 0.71% |
In order to evaluate the representativeness of data observed on-line at Zhongshan Station, data of different stations from the World Data Centre for Greenhouse Gases (WDCGG)) [
29] have been compared as presented in
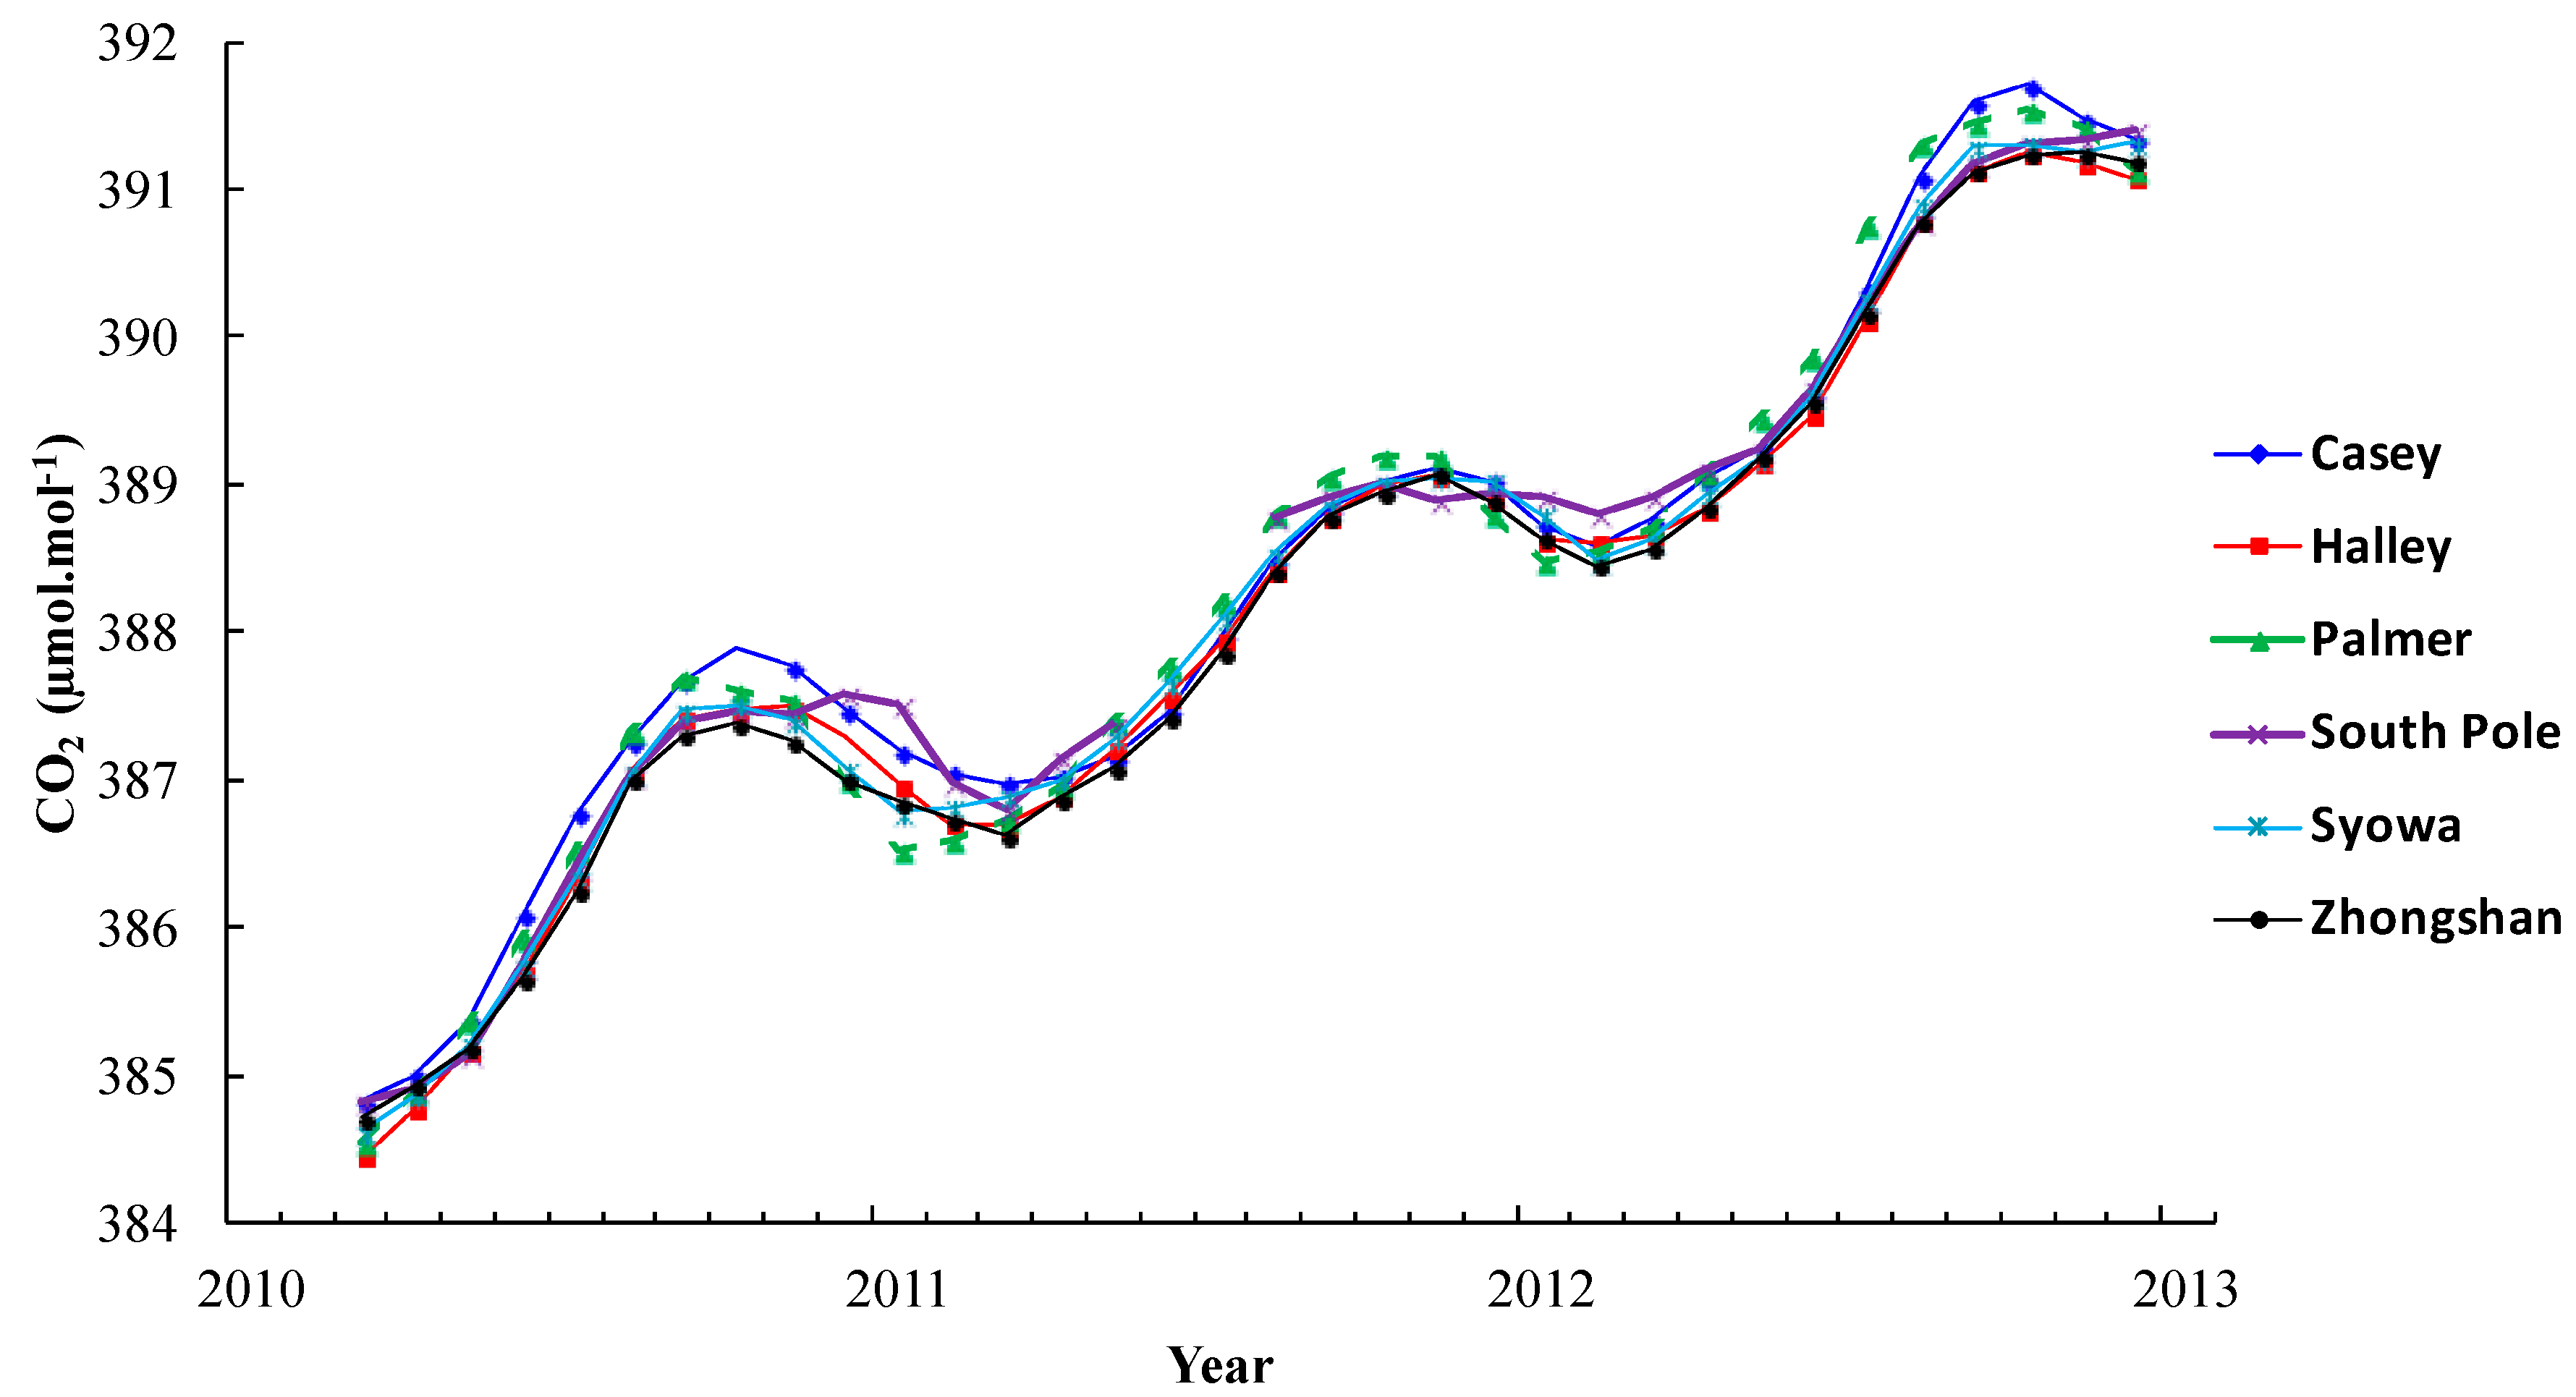
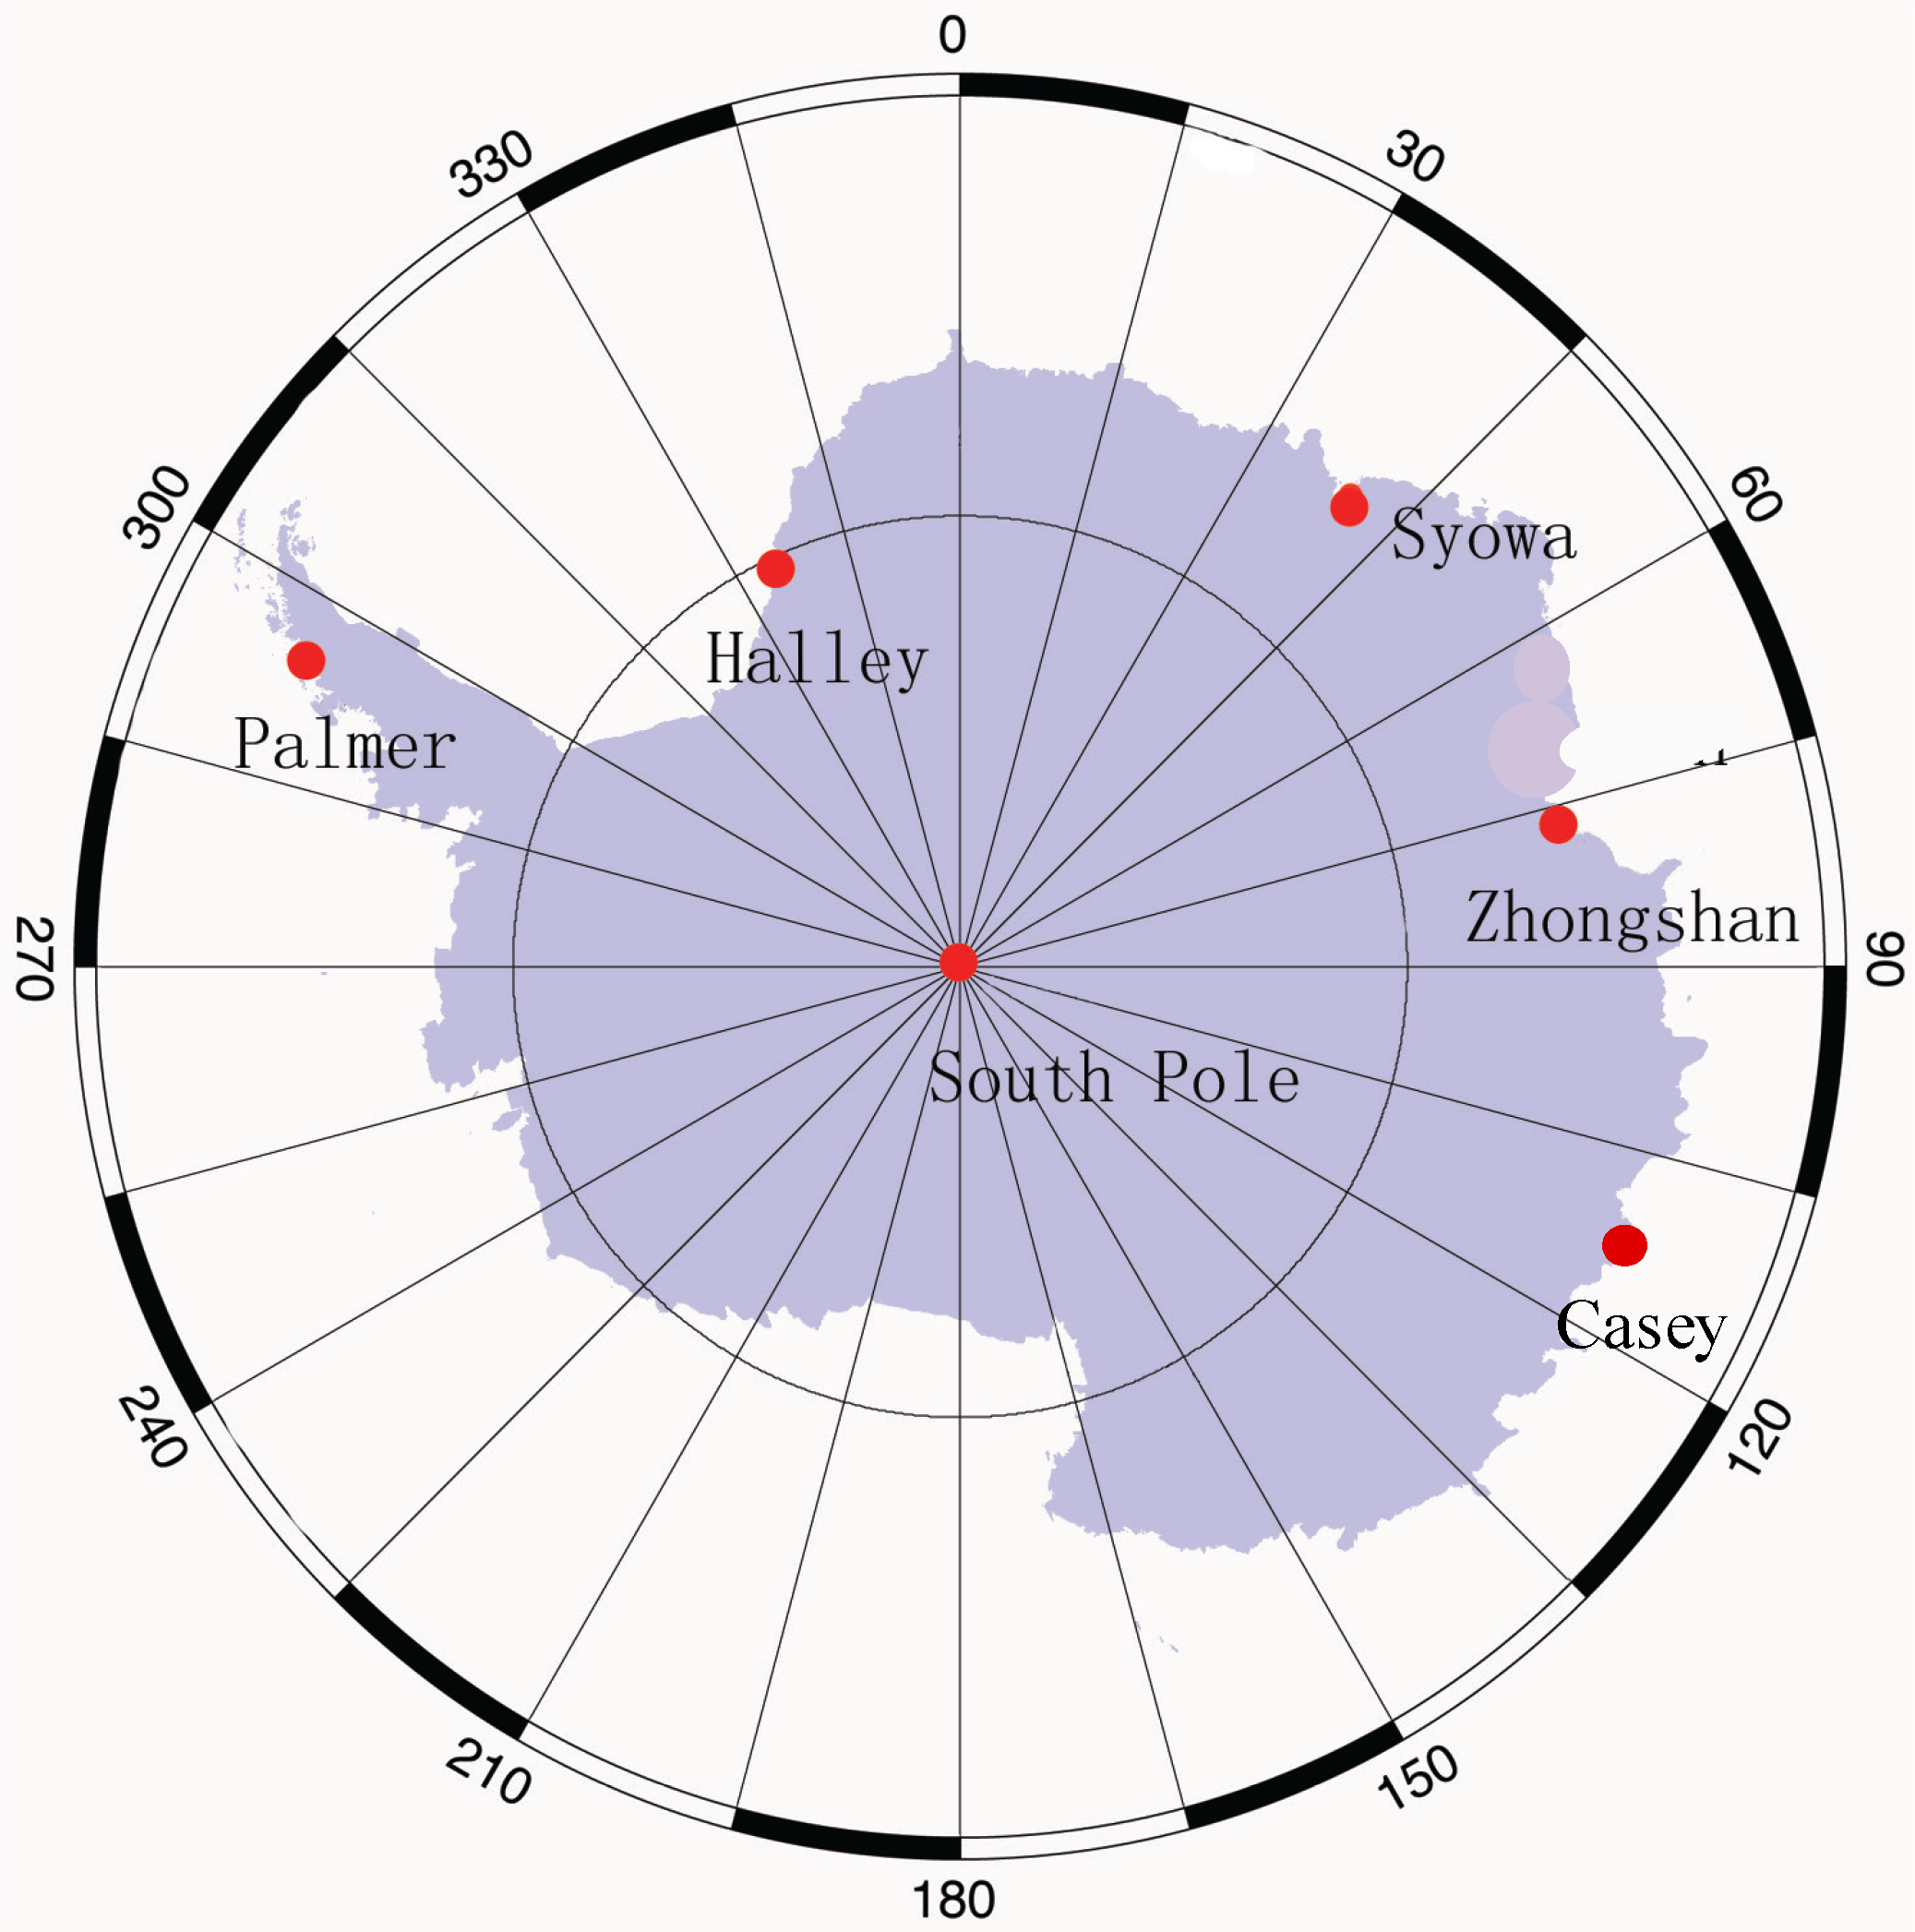
Figure 10. The selected stations are Casey (66.28°S, 110.53°E), Syowa (69°S, 39.6°E), Palmer (64.92°S, 64°W), South Pole (90°S, 24.8°W) and Halley (75.6°S, 26.5°W). Their geographic locations are shown in
Figure 1. Flask sampling and subsequent lab analysis are used to obtain the data for these five stations from 2010 through 2012. The monthly means derived from
in situ measurements are more precise [
30,
31].
It can be seen from
Figure 10 that CO
2 mole fractions observed at Zhongshan Station are quite similar to those measured at other stations around Antarctica; station records show similar ranges, all falling between 384 and 392 µmol∙mol
−1. The peak of CO
2 mole fraction is at Casey Station (391.7 µmol∙mol
−1) and the maximum at Zhongshan Station is 391.3 µmol∙mol
−1 while the lowest value occurs at Halley Station (384.5 µmol∙mol
−1) and the minimum at Zhongshan Station is 384.7 µmol∙mol
−1.
Table 2 shows that the difference in average annual CO
2 mole fraction between each station is less than 1 µmol∙mol
−1, and the interannual variation of all stations presents a clear upward trend of 1.5–2.2 µmol∙mol
−1∙yr
−1, indicating that there is little difference in spatial distribution of CO
2 mole fractions in the Antarctic area. The average annual mole fraction and increase of CO
2 at Zhongshan Station are close to those at other stations, suggesting that CO
2 data at this station is representative of the background characteristics of atmospheric composition in Antarctica.
Figure 10.
Time sequence of average monthly CO2 mole fraction at each CO2 monitoring station in Antarctica.
Figure 10.
Time sequence of average monthly CO2 mole fraction at each CO2 monitoring station in Antarctica.
Table 2.
Average annual CO2 mole fraction (µmol∙mol−1; upper) and its increase at each station (lower).
Table 2.
Average annual CO2 mole fraction (µmol∙mol−1; upper) and its increase at each station (lower).
| Year | Casey | Palmer | South Pole | Halley | Syowa | Zhongshan |
|---|
| 2010 | 386.61 | 386.44 | 386.40 | 386.31 | 386.33 | 386.27 |
| 2011 | 387.95 | 387.94 | 388.04 | 387.95 | 387.92 | 387.80 |
| 2012 | 390.14 | 390.14 | 390.08 | 390.12 | 389.99 | 389.92 |
| 2010–2011 | 1.54 (0.40%) | 1.50 (0.39%) | 1.64 (0.42%) | 1.64 (0.40%) | 1.59 (0.41%) | 1.53 (0.40%) |
| 2011–2012 | 2.19 (0.56%) | 2.20 (0.57%) | 2.04 (0.53%) | 2.17 (0.53%) | 2.07 (0.54%) | 2.12 (0.55%) |


