Article

Regional Air Quality Model Application of the Aqueous-Phase Photo Reduction of Atmospheric Oxidized Mercury by Dicarboxylic Acids

by
Jesse O. Bash
1,*,
Annmarie G. Carlton
2,
William T. Hutzell
1 and
O. Russell Bullock Jr.
1
1
National Exposure Research Laboratory, US Environmental Protection Agency, Research Triangle Park, NC 27711, USA
2
Department of Environmental Sciences, Rutgers University, New Brunswick, NJ 08903, USA
*
Author to whom correspondence should be addressed.
Atmosphere 2014, 5(1), 1-15; https://doi.org/10.3390/atmos5010001
Submission received: 27 October 2013 / Revised: 23 November 2013 / Accepted: 5 December 2013 / Published: 20 December 2013
(This article belongs to the Special Issue Atmospheric Mercury)

Abstract

:
In most ecosystems, atmospheric deposition is the primary input of mercury. The total wet deposition of mercury in atmospheric chemistry models is sensitive to parameterization of the aqueous-phase reduction of divalent oxidized mercury (Hg2+). However, most atmospheric chemistry models use a parameterization of the aqueous-phase reduction of Hg2+ that has been shown to be unlikely under normal ambient conditions or use a non mechanistic value derived to optimize wet deposition results. Recent laboratory experiments have shown that Hg2+ can be photochemically reduced to elemental mercury (Hg) in the aqueous-phase by dissolved organic matter and a mechanism and the rate for Hg2+ photochemical reduction by dicarboxylic acids (DCA) has been proposed. For the first time in a regional scale model, the DCA mechanism has been applied. The HO2-Hg2+ reduction mechanism, the proposed DCA reduction mechanism, and no aqueous-phase reduction (NAR) of Hg2+ are evaluated against weekly wet deposition totals, concentrations and precipitation observations from the Mercury Deposition Network (MDN) using the Community Multiscale Air Quality (CMAQ) model version 4.7.1. Regional scale simulations of mercury wet deposition using a DCA reduction mechanism evaluated well against observations, and reduced the bias in model evaluation by at least 13% over the other schemes evaluated, although summertime deposition estimates were still biased by −31.4% against observations. The use of the DCA reduction mechanism physically links Hg2+ reduction to plausible atmospheric processes relevant under typical ambient conditions.

1. Introduction

Current atmospheric mercury ambient concentrations are enriched by approximately a factor of three, due to centuries of mining operations using the element and emissions from fossil fuel combustion and industrial processes [1]. When mercury is deposited from the atmosphere, it can be converted into methylated mercury compounds in aquatic and terrestrial systems [2,3]. The primary vector of human mercury exposure is consuming fish with elevated levels of methylmercury, which can results in neurological damage and other health problems [2]. Bioaccumulation of methylmercury by piscivorous and insectivorous wildlife has been shown to adversely damage their nervous, excretory and reproductive systems [4].
Deposition of atmospheric mercury largely depends on its oxidation state. The atmospheric lifetime of gaseous elemental mercury (Hg°g) is on the order of one year making it a global pollutant [5,6]. Oxidized mercury is more water soluble and reactive than Hg°g and particulate bound mercury (PHg) is readily scrubbed by precipitation [6,7]. Oxidized gaseous (Hg2+g) and PHg mercury have an atmospheric lifetime on the order of a few days to weeks [8]. Hg2+g and PHg are emitted to the atmosphere by a number of industrial activities [9]. Emitted Hg°g can be oxidized to produce Hg2+g and PHg compounds [5]. Gas-phase oxidation mechanisms effectively determine the rate at which Hg°g in the global background pool deposits, while the Hg2+ reduction mechanisms, primarily in the aqueous-phase (e.g., cloud droplets), determine how much of the emitted Hg2+g and PHg are not regionally deposited and added to global background pool of Hg°g.
Air quality models are the primary tools used to estimate how sources of atmospheric mercury deposit to sensitive aquatic and terrestrial ecosystems on regional to global scales. For these models to accurately estimate wet deposition and atmospheric concentrations, precipitation, mercury oxidation, reduction and partitioning to the particle and aqueous-phases must be accurately simulated. Model gas and aqueous chemistry are then critical to determine what fraction of deposited mercury comes from local regions and from the global background, while simulated precipitation determines the rate at which Hg2+g and PHg are scavenged from the atmosphere. Because atmospheric models over-predict mercury wet deposition without aqueous-phase reduction [10], aqueous-phase atmospheric reduction mechanisms for Hg2+ have been proposed [11,12,13,14]. A viable mechanism in regional and global models is needed to inform air-quality managers and policy makers with the best estimate of regional and global contributions to mercury deposition, the subsequent human and ecosystem exposure to MeHg and how the in changes chemical composition of the atmosphere may alter mercury deposition.
Many air quality models (AQMs) that simulate mercury fate and transport use the aqueous-phase reduction of divalent oxidized mercury (Hg2+aq). Some use reactions with the hyroperoxyl radical (HO2) as the major reduction pathway of oxidized mercury [13,15]. Others use an aqueous-phase Hg2+ reduction rate scaled to match the estimated lifetime and seasonality of total gaseous mercury [16]. The aqueous-phase HO2 reduction mechanism has been shown to be unlikely under normal environmental conditions [17]. Empirical aqueous-phase reduction schemes balance the gas-phase oxidation and emission sources of Hg2+g and may mask errors in the model chemistry, simulated precipitation, and/or emissions and may not capture changes in the Hg atmospheric chemistry due to emissions regulations or changes in atmospheric composition. Given that the aqueous reduction significantly controls the fate and transport of atmospheric mercury and that the current mechanisms have problems regarding model performance, a more physically plausible mechanisms is needed [10,15]. Photoreduction of HgCl2 by dissolved organic acids has been reported in laboratory studies [11,13]. An atmospherically relevant mechanism has been demonstrated in laboratory experiments where C2-C4 dicarboxylic acids (DCAs) (oxialic, malonic and succinic acids) can readily complex with Hg2+aq to form Hg° in low O2 and Cl conditions [11]. Dicarboxylic acids demonstrated to reduce Hg are ubiquitous in the Earth’s environment and are predicted to dominate DOC in cloud water [18,19]. In this study, the HO2-Hg2+ reduction mechanism, a new DCA reduction mechanism proposed by Si and Ariya [11] using a rate of 1.2 × 10⁴ M−1∙s−1, and no aqueous-phase reduction (NAR) of Hg2+ are evaluated against weekly wet deposition totals, concentrations and precipitation observations from the Mercury Deposition Network (MDN) [20] using the Community Multiscale Air Quality (CMAQ) model version 4.7.1 [5,21].

2. Results and Discussion
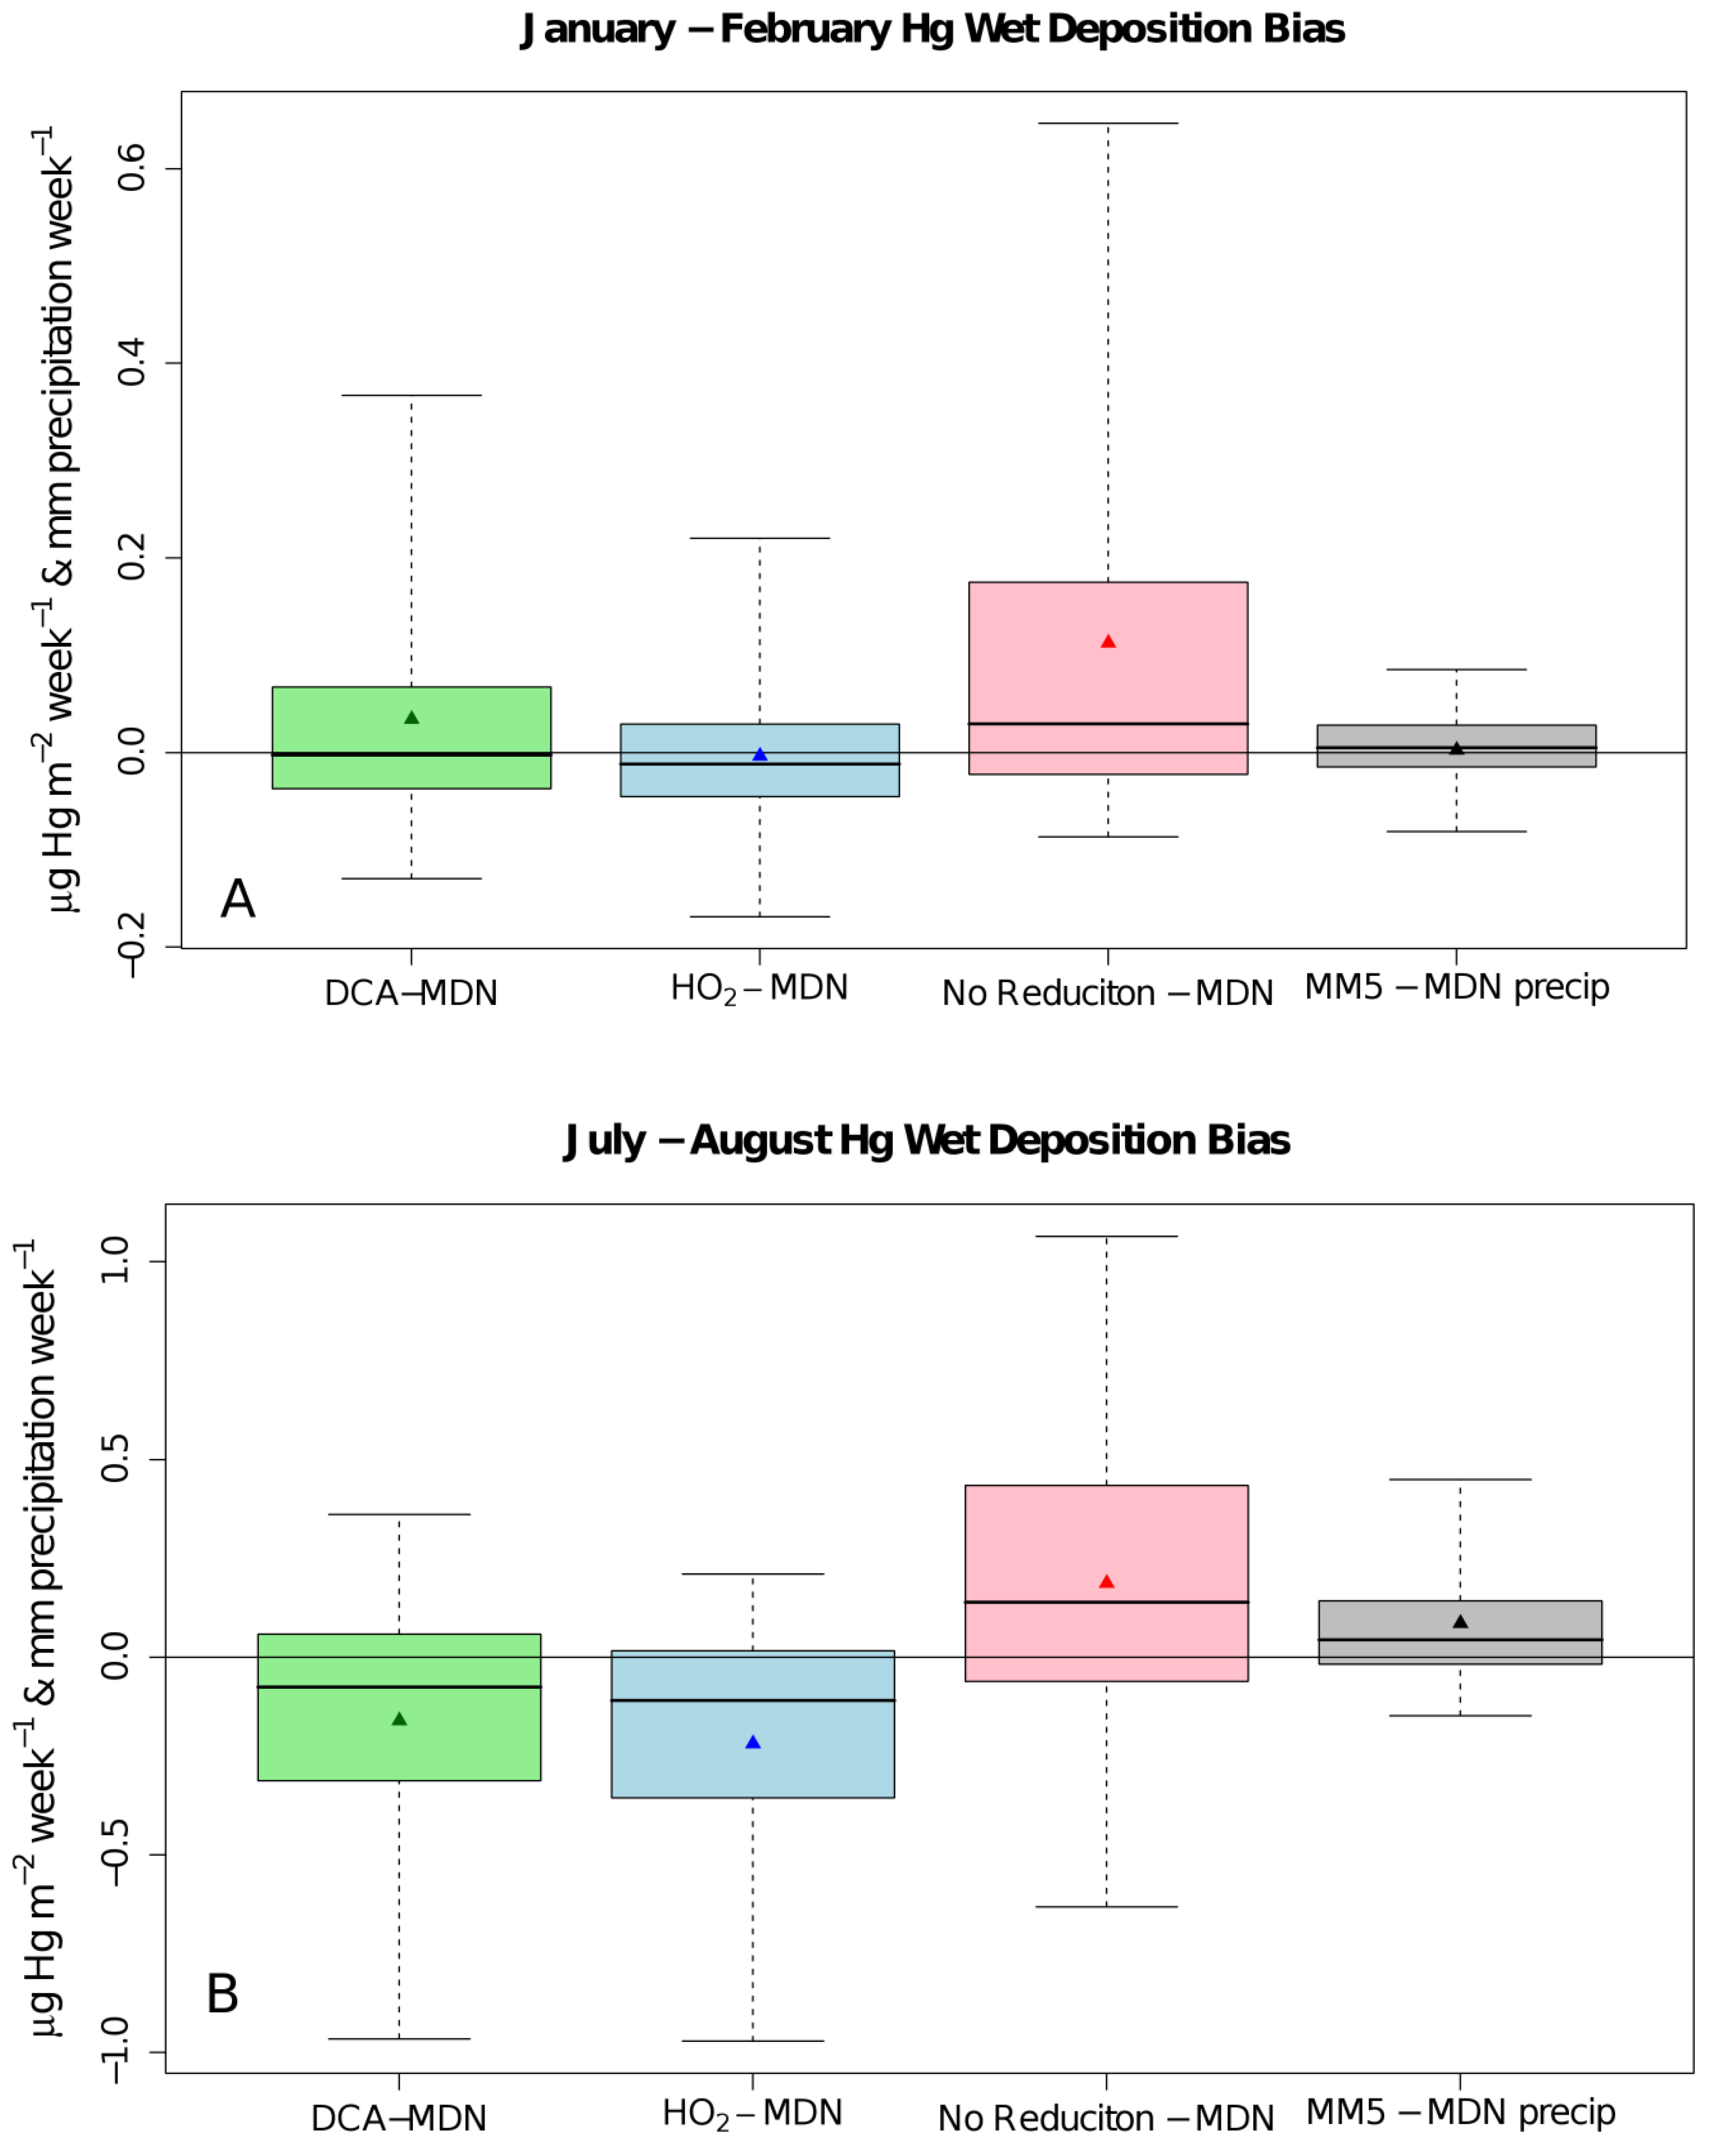
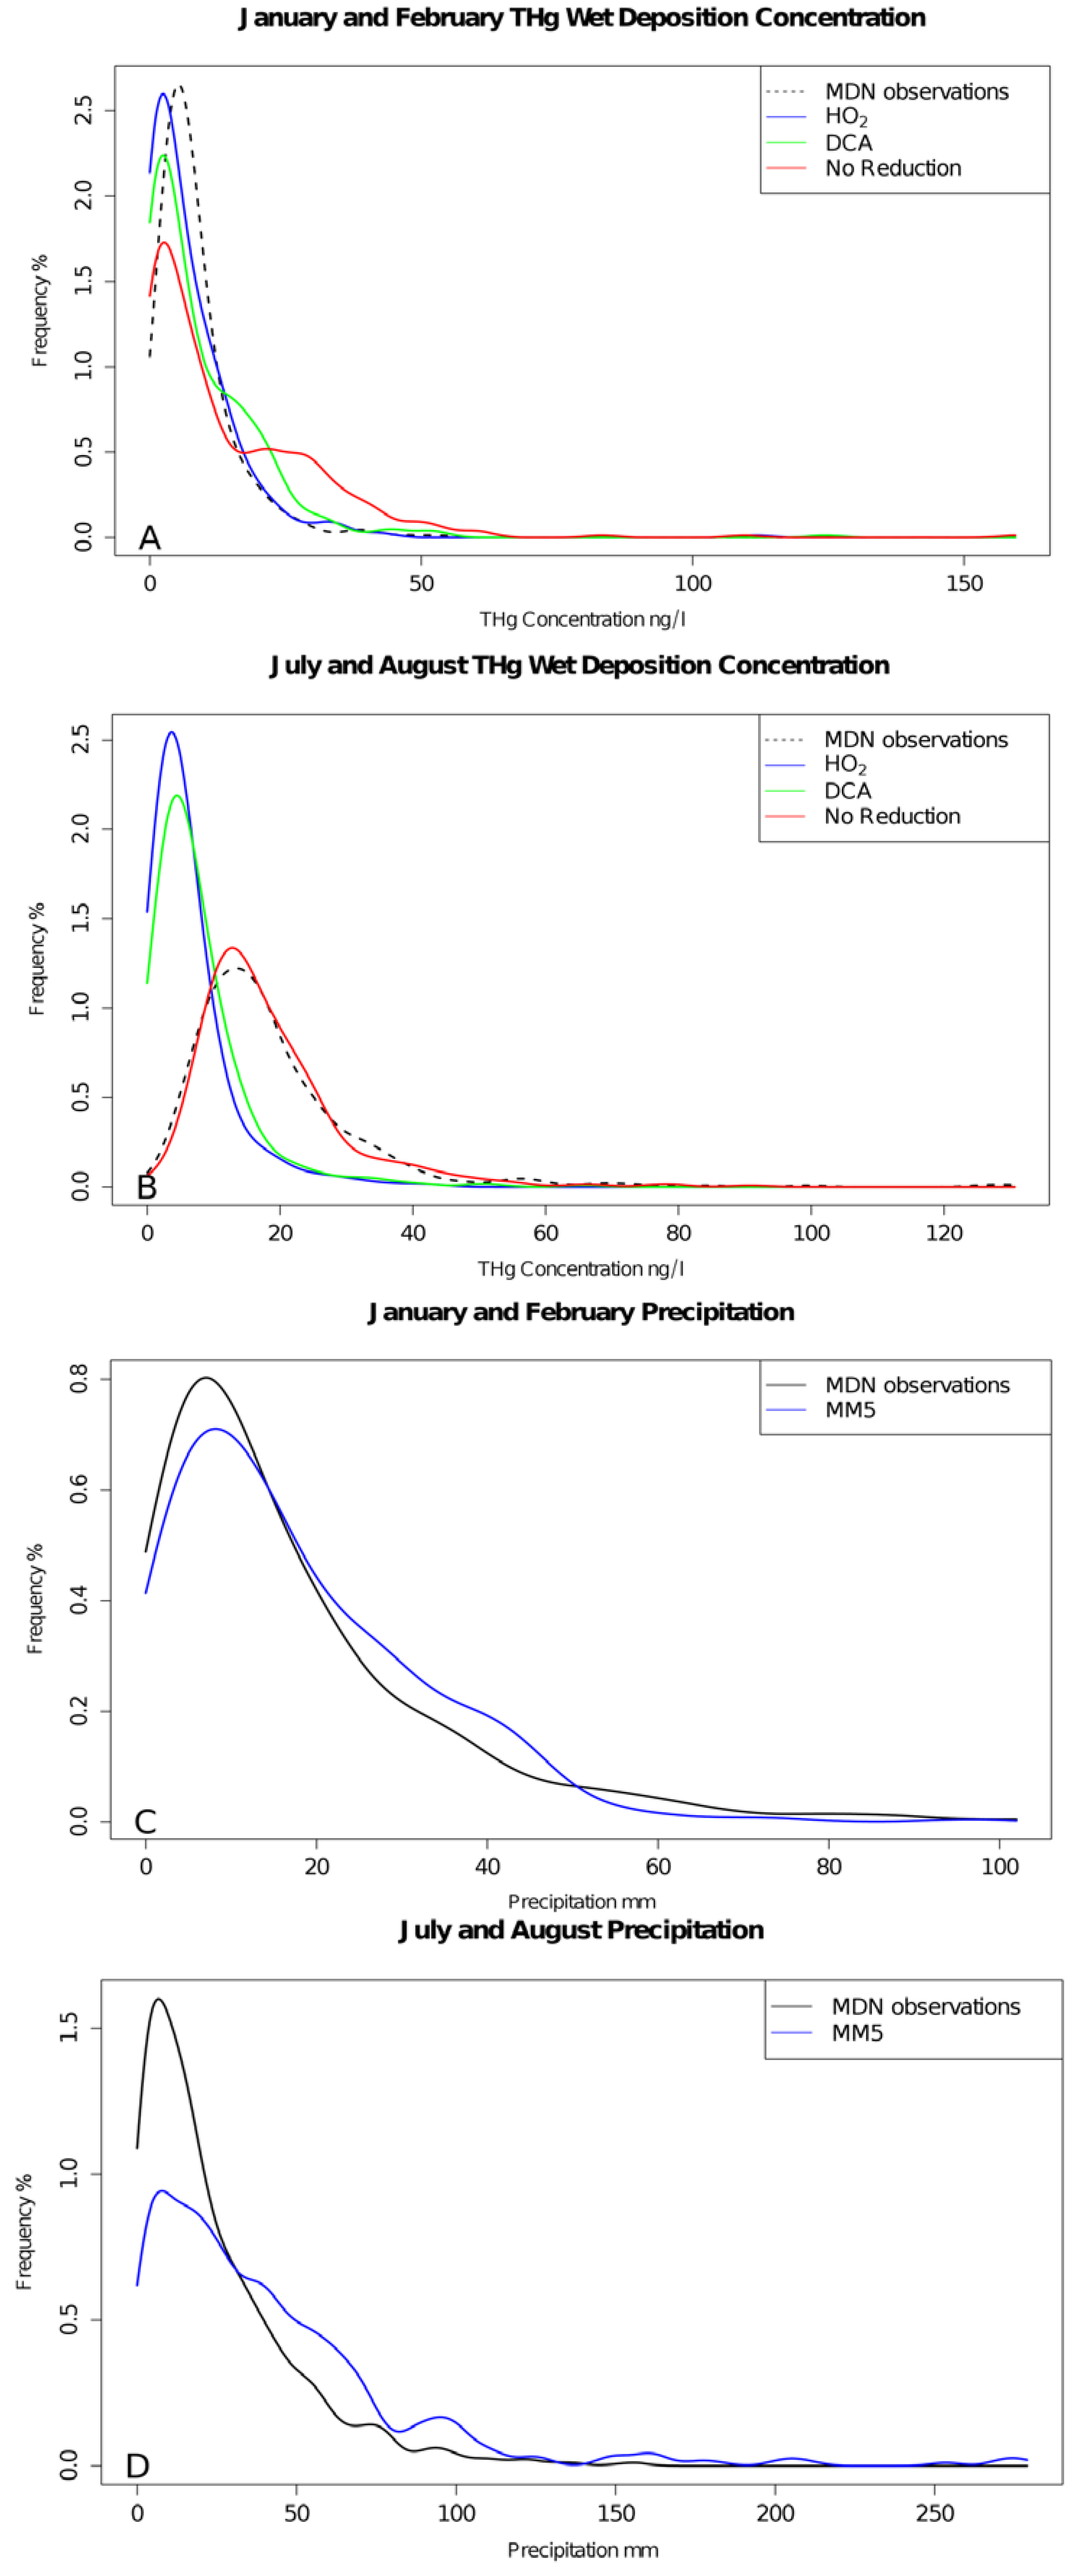
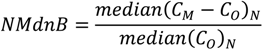
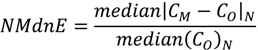
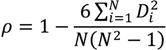
During the winter (January and February) and summer (July and August) simulations, the DCA reduction mechanism reduced the median model total mercury wet deposition bias by 13.2% and 14.3% when compared to the HO2 case and by 39.4% and 25.9% for the NAR case for winter and summer simulations respectively (Figure 1). The NAR case led to normalized median model over-predictions of 53.4% and 43.7% in the summer and winter simulations respectively similar to Pongprueksa et al. [10] (Table 1). DCA and NAR case model simulations overestimated the wintertime wet deposition along the Gulf Coast (Figure 2). However, modeled wet deposition estimates in summer around the Gulf Coast were improved in the DCA case and were similar to the HO2 case at other MDN sites (Figure 3). The NAR case over-predicted mercury wet deposition in the winter simulation by 43.7% while the DCA and HO2 mechanism underestimated the wet deposition by −4.3% and −17.5% respectively (Table 1, Figure 1). The NAR case over-predicted the observed deposition in the winter by 43.7% with the largest over-predictions at coastal sites and in the Southeast and in the Ohio River Valley (Figure 2). Similarly, the DCA case overestimated the wet deposition along the Gulf Coast in the winter which also corresponded to a more frequent distribution of higher Hg concentrations in precipitation at those sites (Figure 2). This may be explained by elevated Hg2+g concentrations above the marine boundary layer in the southern boundary conditions of this simulation as documented by Myers et al [22]. The normalized median error (NMdnE) in the winter DCA (69.4%) and HO2 (61.5%) simulation cases were similar in magnitude but the model bias and Spearman rank correlation coefficient were improved (Table 1). Both summer and winter simulations using DCA reduction correlated better with the observations than using the HO2 reduction (Table 1). The improved correlation was largely due to better capturing the observed deposition in the Southeast and Gulf Coast.
Figure 1. Boxplots of the Community Multiscale Air Quality (CMAQ) modeled bias in the Hg wet deposition and precipitation compared to mercury deposition network (MDN) observations using the DCA (green), HO2 (blue), and NAR (red) cases and the MM5 precipitation (grey) for January and February 2002 (A) and July and August 2002 (B). The horizontal line through each box is the median bias, the box contains the 25% to 75% and the whiskers extend to the 5th and 95th percentile of the biases, and the triangle is the mean bias.
Atmosphere 05 00001 g001
Figure 2. CMAQ January and February 2002 wet deposition with MDN observations (points) for the HO2 aqueous-phase reduction case (A), the DCA reduction case (B), NAR (C), and a map of the precipitation (D). Note, only the MDN measurement sites that had a complete set of observations over the two-month period were plotted.
Atmosphere 05 00001 g002
Table 1. Spearman’s rank correlation coefficient (ρ), median bias (MdnB), median error (MdnE), normalized median bias (NMdnB), and normalized median error (NMdnE) of the MM5 modeled precipitation and CMAQ Hg wet deposition for total wet deposition, weekly (n = 372 in January-February, n = 420 in July-August) compared to MDN observations.
ρMdnBMndENMndBNMndE
MM5
Precipitation
January–February0.8071.0 mm∙week−14.5 mm∙week−17.2%33.2%
July–August0.4248.5 mm∙week−116.2 mm∙week−153.4%98.9%
No
Reduction
January–February0.58629 ng∙m−2∙week−161 ng∙m−2∙week−143.7%91.8%
July–August0.338138 ng∙m−2∙week−1269 ng∙m−2∙week−157.3%111.3%
HO2
Reduction
January–February0.570−12 ng∙m−2∙week−141 ng∙m−2∙week−1−17.5%61.5%
July–August0.241−110 ng∙m−2∙week1163 ng∙m−2∙week−1−45.7%67.5%
DCA
Reduction
January–February0.586−3 ng∙m−2∙week−146 ng∙m−2∙week−1−4.3%69.4%
July–August0.252−76 ng∙m−2∙week−1175 ng∙m−2∙week−1−31.4%72.3%
Figure 3. CMAQ July and August 2002 wet deposition with MDN observations (points) for the HO2 aqueous-phase reduction case (A), the DCA reduction case (B), NAR case (C), and a map of the precipitation (D). Note, only the MDN measurement sites that had a complete set of observations over the two-month period were plotted.
Atmosphere 05 00001 g003
Simulated intensity, duration and quantity of precipitation influences estimated wet deposition and the concentration of Hg in precipitation. The impact of the weekly precipitation quantity and weekly mean MDN and modeled Hg concentration (μg∙m−3) in the precipitation can be explored using MDN observations. MM5 precipitation estimates were relatively unbiased in the wintertime simulation (Figure 4). In the summer simulations, the bias was reversed by over-predicting the frequency of weeks with high precipitation and under-predicting the frequency of weeks with lower precipitation. The distribution of modeled Hg concentrations did not follow precipitation distributions in the summertime simulations except for the NAR case indicating that the HO2 and DCA reduction cases may be too fast. Summer distributions of modeled concentrations were similar in the NAR case but did not correlate well (Pearman’s r = 0.113; Spearman’s rank correlation coefficient ρ = 0.060; N = 420) with the observations indicating that the distribution of concentrations over the domain was captured well but did not exhibit spatial or temporal patterns similar to the observations (Figure 4). Caution should be taken with the analysis of the probability distributions presented in Figure 4 because any given weekly sample may be an average of several events.
CMAQ captures the seasonal and spatial variability of SOA well but has a known negative bias of approximately 40% during the summer months and DCA is cloud-formed SOA [23]. Cloud formed SOA precursors are likely under-predicted because recently identified water-soluble VOC precursors (e.g., glycoaldehyde [24] and methylacrolein [25]) are not included in SOA mechanism. Assuming that the bias in total SOA is proportional to cloud SOA precursors, a model sensitivity test was run where cloud SOA precursor concentrations were doubled for the July-August and January–February cases. A 100% increase in the DCA concentrations resulted in a 20% reduction and an 8% reduction in total wet deposition in the July–August and January–February cases respectively. The existing model bias was −45.7% and −4.3% and this sensitivity increased the model bias by 6 and 40 ng∙m−2∙week−1 for the July–August and January–February cases respectively. Thus, “fixing” the ~40% underpredicted SOA (assuming a proportional ~40% increase in DCA) during the summer months resulted in wet deposition estimates similar to the HO2 case in the summer and winter when using the DCA aqueous-phase reduction scheme. However, this sensitivity did not include the other changes in the atmospheric composition that would accompany a 40% increase in SOA. The DCA and HO2 reduction mechanisms underpredicted the summer wet deposition observations and this seasonal model bias may be a result of another component of CMAQ’s mercury chemical mechanism, the model boundary conditions, emissions, aqueous-phase oxidation if intermediate reduction products by O2 occur, or gas-phase chemistry. The HO2 reduction case (the most rapid aqueous-phase reduction parameterization in the modeled sensitivities) shifted the probability distribution of average weekly aqueous-phase concentrations towards smaller concentrations than the slower mechanisms in all cases (Figure 4). This indicates that both reduction mechanisms may reduce too much Hg2+aq in the warm months if the emissions of mercury species, modeled oxidant concentrations and the gas-phase chemistry are correct.
Recent modeling studies using CMAQ and CAMx have documented biases in modeled Hg2+g and PHg concentrations [26,27]. Some of these biases may originate with Hg2+g underestimation of the measurements due to its affinity for KCl coated quartz denuder surfaces [28,29,30] and release in the presence of ozone [31]. However, it is important to quantify the impact that these aqueous-phase reduction mechanisms have on ambient Hg species. During the wintertime simulations, the DCA reduction mechanism increased domain wide median Hg°, Hg2+g and PHg ambient concentrations by 0%, 6% and 7% respectively while the NAR case increased domain wide median Hg2+g and PHg ambient concentrations by −1%, 12% and 17% respectively over the HO2 mechanism. During the summertime simulations where both Hg oxidant and DCA concentrations are higher, increased domain wide median Hg°, Hg2+g and PHg ambient concentrations by −1%, 8% and 5% respectively while the NAR case increased domain wide median Hg2+g and PHg ambient concentrations by −5%, 42% and 54% respectively over the HO2 mechanism. The replacement of the HO2 with the DCA reduction mechanism did not result in large increases in ambient Hg2+g or PHg concentrations while the removal of the aqueous-phase reduction mechanism resulted in elevated Hg2+g and PHg concentrations.
Figure 4. Distribution of the weekly observed (black dashed line), HO2 (blue), DCA (green) and NAR (red) cases for January and February simulations (A), July and August simulations (B), and for weekly observed (black) and modeled (blue) precipitation for January and February (C), and July and August (D).
Atmosphere 05 00001 g004
The improvements in model performance presented here may be influenced by areas of uncertainty in gas-phase or heterogeneous Hg chemistry. The aqueous reduction of Hg2+ by HO2 in air-quality models is likely overestimated [32] and this could mask potential errors in Hg° oxidation rates, Hg2+ emissions, and/or missing in-plume chemistry. A detailed review of Hg gas-phase chemistry is beyond the scope of this manuscript; however, in-plume reduction of Hg2+ is briefly discussed here. Currently, there are no mechanistic chemical mechanisms for in plume Hg2+ reduction and only empirical parameterizations have been applied in models [33]. In addition, there are recent observations that have indicated that Hg° was being oxidized in plume [34,35]. Due to the lack of supporting experimental data, contrasting in situ observations and broad uncertainties in the complex heterogeneous chemistry governing the potential Hg2+ reduction by SO2, the mechanisms of in-plume chemistry are unclear and the mechanistic parameterizations are not used in air-quality models [33,36]. As such the parameterization of in-plume chemistry is beyond the scope of this manuscript and was not considered in these sensitivity simulations.
The NAR case establishes that the model is sensitive to the aqueous reduction pathway as documented by Seignuer et al. [15] and Pongprueksa et al [10]. Similarities between the results from the HO2 and DCA mechanisms indicate that the HO2 mechanism may be a reasonable surrogate for reducing divalent mercury by DCA and may produce reasonable model wet deposition estimates. The DCA mechanism improved the predicted wet deposition for July and August by reducing the model bias and improving predicted spatial patterns shown by the Spearman’s rank correlation coefficient for all four months simulated (Table 1). The improvement in the July and August deposition estimates removed much of the HO2 deposition underestimation while being nearly unbiased in the January and February simulations. This will likely reduce the mercury wet deposition bias in annual simulations of mercury deposition with the DCA aqueous-phase reduction mechanism proposed by Si and Ariya [11].

3. Experimental Section

3.1. Application of an Aqueous-Phase Hg2+aq DCA Reduction Scheme in CMAQ

CMAQ’s aqueous chemistry mechanism was expanded to include organic reactions of glyoxal and methylglyoxal with OH to form cloud-produced SOA (SOAcld) [37]. Species represented by SOAcld include oxalic, malonic, and succinic acids, as well as other carboxylic acids and larger humic-like substances (i.e., organic compounds with oligomeric structure) demonstrated to form in aqueous-phase laboratory photooxidation experiments with glyoxal and methylglyoxal [38,39,40,41].
A rate constant for the reduction of Hg2+aq by oxalic acid was implemented in the aqueous chemistry module in CMAQ. The oxalic acid rate is highest among DCAs and is used as an upper bound for mercury reduction via cloud processing. Additionally, oxalic acid is the dominant product for glyoxal [39] and methylglyoxal [42] oxidation in clouds. In other atmospheric aqueous environments, oxalic typically dominates over other DCAs [43,44]. At a typical cloud contact time (~10 min [45]), the product yield of Hg° does not appear to be significantly different among the different rates presented by Si and Ariya [11].

3.2. CMAQ Model Simulations

Simulations were run for January and February 2002 with a spin-up period from December 22nd to the 31st 2001, and July and August 2002 with a spin up period from June 21st to the 30th. CMAQ version 4.7.1 configured with the carbon bond version 5 (CB05) chemical mechanism [46], version 5 of the aerosol model (AERO5) [23], in-line dry deposition, and 14 non-hydrostatic terrain-following vertical layers extending vertically to the 100 mb (~14 km) level was chosen as the base model. Initial and dynamic boundary conditions were provided from GEOS-Chem Hg [47]. Meteorological data were provided by the Penn Sate/NCAR fifth-generation mesoscale model (MM5) [48] with the P-X land surface scheme [49]. Anthropogenic Hg emissions estimates were used from version 3 of the 2002 EPA National Emissions Inventory (NEI, http://www.epa.goc/ttn/chief/net/critsummary.html) and mercury emissions from the recycling of deposited anthropogenic emissions and direct emissions from volcanoes and geologically enriched areas were estimated following Bullock et al. [50].
Three aqueous-phase Hg2+ reduction cases were tested: (1) the base case modeled the reduction of Hg2+aq by the HO2. radical as described in Pehkonen and Lin [13] and implemented in CMAQ version 4.6 [50], (2) the DCA case modeled the reduction of Hg2+aq by dicarboxylic acids (Hg2+aq + DCAaq + hv → Hg°aq) proposed by Si and Ariya [11] using a rate of 1.2 × 10⁴ M−1∙s−1, and (3) NAR case had no aqueous-phase reduction mechanism for Hg2+aq. Results of the three cases were evaluated against total mercury wet deposition measurements collected by the mercury deposition network (MDN) [20]. In 2002, there were few MDN monitors in operation in the Western US thus the evaluation presented here is primarily focused on the Eastern US. There were a total of 64 sites in operation in January and February with 372 valid weekly observations and 65 sites in July and August with 420 valid weekly observations. Model evaluation metrics used were the median bias (MdnB), normalized median bias (NMdnB), median error (MdnE), normalized median error (NMdnE), and Spearman’s rank correlation coefficient (ρ). The MdnB, MdnE, NMdnB, NMdnE, and ρ are defined as follows:
MdnB = median(CM - CO)N
MdnE = median|CM - CO|N
Atmosphere 05 00001 i001
Atmosphere 05 00001 i002
Atmosphere 05 00001 i003
where, CM and CO are the model and observed deposition values respectively, N is the total number of model and observation pairs, Di is the difference in ranks between the ith pair of deposition values. Note that in Equations (2) and (4) that estimate error, the vertical bars denote the absolute value between the model and observations. The median was chosen as the measure of central tendency and the Spearman’s rank correlation coefficient was used to assess the fit between the model simulations and observations. Wet deposition data are not normally distributed and metrics based off the median offer a more robust representation of these comparison metrics and are less sensitive to outliers [51]. All model evaluations were done with observations and model results paired in space and time for each weekly MND observation, the highest temporal resolution of the observations, as recommended by Simon et al. [52].

4. Conclusions

The HO2 aqueous-phase reduction mechanism is widely believed to be unlikely under normal environmental conditions [17,32,53]. These results from a more likely reduction mechanism, the DCA case, will be more useful and physically meaningful in future applications than applying tuned empirical reduction rates or a mechanism that is unlikely under typical ambient environmental conditions. Both aqueous-phase reduction mechanisms shift the distribution of weekly deposition towards smaller events. However, the aqueous-phase reduction mechanisms under-predict the large weekly deposition events in July and August due to an over-prediction of precipitation due to the dilution of the aqueous concentrations while over-predicting the frequency of small deposition events in January and February (Figure 4). Overall, the DCA case resulted in a reduction in the modeled Hg deposition biases and an increase in the model correlation over HO2 case without large increases in the surface level ambient concentrations. Considerable uncertainty exists in the gas-phase mercury chemistry, emissions and boundary conditions preventing a conclusive identification of the cause of the seasonal Hg wet deposition biases. Biases in our simulation may originate from missing the temporal dynamics in the emissions of Hg2+g and PHg. Alternatively, the reaction rate constants are missing a temperature dependence and so the Hg°g oxidation rates may be too fast in the cool seasons and aloft or the Hg°g oxidation mechanism may be incomplete. Recent annual simulations of CMAQ and GEOS-Chem compared to ambient speciated mercury observations indicate that the models are overestimating the fraction of oxidized gaseous mercury [26,54]. The sources of the seasonal biases should be further investigated.

Acknowledgments

Although this work was reviewed by EPA and approved for publication, it may not necessarily reflect official Agency policy. Mention of commercial products does not constitute endorsement by the Agency. This publication was supported in part by US EPA grant (83504101).

Conflicts of Interest

The authors declare no conflict of interest.

References and Notes

  1. Streets, D.G.; Devane, M.K.; Lu, Z.F.; Bond, T.C.; Sunderland, E.M.; Jacob, D.J. All-time releases of mercury to the atmosphere from human activities. Environ. Sci. Tech. 2011, 45, 10485–10491. [Google Scholar] [CrossRef]
  2. Sunderland, E.M.; Krabbenhoft, D.P.; Moreau, J.W.; Strode, S.A.; Landing, W.M. Mercury sources, distribution, and bioavailability in the North Pacific Ocean: Insights from data and models. Glob. Biogeochem. Cy. 2009, 23, GB2010. [Google Scholar]
  3. Goulet, R.R.; Holmes, J.; Page, B.; Poissant, L.; Siciliano, S.D.; Lean, D.R.S.; Wang, F.; Amyot, M.; Tessier, A. Mercury transformations and fluxes in sediments of a riverine wetland. Geochim. Cosmochim. Acta 2007, 71, 3393–3406. [Google Scholar] [CrossRef]
  4. Wolfe, M.F.; Schwarzbach, S.; Sulaiman, R.A. Effects of mercury on wildlife: A comprehensive review. Environ. Toxicol. Chem. 1998, 17, 146–160. [Google Scholar] [CrossRef]
  5. Lin, C.J.; Pongprueksa, P.; Lindberg, S.E.; Pehkonen, S.O.; Byun, D.; Jang, C. Scientific uncertainties in atmospheric mercury models I: Model science evaluation. Atmos. Environ. 2006, 40, 2911–2928. [Google Scholar] [CrossRef]
  6. Schroeder, W.H.; Munthe, J. Atmospheric mercury—An overview. Atmos. Environ. 1998, 32, 809–822. [Google Scholar] [CrossRef]
  7. Fain, X.; Obrist, D.; Hallar, A.G.; McCubbin, I.; Rahn, T. High levels of reactive gaseous mercury observed at a high elevation research laboratory in the Rocky Mountains. Atmos. Chem. Phys. 2009, 9, 8049–8060. [Google Scholar] [CrossRef]
  8. Selin, N.E. Global Biogeochemical Cycling of Mercury: A Review. Annu. Rev. Environ. Resour. 2009, 34, 43–63. [Google Scholar] [CrossRef]
  9. Pacyna, E.G.; Pacyna, J.M.; Steenhuisen, F.; Wilson, S. Global anthropogenic mercury emission inventory for 2000. Atmos. Environ. 2006, 40, 4048–4063. [Google Scholar] [CrossRef]
  10. Pongprueksa, P.; Lin, C.J.; Lindberg, S.E.; Jang, C.; Braverman, T.; Bullock, O.R.; Ho, T.C.; Chu, H.W. Scientific uncertainties in atmospheric mercury models III: Boundary and initial conditions, model grid resolution, and Hg(II) reduction mechanism. Atmos. Environ. 2008, 42, 1828–1845. [Google Scholar] [CrossRef]
  11. Si, L.; Ariya, P.A. Reduction of oxidized mercury species by dicarboxylic acids (C(2)–C(4)): Kinetic and product studies. Environ. Sci. Tech. 2008, 42, 5150–5155. [Google Scholar] [CrossRef]
  12. Van Loon, L.; Mader, E.; Scott, S.L. Reduction of the aqueous mercuric ion by sulfite: UV spectrum of HgSO3 and its intramolecular redox reaction. J. Phys. Chem. A 2000, 104, 1621–1626. [Google Scholar] [CrossRef]
  13. Pehkonen, S.O.; Lin, C.J. Aqueous photochemistry of mercury with organic acids. J. Air Waste Manag. Assoc. 1998, 48, 144–150. [Google Scholar] [CrossRef]
  14. Xiao, Z.F.; Munthe, J.; Strömberg, D.; Lindqvist, O. Photochemical Behaviour of Inorganic Mercury Compounds in Aqueous Solution; Lewis Publishers: London, UK, 1994. [Google Scholar]
  15. Seigneur, C.; Vijayaraghavan, K.; Lohman, K. Atmospheric mercury chemistry: Sensitivity of global model simulations to chemical reactions. J. Geophys. Res.: Atmos. 2006, 111. [Google Scholar] [CrossRef]
  16. Selin, N.E.; Jacob, D.J.; Park, R.J.; Yantosca, R.M.; Strode, S.; Jaegle, L.; Jaffe, D. Chemical cycling and deposition of atmospheric mercury: Global constraints from observations. J. Geophys. Res.: Atmos. 2007, 112. [Google Scholar] [CrossRef]
  17. Gardfeldt, K.; Jonsson, M. Is bimolecular reduction of Hg(II) complexes possible in aqueous systems of environmental importance. J. Phys. Chem. A 2003, 107, 4478–4482. [Google Scholar] [CrossRef]
  18. Sorooshian, A.; Lu, M.L.; Brechtel, F.J.; Jonsson, H.; Feingold, G.; Flagan, R.C.; Seinfeld, J.H. On the source of organic acid aerosol layers above clouds. Environ. Sci. Tech. 2007, 41, 4647–4654. [Google Scholar] [CrossRef] [Green Version]
  19. Liu, J.; Horowitz, L.W.; Fan, S.; Carlton, A.G.; Levy, H. Global in-cloud production of secondary organic aerosols: Implementation of a detailed chemical mechanism in the GFDL atmospheric model AM3. J. Geophys. Res.: Atmos. 2012, 117, D15303. [Google Scholar] [CrossRef]
  20. Lindberg, S.; Vermette, S. Workshop on sampling mercury in precipitation for the national atmospheric deposition program. Atmos. Environ. 1995, 29, 1219–1220. [Google Scholar] [CrossRef]
  21. Foley, K.M.; Roselle, S.J.; Appel, K.W.; Bhave, P.V.; Pleim, J.E.; Otte, T.L.; Mathur, R.; Sarwar, G.; Young, J.O.; Gilliam, R.C.; et al. Incremental testing of the Community Multiscale Air Quality (CMAQ) modeling system version 4.7. Geosci. Model. Dev. 2010, 3, 205–226. [Google Scholar] [CrossRef]
  22. Myers, T.; Atkinson, R.D.; Bullock, O.R.; Bash, J.O. Investigation of effects of varying model inputs on mercury deposition estimates in the Southwest US. Atmos. Chem. Phys. 2013, 13, 997–1009. [Google Scholar] [CrossRef]
  23. Carlton, A.G.; Bhave, P.V.; Napelenok, S.L.; Edney, E.D.; Sarwar, G.; Pinder, R.W.; Pouliot, G.A.; Houyoux, M. Model representation of secondary organic aerosol in CMAQv4.7. Environ. Sci. Tech. 2010, 44, 8553–8560. [Google Scholar] [CrossRef]
  24. Perri, M.J.; Seitzinger, S.; Turpin, B.J. Secondary organic aerosol production from aqueous photooxidation of glycolaldehyde: Laboratory experiments. Atmos. Environ. 2009, 43, 1487–1497. [Google Scholar] [CrossRef]
  25. El Haddad, I.; Liu, Y.; Nieto-Gligorovski, L.; Michaud, V.; Temime-Roussel, B.; Quivet, E.; Marchand, N.; Sellegri, K.; Monod, A. In-cloud processes of methacrolein under simulated conditions-Part 2: Formation of secondary organic aerosol. Atmos. Chem. Phys. 2009, 9, 5107–5117. [Google Scholar] [CrossRef]
  26. Baker, K.R.; Bash, J.O. Regional scale photochemical model evaluation of total mercury wet deposition and speciated ambient mercury. Atmos. Environ. 2012, 49, 151–162. [Google Scholar] [CrossRef]
  27. Holloway, T.; Voigt, C.; Morton, J.; Spak, S.N.; Rutter, A.P.; Schauer, J.J. An assessment of atmospheric mercury in the Community Multiscale Air Quality (CMAQ) model at an urban site and a rural site in the Great Lakes Region of North America. Atmos. Chem. Phys. 2012, 12, 7117–7133. [Google Scholar] [CrossRef]
  28. Huang, J.Y.; Miller, M.B.; Weiss-Penzias, P.; Gustin, M.S. Comparison of gaseous oxidized Hg measured by KCl-coated denuders, and nylon and cation exchange membranes. Environ. Sci. Tech. 2013, 47, 7307–7316. [Google Scholar]
  29. Ambrose, J.L.; Lyman, S.N.; Huang, J.Y.; Gustin, M.S.; Jaffe, D.A. Fast time resolution oxidized mercury measurements during the Reno Atmospheric Mercury Intercomparison Experiment (RAMIX). Environ. Sci. Tech. 2013, 47, 7285–7294. [Google Scholar]
  30. Gustin, M.S.; Huang, J.Y.; Miller, M.B.; Peterson, C.; Jaffe, D.A.; Ambrose, J.; Finley, B.D.; Lyman, S.N.; Call, K.; Talbot, R.; et al. Do we understand what the mercury speciation instruments are actually measuring? results of RAMIX. Environ. Sci. Tech. 2013, 47, 7295–7306. [Google Scholar]
  31. Lyman, S.N.; Jaffe, D.A.; Gustin, M.S. Release of mercury halides from KCl denuders in the presence of ozone. Atmos. Chem. Phys. 2010, 10, 8197–8204. [Google Scholar] [CrossRef] [Green Version]
  32. Hynes, A.J.; Donohoue, D.L.; Goodsite, M.E.; Hedgecock, I.M. Our Current Understanding of Major Chemical and Physical Processes Affecting Mercury Dynamics in the Atmosphere and at the Air-Water/Terrestrial Iterfaces. In Mercury Fate and Transport in the Global Atmosphere; Springer: Berlin, Germany, 2009; pp. 427–457. [Google Scholar]
  33. Subir, M.; Ariya, P.A.; Dastoor, A.P. A review of the sources of uncertainties in atmospheric mercury modeling II. Mercury surface and heterogeneous chemistry—A missing link. Atmos. Environ. 2012, 46, 1–10. [Google Scholar] [CrossRef]
  34. Kolker, A.; Olson, M.L.; Krabbenhoft, D.P.; Tate, M.T.; Engle, M.A. Patterns of mercury dispersion from local and regional emission sources, rural central wisconsin, USA. Atmos. Chem. Phys. 2010, 10, 4467–4476. [Google Scholar] [CrossRef]
  35. Timonen, H.; Ambrose, J.L.; Jaffe, D.A. Oxidation of elemental Hg in anthropogenic and marine airmasses. Atmos. Chem. Phys. 2013, 13, 2827–2836. [Google Scholar] [CrossRef]
  36. Kos, G.; Ryzhkov, A.; Dastoor, A.; Narayan, J.; Steffen, A.; Ariya, P.A.; Zhang, L. Evaluation of discrepancy between measured and modelled oxidized mercury species. Atmos. Chem. Phys. 2013, 13, 4839–4863. [Google Scholar]
  37. Carlton, A.G.; Turpin, B.J.; Altieri, K.E.; Seitzinger, S.P.; Mathur, R.; Roselle, S.J.; Weber, R.J. CMAQ model performance enhanced when in-cloud secondary organic aerosol is included: Comparisons of organic carbon predictions with measurements. Environ. Sci. Tech. 2008, 42, 8798–8802. [Google Scholar] [CrossRef]
  38. Carlton, A.G.; Turpin, B.J.; Lim, H.J.; Altieri, K.E.; Seitzinger, S. Link between isoprene and secondary organic aerosol (SOA): Pyruvic acid oxidation yields low volatility organic acids in clouds. Geophys. Res. Lett. 2006, 33, L06822. [Google Scholar]
  39. Carlton, A.G.; Turpin, B.J.; Altieri, K.E.; Seitzinger, S.; Reff, A.; Lim, H.J.; Ervens, B. Atmospheric oxalic acid and SOA production from glyoxal: Results of aqueous photooxidation experiments. Atmos. Environ. 2007, 41, 7588–7602. [Google Scholar] [CrossRef]
  40. Altieri, K.E.; Carlton, A.G.; Lim, H.-J.; Turpin, B.J.; Seitzinger, S.P. Evidence for oligomer formation in clouds:  Reactions of isoprene oxidation products. Environ. Sci. Tech. 2006, 40, 4956–4960. [Google Scholar] [CrossRef]
  41. Altieri, K.E.; Seitzinger, S.P.; Carlton, A.G.; Turpin, B.J.; Klein, G.C.; Marshall, A.G. Oligomers formed through in-cloud methylglyoxal reactions: Chemical composition, properties, and mechanisms investigated by ultra-high resolution FT-ICR mass spectrometry. Atmos. Environ. 2008, 42, 1476–1490. [Google Scholar] [CrossRef]
  42. Tan, Y.; Carlton, A.G.; Seitzinger, S.P.; Turpin, B.J. SOA from methylglyoxal in clouds and wet aerosols: Measurement and prediction of key products. Atmos. Environ. 2010, 44, 5218–5226. [Google Scholar] [CrossRef]
  43. Legrand, M.; Preunkert, S.; Oliveira, T.; Pio, C.A.; Hammer, S.; Gelencser, A.; Kasper-Giebl, A.; Laj, P. Origin of C-2-C-5 dicarboxylic acids in the European atmosphere inferred from year-round aerosol study conducted at a west-east transect. J. Geophys. Res.: Atmos. 2007, 112, D23S07. [Google Scholar] [CrossRef]
  44. Sorooshian, A.; Varutbangkul, V.; Brechtel, F.J.; Ervens, B.; Feingold, G.; Bahreini, R.; Murphy, S.M.; Holloway, J.S.; Atlas, E.L.; Buzorius, G.; et al. Oxalic acid in clear and cloudy atmospheres: Analysis of data from international consortium for atmospheric research on transport and transformation 2004. J. Geophys. Res.: Atmos. 2006, 111, D23S45. [Google Scholar]
  45. Ervens, B.; Feingold, G.; Frost, G.J.; Kreidenweis, S.M. A modeling study of aqueous production of dicarboxylic acids: 1. Chemical pathways and speciated organic mass production. J. Geophys. Res.: Atmos. 2004, 109, D15205. [Google Scholar] [CrossRef]
  46. Sarwar, G.; Luecken, D.; Yarwood, G.; Whitten, G.Z.; Carter, W.P.L. Impact of an updated carbon bond mechanism on predictions from the CMAQ modeling system: Preliminary assessment. J. Appl. Meteorol. Clim. 2008, 47, 3–14. [Google Scholar] [CrossRef]
  47. Strode, S.A.; Jaegle, L.; Selin, N.E.; Jacob, D.J.; Park, R.J.; Yantosca, R.M.; Mason, R.P.; Slemr, F. Air-sea exchange in the global mercury cycle. Glob. Biogeochem. Cy. 2007, 21, GB1017. [Google Scholar]
  48. Grell, G.; Dudhia, J.; Stouffer, D. A Description of the Fifth-Generation PENN State/NCAR Mesoscale Model (MM5); National Center for Atmospheric Research: Boulder, CO, USA, 1994. [Google Scholar]
  49. Pleim, J.E.; Xiu, A. Development and testing of a surface flux and planetary boundary-layer model for application in mesoscale models. J. Appl. Meteorol. 1995, 34, 16–32. [Google Scholar] [CrossRef]
  50. Bullock, O.R.; Atkinson, D.; Braverman, T.; Civerolo, K.; Dastoor, A.; Davignon, D.; Ku, J.Y.; Lohman, K.; Myers, T.C.; Park, R.J.; et al. The North American Mercury Model Intercomparison Study (NAMMIS): Study description and model-to-model comparisons. J. Geophys. Res.: Atmos. 2008, 113, D17310. [Google Scholar] [CrossRef]
  51. Appel, K.W.; Roselle, S.J.; Gilliam, R.C.; Pleim, J.E. Sensitivity of the Community Multiscale Air Quality (CMAQ) model v4.7 results for the eastern United States to MM5 and WRF meteorological drivers. Geosci. Model. Dev. 2010, 3, 169–188. [Google Scholar] [CrossRef]
  52. Simon, H.; Baker, K.R.; Phillips, S. Compilation and interpretation of photochemical model performance statistics published between 2006 and 2012. Atmos. Environ. 2012, 61, 124–139. [Google Scholar] [CrossRef]
  53. Zheng, W.; Hintelmann, H. Mercury isotope fractionation during photoreduction in natural water is controlled by its Hg/DOC ratio. Geochim. Cosmochim. Acta 2009, 73, 6704–6715. [Google Scholar] [CrossRef]
  54. Amos, H.M.; Jacob, D.J.; Holmes, C.D.; Fisher, J.A.; Wang, Q.; Yantosca, R.M.; Corbitt, E.S.; Galarneau, E.; Rutter, A.P.; Gustin, M.S.; et al. Gas-particle partitioning of atmospheric Hg(II) and its effect on global mercury deposition. Atmos. Chem. Phys. 2012, 12, 591–603. [Google Scholar]

