Article

Diurnal Variation of Rainfall Associated with Tropical Depression in South China and its Relationship to Land-Sea Contrast and Topography

Hubei Key Laboratory for Heavy Rain Monitoring and Warning Research, Institute of Heavy Rain, China Meteorological Administration, Wuhan 430074, China
Atmosphere 2014, 5(1), 16-44; https://doi.org/10.3390/atmos5010016
Submission received: 8 October 2013 / Revised: 16 December 2013 / Accepted: 17 December 2013 / Published: 27 December 2013
(This article belongs to the Special Issue Cloud and Precipitation)

Abstract

:
Convective precipitation associated with tropical depression (TD) is one primary type of post-flooding season rainfall in South China (SC). Observations of the Tropical Rainfall Measuring Mission (TRMM) satellite have shown specific diurnal features of convective rainfall in South China, which is somewhat different from that in other seasons or regions of China. Convective precipitation is usually organized into a rainfall band along the southeastern coast of South China in the early morning hours. The rainfall band develops and intensifies quickly in the morning, then moves inland in the afternoon and, finally, diminishes at night. The daily convective rainfall along the coast is much more than that in the inland region, and heavy rainfall is often found along the coast. A long-duration heavy rainfall event associated with tropical depression “Fitow” during the period from 28 August to 6 September 2001, is selected in this study to explore the diurnal feature of convective rainfall and its formation mechanism. Modeling results of the 10-day heavy rainfall event are compared with both rain-gauge observation and satellite-retrieved rainfall. Total precipitation and its spatial distribution, as well as diurnal variations are reasonably simulated and agree well with observations. Further analysis reveals that the development and movement of convective precipitation is mainly related to the land and sea breezes. The anomalous height-latitudinal circulation in the morning-to-noon hours is completely reversed in the afternoon-to-late-evening hours, with the convective rainfall swinging back and forth, following its updraft branch. Sensitivity experiments show that the afternoon convective rainfall in the inland region of SC is caused by the diurnal variation of solar radiation forcing. The mountain range along the coast and the complex topography in the inland region of SC plays a critical role in the enhancement of diurnal convective rainfall everywhere. The formation of a heavy rainfall band along the southeastern coast of SC and the diurnal variation of the rainfall pattern are mainly the results of the land-sea thermal contrast.

1. Introduction

Warm-season rainfall over China has distinct seasonality under the influence of the East Asian summer monsoon [1]. Specifically, a rainy period called the pre-flooding season first occurs in South China (SC) from April to mid-June, when the ridge line of the West Pacific Subtropical High (WPSH) is situated at 16–18°N. Accompanied by the abrupt northward jump of the WPSH’s ridge line to 22–23°N, the Mei-Yu season starts in the Yangtze-Huaihe River Valley in mid-June and remains there until mid-July. Heavy rainfall prevails in the Yellow River Valley, North China and Northeast China from mid-July to August after the second northward jump of WPSH’s ridge line to the north of 30°N [2,3]. Correspondingly, summer rainfall does not largely result from precipitating stratus, but from deep convection with distinct diurnal variation due to solar radiation forcing [4].
There exist significant differences in diurnal rainfall patterns over various regions of China. For example, Yu et al. [5] showed that diurnal summer rainfall peaked in late afternoon in the inland region of southern China, around midnight, over most of the Tibetan Plateau and its eastern periphery and in early morning in the middle Yangtze River valley. Li et al. [6] pointed out that the peak time of diurnal rainfall in southeastern China appeared in the mid-late afternoon, while in southwestern China, daily maximum precipitation often occurred at midnight or in the early morning. He and Zhang [7] claimed that diurnal rainfall in the central North China Plain peaked around midnight to the early-morning hours, resulting in a broad area of nocturnal rainfall maxima over the plain. Bao et al. [8] illustrated the regional differences in diurnal cycles of precipitation to the east of the Tibetan Plateau during the period from prior to Mei-Yu, during Mei-Yu to the post Mei-Yu season. Sun and Zhang’s [9] recent investigation suggested that the Mei-Yu frontal rainfall tended to be enhanced from midnight to the early-morning hours. Johnson [10] and Chen et al. [11] claimed that the morning peak of rainfall in eastern China was related to the nocturnal intensification of monsoon flow, which had significant diurnal variation.
The role of topography in modulating the spatial and temporal distribution of diurnal rainfall in China has been studied. For example, Wang et al. [12] and Zhou et al. [13] argued that the midnight rainfall maximum in the Sichuan Basin was a result of the eastward-propagation of convection originating over the Tibetan Plateau. He and Zhang [7] showed that the nighttime rainfall maximum over the North China Plain was related to the joint impacts of a mountain-plain solenoid (MPS) and a low-level southwesterly nocturnal jet. Huang et al. [14] found that a solenoidal circulation between the Tibetan Plateau and its lee-side lowlands contributed to the longevity and, farther downstream, the propagation of diurnal precipitation. Chen et al. [15] declared that the diurnal clockwise rotation of the low tropospheric circulation might explain the delayed initiation of the long-duration nocturnal rainfall events, while the branch of upward motion moves eastward in time. More recently, Sun and Zhang [9] suggested that the upward branch of the MPS in Central and East China was primarily responsible for the enhancement of midnight-to-early-morning rainfall along the Mei-Yu front. In addition, the diurnal cycle of rainfall in southeastern China and the South China Sea may be modulated greatly by the land and sea breeze, which is characterized by diurnal circulation with a rising (sinking) motion in the late afternoon over warm continents (adjacent to cool sea waters) and the reversed circulation during the early morning [16,17].
Regional and/or seasonal differences of diurnal rainfall patterns not only occur in China [8,18,19,20], but also exist in other regions of the world, like in Japan [21], island regions in Asia [22,23], the Asian monsoon region [10,11,12], marine continental islands [24,25], northwest South America [26], the United States Great Plains [27], the Andes in South America [28,29], Africa [30] and even the global tropics [31,32]. The convective rainfall maximum late at night or in the early-morning hours over oceans can be explained by radiation-convection interaction theory [33,34]. Another possible theory is related to the radiation difference between a cloudy and clear-sky (or less cloudy) region [35]. The diurnal cycle of atmospheric relative humidity and available precipitable water caused by radiation heating and cooling may also be a critical factor that affects the diurnal variation of oceanic rainfall [36,37]. The midnight maximum rainfall over inland plains, like in the United States Great Plains [27] and the East China Plains [9,15], is largely associated with the eastward propagation of late-afternoon convection initiated in upstream mountainous areas. Mountain valley wind is an important element that can modulate diurnal rainfall in mountainous areas [19]. The diurnal cycle of rainfall over islands is often predominantly caused by sea-breeze convergence, reinforced by mountain-valley winds and further amplified by the merging processes of cumulus [24]. Meanwhile, some studies declared that the diurnal rainfall pattern in coastal areas was related to thermally-initiated gravity waves [26]. Hence, the diurnal processes of rainfall on islands, peninsulas and coastal areas with complex topography are relatively complex and need further investigation [11].
With the primary rainfall band moving to northern China in July, the rainy period, named the post-flooding season, starts in SC (Figure 1a). In the post-flooding season, SC is mainly influenced by tropical weather systems, such as tropical depressions (TDs), easterly waves, the tropical convergence zone (or East-Asian monsoon trough), etc. Easterly or southeasterly winds prevail in the low-level of the troposphere, with the WPSH’s ridge line being near or north of 30°N. In the upper troposphere, the sub-tropical westerly jet retreats to the north of 30°N (Figure 1b). The formation mechanism of the diurnal rainfall pattern is seldom studied in detail, due to the fact that the synoptic-scale forcing is usually strong under the influence of tropical depressions. This study reveals that the diurnal pattern of rainfall associated with TD is somewhat different from that in other seasons or regions of China. The convective rainfall not only has diurnal variation in its intensity, but also has diurnal changes in its spatial distribution. The major rain band moves back and forth between SC’s southeastern coast and its inland area during the day, with the rain system developing in the early morning and the inland rainfall peaking in late afternoon. So far, little is known about why convective rainfall begins to be organized and intensified along the southeastern coast in the early-morning to morning hours, then moves to the inland region in the afternoon. The dynamic-physical processes that control the diurnal variation of rainfall are not completely understood, yet. In addition, how complex topography, land-sea thermal contrast and solar radiation affect the diurnal rainfall pattern need to be further investigated. To address the above issues of the diurnal rainfall pattern associated with TD, a long-duration heavy rainfall event, which is related to tropical depression “Fitow” and remained in SC from 28 August to 6 September 2001, is selected in this study to reveal the diurnal features of rainfall associated with TD and its formation mechanism. It should be noted that the possible impacts of TD intensity, location and track are not addressed in this study, since the main focus of the current study is on diurnal rainfall variation.
Figure 1. (a) Mean rainfall (shaded, unit: mm) from July to September for the period of 2000–2009 (based on observations of weather stations in China) and (b) mean 925-hPa wind (barbs, unit: m∙s–1; a full barb represents 5 m∙s–1), 500-hPa geopotential height (contours, unit: dagpm (decade geopotential meter)) and 200-hPa westerly wind greater than 20 m∙s–1 (vectors, unit: m∙s–1) from the National Center for Environmental Prediction (NCEP) reanalysis at 2.5° resolution. ZDA in (a) indicates the Zhujiang Delta Area (ZDA). The rectangle in (b) indicates the area of Figure 1a. The shading area in Figure 1b indicates topography higher than 1,500 m.
Atmosphere 05 00016 g001
This paper is organized as follows. In Section 2, the observation dataset, the methodology and the model configuration are described. The experiment design is also introduced. The diurnal features of rainfall associated with TD in SC are analyzed in Section 3. In Section 4, the simulated diurnal features of rainfall are verified against observations. Numerical sensitivity experiments are carried out to investigate the effects of diurnal solar radiation forcing, complex topography and land-sea thermal contrast on the formation of diurnal rainfall variation associated with TD. Discussions and conclusions are presented in Section 5 and Section 6, respectively.

2. Data and Methodology

2.1. Datasets and Processing

In this study, observation of the 10-day rainfall related to Fitow, as well as other precipitation information for the period of 2000–2009 are extracted from the Tropical Rainfall Measuring Mission (TRMM) blended rainfall data (3B42, Version 6) [38] . TRMM is, to date, one of the best rainfall datasets [39,40]. The TRMM 3B42 provides high spatial resolution (0.25° × 0.25°) rainfall data at 3-h intervals, which makes it suitable for a diurnal variation study. TRMM data are created by blending rainfall estimates from multiple satellite systems based on calibration by the rainfall estimate of the TRMM Microwave Image Precipitation Radar combined algorithm [41].
In order to illustrate the representativeness of the diurnal rainfall features of the Fitow-related 10-day case in this study, all heavy rainfall days associated with TD in the years 2000–2009 are picked out first. Here, a heavy rainfall day is determined if the number of stations with a rainstorm (24-h rainfall greater than 50 mm) is over 15 (a total of 223 stations in SC) in a day. Second, the hourly averages of TRMM-estimated rainfall during the heavy rainfall day from 0800 BLT (Beijing Local Time) (0000 UTC (Universal Time Coordinated)) to 0500 BLT (2100 UTC) are computed to demonstrate the diurnal variation of rainfall. To avoid the impacts of possible errors in TRMM-estimated hourly rainfall, the mean intensity and occurrence frequency of hourly rainfall at the time of day are also calculated to further illustrate the diurnal rainfall features. Finally, the diurnal rainfall pattern of the 10-day event is compared with that of 2000–2009 heavy rainfall days associated with TD to justify the representativeness of the Fitow-related 10-day event used for this study. The 24-h accumulated rainfall data is provided by the National Meteorological Information Services of the China Meteorological Administration.

2.2. Model Configuration and Experimental Design

The Weather Research and Forecasting (WRF) Model version WRFV3.2.1 is utilized in this study to simulate the long-duration TD “Fitow” and its related diurnal rainfall. The simulation adopts the non-hydrostatic dynamic core of WRF-ARW (Advanced Research WRF). A 5-km resolution domain with 31 vertical levels is set up for this study. The model domain is centered on (22°N, 112.5°E) with 451 (north-south) × 451 (east-west) grid points, covering SC and the adjacent ocean. The model top is 50 hpa. The initial and boundary conditions are derived from the 6-hourly analysis data with 1° × 1° horizontal resolution [42], which is provided by the National Center for Environmental Prediction (NCEP) of the United States (other global analysis data with better quality and higher resolution are unavailable to the author). The important physical schemes used in this study include the RRTM (Rapid Radiative Transfer Model) long-wave and short-wave radiation scheme, the MM5 (Mesoscale Model Version 5) similarity surface layer scheme, a 5-layer thermal diffusion land surface model and the Yonsei University planetary boundary layer scheme [43]. The new Thompson cloud microphysics scheme is used in this study [44]. The convective parameterization scheme is turned off, due to the fine model grid interval (5 km). The above physical schemes are selected based on our previous tests using various resolutions and combinations of physical schemes. The results suggest that the settings we used in this study give the best simulation, especially for the simulation of the TD track and the temporal and spatial distribution of heavy rainfall. The time step is set to 30 s.
Figure 2. The model domain with shaded areas indicating topographic height (unit: 100 m). Region A shows the area where topography is removed in Exp NT; region B indicates the area where water points are replaced by grassland in Exp NLS; and region C shows the area of Figure 1a, Figure 4, Figure 5, Figure 7 and Figure 8.
Atmosphere 05 00016 g002
As is known to meteorologists around the world, it is very difficult to obtain an accurate track and rainfall simulation for a 10-day TD through continuous model integration, despite some successful studies that have conducted long-time numerical simulations to investigate the diurnal rainfall cycle [9,26]. Considering the fact that the observed features of the diurnal rainfall cycle are obtained by averaging hourly TRMM-estimated or surface rain-gauge rainfall [8,13,45], an alternative method is adopted in this study. Ten simulations have been done in this study to cover the 10-day period of the case, with each simulation being initialized at 2000 BLT (1200 UTC) and integrated for 36 h. The last 24-h results are used for analysis, while the first 12-h results are discarded to alleviate the model spin-up impacts. The control simulation (Exp (Experiment) CTL) is run first to reproduce the 10-day TD event and its diurnal rainfall variation. Several sensitivity experiments are then conducted to investigate the effects of diurnal solar radiation forcing (Exp ND (No Diurnal Cycle)), topography (Exp NT (No Topographical Effect)) and land-sea thermal contrast (Exp NLS (No Land Sea Difference)), respectively. In Exp ND, the solar zenith angle is set to a constant value at 2000 BLT in the 10-day simulation. In Exp NT, the topography in region A (shown in Figure 2) is set as flat with a 5-m terrain height everywhere. In Exp NLS, all water points in region B of Figure 2, including the SCS (South China Sea) and other sea waters, are changed to grassland/shrubland.
In order to compare the diurnal pattern of simulated rainfall with that revealed by TRMM-estimated hourly rainfall, the average intensity of simulated hourly rainfall is calculated for the control run and sensitivity experiments. In addition, to clearly illustrate the diurnal cycle of any specific atmospheric variable, its anomaly at a different time in a day relative to the daily mean is calculated and then averaged over the 10-day period.

3. Diurnal Variations of Rainfall Associated with TD

3.1. Diurnal Pattern of Precipitation Associated with TD in the Years 2000–2009

In total, there are 116 heavy rainfall days associated with TD during the period of 2000–2009. Figure 3 shows the diurnal variation of rainfall associated with TD based on the TRMM-estimated hourly rainfall of the 116 days.
As shown in Figure 3a, the average rainfall of all hours shows that there is a rainfall band along the southeastern coast of Guangdong Province. The evolution of hourly rainfall at 3-h intervals, however, illustrates a clear diurnal variation (Figure 3b–i). The convective rainfall begins to be organized at 0500 BLT, intensifies later at 0800 BLT and reaches its peak around 1100 BLT, with the rainfall band remaining along the southeastern coast. From 1400 BLT to 1700 BLT, the rainfall band seems to move northward steadily to the inland region of Guangdong Province, with rainfall intensity weakening a little. Starting from 2000 BLT, the inland rainfall decreases quickly. From 2300 BLT to 0200 BLT, the rainfall band further weakens and, finally, retreats to the southeastern coast. The above results clearly indicate the diurnal variation of both the intensity and spatial distribution of rainfall associated with TD. The frequency of rainfall occurrence is distributed in a similar pattern to that of the rainfall intensity, but the area of large frequency does not entirely correspond to where high rainfall intensity occurs. Specifically, the area of the large frequency of mean rainfall occurrence is located to either the north or south of the area of high rainfall intensity (Figure 3a). From 0800 BLT to 1100 BLT, the large frequency area is mainly located in the north of the SCS, which is to the south of the area of high intensity (Figure 3b,c). The inconsistency between the areas of high rainfall intensity and large rainfall frequency indicates that the rainfall along the southeastern coast is much stronger than anywhere else. From 1400 BLT to 1700 BLT, the rainfall frequency reaches its peak value in the inland region of Guangdong Province, with a large frequency area almost overlapping with the area of high intensity. The rainfall frequency decreases gradually in the north of the SCS (Figure 3d,e). The overlapping of areas of high rainfall intensity and large frequency indicates that the convective rainfall occurs in the inland area more often in the afternoon hours. From 2000 BLT to 2300 BLT, the rainfall frequency in the inland are decreases, and the area of large frequency is located to the north of the area of high intensity (Figure 3f,g). From 0200 BLT to 0500 BLT, the rainfall frequency begins to increase along the southeastern coast, with a large frequency area roughly overlapping with the area of high intensity (Figure 3h,i).
Figure 3. Mean hourly rainfall (shaded, unit: mm) and rainfall occurrence frequency (contours, unit: %) (a) and the diurnal evolution of rainfall intensity (shadings, unit: mm∙h–1) and rainfall occurrence frequency (contours, unit: %) for the 116 heavy rainfall days associated with tropical depression (TD) from Tropical Rainfall Measuring Mission (TRMM) estimates at time of (b) 0800 BLT (Beijing Local Time), (c) 1100 BLT, (d) 1400 BLT, (e) 1700 BLT, (f) 2000 BLT, (g) 2300 BLT, (h) 0200 BLT and (i) 0500 BLT.
Atmosphere 05 00016 g003

3.2. A Case Producing Continuous Heavy Rainfall in South China

3.2.1. Overview of Synoptic Circulation of TD “Fitow”

In this study, a 10-day period from 28 August to 6 September 2001, during which heavy to extremely heavy rainfall generated by TD “Fitow” occurred in SC (Figure 4), is selected to study the diurnal pattern of rainfall associated with TD. Fitow (No. 0114) was formed over the northern part of the SCS on 28 August 2001. It moved westward and skirted Haikou in Hainan Island on the early morning of 30 August. During this period, the warm and moist periphery flow of Fitow produced heavy rainfall along the southeastern coast of Guangdong Province. Upon entering the Beibuwan Gulf, Fitow gained strength and intensified into a tropical storm before it turned northward on the night of 30 August. On 31 August, it made landfall near Beihai of Guangxi Province and weakened into a tropical depression. On the early morning of 1 September, it further dissipated into a low pressure system. On 2 September, Fitow produced extremely heavy rainfall in SC. From 3 September, the low pressure system was maintained near the north of Beibuwan Gulf and brought heavy rainfall in SC. On 7 September 2001, the low pressure system weakened quickly, and the long-duration heavy rainfall in SC terminated with the southward surge of surface cold air from the north.
Since the steering flow aloft was very weak, Fitow was kept quasi-stationary and remained near the north of Beibuwan Gulf during the period from 1 to 6 September 2001, after it weakened into a low pressure system. The average of a 900-hPa wind field shows the TD’s impact on SC, with its circulation center in the north of Beibuwan Gulf (Figure 5). The 10-day accumulated rainfall band was located in the southeastern coast of Guangdong Province, and the maximum rainfall appeared around the Yunwushan and Yunkaidashan Mountains (Figure 5). The 10-day rainfall maximum in the inland area reached 679.6 mm at Taishan (22.3°N, 112.5°E) station. The 24-h rainfall maximum of 314.4 mm occurred at Dianbai (21.5°N, 111.0°E) station. It is interesting that there existed double rainfall bands in eight out of the 10 days, with the primary rainfall band located along the southeast coast of Guangdong Province and a secondary one in the inland region. The formation of double rainfall bands is a result of the diurnal variation of the rainfall distribution, which will be discussed in detail later.
Figure 4. 900-hPa wind (vectors, unit: m∙s–1) from the NCEP reanalysis and 24-h rainfall observation from weather stations (shaded, unit: mm) ending at 0800 BLT on (a) 29 August, (b) 30 August, (c) 31 August, (d) 1 September, (e) 2 September, (f) 3 September, (g) 4 September, (h) 5 September and (i) 6 September 2001.
Atmosphere 05 00016 g004
Figure 5. Ten-day total rainfall based on observations of weather stations (shaded, unit: mm) and the 10-day mean 900-hPa wind extracted from the NCEP reanalysis (vectors, unit: m∙s–1) in the period of 28 August to 6 September 2001. The red points indicate the surface rain gauge stations.
Atmosphere 05 00016 g005

3.2.2. Representativeness of 10-Day Diurnal Rainfall Pattern

The representativeness of the 10-day rainfall diurnal variation has been demonstrated by Mapes et al. [26], who used a 10-day case to study the diurnal rainfall patterns in northwestern South America. Here, the diurnal features of the 10-day event are shown to be similar to those of the 116 heavy rainfall days shown in Figure 3. The frequency and intensity variations of TRMM-estimated rainfall associated with Fitow show that the rainfall associated with TD not only exhibits diurnal variation of intensity, but also shows distinct diurnal variation in its spatial distribution (Figure 6). Therefore, the diurnal features of the 10-day rainfall can be roughly representative of the diurnal rainfall pattern associated with TD.
Figure 6. Mean hourly rainfall (shaded, unit: mm) and rainfall occurrence frequency (contours, unit: %) (a) and the diurnal evolution of rainfall intensity (shadings, unit: mm∙h–1) and rainfall occurrence frequency (contours, unit: %) for the 10-day event based on TRMM estimates at time of (b) 0800 BLT, (c) 1100 BLT, (d) 1400 BLT, (e) 1700 BLT, (f) 2000 BLT, (g) 2300 BLT, (h) 0200 BLT and (i) 0500 BLT.
Atmosphere 05 00016 g006

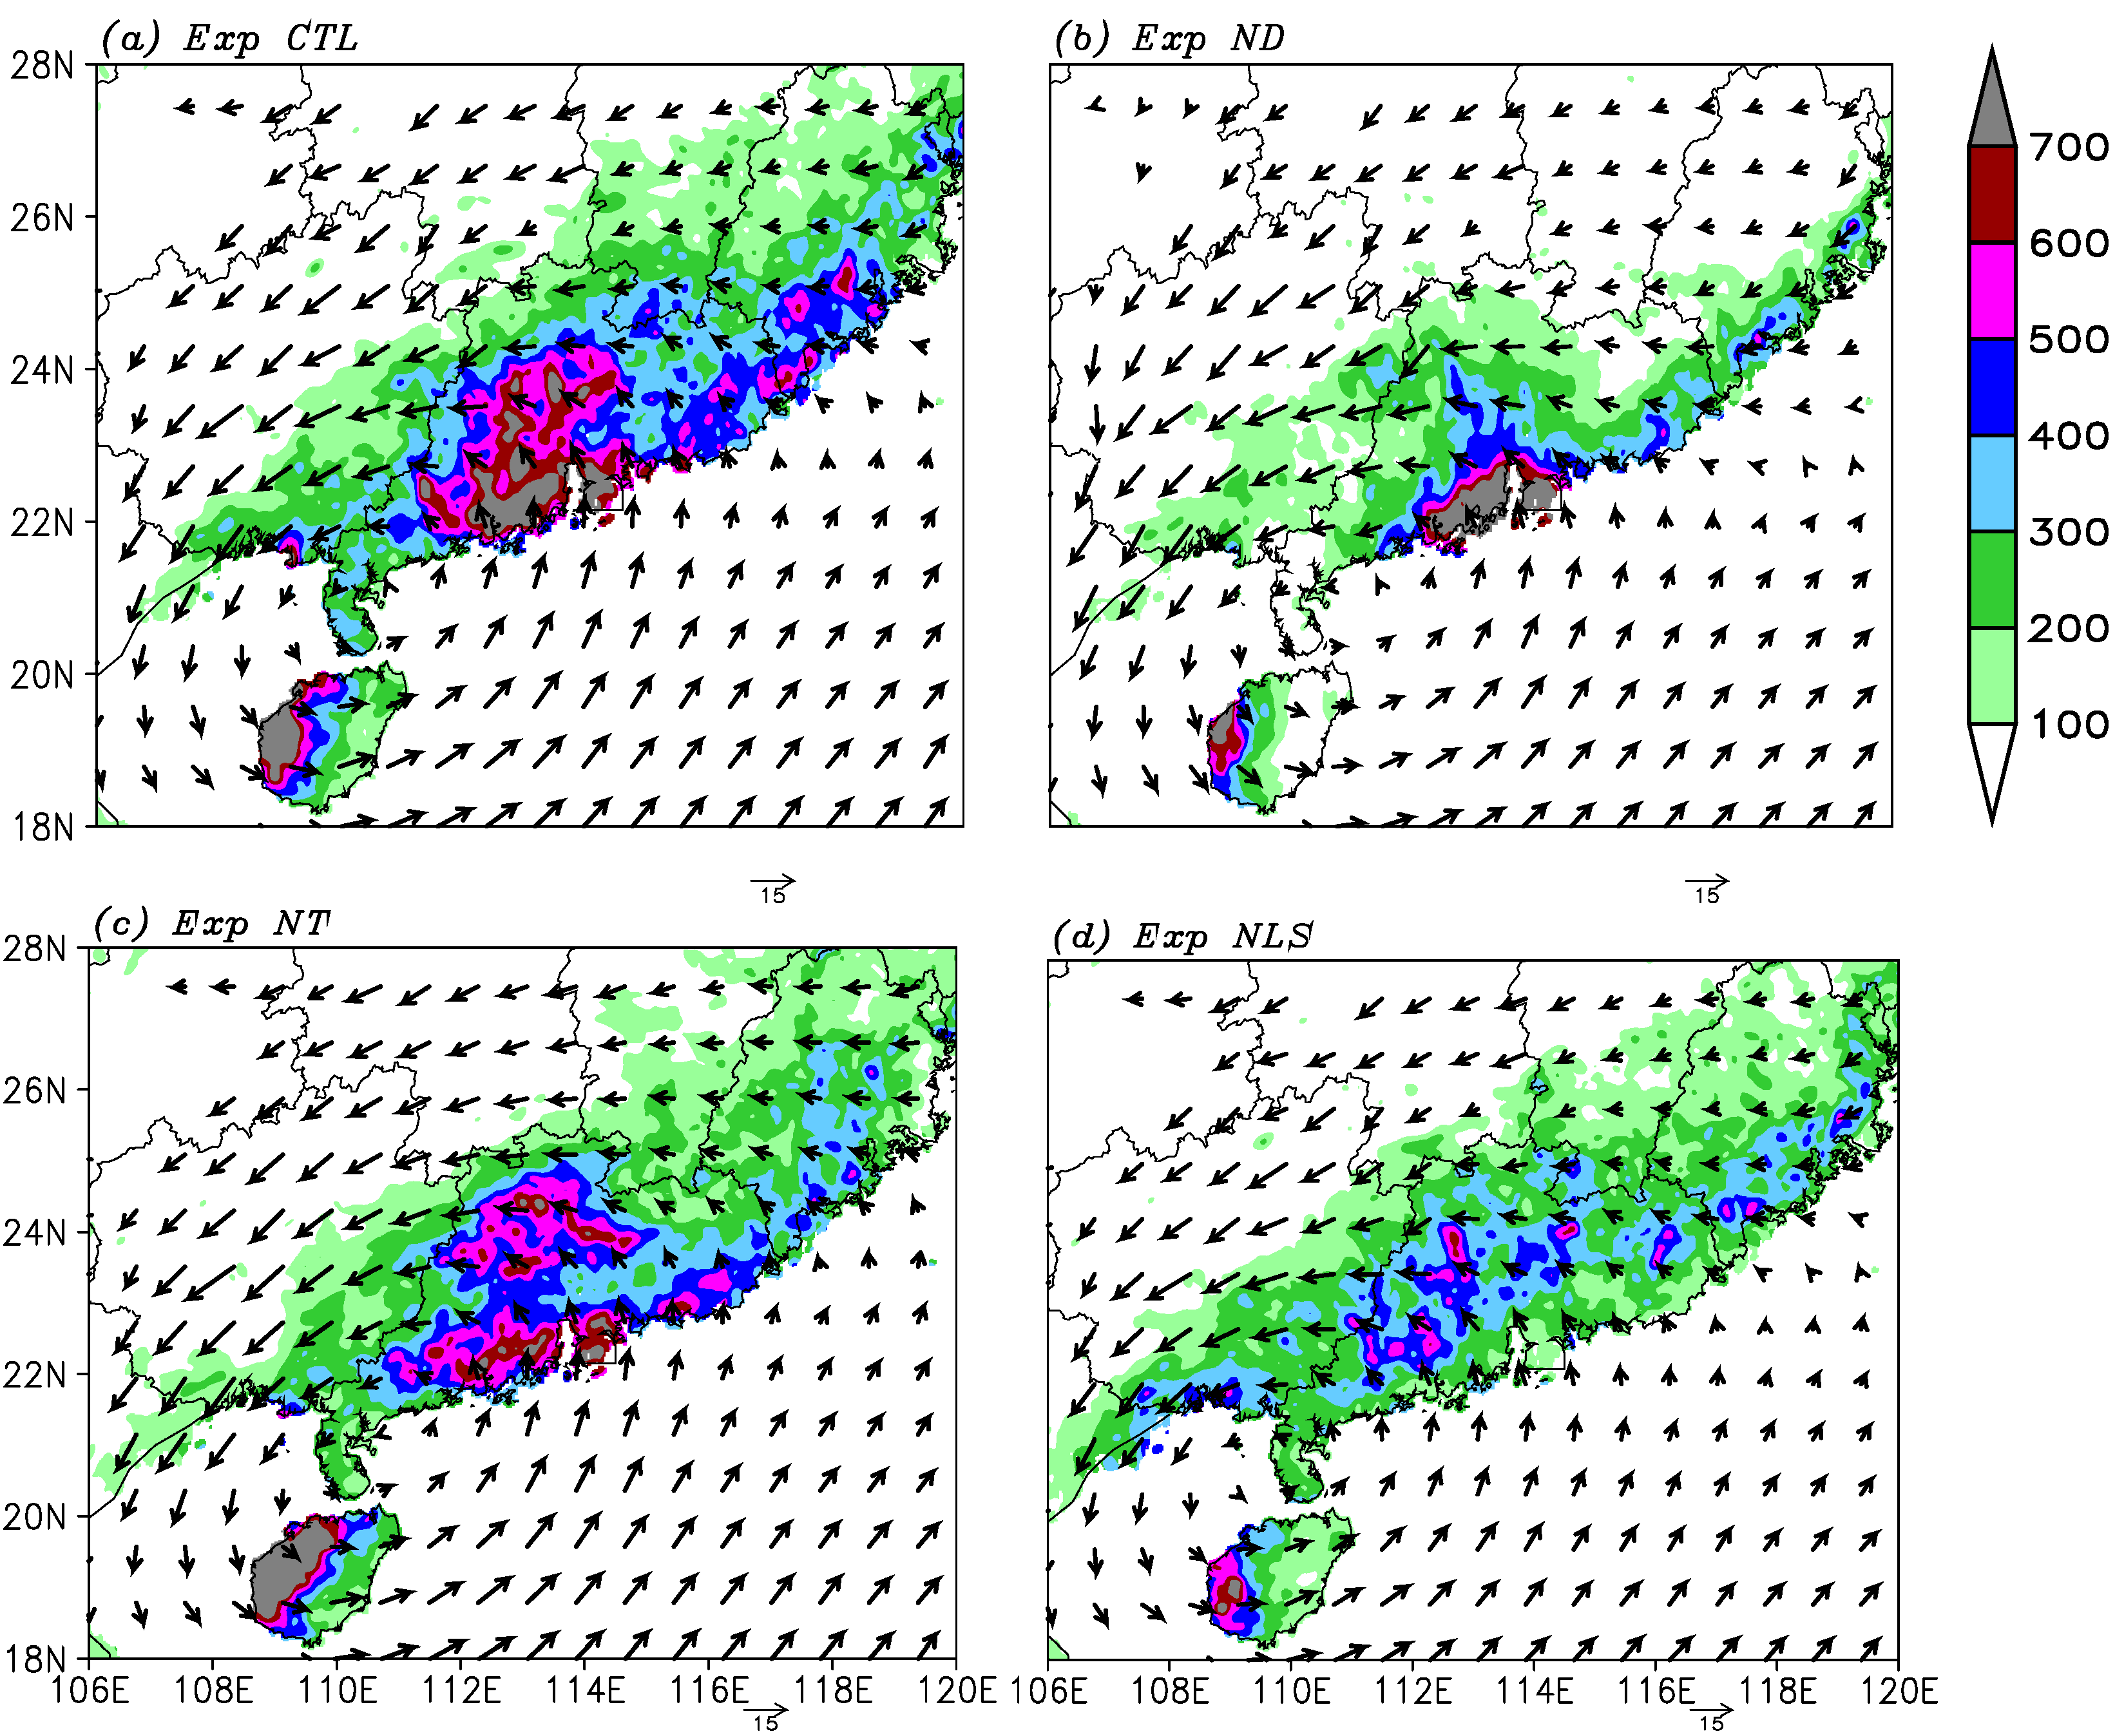
4. Numerical Experiment Results

4.1. Simulation Overview

Figure 7 shows the 900-hPa wind field and 24-h rainfall simulated by Exp CTL and from observations (Figure 4) for each day of the study period. It is found that the simulated TD location and its circulation pattern are roughly consistent with observations for each day, although the simulated low-level wind direction and intensity in SC deviates a little from the NCEP analysis. The 24-h rainfall pattern is simulated well and similar to that observed for each day, but the location and intensity of heavy rainfall is not exactly the same as that observed (Figure 7). Note that the observed and simulated rainfall have different resolutions; the differences in the location and intensity of heavy rainfall are acceptable.
The simulated 10-day total rainfall and 900-hPa mean wind field agree well with the observations. Specifically, the simulated heavy rainfall band is along the southeastern coast, and the maximum rainfall is around the Zhujiang Delta Areas and the Yunwushan and Yunkaidashan Mountains. The simulated rainfall amount is higher than that observed (especially in the inland area), with maximum rainfall of about 900 mm (Figure 8a). The simulated rainfall pattern along the coast is similar to the observation, as shown in Figure 5, but the heavy rainfall area in the inland area is connected with that along the coast instead of being separated from each other, as shown by what was observed. The distribution of the 10-day average wind field at 900 hPa (Figure 8a) is also similar to the observed mean (Figure 5). Apparently the model simulations not only capture the TD track and circulation well, but also realistically reproduce the rainfall associated with TD.
Figure 7. Simulated 900-hPa wind and 24-h rainfall by Exp CTL at 0800 BLT on (a) 29 August, (b) 30 August, (c) 31 August, (d) 1 September, (e) 2 September, (f) 3 September, (g) 4 September, (h) 5 September and (i) 6 September 2001.
Atmosphere 05 00016 g007
Figure 8. The simulated 10-day total rainfall (shaded, unit: mm) and mean 900-hPa wind (vectors, unit: m∙s–1) by Exps (a) CTL, (b) ND, (c) NT and (d) NLS.
Atmosphere 05 00016 g008

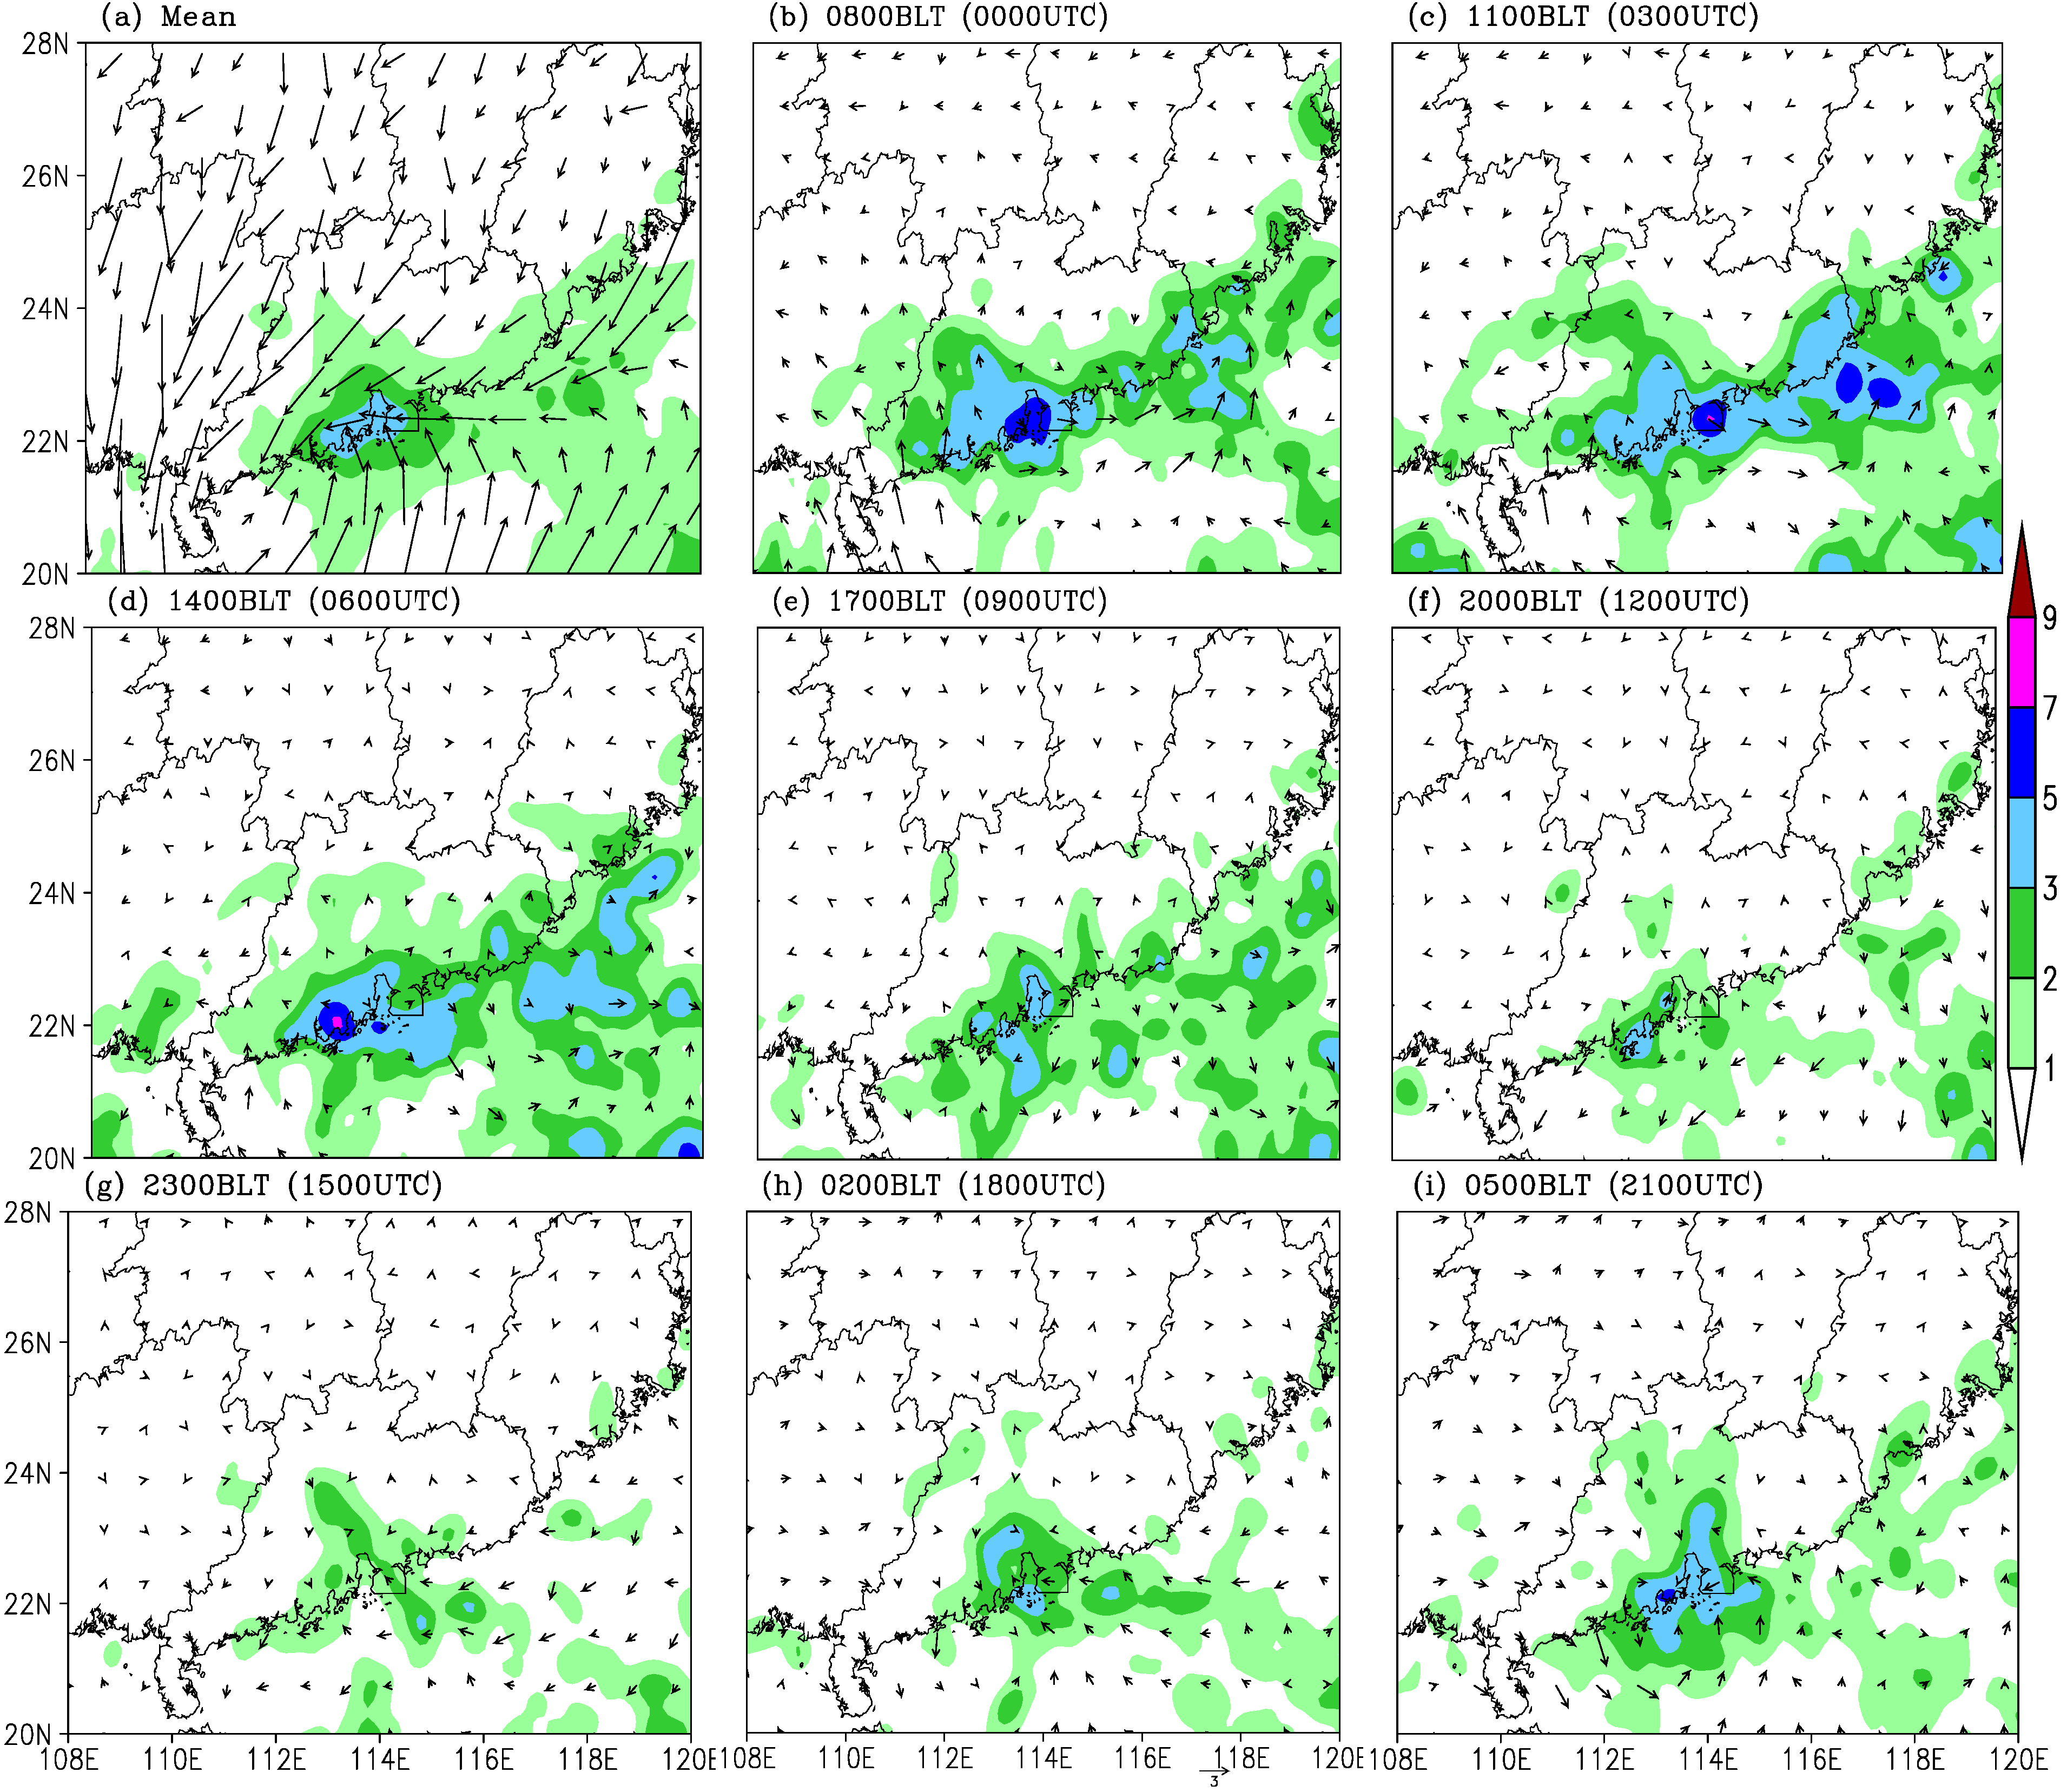
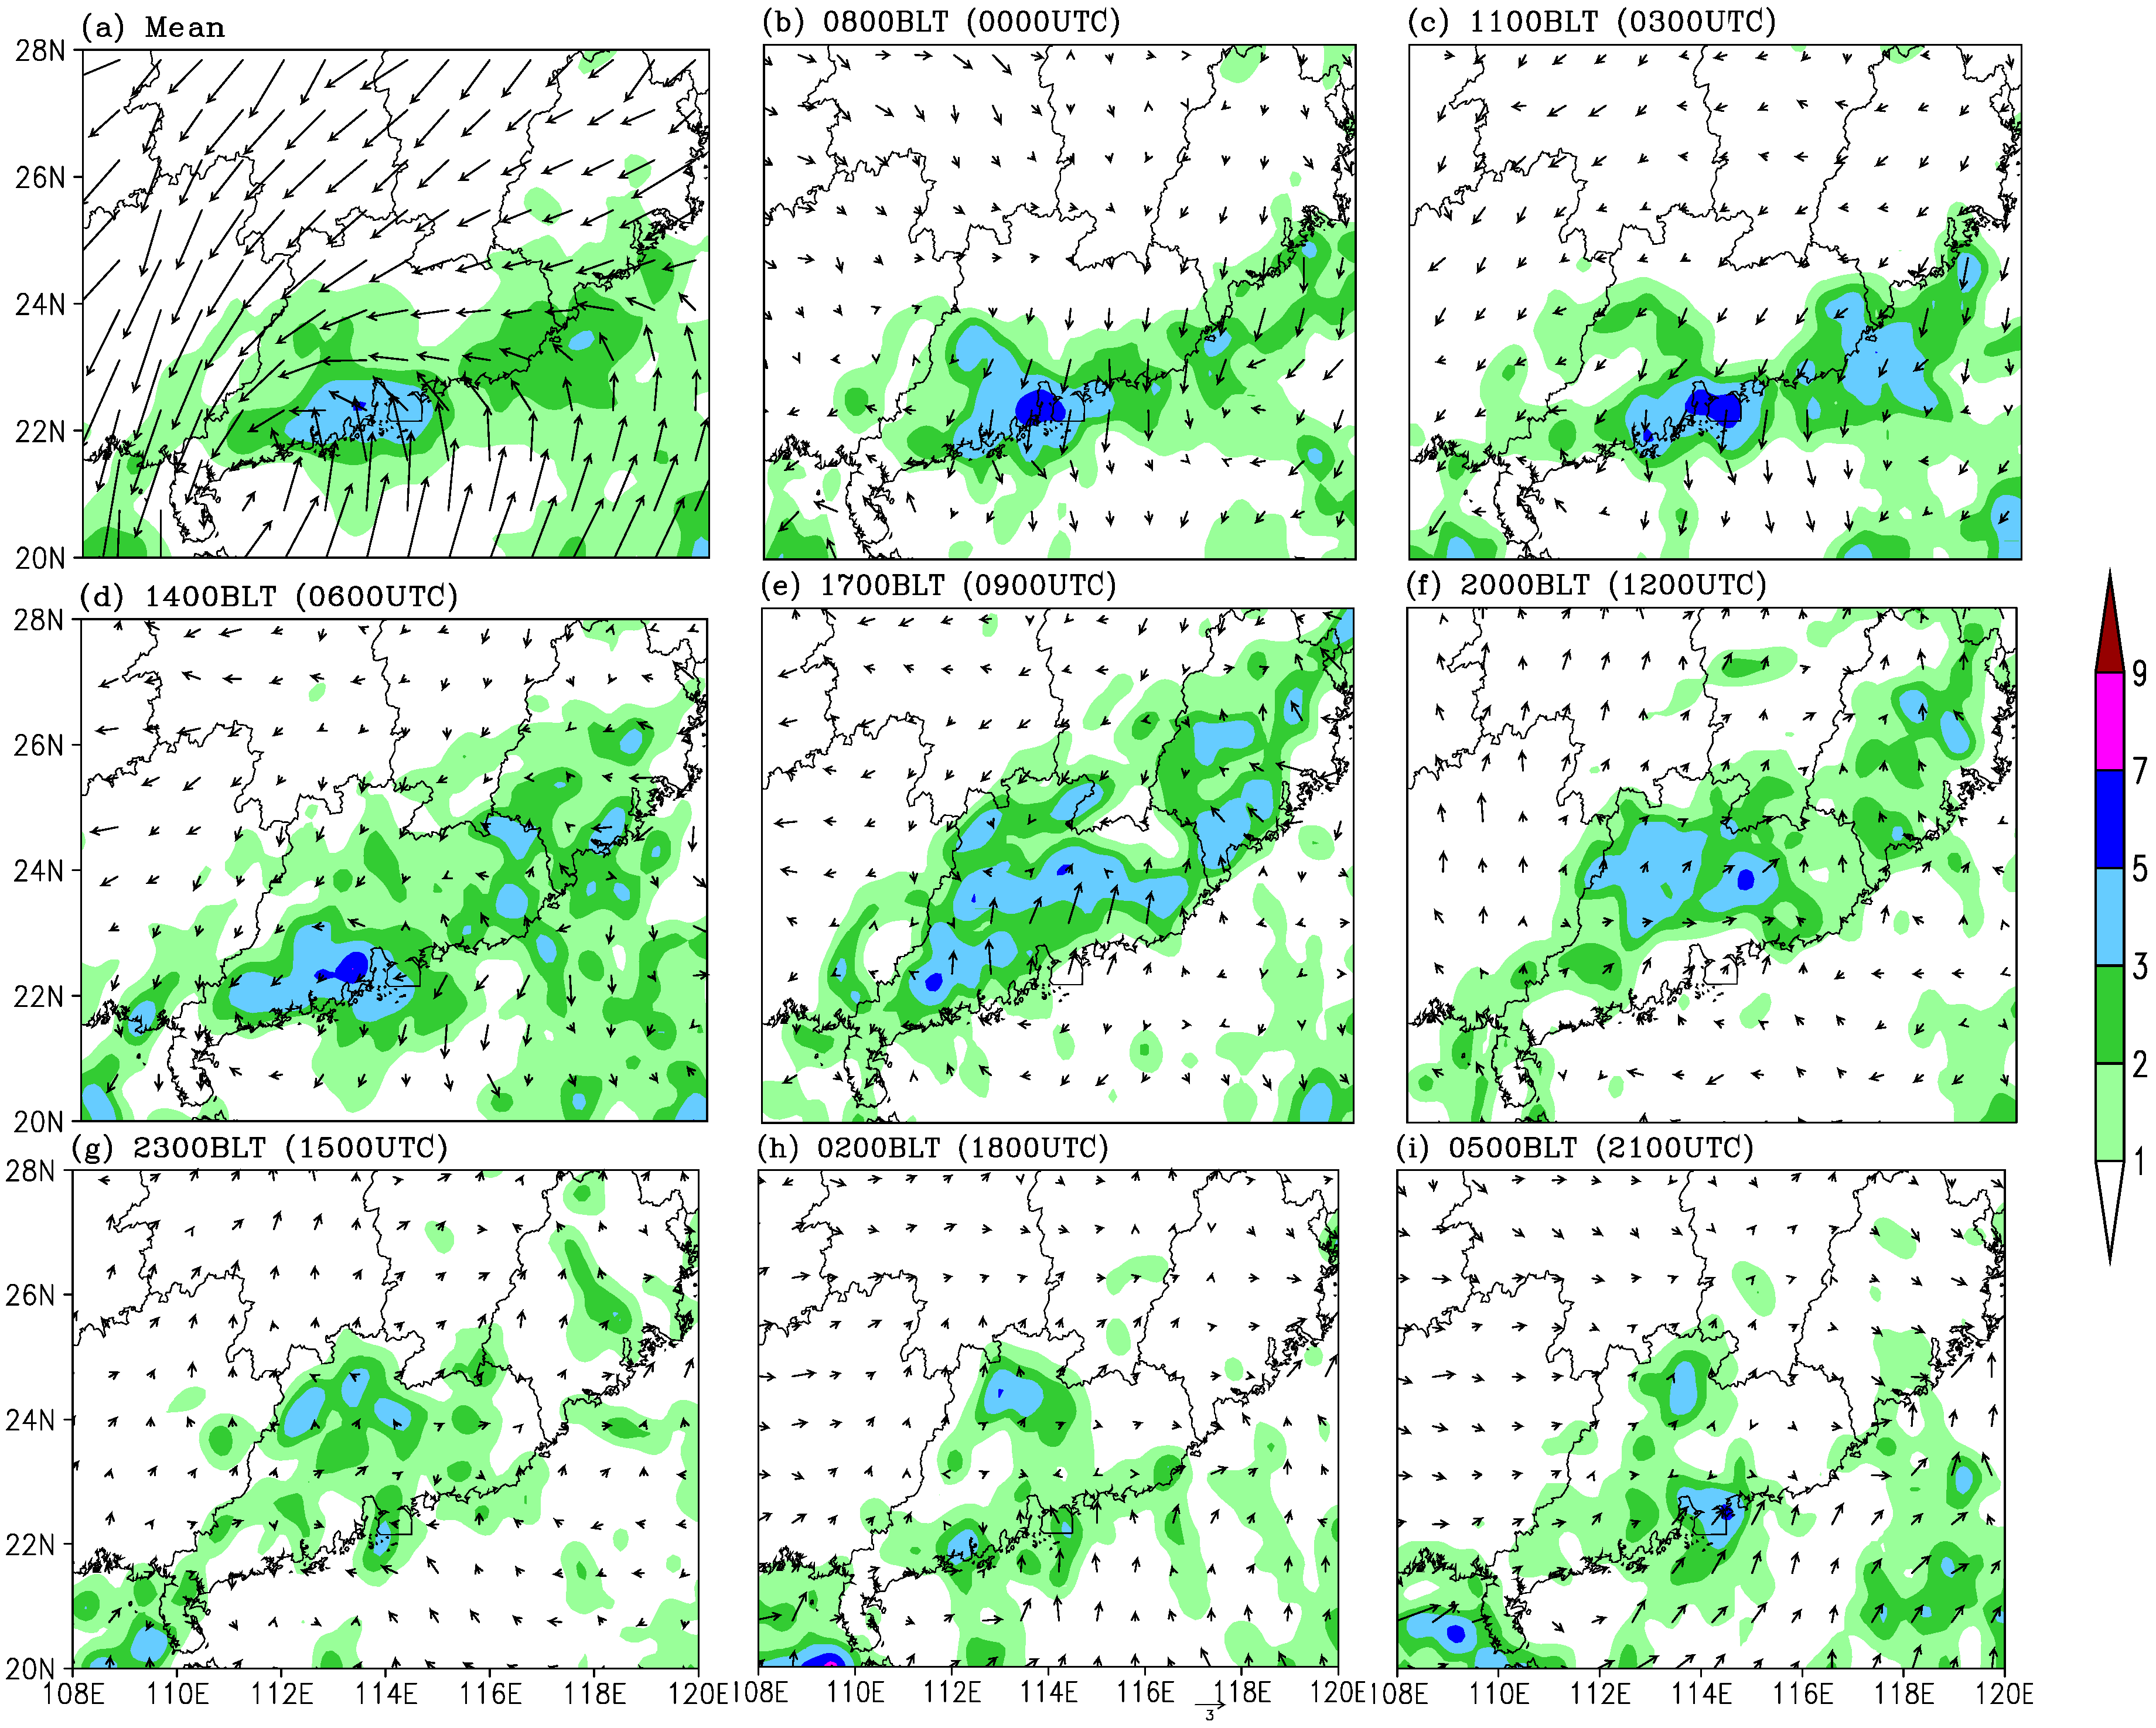
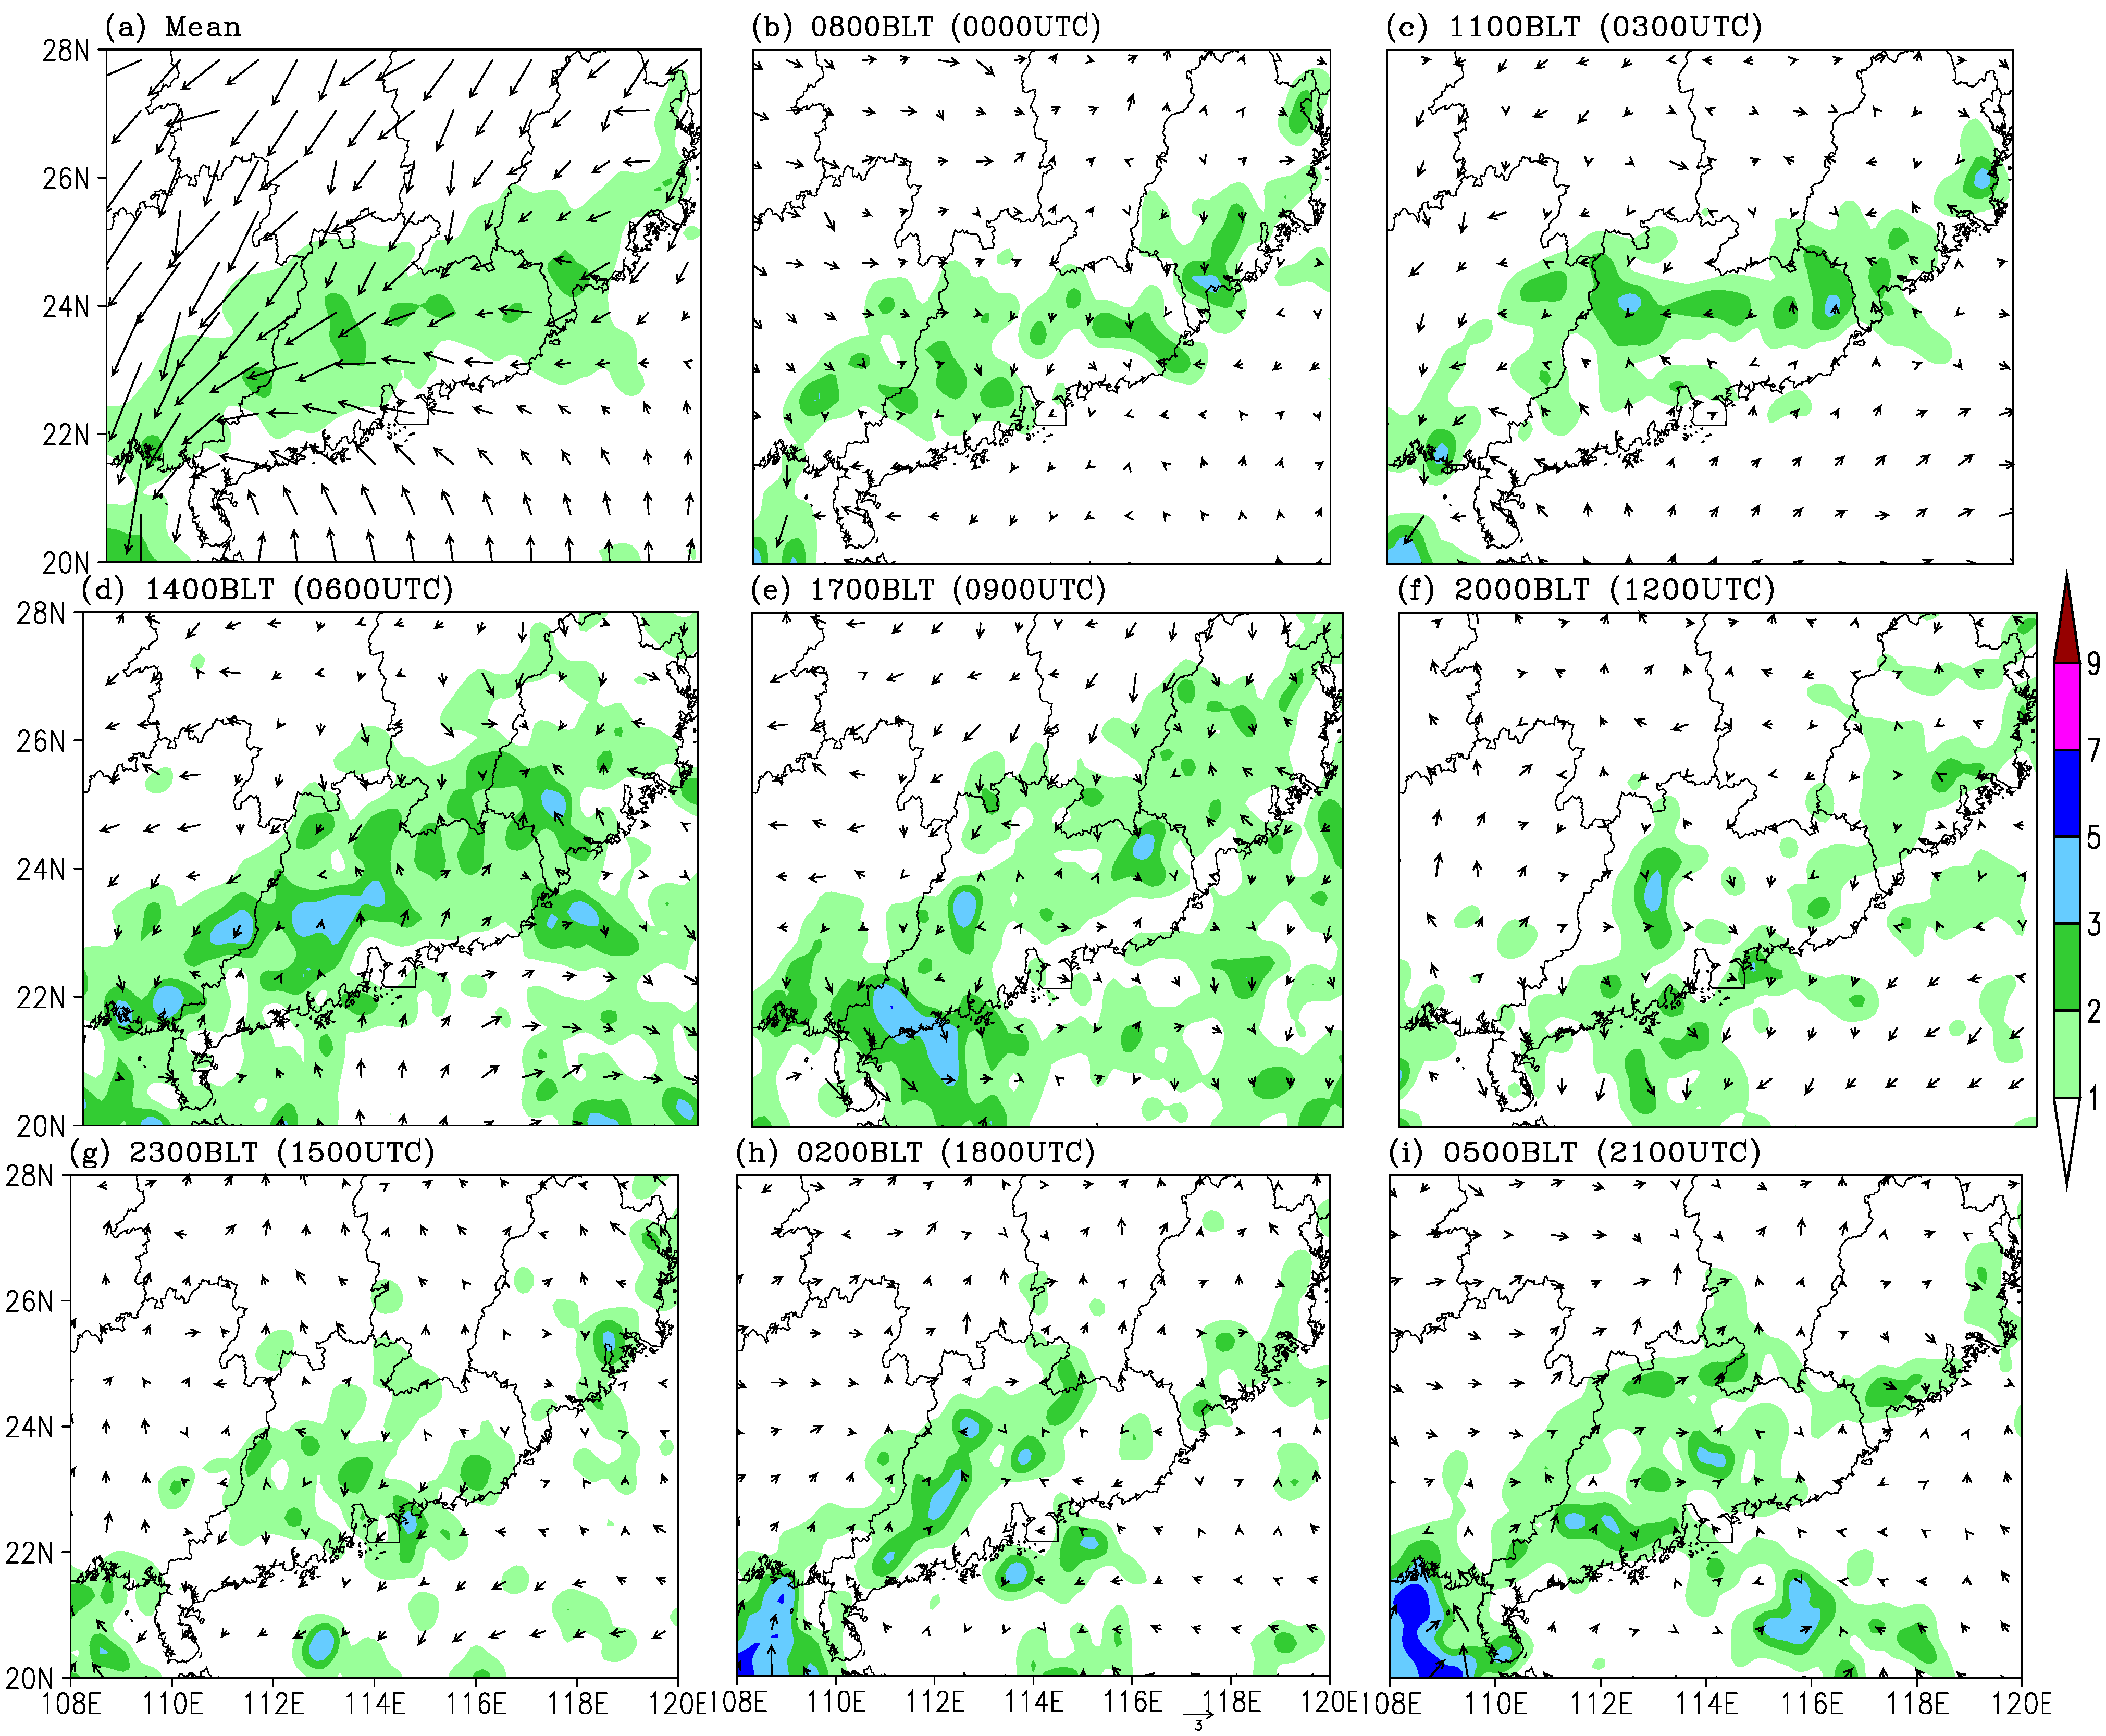
4.2. Diurnal Variation of Simulated Rainfall

Figure 9 displays the 10-day average hourly rainfall at 3-h intervals from Exp CTL.
Figure 9. The results of Exp CTL for mean hourly rainfall (shaded, unit: mm) and 10-m wind (contours, unit: m∙s–1) (a) and the diurnal evolution of rainfall intensity (shadings, unit: mm∙h–1) and anomalous 10-m wind (vectors, unit: m∙s–1) at (b) 0800 BLT, (c) 1100 BLT, (d) 1400 BLT, (e) 1700 BLT, (f) 2000 BLT, (g) 2300 BLT, (h) 0200 BLT and (i) 0500 BLT.
Atmosphere 05 00016 g009
The mean hourly rainfall is distributed like a band extending along the southeastern coast of Guangdong Province (Figure 9a) and is roughly similar to the observed rainfall (Figure 6a). In the early morning hours, a rainfall band begins to be organized along the southeastern coast of Guangdong Province, similar to the observed rainfall band (TRMM estimates). However, the rainfall on the inland of Jiulianshan’s mountainous area (Figure 9h,i) is a little different from the observation (Figure 6h,i). During the morning hours, the simulated rainfall develops into an organized rainfall band (Figure 9b,c), but it is a little closer to the inland side when compared with the observation (Figure 6b,c). In the noon-to-afternoon hours, the rainfall begins to activate in the inland region of Guangdong Province. The rainfall band becomes wider, with rainfall in the coastal area disappearing (Figure 9d,e). These features are consistent to what was observed (Figure 6d,e). It seems that the rainfall band moves northward away from the southeastern coast. The simulated rain band is well organized and located further north than what was observed. In the late-evening to night hours, the inland rainfall band disappears quickly (Figure 9f,g).
The above results indicate that the 10-day modeling simulations not only capture the diurnal features of rainfall, but also reproduce the northward propagating of the rainfall band in the afternoon hours and its rebuilding in the coastal area in the early morning hours of the next day.

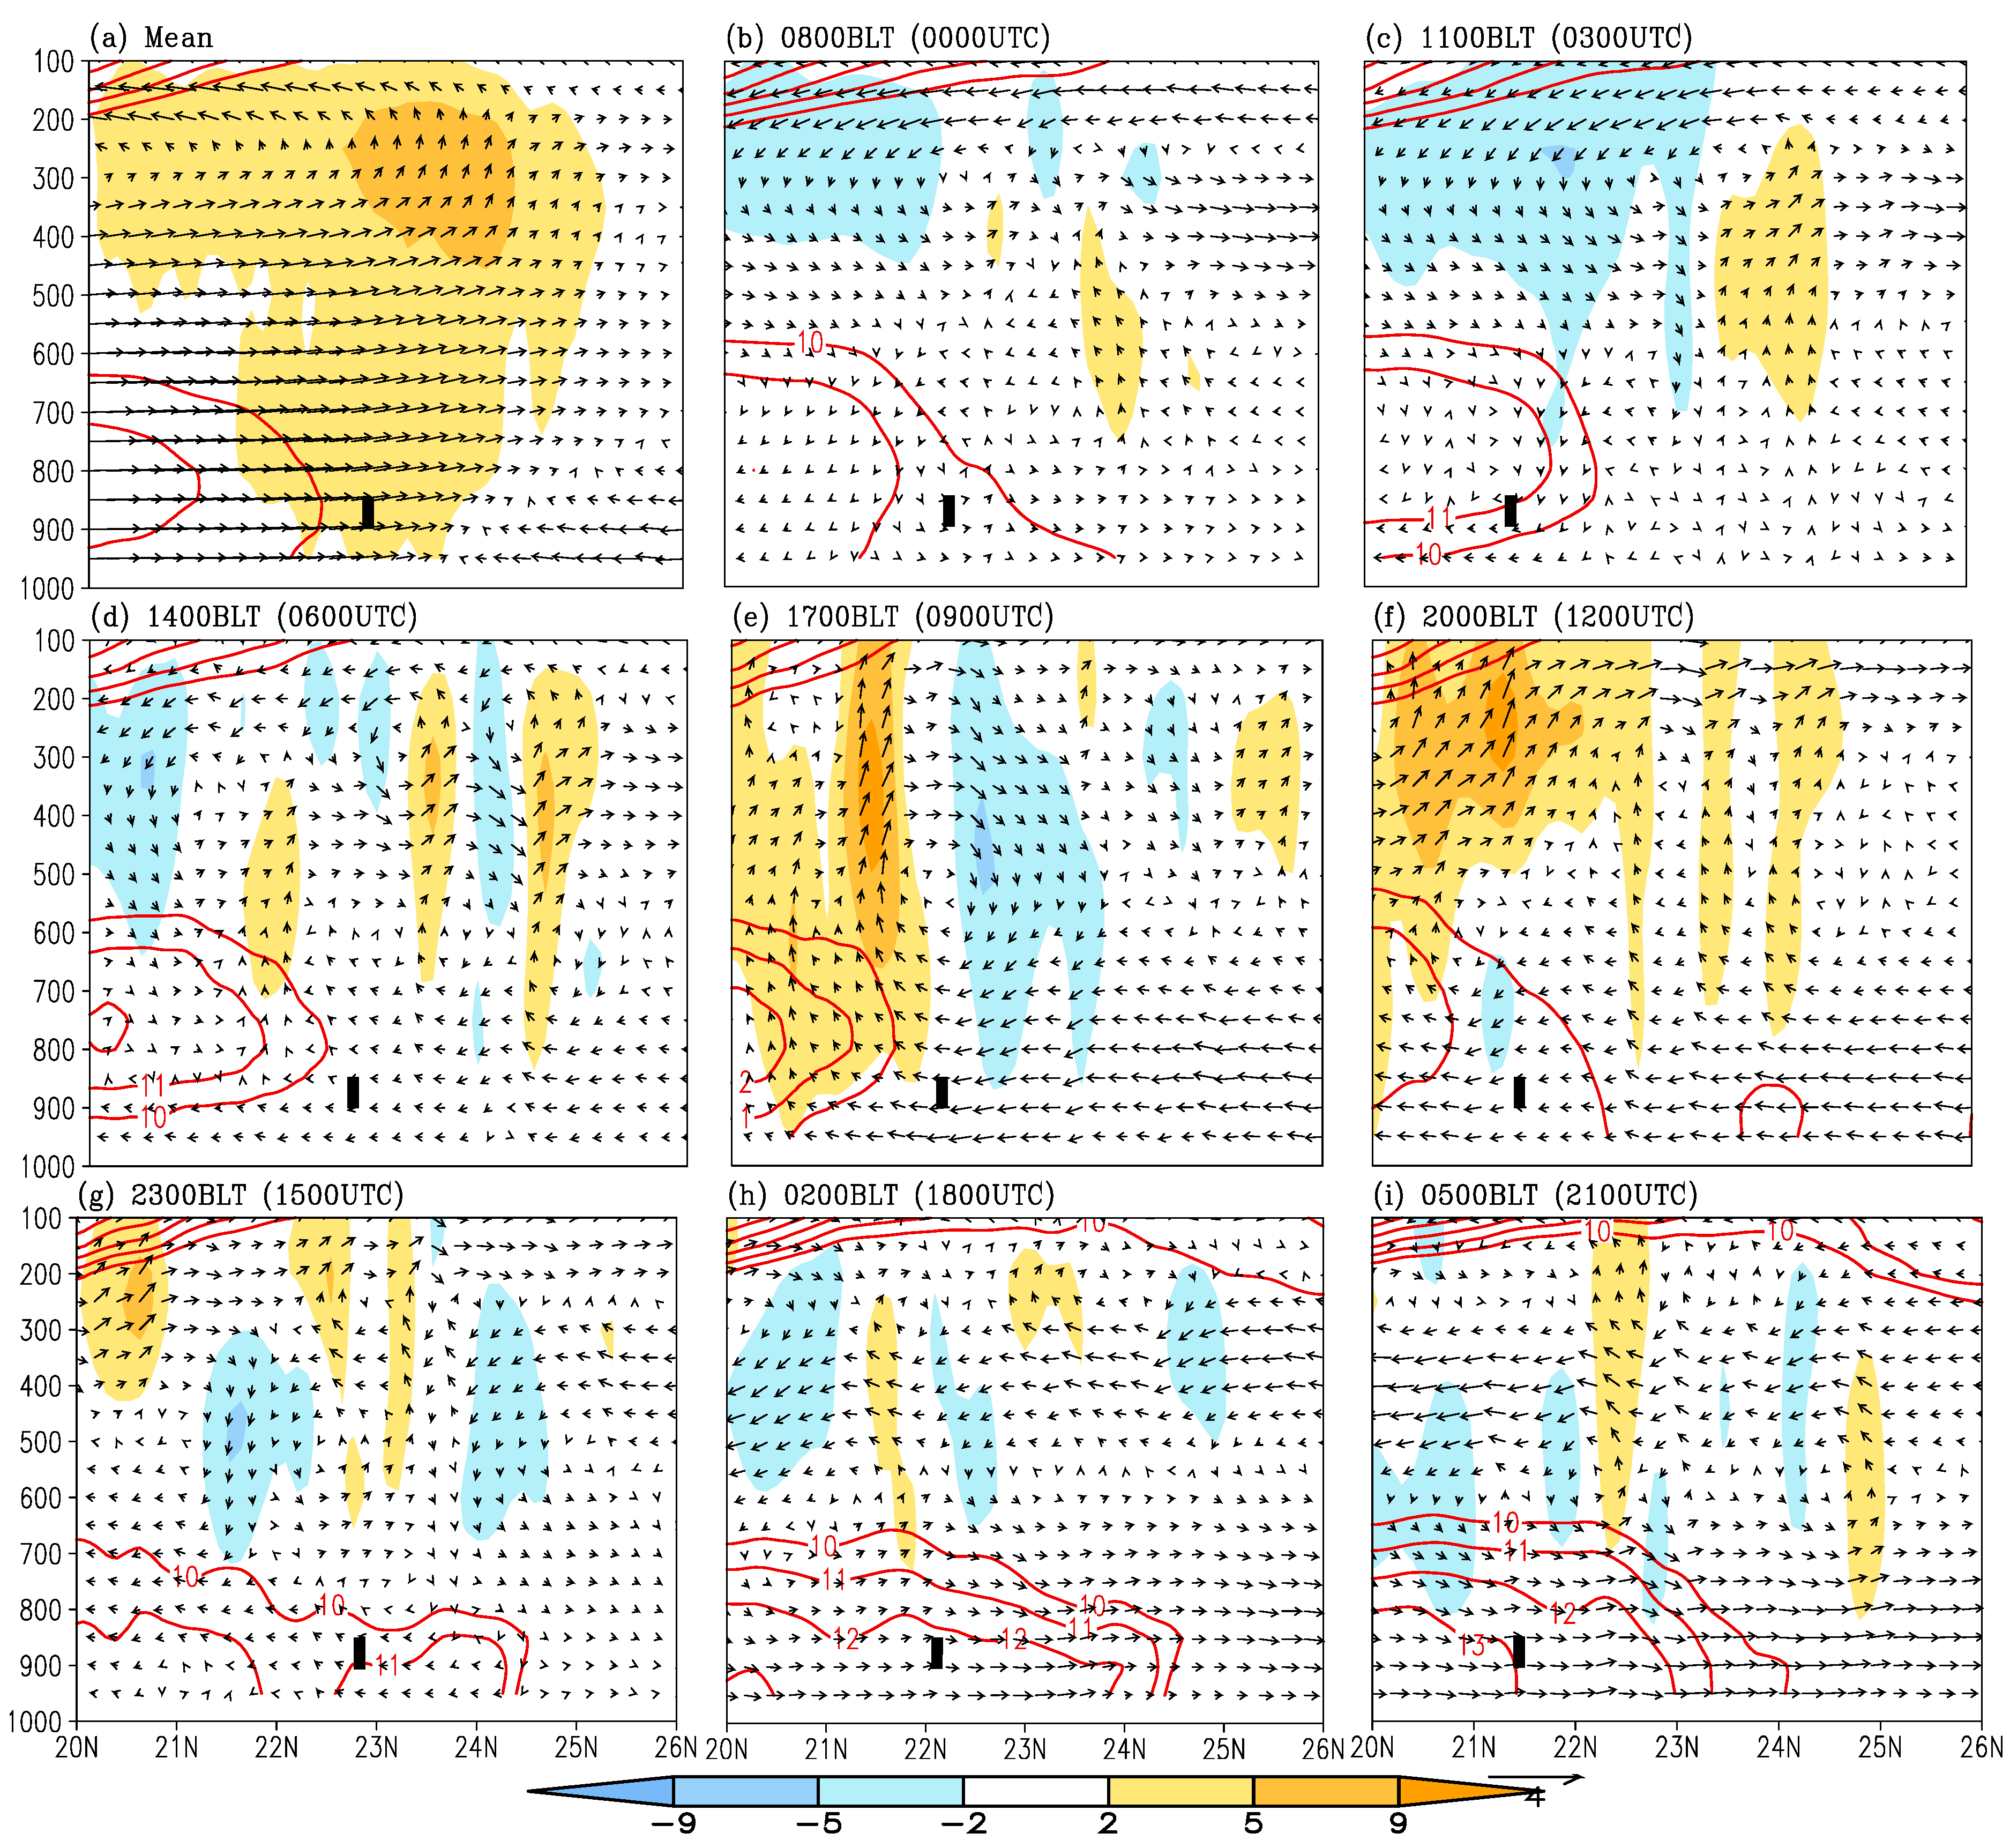
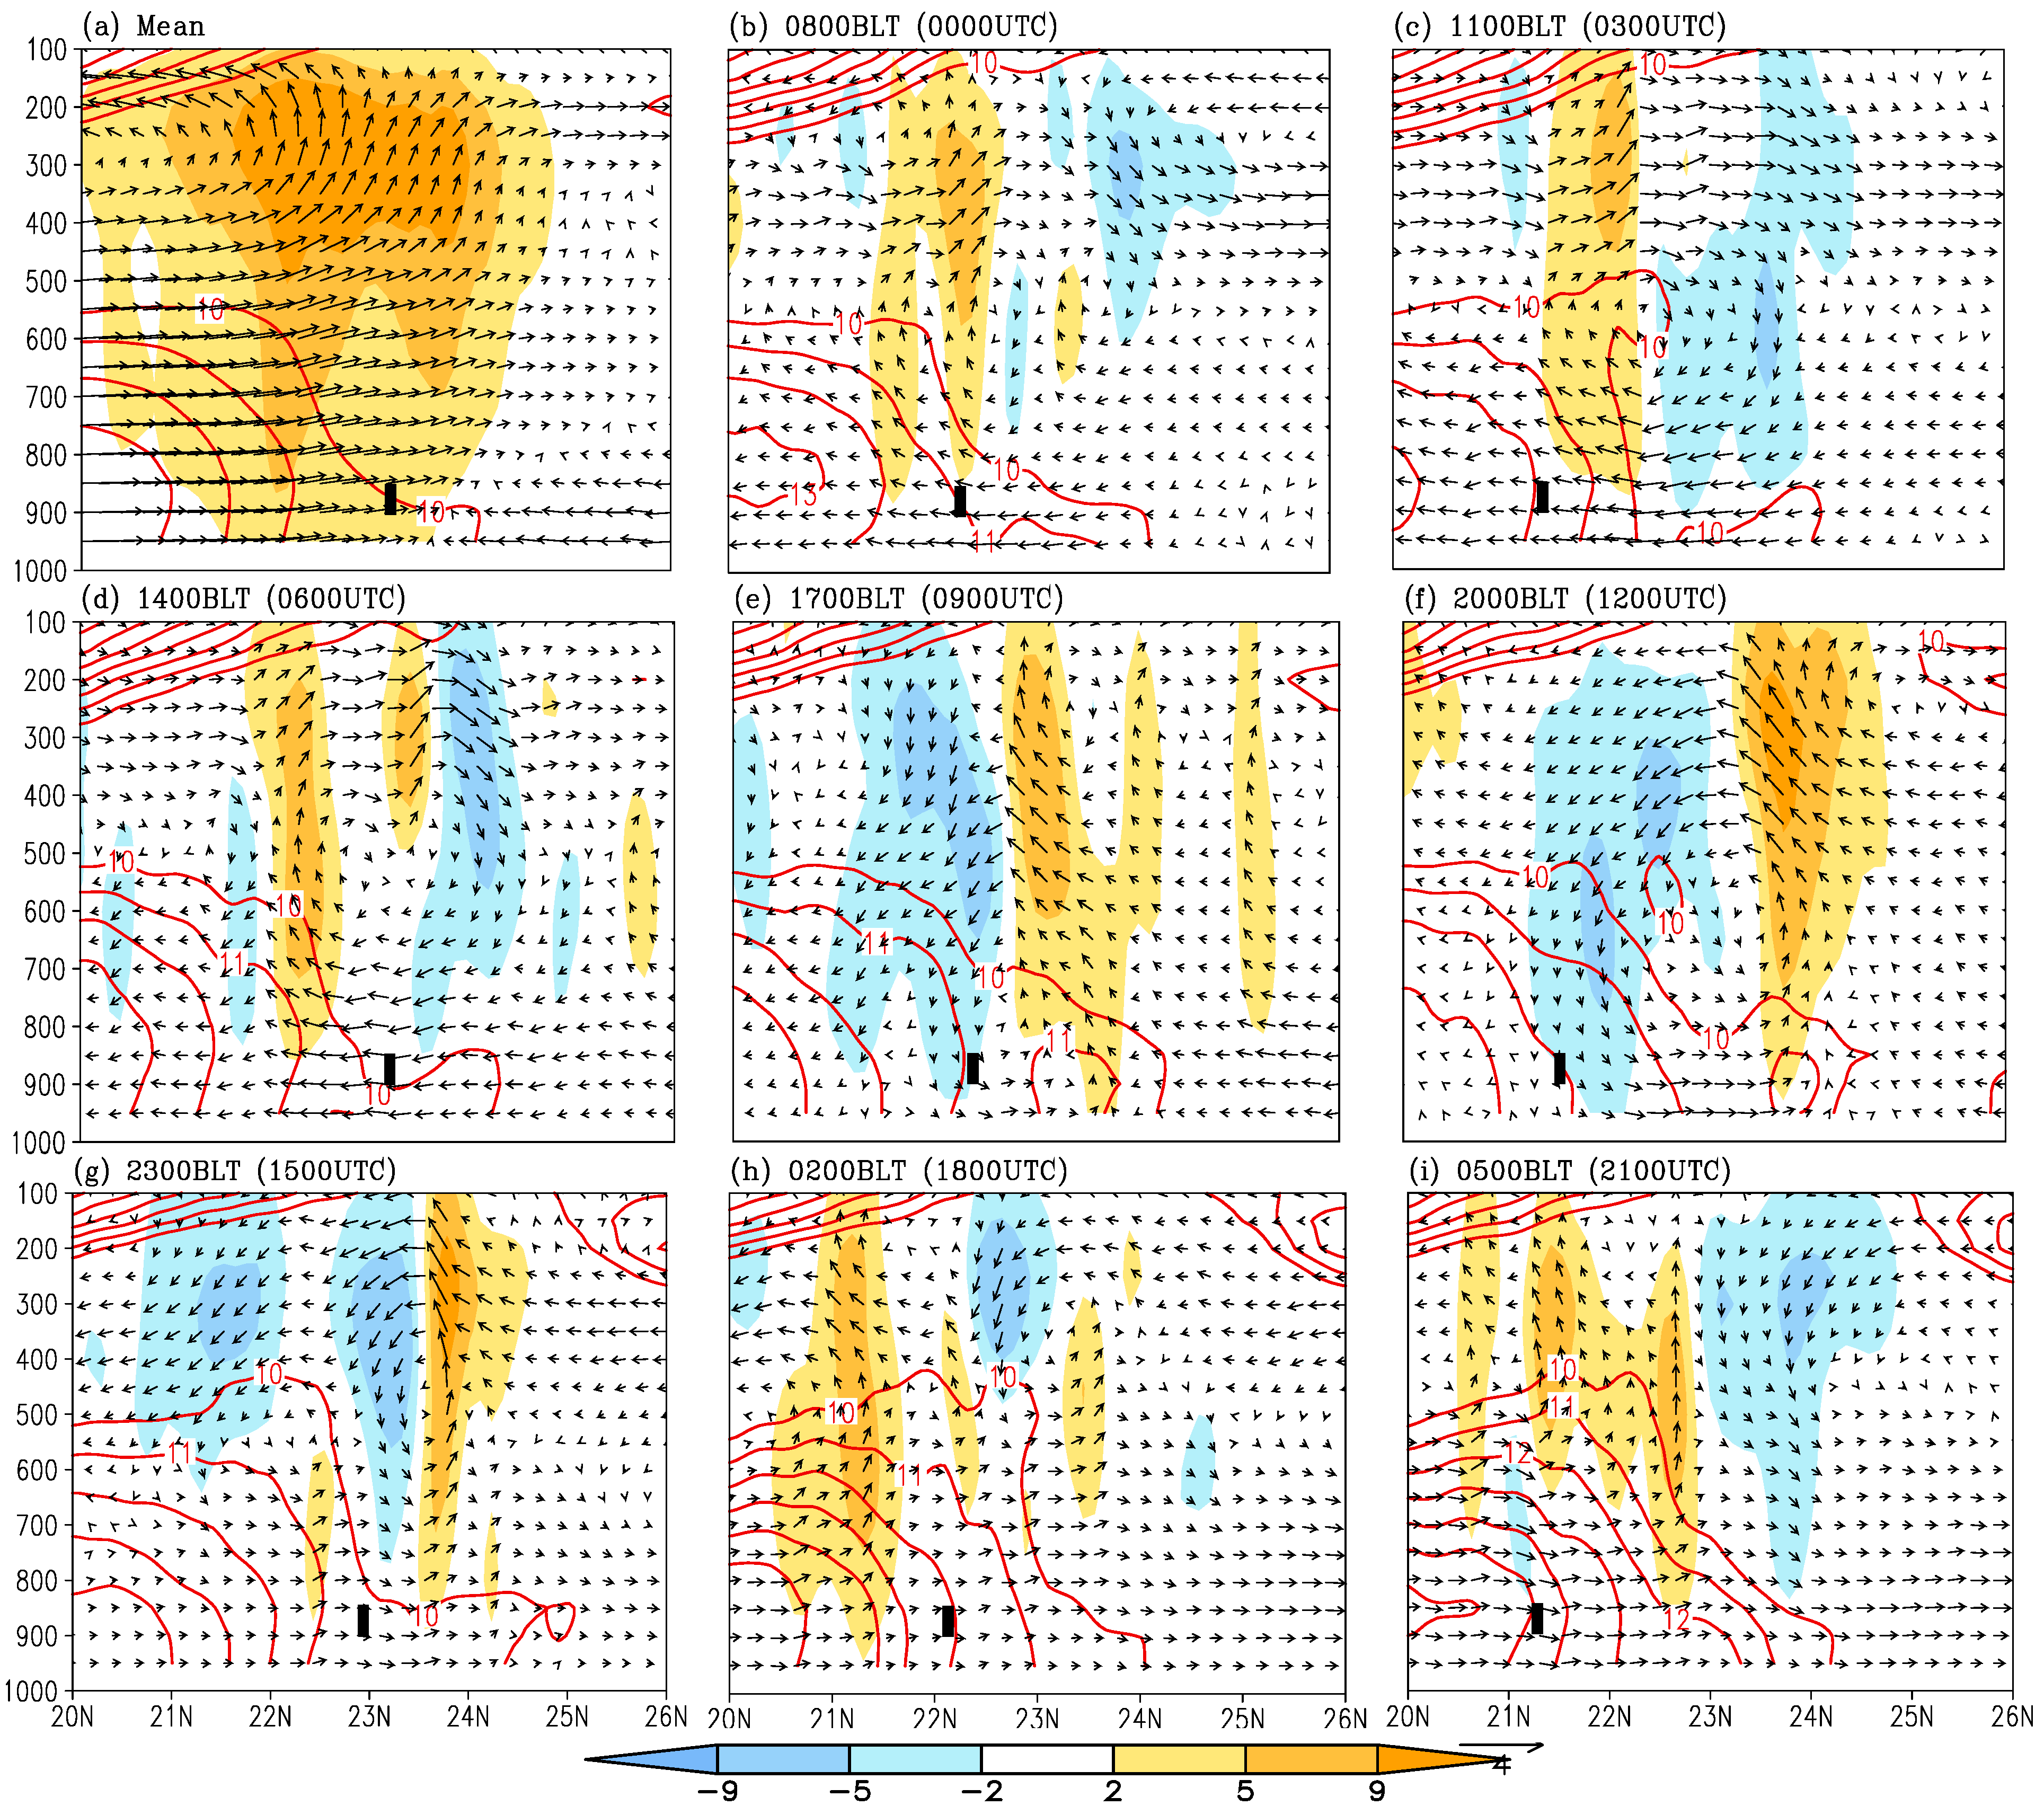
4.3. Diurnal Variation of Horizontal and Vertical Circulation along the Coastal Region

Figure 9 displays the simulated 10-day mean wind and the diurnal evolution of anomalous wind at 10 m above ground level (AGL). The mean wind field shows a cyclonic circulation dominating SC and the northern area of the SCS (Figure 9a). The anomalous wind field presents a clear diurnal variation. In particular, an anomalous northerly wind (offshore wind) blows into the sea water area near the coast from 0800 BLT to 1100 BLT, accompanied by a rain band along the coast. While the anomalous northerly wind gradually decreases (Figure 9b,c) and, finally, disappears, an anomalous southerly wind (onshore wind) begins to develop near the coast and blows from the ocean to the inland area at around 1400 BLT. Meanwhile, the rainfall band starts moving northward to the inland region (Figure 9d). The development of anomalous southerly wind (onshore wind) may be related to the rapid land surface warming (figure not shown), which reaches its peak at around 1700 BLT. At the same time, a rainfall band remains in the inland region (Figure 9e). Starting from 2000 BLT, the anomalous southerly wind diminishes quickly, and the inland rainfall becomes weaker (Figure 9f). The anomalous southerly wind (onshore wind) is the weakest at around 2300 BLT, which is also the time when the inland rainfall decreases to its minimum or even disappears (Figure 9g). The anomalous northerly wind (offshore wind) begins to develop in the early morning hours the next day, but it is very weak. Note that a strong anomalous southerly wind develops over the ocean close to the coast (Figure 9h,i). It may be the result of the nocturnal intensification of the low-level jet (LLJ) [46].
Significant diurnal variation is also found in the vertical circulation. The branch of upward/downward motion is in accordance with the diurnal cycles of anomalous northerly and southerly wind. Figure 10a illustrates the simulated 10-day mean vertical velocity and height-latitudinal circulation. Diurnal evolution of anomalous vertical velocity and height-latitudinal circulation averaged over 112–114°E are also shown in Figure 10b–i. The branch of mean upward motion is mainly located at 21–24°N, where two areas of large vertical velocity occur near 21.8°N and 23.5°N, respectively (Figure 10a). The anomalous vertical circulations at certain hours of the day are opposite to one another, with the updraft branch moving with the rainfall band. At 0800 BLT, the upward motion remains around 22°N, and the large downward motion appears near 24°N. A thermally-driven vertical circulation forms between 22°N and 24°N, accompanied by anomalous northerly and southerly winds at the low and high level, respectively (Figure 10b). At 1100 BLT, the vertical circulation is intensified, and the upward motion becomes dominant in the area of 21.5–22.5°N (Figure 10c). Later (1400 BLT), the updraft branch moves northward, and the downdraft branch weakens gradually (Figure 10d). At 1700 BLT, the vertical circulation pattern is totally reversed, with downward motion around 22°N and upward motion at 23–24°N (Figure 10e). This pattern sustains till 2000 BLT (Figure 10f) and is completely disrupted at 2300 BLT. The upward and downward motion exhibits a wave-like structure (Figure 10g). At 0200 BLT, an upward motion begins to develop south of 22°N, while the vertical circulation is not established yet (Figure 10h). At 0500 BLT, it is intensified with a downward motion forming around 24°N (Figure 10i). The vertical circulation is not built up by this time, because the anomalous southerly wind is still prevailing at the low level.
Figure 10. Exp CTL simulation of mean vertical velocity (shaded, unit: 10–2 m∙s–1) and height-latitudinal circulation (v, w) (a) and the diurnal evolution of anomalous vertical velocity (shaded, unit: 10–2 m∙s–1) and height-latitudinal circulation (v, w ) averaged over 112–114°E for the 10-day period at (b) 0800 BLT, (c) 1100 BLT, (d) 1400 BLT, (e) 1700 BLT, (f) 2000 BLT, (g) 2300 BLT, (h) 0200 BLT and (i) 0500 BLT. Units v and w are in m∙s–1; w is multiplied by 20. The contour interval is one, and only those horizontal winds greater than 10 m∙s–1 are shown. The black bar roughly demonstrates the land-sea boundary.
Atmosphere 05 00016 g010
The diurnal variation of vertical circulation is related to the diurnal oscillation of near-surface anomalous wind, which may be associated with the land-sea breeze. The vertical circulation itself, however, is not exactly the same as the classical land and sea breezes studied by Neumann and Mahrer [47] and Rotunno [48], who pointed out that the land-sea breeze circulation mainly occurs in the boundary layer. Here, in the case of this study, the vertical motion actually penetrates deep into the upper level and, hence, is not a vertical circulation solely caused by the land-sea breeze. It is also affected by the TD’s circulation and the condensational latent heating of heavy rainfall.

4.4. Effect of Diurnal Solar Radiation Forcing

The diurnal rainfall pattern is often found to be a result of the diurnal oscillation of solar radiation forcing, whose effect can be amplified and localized by the topography [21,28,29] and the land-sea thermal difference [24,25]. However, the numerical results of the diurnal pattern of rainfall in northwestern South America by Mapes et al. [26] surprisingly showed that the 10-day accumulated rainfall pattern with fixed solar radiation was nearly the same as that with the diurnal cycle. Mapes et al. [26] accordingly deduced that diurnal cycle effects might be secondary to the time-mean effects of a geographical structure. Here, Exp ND is carried out to verify the effect of diurnal solar radiation forcing on the diurnal pattern of rainfall. Figure 8b illustrates the 10-day accumulated rainfall distribution from Exp ND results. It shows that, without diurnal variation in solar radiation forcing, the heavy rainfall band is mainly along the coastal region. Maximum rainfall is found in the Zhujiang Delta Area and east of the Yunwushan Mountains. The weakened sea breeze in Exp ND certainly plays a role. Note that the rainfall in the inland of SC is drastically decreased in Exp ND, implying that the inland rainfall is mainly derived from thermal convection driven by solar radiation heating. Besides, the Exp ND may suggest that the simulated narrowly concentrated rainfall along the coast, at least partially, is a consequence of the coastal mechanical forcing, namely the differential water-land surface friction.
The 10-day mean hourly rainfall from Exp ND is much weaker than that from Exp CTL, although the rainfall band is still located along the southeastern coast. The rainfall does not extend into the inland as far as in Exp CTL, while weak rainfall remains in the north of the SCS, like in Exp CTL (Figure 11a). The 10-day average hourly rainfall at 3-h intervals from Exp ND indicates that the diurnal pattern of rainfall is significantly changed. The rainfall band is invariably maintained along the coastal region all day. That is, it does not move to the inland in the afternoon hours. The intensity and area of rainfall along the coastal region, however, shows a pattern of diurnal variation. Specifically, the rainfall is relatively strong in the morning hours (Figure 11b) and reaches the peak value in late-morning hours (Figure 11c), then diminishes gradually in the late afternoon (Figure 11d,e) and reduces to its minimum value at night (Figure 11f,g). The rainfall develops again in the early morning hours of the next day (Figure 11h,i). It is surprising that the rainfall along the coastal region still exhibits clear signals of diurnal variation, even without diurnal solar radiation oscillation. Diurnal boundary conditions could be responsible for the diurnal signature in Exp ND.
Figure 11. The results of Exp ND for mean hourly rainfall (shaded, unit: mm) and 10-m wind (contours, unit: m∙s–1) (a) and the diurnal evolution of rainfall intensity (shadings, unit: mm∙h–1) and anomalous 10-m wind (vectors, unit: m∙s–1) at (b) 0800 BLT, (c) 1100 BLT, (d) 1400 BLT, (e) 1700 BLT, (f) 2000 BLT, (g) 2300 BLT, (h) 0200 BLT and (i) 0500 BLT.
Atmosphere 05 00016 g011
The mean horizontal wind at 10 m AGL is distributed like that in Exp CTL, with a cyclonic circulation dominating SC and the northern area of the SCS (Figure 11a). The evolution of anomalous horizontal winds at 10 m AGL is, however, totally different from that in Exp CTL (Figure 11b–i). Without diurnal oscillation of solar radiation forcing, no obvious anomalous northerly or southerly wind develops in the morning or late-afternoon hours, and the rainfall band does not swing back and forth between the inland and coastal areas.
The mean upward motion in Exp ND is mainly concentrated around 22°N, which is consistent with the location of the coastal rainfall band. Neither closed height-latitudinal circulation across the coastline nor the reversal of vertical circulation are found in a day (figure omitted). Hence, it can be deduced that the diurnal variation of closed vertical circulation mainly results from the diurnal solar radiation forcing. Without diurnal solar radiation forcing, diurnal variation is still found in the vertical motion near the coast, but it is not that clear in the LLJ.

4.5. Topographic Impacts

What roles the coastal topography and Nanling Mountains play in the diurnal rainfall pattern is one question we try to answer in this study. It is hypothesized that the topographically-induced upward motion along the coast is favorable for the formation of a heavy rainfall band along the southeastern coast. The thermal-dynamic forcing of the Nanling Mountains in the north of SC is assumed to establish a longitudinal MPS that can modulate the diurnal rainfall pattern. If this is the case, the possible thermodynamic circulation in the early morning hours would be favorable for convection initiation and rain-band formation along the coast.
Figure 8c displays the 10-day accumulated rainfall from Exp NT. The spatial distribution of rainfall is roughly similar to that in Exp CTL, with two heavy rainfall bands located along the coastline of Guangdong Provinces and in the inland region of SC, respectively. However, the accumulated rainfall is less than that in Exp CTL, not only along the southeast coast, but also in the inland area. This implies that the topography in SC is only one factor that affects rainfall enhancement, but it is not dominant in determining total rainfall. In addition, the diurnal rainfall pattern is not determined by the topography in SC. Figure 12 shows the 10-day average hourly rainfall at 3-h intervals from Exp NT. The diurnal features of rainfall are roughly like those from Exp CTL, but the rainfall at each hour is weaker than that from Exp CTL. This further implies the role of topography in SC in coastal rainfall enhancement.
The mean horizontal wind and the diurnal evolution of anomalous horizontal wind at 10 m AGL from Exp NT is similar to those from Exp CTL, while the anomalous horizontal wind (Figure 12) is weaker than that in Exp CTL (Figure 9) all the time. This result suggests that the topography in SC amplifies the diurnal oscillation of anomalous horizontal wind.
Without the effects of topography, two branches of mean upward vertical velocity are more evident than in Exp CTL, where the mean upward vertical velocity is at 21–24°N and not clearly separated into two parts. The vertical circulation across the coast shows distinct diurnal change (figure omitted), whereas the details of mesoscale circulation are a little different from those in Exp CTL.
Figure 12. The results of Exp NT for mean hourly rainfall (shaded, unit: mm) and 10-m wind (contours, unit: m∙s–1) (a) and the diurnal evolution of rainfall intensity (shadings, unit: mm∙h–1) and anomalous 10-m wind (vectors, unit: m∙s–1) at (b) 0800 BLT, (c) 1100 BLT, (d) 1400 BLT, (e) 1700 BLT, (f) 2000 BLT, (g) 2300 BLT, (h) 0200 BLT and (i) 0500 BLT.
Atmosphere 05 00016 g012

4.6. Role of Land-Sea Contrast

The role of land-sea thermal contrast in the convection initiation and rainfall formation has been examined in many studies [24,25,26,49,50]. However, the role of land-sea contrast may not be predominant under strong synoptic-scale forcing. For the case in our current study, the TD Fitow provides a strong synoptic-scale forcing in SC. Does the land-sea contrast exert a significant influence on the diurnal pattern of rainfall associated with TD?
Figure 8d displays the 10-day accumulated rainfall of Exp NLS. Note that the accumulated rainfall is evidently reduced when compared with Exp CTL (Figure 8a). In other words, the rainfall would be greatly reduced in SC if the ocean did not exist to the south of SC. This result shows the importance of evaporation and direct moisture transportation over the SCS in the formation of heavy rainfall, as pointed out by Zhao et al. [51]. In addition, the heavy rainfall band along the coastline disappears, and the rainfall is now concentrated in the inland of Guangdong and Fujian Provinces. This further indicates the possible role of the coastal mechanical effect. Besides, it implies that the observed heavy rainfall band along the coast results largely from the land-sea contrast instead of from the impact of coastal topography. It is also noteworthy that the heavy rainfall is mainly located in the windward slopes of the mountains, suggesting that the upslope lifting of Nanling Mountain may play a critical role in the enhancement of rainfall.
The mean hourly rainfall is not located along the coast either, but in the inland area of SC (Figure 13a). The evolution of 10-day-averaged hourly rainfall at 3-h intervals is totally different from that in Exp CTL. Specifically, during the morning hours, the rain band is located in the windward (south) slope of the Nanling Mountains (Figure 13b,c). In the afternoon hours, the area of convective rainfall enlarges and extends to the area where the ocean is replaced by grassland in Exp NLS (Figure 13d,e). Both the area and intensity of rainfall decrease gradually in the late-afternoon to night hours (Figure 13f,g). In the early morning hours of the next day, the convective rainfall seems to intensify again (Figure 13h,i). Without the land-sea contrast, the diurnal variation of rainfall in Exp NLS may be derived primarily from the dynamic or thermodynamic effects of topography in SC.
Figure 13. The results of Exp NLS for mean hourly rainfall (shaded, unit: mm) and 10-m wind (contours, unit: m∙s–1) (a) and the diurnal evolution of rainfall intensity (shadings, unit: mm∙h–1) and anomalous 10-m wind (vectors, unit: m∙s–1) at (b) 0800 BLT, (c) 1100 BLT, (d) 1400 BLT, (e) 1700 BLT, (f) 2000 BLT, (g) 2300 BLT, (h) 0200 BLT and (i) 0500 BLT.
Atmosphere 05 00016 g013
The Exp NLS results of the mean horizontal wind (Figure 13a) and anomalous horizontal wind at 10 m AGL (Figure 13b–i) are much weaker than those in Exp CTL. No significant anomalous northerly or southerly wind develops in the low level at all hours of day. Moreover, the mean upward motion becomes much weaker and moves to the area around 24°N (Figure 14a). The anomalous vertical circulation becomes weaker, too. The anomalous upward and downward motion exhibits a wave-like structure at most hours (Figure 14b–i).
Figure 14. Exp NLS simulation of mean vertical velocity (shaded, unit: 10–2 m∙s–1) and height-latitudinal circulation (v, w) (a) and the diurnal evolution of anomalous vertical velocity (shaded, unit: 10–2 m∙s–1) and height-latitudinal circulation (v, w ) averaged over 112–114°E for the 10-day period at (b) 0800 BLT, (c) 1100 BLT, (d) 1400 BLT, (e) 1700 BLT, (f) 2000 BLT, (g) 2300 BLT, (h) 0200 BLT and (i) 0500 BLT. Units v and w are in m∙s–1; w is multiplied by 20. The contour interval is one, and only those horizontal winds greater than 10 m∙s–1 are shown. The black bar roughly demonstrates the land-sea boundary.
Atmosphere 05 00016 g014

5. Discussions

Climatologically, SC enters the post-flooding season (July to September) when the WPSH moves further north and the main rainfall band shifts to North China. SC is mainly influenced by tropical systems, such as TDs, easterly waves, tropical convergence zones, etc. A statistical study shows that the diurnal variation of rainfall associated with TD contributes a lot to the climatic features of diurnal rainfall change (Figure 15). As shown in Figure 15a, the climatically-averaged hourly rainfall is mainly located along the southeastern coast. The diurnal evolution of rainfall intensity and frequency is very distinct (Figure 15b–i). Note that the rainfall intensity and frequency both reach their peak during the late-afternoon hours in the inland region (Figure 15e). This result is similar to that of Zhou et al. [13], who revealed that the diurnal rainfall in summer (June to August) had a late-afternoon maximum in southern China. The intensity of rainfall associated with TD in the present study, however, shows a morning maximum along the coast (Figure 3c), and its frequency has a late-afternoon maximum in the inland region (Figure 3e). Apparently, the diurnal variation of rainfall associated with TD is unique. The TD-related rainfall along the coast in the morning hours is the most intensive in a day, and the convective rainfall over the inland is more prone to happen in the late afternoon, due to the thermal forcing of topography. The diurnal rainfall variation is still significant, even under strong synoptic-scale forcing.
Figure 15. Mean hourly rainfall (shaded, unit: mm) and rainfall occurrence frequency (contours, unit: %) (a) and the diurnal evolution of rainfall intensity (shadings, unit: mm∙h–1) and rainfall occurrence frequency (contours, unit: %) for the 2000-2009 climatology from July to September based on TRMM estimates at time of (b) 0800 BLT, (c) 1100 BLT, (d) 1400 BLT, (e) 1700 BLT, (f) 2000 BLT, (g) 2300 BLT, (h) 0200 BLT and (i) 0500 BLT.
Atmosphere 05 00016 g015
The development of a coastal rainfall band in the early-morning hours is largely attributed to a land-breeze front that develops along the coastal region, which results from the land-sea thermal contrast (figure not shown). At night, the convective available potential energy (CAPE) and latent heat fluxes remain high over the ocean. The surface temperature in the inland area decreases significantly, due to long-wave radiation cooling [50], while the sea surface temperature does not change much, because of its huge thermal inertia [52]. The boundary layer in the inland region tends to be more stabilized than that over the ocean. In the early-morning hours, the difference in land and sea surface temperatures reaches the maximum, and the land-breeze front is intensified (figure not shown). The land-breeze front is favorable for the initiation and organization of convection [51]. Meanwhile, the land breeze (anomalous northerly wind), which is opposite to the prevailing wind, leads to a low-level convergence and subsequent upward motion superposing on the prevailing wind near the coastline [53,54]. In addition, the intensification of LLJ in the early morning hours also makes a contribution to the initiation and organization of coastal convective rain band.
In the daytime, the difference between land and sea surface temperatures decreases, since the land surface temperature goes up quickly, due to short-wave radiation heating. The land-breeze front weakens, and the convective rainfall band along the coastal region diminishes. At the same time, the CAPE and latent and sensible heat fluxes in the inland area start to increase with surface heating [55,56,57]. In the late-afternoon hours, the contrast between land and sea surface temperature starts to increase again, but with the opposite sign to that in the early morning. At the time when the difference between the land and sea surface temperature reaches its peak value, the convective rainfall band along the coast almost disappears. Although the daytime short-wave radiation heating is stronger than the nighttime long-wave radiation cooling, the difference between land and sea surface temperature in the late afternoon seems to be less than that in the early morning. This may be attributed to the shading effects of stratus clouds near the coastal region of convection. In addition, the convective boundary layer quickly develops in the inland area, while the features of the boundary layer in the SCS do not change as drastically as those in the inland area. As a result, the relatively stratified sea breeze (anomalous southerly wind), which is in the same direction as the prevailing wind, accelerates the synoptic scale flow. The topographically-induced lifting and upward motion in SC are possibly enhanced with the accelerated flow. This apparently is favorable for the convection development in the topographical area.
The development of inland rainfall in the noon-to-late-afternoon hours is mainly due to active convective activities. The thermodynamic effect of inland topography plays a crucial role in the initiation of inland convective rainfall [49]. The results of Exp ND agree well with the above conclusion and show that the inland convective rainfall almost disappears without the diurnal oscillation of solar radiation forcing (Figure 8b). In addition, there is an anomalous downward motion over the inland area in the morning hours when the convective rainfall is developing along the coastal region. (Figure 10c,d). The downdraft of preexisting convection is not favorable for the formation of convective rainfall over the inland area in the morning hours, but its influence in the formation of afternoon convective rainfall is a little complicated. Saito et al. [58] suggested that precipitation-induced downdrafts may introduce additional cold air to the boundary layer and make the triggering mechanism of inland convection more complex.
The importance of land-sea contrast in the formation of convective rainfall along the coastal region is illustrated by the results of Exp NLS. The heavy rainfall band would not form along the coast if there were no land-sea contrast. Hence, the land-sea contrast not only affects the diurnal variation of convective rainfall, even in a TD-influenced precipitation event, but also determines the formation of heavy rainfall bands along the coast. Some studies argued that the friction may be a primary factor responsible for the formation of coastal rain bands [26], but the present sensitivity experiment without friction differences between the SCS and the inland area shows that the major rain band still exists along the coastal area (figure not shown). The rainfall band, however, drifts inland a bit. This result further proves that the land-sea contrast is the dominant factor for the formation of coastal rain bands, and the coastal mechanical effect plays a certain role.
The thermal-dynamic effects of topography along the coast and the major mountains in SC (Nanling Mountains) enhance the heavy rainfall in SC. The coastal topography helps to intensify the rainfall band along the coast via the strengthening of the land breeze [59], while the inland mountains (i.e., Nanling Mountains) are favorable for the formation of convective rainfall. This conclusion is clearly proven by Exp NT, whose results demonstrate decreased rainfall over both coastal and inland regions. In addition, the effects of topography seem to amplify the diurnal variation of convective rainfall in SC, because the mean vertical upward motion and diurnally anomalous vertical circulation are both weakened after the topography in SC is removed.
It is surprising that the rainfall along the coastal region in Exp ND still presents the feature of diurnal variation. Although the land-sea contrast still exists, the diurnal variation seems not to be well explained without diurnal oscillation of solar radiation heating. In fact, since the solar zenith angle is set to a constant at 2000 BLT in Exp ND, the long-wave radiation cooling is a dominant factor that leads to the development of a relatively cold boundary layer over the land and, thus, the formation and/or intensification of the land breeze. This is somewhat similar to the situation in Exp CTL. The convective rainfall band is, therefore, still formed along the coastal area in the early-morning hours. Some studies argued that the diurnal forcing may be contained in the lateral boundary condition, which is possibly responsible for the diurnal change of the rain band [9]. In order to clarify the role of the lateral boundary condition in this case, an additional sensitivity experiment with a fixed lateral boundary condition based on Exp ND is conducted. The simulation shows that the coastal convective rain band is still initiated and organized in the early-morning hours and weakened in the late-afternoon to night hours (figure omitted). Presumably, the diminishing or even disappearing of the convective rainfall band during the late-afternoon-to-night hours may be related to the lifecycle of the mesoscale convective system itself. This needs further investigations in the future.

6. Conclusions

In this study, a 10-day heavy rainfall event caused by tropical depression “Fitow” in SC is chosen to investigate the mechanism of the diurnal variation of TD-related rainfall. A control simulation with explicit cloud microphysics using the WRF-ARW model reproduces the diurnal variation of “Fitow”-related rainfall well. Sensitivity experiments are conducted to investigate the impacts of the diurnal variation of solar radiation forcing, topography and land-sea contrast on the formation of the TD-related rainfall’s diurnal pattern. It should be noted that the sensitivity experiment results are only for a case study. Further research for other case studies must be done to generalize the results. The main results are summarized as follows.
The diurnal variation of TD-related rainfall is distinct and unique. The rainfall is usually initiated and organized into a band along the southeastern coast of SC in the early morning hours before it develops and intensifies quickly in the morning. It moves to the inland area of SC in the afternoon and diminishes or disappears at night. The rainfall intensity reaches its peak in the morning hours, but the rainfall frequency reaches its maximum in the late-afternoon hours. The rainfall along the coastal region in the morning hours is often stronger than in other hours. Besides, the lifetime of rainfall along the coast is much longer than that in the inland area, which is demonstrated by the fact that the heavy rainfall band is mainly located along the coast.
The anomalous northerly wind prevails in the morning hours, with a rainfall band developing along the coast, and it is reversed to southerly in the afternoon hours, with the rainfall band moving to the inland area. Hence, the diurnal rainfall evolution is somewhat relevant to the development of low-level anomalous horizontal wind, which may be a kind of land-sea breeze driven by the land-sea thermal contrast. Meanwhile, anomalous height-latitudinal circulation in the morning hours is totally opposite to that in the afternoon to late-evening hours, and the branch of upward motion swings back and forth with the rainfall band between the coastal region and the inland area.
The development of rainfall along the coast in the early-morning to morning hours may be caused by the land-sea contrast, which can induce the anomalous northerly low-level wind blowing from the inland to the coastal area. However, the development of noon-to-afternoon rainfall and the occurrence of the rainfall frequency maximum in the inland area of SC are mainly the results of the thermodynamic effects of topography. Additionally, the disappearing or inland-ward moving of the rainfall band along the coast in the noon-to-afternoon hours may largely be attributed to the development of anomalous southerly wind at the low level. The coastal mountain range and inland complex topography play crucial roles in the enhancement of diurnal rainfall. However, the Nanling Mountains in the north of SC seem not to have a strong enough thermodynamic effect to induce a longitudinal MPS to modulate the diurnal rainfall pattern, which is dominated by the combined effects of diurnal solar radiation forcing and the land-sea thermal contrast. That is, the land-sea thermal contrast determines the formation and development of the heavy rainfall band along the southeastern coast, which is further enhanced by the coastal mountain range.

Acknowledgments

This study was jointly sponsored by the National Natural Science Foundation of the People’s Republic of China under grant Nos. 41075038 and 40975025, project of the Ministry of Science and Technology of the People’s Republic of China under grant Nos. GYHY201206003, GYHY201106003 and GYHY201306016. The authors wish to thank the two reviewers for providing comments that added to the clarity of this paper.

Conflicts of Interest

The author declares no conflict of interest.

References

  1. Ding, Y.; Chan, J. The East Asian summer monsoon: An overview. Meteorol. Atmos. Phys. 2005, 89, 117–142. [Google Scholar] [CrossRef]
  2. Tao, S. Rainstorms in China; (in Chinese). Science Press: Beijing, China, 1980; pp. 255–256. [Google Scholar]
  3. Ding, Y. Summer monsoon rainfalls in China. J. Meteorol. Soc. Jpn. 1992, 70, 373–396. [Google Scholar]
  4. Zheng, Y.; Chen, J.; Zhu, P. Climatological distribution and diurnal variation of mesoscale convective systems over China and its vicinity during summer. Chin. Sci. Bull. 2008, 53, 1574–1586. [Google Scholar] [CrossRef]
  5. Yu, R.; Zhou, T.; Xiong, A. Diurnal variations of summer precipitation over contiguous China. Geophys. Res. Lett. 2007, 34, L01704. [Google Scholar]
  6. Li, J.; Yu, R.; Zhou, T. Seasonal variations of the diurnal cycle of rainfall in the southern contiguous China. J. Clim. 2008, 21, 6036–6043. [Google Scholar] [CrossRef]
  7. He, H.Z.; Zhang, F. Diurnal variations of warm-season precipitation over Northern China. Mon. Wea. Rev. 2010, 138, 1017–1025. [Google Scholar] [CrossRef]
  8. Bao, X.; Zhang, F.; Sun, J. Diurnal variations of warm-season precipitation east of the Tibetan Plateau over China. Mon. Wea. Rev. 2011, 139, 2790–2810. [Google Scholar] [CrossRef]
  9. Sun, J.; Zhang, F. Impacts of mountain-plains solenoid on diurnal variation of rainfalls along the Mei-Yu front over the east China plains. Mon. Wea. Rev. 2012, 140, 379–397. [Google Scholar] [CrossRef]
  10. Johnson, R. Diurnal Cycle of Monsoon Convection. In The Global Monsoon System, Research and Forecast, 2nd ed.; Chang, C.-P., Ed.; World Scientific Publication: Singapore, 2010; pp. 257–276. [Google Scholar]
  11. Chen, G.; Sha, W.; Sawada, M.; Iwasaki, T. Influence of summer monsoon diurnal cycle on moisture transport and precipitation over eastern China. J. Geophy. Res. 2013, 118, 3163–3177. [Google Scholar] [CrossRef]
  12. Wang, C.; Chen, G.; Carbone, R. Variability of warm season cloud episodes over East Asia based on GMS infrared brightness temperature observations. Mon. Wea. Rev. 2005, 133, 1478–1500. [Google Scholar] [CrossRef]
  13. Zhou, T.; Yu, R.; Chen, H. Summer precipitation frequency, intensity, and diurnal cycle over China: A comparison of satellite data with rain gauge observations. J. Clim. 2008, 21, 3997–4010. [Google Scholar] [CrossRef]
  14. Huang, H.; Wang, C.; Chen, G.; Carbone, R. The role of diurnal solenoidal circulation on propagating rainfall episodes near the eastern Tibetan Plateau. Mon. Wea. Rev. 2010, 138, 2975–2989. [Google Scholar]
  15. Chen, H.; Yu, R.; Li, J. Why nocturnal long-duration rainfall presents an eastward-delayed diurnal phase of rainfall down the Yangtze River valley. J. Clim. 2010, 23, 905–917. [Google Scholar] [CrossRef]
  16. Yang, G.; Slingo, J. The diurnal cycle in the tropics. Mon. Wea. Rev. 2001, 129, 784–801. [Google Scholar] [CrossRef]
  17. Ho, C.; Park, M.; Choi, Y.; Takayabu, Y. Relationship between intraseasonal oscillation and diurnal variation of summer rainfall over the South China Sea. Geophys. Res. Lett. 2008. [Google Scholar] [CrossRef]
  18. Chen, G.; Sha, W.; Iwasaki, T. Diurnal variation of precipitation over southeastern China: Spatial distribution and its seasonality. J. Geophys. Res. 2009, 114, D13103. [Google Scholar] [CrossRef]
  19. Xu, W.; Zisper, E. Diurnal variations of precipitation, deep convection, and lighting over and east of the eastern Tibetan Plateau. J. Clim. 2011, 24, 448–465. [Google Scholar] [CrossRef]
  20. Yuan, W.; Yu, R.; Zhang, M.; Lin, W.; Chen, H.; Li, J. Regimes of diurnal variation of summer rainfall over subtropical East China. J. Clim. 2012, 25, 3307–3320. [Google Scholar] [CrossRef]
  21. Sato, T.; Kimura, F. Diurnal cycle of convective instability around the central mountains in Japan during the warm season. J. Atmos. Sci. 2005, 62, 1626–1636. [Google Scholar] [CrossRef]
  22. Oki, T.; Musiake, K. Seasonal change of the diurnal cycle of precipitation over Japan and Malaysia. J. Appl. Meteorol. 1994, 33, 1445–1463. [Google Scholar] [CrossRef]
  23. Wu, P.; Hamada, J.; Mori, S. Diurnal variation of precipitable water over a mountainous area of Sumatra Island. J. Appl. Meteorol. 2003, 42, 1107–1115. [Google Scholar] [CrossRef]
  24. Qian, J. Why precipitation is mostly concentrated over islands in the maritime continent. J. Atmos. Sci. 2008, 65, 1428–1441. [Google Scholar] [CrossRef]
  25. Wu, P.; Hara, M.; Hamada, J.; Yamanaka, M. Why a large amount of rain falls over the sea in the vicinity of western Sumatra Island during nighttime. J. Appl. Meteorol. Climatol. 2009, 48, 1345–1361. [Google Scholar] [CrossRef]
  26. Mapes, B.; Warner, T.; Xu, M. Diurnal patterns of rainfall in northwestern South America. Part III: Diurnal gravity waves and nocturnal convection offshore. Mon. Wea. Rev. 2003, 131, 830–844. [Google Scholar] [CrossRef]
  27. Lee, M.; Schubert, S.; Suarez, M. Role of convection triggers in the simulation of the diurnal cycle of precipitation over the United States Great Plains in a general circulation model. J. Geophys. Res. 2008. [Google Scholar] [CrossRef]
  28. Giovannettone, J.; Barros, A. Probing regional orgraphic controls of precipitation and cloudiness in the central Andes using satellite data. J. Hydrometeorol. 2009, 10, 167–183. [Google Scholar] [CrossRef]
  29. Nicolini, M.; Skabar, G. Diurnal cycle in convergence patterns in the boundary layer east of the Andes and convection. Atmos. Res. 2011, 100, 377–390. [Google Scholar] [CrossRef]
  30. Rickenbach, T.; Ferreira, R.; Guy, N.; Williams, E. Radar-observed squall line propagation and the diurnal cycle of convection in Niamey, Niger, during the 2006 African Monsoon and multidisciplinary analyses intensive observing period. J. Geophys. Res. 2009. [CrossRef]
  31. Dai, A. Global precipitation and thunderstorm frequencies. Part II: Diurnal variations. J. Clim. 2001, 14, 1112–1128. [Google Scholar] [CrossRef]
  32. Ping, F.; Luo, Z. Microphysical and radiative effects of ice clouds on diurnal variations of tropical convective and stratiform rainfall. Atmos. Res. 2009, 93, 862–873. [Google Scholar] [CrossRef]
  33. Randall, D.; Harshvardhan, D.; Corsetti, T. Diurnal variability of the hydrologic cycle in a general circulation model. J. Atmos. Sci. 1991, 48, 40–62. [Google Scholar] [CrossRef]
  34. Liu, C.; Moncrieff, M. A numerical study of the diurnal cycle of tropical oceanic convection. J. Atmos. Sci. 1998, 55, 2329–2344. [Google Scholar] [CrossRef]
  35. Gray, W.; Jacobson, R. Diurnal variation of deep cumulus convection. Mon. Wea. Rev. 1977, 105, 1171–1188. [Google Scholar] [CrossRef]
  36. Tao, W.; Lang, S.; Simpson, J.; Sui, C.; Ferrier, B.; Chou, M. Mechanisms of cloud–radiation interaction in the Tropics and midlatitudes. J. Atmos. Sci. 1996, 53, 2624–2651. [Google Scholar] [CrossRef]
  37. Sui, C.; Lau, K.; Takayabu, Y. Diurnal variation in tropical oceanic cumulus convection during TOGA COARE. J Atmos. Sci. 1997, 54, 639–655. [Google Scholar] [CrossRef]
  38. Goddard Earth Sciences Data and Information Services Center. Available online: http://mirador.gsfc.nasa.gov (accessed on 1 June 2013).
  39. Yang, K.; Koike, T.; Stackhouse, P.; Mikovitz, C.; Cox, S. An assessment of satellite surface radiation products for highlands with Tibet instrumental data. Geophys. Res. Lett. 2006, 33, L22403. [Google Scholar] [CrossRef]
  40. Kummerow, C.; Ringerud, S.; Crook, J.; Randel, D.; Berg, W. An observationally generated a priori database for microwave rainfall retrievals. J. Atmos. Ocean. Technol. 2011, 28, 113–130. [Google Scholar] [CrossRef]
  41. Huffman, G.; Bolvin, D.; Nelkin, E.; Wolff, D.; Adler, R.; Gu, G.; Hong, Y.; Bowman, K.P.; Stocker, E. The TRMM multisatellite precipitation analysis: Quasi-global, multiyear, combined-sensor precipitation estimates at fine scale. J. Hydrometeorol. 2007, 8, 38–55. [Google Scholar] [CrossRef]
  42. Computer Information Service Laboratory Research Data Archive. Available online: http://rda.ucar.edu/datasets/ds083.2 (accessed on 1 July 2013).
  43. Hong, S.; Pan, H. Nonlocal boundary layer vertical diffusion in a medium-range forecast model. Mon. Wea. Rev. 1996, 124, 2322–2339. [Google Scholar] [CrossRef]
  44. Thompson, G.; Field, P.; Rasmussen, R.; Hall, W. Explicit forecasts of winter precipitation using an improved bulk microphysics scheme. Part II: Implementation of a new snow parameterization. Mon. Wea. Rev. 2008, 136, 5095–5115. [Google Scholar] [CrossRef]
  45. Negri, A.; Bell, T. Sampling of the diurnal cycle of precipitation using TRMM. J Atmos. Ocean. Technol. 2002, 19, 1333–1344. [Google Scholar] [CrossRef]
  46. Douglas, M.; Arturo, V.-M.; Rafael, G. Diurnal variation and horizontal extent of the low-level jet over the Northern Gulf of California. Mon. Wea. Rev. 1998, 126, 2017–2025. [Google Scholar] [CrossRef]
  47. Neumann, J.; Mahrer, Y. A theoretical study of the land and sea breeze circulation. J. Atmos. Sci. 1971, 28, 532–542. [Google Scholar] [CrossRef]
  48. Rotunno, R. On the linear theory of the land and sea breeze. J. Atmos. Sci. 1983, 40, 1999–2009. [Google Scholar] [CrossRef]
  49. Mahrer, Y.; Pielke, R. The effects of topography on sea and land breezes in a two-dimensional numerical model. Mon. Wea. Rev. 1977, 105, 1151–1162. [Google Scholar] [CrossRef]
  50. Fovell, R. Convective initiation ahead of sea-breeze front. Mon. Wea. Rev. 2005, 133, 264–278. [Google Scholar] [CrossRef]
  51. Zhao, Y.; Li, Z.; Xiao, Z. A diagnostic and numerical study on a rainstorm in South China induced by a northward-propagating tropical system. Acta Meteorol. Sin. 2008, 22, 284–302. [Google Scholar]
  52. Cairns, B. Diurnal variations of cloud from ISCCP data. Atmos. Res. 1995, 37, 133–146. [Google Scholar] [CrossRef]
  53. Crook, N.; Klemp, J. Lifting by convergence lines. J. Atmos. Sci. 2000, 57, 873–890. [Google Scholar] [CrossRef]
  54. Liu, C.; Moncrieff, M. A numerical study of the effects of ambient flow and shear on density currents. Mon. Wea. Rev. 1996, 124, 2282–2303. [Google Scholar] [CrossRef]
  55. Monkam, D. Convective available potential energy (CAPE) in Northern Africa and tropical Atlantic and study of its connections with rainfall in Central and West Africa during Summer 1985. Atmos. Res. 2002, 62, 125–147. [Google Scholar] [CrossRef]
  56. Gladich, I.; Gallai, I.; Giaiotti, D.; Stel, F. On the diurnal cycle of deep moist convection in the southern side of the Alps analysed through cloud-to-ground lightning activity. Atmos. Res. 2011, 100, 371–376. [Google Scholar] [CrossRef]
  57. Zhao, Y. Numerical investigation of a localized extremely heavy rainfall event in complex topographic area during midsummer. Atmos. Res. 2012, 113, 22–39. [Google Scholar] [CrossRef]
  58. Saito, K.; Keenan, T.; Holland, G.; Puri, K. Numerical simulation of the diurnal evolution of tropical island convection over the maritime continent. Mon. Wea. Rev. 2001, 129, 378–400. [Google Scholar] [CrossRef]
  59. Qian, T.; Epifanio, C.; Zhang, F. Topographic effects on the tropical land and sea breeze. J. Atmos. Sci. 2012, 69, 130–149. [Google Scholar] [CrossRef]

