Abstract
This study examines the characteristics of new particle formation at a forest site in southeastern US. Particle size distributions above a Loblolly pine plantation were measured between November 2005 and September 2007 and analyzed by event type and frequency, as well as in relation to meteorological and atmospheric chemical conditions. Nucleation events occurred on 69% of classifiable observation days. Nucleation frequency was highest in spring. The highest daily nucleation (class A and B events) frequency (81%) was observed in April. The average total particle number concentration on nucleation days was 8,684 cm−3 (10 < Dp < 250 nm) and 3,991 cm−3 (10 < Dp < 25 nm) with a mode diameter of 28 nm with corresponding values on non-nucleation days of 2,143 cm−3, 655 cm−3, and 44.5 nm, respectively. The annual average growth rate during nucleation events was 2.7 ± 0.3 nm·h−1. Higher growth rates were observed during summer months with highest rates observed in May (5.0 ± 3.6 nm·h−1). Winter months were associated with lower growth rates, the lowest occurring in February (1.2 ± 2.2 nm·h−1). Consistent with other studies, nucleation events were more likely to occur on days with higher radiative flux and lower relative humidity compared to non-nucleation days. The daily minimum in the condensation sink, which typically occurred 2 to 3 h after sunrise, was a good indicator of the timing of nucleation onset. The intensity of the event, indicated by the total particle number concentration, was well correlated with photo-synthetically active radiation, used here as a surrogate for total global radiation, and relative humidity. Even though the role of biogenic VOC in the initial nuclei formation is not understood from this study, the relationships with chemical precursors and secondary aerosol products associated with nucleation, coupled with diurnal boundary layer dynamics and seasonal meteorological patterns, suggest that H2SO4 and biogenic VOC play a role in nucleated particle growth at this site.
Keywords:
nucleation; particle size distribution; SMPS; DMA; CPC; nucleation frequency; biogenic VOC; condensation sink; PAR; growth rate 1. Introduction
Atmospheric aerosols contribute to acid rain, impair visibility, and alter the earth’s radiation budget. Radiative effects can be direct by scattering incoming solar radiation and absorbing outgoing long-wave radiation, or they can be indirect by acting as cloud condensation nuclei to modify cloud micro-physical properties [1]. However, large uncertainties in the understanding of aerosol formation mechanisms and the estimation of their effects on global climate persist [2]. Aerosols can either be directly emitted (primary) from natural and anthropogenic sources, or formed from gas phase precursors (secondary). Aerosol production mechanisms, number concentrations, and chemical composition are highly dependent on geographical location, air mass origin, source type, meteorology, and atmospheric chemistry.
Nucleation is the process of forming dispersed nuclei from the homogeneous phase under super saturation of vapor. It may produce very high concentrations of particles with diameters < 10 nm [3]. Nucleation involves the formation of initial nuclei and their growth through condensation and/or coagulation. A number of different nucleation mechanisms have been proposed [4,5], including binary water-sulfuric acid nucleation, ternary water-sulfuric acid-ammonia nucleation, ion-induced nucleation [6], and nucleation enhanced by organic acids [7]. Depending on the prevailing chemical and meteorological conditions, newly formed particles may grow to larger sizes by condensation. Primary emission, nucleation, and subsequent growth of pre-existing particles by condensation and coagulation are responsible for maintaining atmospheric aerosol concentrations and size distributions [8].
Spatio-temporally resolved measurements of aerosol size distributions are essential for understanding the chemical and meteorological conditions leading to nucleation. Kulmala et al. [9,10] summarized nucleation studies spanning a broad range of geographical locations and ambient conditions. Nucleation events have been observed both in rural and urban environments [8,11,12,13]. Boy et al. [14], Gerrit et al. [15], and O’Dowd et al. [16] observed that new particle formation in coastal environments was positively correlated with heat flux and negatively correlated with RH or water vapor flux. In a recent study by Place et al. [17], nucleation events were associated with strong solar irradiance and boundary layer growth rate; and were driven either by anthropogenic activities or by a chemical species whose emission rates are similar to that of terpenes. Though the condensation of sulfuric acid (H2SO4) could explain only a small fraction of the aerosol growth rate, sulfur dioxide (SO2) is considered an important nucleation precursor [18]. Relatively few studies have investigated particle nucleation in southeastern US [18,19,20,21], particularly over extended periods of time sufficient to examine seasonal variability. New particle formation was frequently observed in dryer air with low background aerosols [19]. Kulmala et al. [9] observed nucleation events even in polluted environments if the ratio between precursor gases and pre-existing aerosols are higher. The vertical variation of aerosol particle size distributions shows nucleation primarily occurred above the canopy at a rural forested site in southern Indiana [22]. This study also shows a significant association between nucleation mode particles and local meteorological conditions at the Indiana Forest site.
To better understand the frequency and characteristics of particle formation events in southeastern US, particle size distributions were measured above a Loblolly Pine canopy at Duke Forest, near Chapel Hill, NC, USA, between November 2005 and September 2007. This study identifies the nucleation events and investigates the corresponding physical properties (total number concentration, condensation sink, and particle growth rates), chemical properties, and the meteorological conditions favorable for nucleation.
2. Experimental
2.1. Site Description
Particle size distribution, total particle number concentration, chemical, and meteorological measurements were conducted at Duke Forest, Chapel Hill, North Carolina. Duke Forest (35.98°N, 79.09°W), considered a suburban forest site, is surrounded by the cities of Chapel Hill (7 km to the south–southeast), Durham (17 km to the east–northeast), Raleigh (40 km to the southeast), and Burlington (33 km to the west–northwest). Interstate 40 passes approximately 2.4 km northeast of the site. A detailed description of the site is provided by Geron [23]. Measurements were conducted over a Loblolly pine plantation with an approximate tree height of 18 m.
2.2. Measurements
The particle size distribution measurements were conducted using a Scanning Mobility Particle Sizer (SMPS, TSI, Shoreview, MN, USA) consisting of a TSI series 3080 Electrostatic Classifier with a 3081 Differential Mobility Analyzer (DMA), and a 3010 Condensation Particle Counter (CPC). A TSI Model 3025 CPC was used for a brief period early in the study. The instrument was operated at sheath and aerosol air flow rates of 10 and 1 Lpm, respectively, with a 0.0457 cm impactor inlet, establishing an effective particle size range of 7 to 305 nm (Dp). The quantitative analysis of this study included the size range 10 nm–250 nm. Multiple charge and diffusion loss corrections were applied using the TSI AIM software [24]. The scanning routine was configured to yield 30-min average concentrations and size distributions. After accounting for periods of instrument malfunction and maintenance activities, a total of 364 observation days were available for analysis during the period November 2005–September 2007.
Prior to December 2006, particles were sampled from above the canopy (25 m above ground) by drawing air through 3/8" O.D. copper tubing at a flow rate of 30 Lpm into the climate controlled shelter in which the instruments were housed. Tubing was thermally insulated inside the shelter to avoid condensation. The potential for particle loss during transport through the copper tubing was tested by examining transmission of NaCl particles through a 10-m section of tubing oriented in the same configuration as the field system. Test results indicated negligible particle loss at the flow rates and tubing lengths employed in the field for particle sizes on the order of 30–50 nm Dp. Because sufficient concentrations of smaller particles could not be generated during loss tests, potential diffusional loss of 10-nm particles was estimated as described by von der Weiden et al. [25] for turbulent flow. For the 3/8" O.D. tubing as configured in the field, losses of 10 nm particles may have been on the order of 25%–30%. Data were not corrected for this potential artifact. To accommodate additional measurements at the site, the above-canopy sampling system was changed to a 6" O.D. PVC pipe through which air was drawn to the shelter at a flow rate of 500 Lpm. Particle losses for this sampling configuration, also estimated using the approach of von der Weiden et al. [25], are negligible for the range of particle sizes investigated (i.e., 10–250 nm). Particle residence times in the low- and high-flow sampling configurations were ~3 and 40 s, respectively, with corresponding Reynold’s numbers of 5,300 and 5,000.
Duke Forest meteorological data compiled from Brookhaven National Laboratory (BNL) and Free-Air Carbon Enrichment (FACE) datasets include 30-min average above-canopy air temperature (°C, Model HMP45C, Campbell Scientific, Logan, UT, USA), relative humidity (RH, Model HMP45C), wind speed (m·s−1, Model 100075, Climatronics, Bohemia, NY, USA) wind direction (deg, Model 100076, Climatronics, Bohemia, NY, USA), precipitation (mm, Model TE525, Campbell Scientific, Logan, UT, USA), and Photosynthetically Active Radiation (PAR, millimol m−2·s−1, Model LI-190SA, LI-COR Environmental, Lincoln, NE, USA). Trace gas concentrations measured from July 2006 to September 2007 include nitric oxide (NO), nitrogen oxides (NOx = NO + NO2) (TEI Model 42S, Thermo Environmental Instruments, Inc., Franklin, MA, USA), ozone (O3) (TEI Model 49C), and SO2 (TEI Model 43C). Instruments were housed in a climate-controlled enclosure and sampled from above the pine canopy through a 1" O.D. Teflon tubing at a flow rate of 30 L·min−1. Data were recorded as 30-min averages. Mass concentrations (µg/m3) of optically corrected Organic Carbon (OC) and Elemental Carbon (EC) [23] measured at the site from November 2005 to September 2007 were also included in our analysis.
2.3. Detection and Classification of Nucleation Events
The observation days are categorized into nucleation event classes based on 2D size distribution plots. For this study, we adopted the nucleation event classification scheme by Dal Maso et al. [26], Boy et al. [27], and Pryor et al. [22,28]. The particle number concentration for each size bins (Ni) and for each observation days were plotted as a function of particle diameter and time. The periods of increasing Ni were assessed to identify potential nucleation event classes A, B, C, or to categorize the day as non-nucleation (non-event) day. The event classes that are interrupted or that do not fit into the aforementioned categories are identified as unclassified events and are excluded from further analysis. The typical size distribution behavior for each of these event classes are shown in Figure 1.
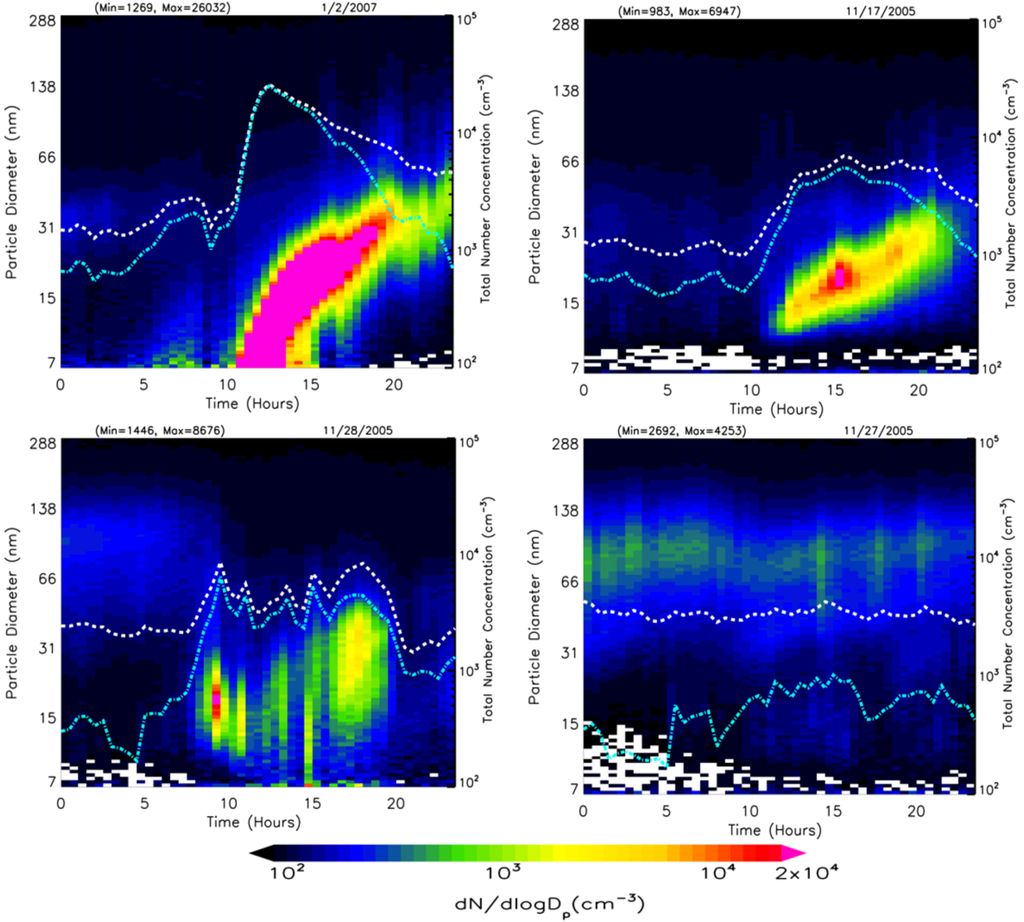
Figure 1.
Examples of aerosol size distributions for A (top left), B (top right), C (bottom left), and non-nucleation (bottom right) event classes are shown along with total particle number concentration (white) and nucleation mode particle number concentration (cyan).
Class A: Increased concentrations of nucleation mode (NM) particles (Dp ≤ 25 nm) are found and these particles exhibit well-defined and uninterrupted growth to about 100 nm or greater.
Class B: Increased NM particle concentrations are observed and followed by particle growth to about 100 nm; however, the highest concentrations of new particles are found not at the lowest size bins of NM, but at diameters greater than 10 nm. Such a growth pattern indicates the occurrence of nucleation upwind of the site followed by transport of NM particles larger than 10 nm and subsequent local growth due to condensation of vapors to less volatile forms. On some days, these events exhibited fluctuations in growth rate.
Class C: Increased NM particles at lower size bins with consequent particle growth that does not exceed generally 40 nm. This event class was observed frequently with a discontinuous growth rate and is not included in the quantitative analysis of particle growth rate and Condensation Sink.
Non-Nucleation: Observation days with particle size distributions devoid of increased NM concentration and their subsequent growth to larger particles.
Unclassified: Days that do not fit into the described event classes or that had an interrupted size distribution data due to inclement weather or instrument outage or for which the growth rates are extremely fluctuating.
2.4. Condensation Sink (CS) and Growth Rate
The condensation sink (CS) quantifies the loss rate of molecules in the entire size spectrum due to condensation of condensable vapors on pre-existing aerosols [29,30]. It is calculated as the integration of condensational loss of condensable vapors onto existing aerosols and is dependent on the molecular properties such as vapor phase diffusion and mean free path. The CS (cm−2) is calculated as follows:
 where β is the transitional correction factor [31,32], Dp is the mid-point diameter, and n(Dp) is the number distribution of particles corresponding to different size classes with mid-point diameter (Dp) between the size range 10 nm and 250 nm. The accommodation coefficient of unity was used to calculate β.

Since we use 10 nm to 250 nm diameter range for quantitative analysis, the calculated value is an underestimation of the actual CS, though the contribution of particles with sizes outside the measured range is expected to be relatively small.
Growth rate indicates size changes of nucleated particles over time. A log-normal fit is applied to the data to identify the peaks in each size distribution. GR in nm·h−1 was calculated from the difference between midpoint diameters corresponding to the peaks in particle number concentration for each instant of time (∆DPeak) by dividing it with the corresponding difference in time (∆t).

Particle growth rate is a function of the condensable vapor concentration and the CS. GR increases significantly when the condensable vapor concentration is large and the CS is low [9].
3. Results and Discussions
3.1. Summary Statistics
Nucleation events were observed on approximately 69% (273 days) of days for days with complete measurements. The observed nucleation frequency at Duke Forest was significantly higher compared to that observed at forested areas elsewhere. From the total valid observations, 46% of the days at a mixed deciduous forest in southern Indiana [22], 35% of the days at a deciduous forest in central Virginia [19], 45% of the days [26] at a boreal forest in Hyytyala in Finland, and 53% of the days [11] at a forested site near Pittsburg, PA exhibited new particle formation characteristics. Month-to-month comparisons of event statistics are difficult as the total number of valid observation days in each month (labeled in Figure 2) varied greatly, ranging from four days for May and September 2007 to 31 days for July 2006. No days in October had nucleation. However, the event classes show clear seasonal signatures.
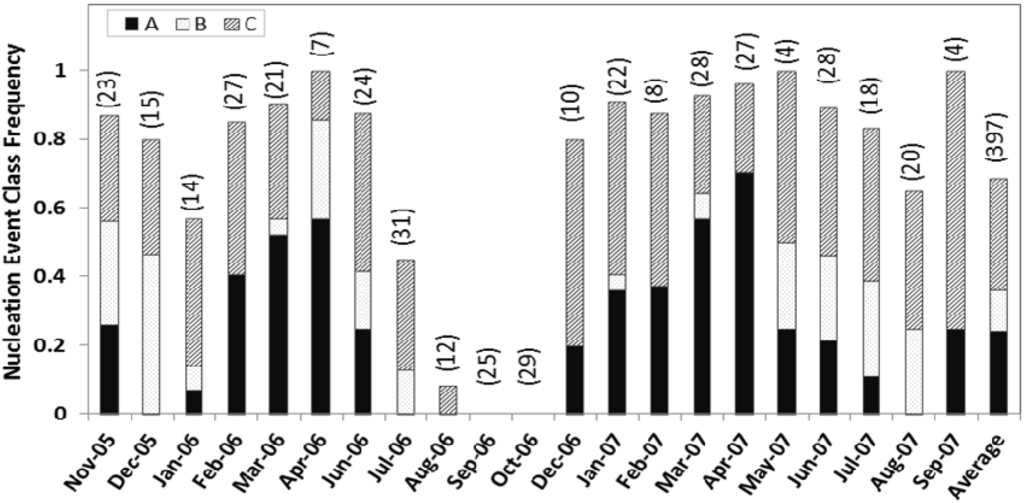
Figure 2.
The frequency of nucleation event classes A, B, and C identified in each month is shown normalized with the total number of classifiable observation days for that particular month from November 2005 to September 2007. The total number of observation days for each month is labeled in the graph.
The frequency of class A events is highest during spring (April–May) and lowest during mid-summer to mid-fall. This pattern is consistent with the observations of Pryor et al. [22] in Indiana. No class A events were observed in August. No, or a significantly lower number of, class B events were observed from mid-winter to mid-spring. Class C events were frequently observed from late fall through the early winter months. At Duke Forest, we observed the highest nucleation frequency for event class C (33%). Classes A and B event days total 144 (36%), of which 121 events are selected for further detailed analysis based on the growth pattern and growth rate. For quantitative analysis, classes A and B together account for about 36% of the valid observation days of which the contribution from class A events were about 26%. This is similar to the observations at Morgan-Monroe State Forest in southern Indiana [22], where A and B events together accounted for about 32% of total classifiable observation days.
In May and August, the nucleation events were more frequent in the early mornings, whereas in winter months (e.g., December), the onset of nucleation was observed even in the afternoon, with later nucleation events being in December. The earliest nucleation onset was observed during August (~6:00 am) and, on average, in summer months, the onset of nucleation occurred in the early morning (~7:30 am); however, during winter months, the onset of nucleation occurred later in the day with the latest being observed at ~2:00 pm. The averaged total fine particle number concentration (Figure 3) varied greatly between seasons.
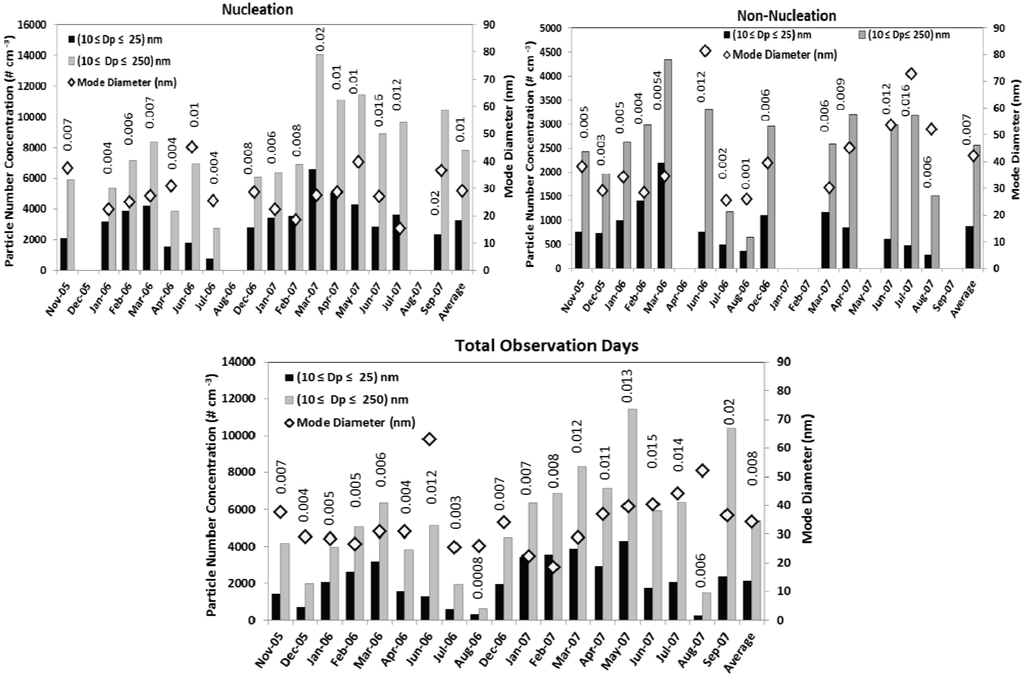
Figure 3.
The monthly mean total number concentration of nucleation mode and fine mode particles are plotted along with the mode diameter for nucleation and non-nucleation events. The monthly mean condensation sink (cm−2) is also labeled on the top of each bar. The lower panel is the monthly means for all the observation days.
The monthly averaged mode diameter shows a distinct seasonal pattern. The average mode diameter on nucleation days (29 nm) was significantly lower than that on non-nucleation days (42 nm). In general, we observed larger mode diameters in summer months. This may be due to increased availability of condensable vapors in the atmosphere which favor particle growth by condensation and coagulation. Monthly means of particle number concentration, mode diameters etc. are shown in lower panel of Figure 3. Figure 4(a) provides the grand average of the hourly mean total number concentration of particles with diameters 10 nm ≤ Dp ≤ 25 nm, and 10 nm ≤ Dp ≤ 250 nm. Figure 4(b) shows the corresponding diurnal profile of condensation sink (cm−2) and growth rate averaged for all the observed nucleation days. The particle number concentration peak is observed at approximately 1:30 pm. The grand average total particle number concentration on nucleation event days was 8,684 cm−3 (10 nm ≤ Dp ≤ 250 nm) and 3,991 cm−3 for the size range 10 nm ≤ Dp≤ 25 nm with a 45% contribution from NM particles. The geometric mean diameter and mode diameter were 35 nm and 28 nm, respectively. On non-nucleation days, the contribution from NM particles was 30% of the total number concentration and the values were 2,143 cm−3 (10 nm ≤ Dp ≤ 250 nm) and 655 cm−3 (10 nm ≤ Dp ≤ 25 nm). Both the geometric mean (49.6 nm) and mode (44.5 nm) diameters showed an increase of about 15 nm on non-nucleation days compared to nucleation days.
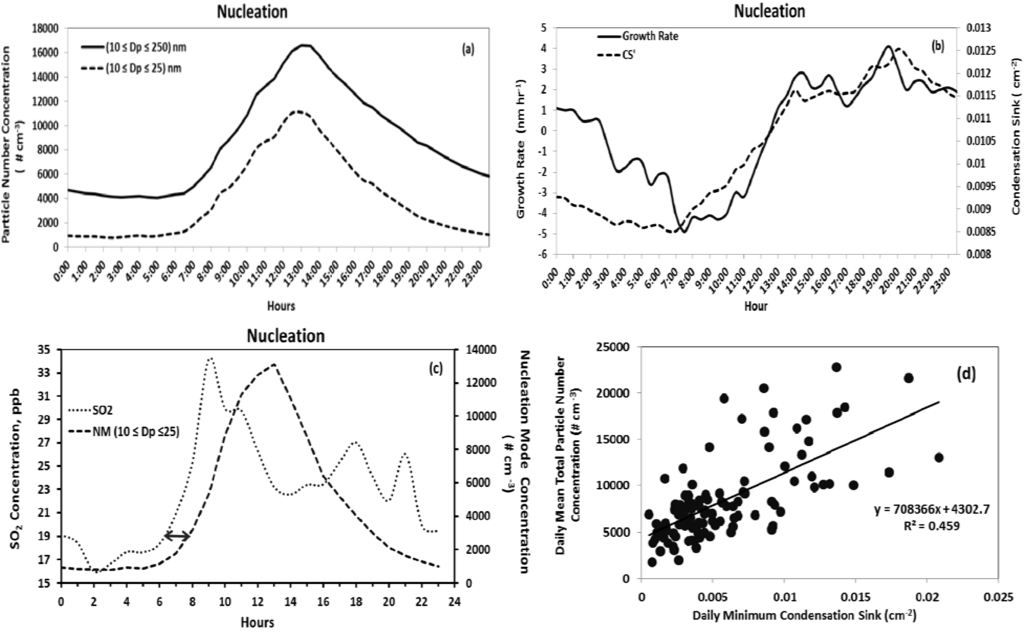
Figure 4.
Diurnal profiles of nucleation day (a) nucleation mode and fine mode particle number concentration, (b) particle growth rates and condensation sink, (c) NM particle number concentration and concentration of SO2, and (d) the relationship between condensation sink and total particle number concentration during nucleation. Diurnal profile data points represent hourly averages for all nucleation days.
Condensation sink quantifies the strength of condensation processes occurring during the nucleation event and is a function of the particle size distribution. The hourly averaged condensation sink typically reaches a minimum at around 7:00 am and shows a continuous increase as the total particle concentration evolves. This is due to the contribution of newly formed particles to the condensation sink. It is evident from Figure 4(a,b) that the daily minimum of CS is a good indicator of the time of onset of the new particle formation. This observation is consistent with the findings during BIOFOR campaign [29]. No such behavior for the condensation sink was observed for non-nucleation days. Furthermore, while the daily minimum CS was a good indicator of the timing of nucleation onset, the strength of the event, indicated by the total particle concentration, was positively correlated with daily minimum CS (Figure 4(d)). On the other hand, daily averaged CS values were not good predictors for nucleation events. In fact, during our analysis, the nucleation days were associated with higher condensation sink (0.009 cm−2) compared to non-nucleation days (0.0064 cm−2). This demonstrates a strong contribution of new particle formation events to the aerosol CS.
Evolution of the particle size distribution (dN/dlogDp) during a typical nucleation event day on 4 March 2006 is shown in Figure 5(a). The total number concentrations of nucleation mode (cyan) and fine (white) particles are shown on a log scale on the secondary vertical axis. There is no evidence of plume impact from local sources on the selected nucleation day. Nucleation started at ~10:00 am and continued until 15:30 pm. The evolution of the total number concentration and particle size distribution with time during the nucleation event is shown respectively in Figure 5(b,c). In the first phase, the particle number concentration, as well as particle peak diameter, increases, thereby indicating nucleation and subsequent growth. After ~15:30 pm, the particle number concentration begins to decrease while peak diameter increases, thus indicating the growth of newly formed particles mainly through condensation. The average growth rate (Table 1) during this nucleation event was calculated to be 2.7 ± 0.9 nm/h based on the peak diameter for each time interval.
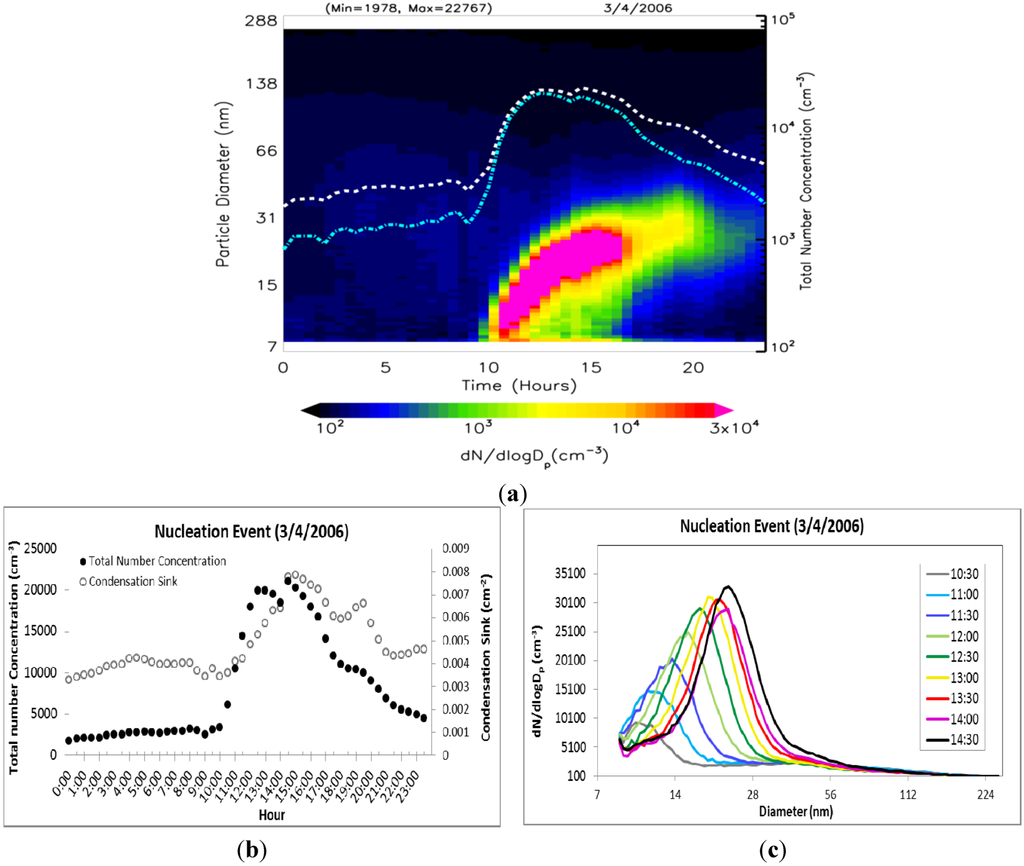
Figure 5.
(a) Evolution of particle size distribution on a day with nucleation (4 March 2006) with dotted lines representing total particle number concentration (white) and nucleation mode particle number concentration (cyan), (b) corresponding hourly distribution of total number concentration and condensation sink, and (c) evolution of the corresponding size distribution dN/dlogDp (cm−3) as a function of diameter midpoint of each size channel.

Table 1.
Total number concentrations of fine mode (N) and nucleation mode (N25) particles, peak diameter (Dpeak), condensation sink (CS), and particle growth rate (GR) during the 4 March 2006 nucleation event.
| Time | N (cm−3) | N25 (cm−3) | CS | Dpeak | GR |
|---|---|---|---|---|---|
| (10nm ≤ Dp ≤ 250 nm) | (10 ≤ Dp ≤ 25 nm) | (cm−2) | (nm) | (nm·h−1) | |
| 9:00 am | 2,530 | 1,559 | 0.0034 | 8.82 | - |
| 11:00 am | 10,522 | 9,462 | 0.0041 | 9.14 | 1.60 |
| 13:00 pm | 19,964 | 19,128 | 0.0058 | 15.70 | 3.28 |
| 15:00 pm | 20,307 | 18,975 | 0.0078 | 18.80 | 3.10 |
The hourly average growth rate (GR) (Figure 4(b)) illustrates diurnal patterns in the rate of change of nucleation mode particle size and is dependent on the condensable vapor concentration and the number concentration of pre-existing particles that act as CS. Growth rate begins to increase with the onset of nucleation and generally reaches its peak 4 to 5 h later due to increasing photochemistry. However, there is about an hour delay (Figure 4(a,b)) between the nucleation onset and increase in GR. The similar time lag (Figure 4(c)) observed between NM particle concentration and concentration of SO2 indicates condensational growth. This temporal lag may be due to the two stages in nucleation—the formation of new particles, and their growth through condensation to detectable larger sizes. Sihto et al. [33] observed a 1.4-h time lag between the number concentration of 3–6 nm particles and sulfuric acid concentration. Not all nucleation events lead to new particle formation. If the nucleated species can survive against condensation and coagulation loss to pre-existing particles, and if condensable vapors are available for condensation onto nucleated species, new particle formation may occur [34].
The typical growth rates observed at continental sites are between 1 and 20 nm/h [9]. The grand average growth rate during nucleation events was 2.7 ± 0.3 nm/h. The observed average growth rates are consistent with the range of the growth rates reported by Pryor et al. [22] (2.5 nm/h), and Place et al. [17] (2.7 nm/h).The particle growth rate at the Duke Forest site exhibits seasonal variability. The monthly average growth rate (Figure 6) was at its maximum during late spring and the early summer months, with the highest growth rate being in May (5.0 ± 3.6 nm/h) followed by June (4.1 ± 3.9 nm/h), and the minimum growth rate occurring during the winter months, with the lowest being in February (1.2 ± 2.2 nm/h). This observed seasonality is consistent with Qian et al. [35] (6.7 ± 4.8 nm/h for summer and 1.8 ± 1.9 nm/h for winter). Higher growth rates in summer months may be due to the higher oxidizing capacity of the atmosphere and subsequent oxidation rates of precursors, such as SO2, and other compounds, such as biogenic volatile organic compounds (VOC), that exhibit temperature or physiologically dependent (e.g., bud break or needle expansion) emission rates.
The particle growth rate depends on the availability of condensable vapor concentration and the new particle formation is observed when freshly nucleated particles can grow fast enough to be detected without being scavenged onto pre-existing aerosols. The condensable vapor species are produced from their precursor gases through oxidation by ozone, and hydroxyl (OH), and/or nitrate (NO3) radicals [9]. The concentration of these condensable vapor species depends on the concentration ratio between precursor gases and pre-existing aerosols [9].
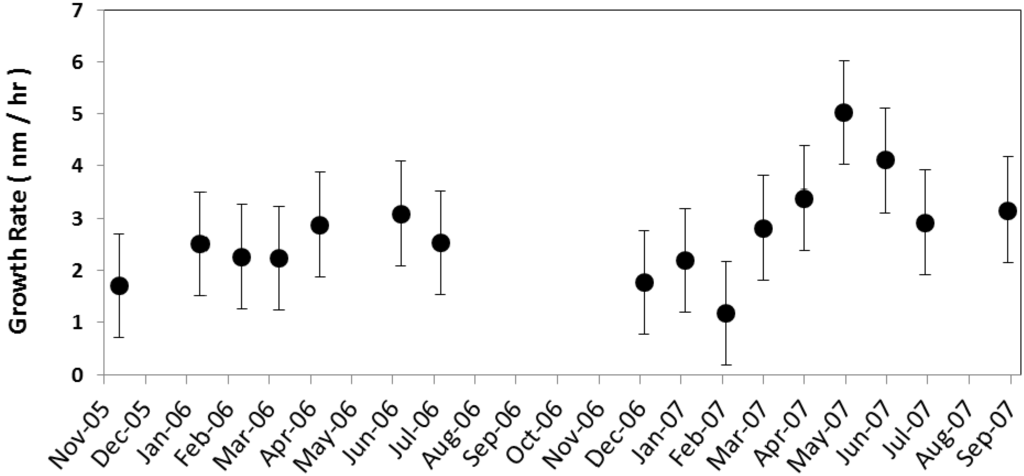
Figure 6.
Monthly mean particle growth rate (nm/h) averaged for all nucleation events for the corresponding month along with the standard error is shown.
3.2. Relation to Meteorology
Previous studies have shown that nucleation is more likely to occur on days with low or no cloud cover [17,36] and lower humidity [33,37], relative to days on which nucleation is not observed. The link to solar radiation may reflect a dependence of nucleation on OH concentration, which drives the production of low vapor pressure gas phase [38] and ionic [6] precursors required for nucleation. The onset of nucleation is often observed in the mid to late morning, coincident with the break-up of the nocturnal boundary layer and downward mixing of nucleation precursors from aloft [11,22], which is more vigorous on days with high radiative flux (i.e., cloudless days). The relationship between relative humidity and nucleation may reflect the role of water vapor in the characteristics of biogenic VOC oxidation and subsequent production of low vapor pressure nucleation precursors [39,40] or simply a pattern of lower relative humidity on cloudless days [22]. Hamed et al. [41] recently showed that the inverse relationship between nucleation and relative humidity is primarily due to less intense solar radiation at high relative humidity, which limits the photochemical production of H2SO4 and organic nucleation precursors.
At Duke Forest, overall lower average relative humidity (43%) was observed on nucleation event days compared to (66%) non-event days, a pattern that was also observed in monthly averages (Figure 7). Consistent with other studies, nucleation events were more likely to occur on days with lower relative humidity. The role of humidity with respect to the intensity of nucleation, which may be quantified as the total particle number concentration during nucleation events, is also of interest. Total particle number concentration was found to be inversely correlated with relative humidity for all the temporally coincident data points, for the daily mean values, and for the daytime daily mean values (Figure 8(a)), while no correlation was observed on non-event days. At high relative humidity, growth of pre-existing particles by condensation may further increase the CS and thus tends to prevent new particle formation.
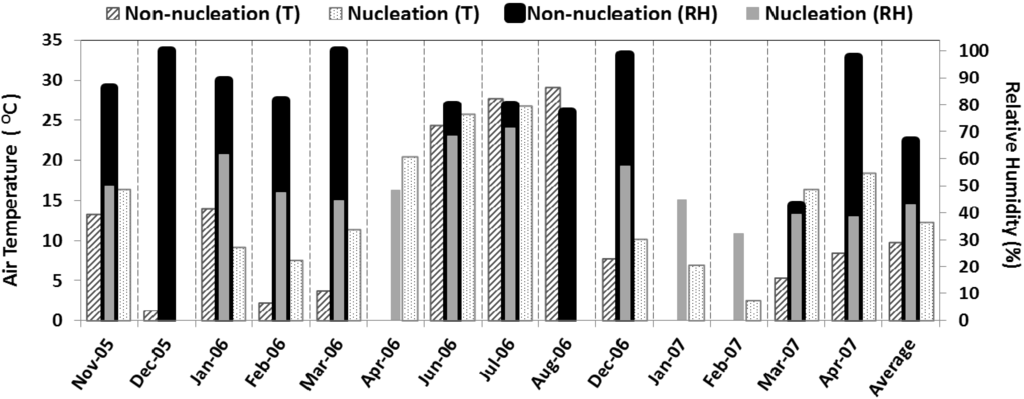
Figure 7.
The grand average monthly mean daytime temperature and relative humidity for nucleation days and non-nucleation days.
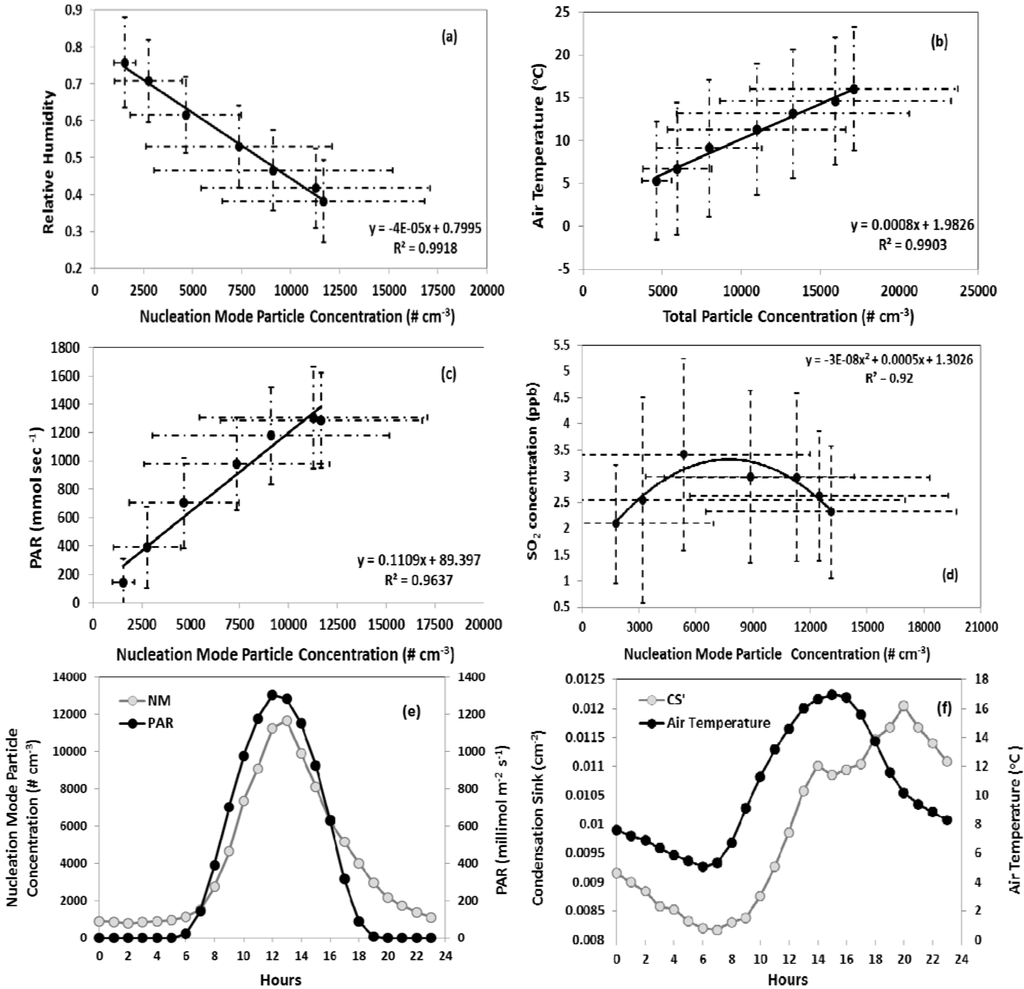
Figure 8.
Correlation of nucleation mode particles with (a) relative humidity, (b) air temperature, (c) PAR, (d) SO2. Data points represent averages between 7:00 am and 1:00 pm (approximately 1 hour prior to nucleation onset until the peak in number concentration), (e) diurnal profiles of PAR, nucleation mode particle number concentration, and (f) air temperature and condensation sink. Data represent hourly averages of all nucleation events. The error bars are standard deviation of that particular hour data during all nucleation events.
Total particle number concentration was positively correlated with air temperature on nucleation days (Figure 8(b)). This pattern is expected, given the inverse relationship between relative humidity and temperature and therefore does not necessarily indicate a mechanistic linkage. However, emissions of biogenic VOC, which may play a role in nucleation, are also positively correlated with temperature. This potential linkage is discussed in more detail in the following section. Particle number concentration is positively correlated with PAR (Figure 8(c)). As mentioned above, the correlation between nucleation intensity and radiative flux may indicate the importance of OH concentration in the formation of nucleation precursors or may simply be indicative of days characterized by more intense downward mixing during the morning boundary layer transition and lower relative humidity.
The nucleation day condensation sink typically reached its daily minimum at or before the onset of nucleation followed by an increase over the course of the event. In Figure 8(e,f), the diurnal profile of PAR is plotted along with nucleation mode particle concentration and shows the time lagged relation between the diurnal temperature profile and condensation sink. The daily minimum in condensation sink and air temperature occur within 30 min of each other. However, there exists a time lag of more than a couple of hours between the continuous increase of these two parameters. This lag may be due to the time required for sufficient production of OH and subsequent nucleation of precursors such as H2SO4 after sunrise or downward mixing of existing precursors from above the nocturnal boundary layer. Condensation sink was positively correlated with PAR (R2 = 0.14) and temperature (R2 = 0.13), though the strength of the correlations was weak. No significant relationship between condensation sink and relative humidity was observed. Non-nucleation days are associated with an average precipitation of 0.197 mm, whereas the average precipitation on nucleation days was 0.0016 mm. When precipitation occurred on nucleation days, it was typically after the onset of nucleation and lasted only for a short period. Nucleation and non-nucleation days show no significant difference in wind speed and direction.
3.3. Relation to Chemistry
The relationships between nucleation events and concentrations of trace gases and PM were examined in an effort to characterize the chemical conditions that favor particle nucleation and growth. Figure 9 shows the diurnal variation of total nucleation mode and fine particle number concentration versus O3, SO2, NOx, and NO both for nucleation and non-nucleation days. The bi-modal profile of NOx is indicative of mobile emissions during morning and evening rush hour. Meteorological differences between nucleation days (lower temperature, higher RH, etc.) and non-nucleation days may be responsible for the differences in the diurnal structure of NOx on these days. NO peaks during the morning rush hour while O3 concentrations are still insufficient for significant NO2 formation. A coincident bimodal pattern in particle number concentration, indicative of ultrafine particle emissions from mobile sources, is not evident. However, ultrafine particle emissions from mobile sources may not be expected to significantly affect particle number concentrations at the Duke Forest site. Emissions of ultrafine particles from light-duty vehicles are much lower than NO emissions and decrease exponentially with distance away from the point of emissions. Hagler et al. [42] conducted a study along a major roadway in nearby Raleigh, NC in which concentrations of NO, NO2, and ultrafine particles (10–70 nm) were measured 20 m from the roadway and at increasing distances downwind. Very good correlation between NO and ultrafine particle number concentrations (UFP) was observed at a distance of 20 m, with regression slopes indicating a UFP (#/cm−3)/NO(ppb) concentration ratio of ≈230. Using this ratio, the morning and evening peaks in NO and NOx shown in Figure 9 would translate to small increases in particle number concentration and would be difficult to resolve within the temporal variability displayed by the particle number concentrations. A study by Geron 2009 [23] observed that diesel traffic from major roads northeast of the site is partly responsible for a late morning peak in elemental carbon during spring and summer weekdays. A coincident peak in particle number concentration is not discernible in the average diurnal profiles of nucleation versus non-nucleation days (Figure 9). We conclude that it is not possible to clearly identify an effect of mobile emissions on particle number concentrations (<250 nm) at this site.

Figure 9.
The diurnal variation of number concentration and atmospheric gas species averaged for all the nucleation event days with coincident chemistry data.
SO2 concentrations display a distinct peak between 8:00 and 10:00 am on nucleation days and higher concentrations relative to non-nucleation days. This pattern of increasing SO2 concentrations after sunrise is consistent with downward mixing of SO2 from aloft as the nocturnal boundary layer breaks down. This period of increasing SO2 concentrations often coincides with the daily minimum in condensation sink and onset of nucleation, particularly during warm months, which may be indicative of H2SO4-mediated nucleation. Hydroxyl radical (OH) concentrations were not measured during the study. However, OH concentrations would be expected to increase rapidly after sunrise on cloudless days when nucleation events were most frequently observed. The formation and growth of H2SO4 would be expected to lag slightly behind the increase in OH [43] and SO2. When hourly averaged for all the nucleation events (Figure 8(d)), from approximately 1 h prior to the nucleation onset (7:00 am), until the peak in number concentration (1:00 pm), there exists a strong positive correlation between nucleation mode particles and SO2 in the initial couple of hours at the start of nucleation; as the particle number concentration increases, the concentration of SO2 decreases. The fact that on non-nucleation days no such relation exists between the two supports our suggestion of increased precursor concentrations on nucleation days.
For particle growth to proceed following nucleation, sufficient concentrations of low volatility condensable gases are required. In less polluted areas, biogenic organic compounds may play a role in the formation [44] and growth [45] of new particles. To examine the potential role of organics at this site, we examined correlations between nucleation characteristics and organic carbon concentrations in PM2.5, as well as O3, a gas phase precursor to secondary organic aerosol. Condensation sink is positively correlated with organic carbon concentration (Figure 10) on nucleation days (R2 = 0.24) whereas no correlation is observed on non-nucleation days. In addition to the direct role of organic species in secondary aerosol formation, Zhang et al. [7] identified that the presence of organic acids also enhanced sulfuric acid nucleation. On days in which nucleation occurred, high values of CS, the rate at which vapor molecules condense onto existing particles, were associated with high organic carbon concentrations. Geron [46] showed that oxidation products of biogenic VOC (e.g., isoprene, monoterpenes, sesquiterpenes) contribute significantly to organic carbon in PM at this forest site, which may partially explain the moderate correlation observed between CS and total organic carbon in PM2.5 on nucleation days. While the predominance of nucleation events on days with high PAR likely reflects a photochemical control, such days would also exhibit higher emission rates of biogenic VOC relative to low PAR days at similar temperature [47]. Furthermore, the highest particle growth rates were observed during warm months when VOC (mono- and sesquiterpene) emission rates from vegetation at this site are highest [48].

Figure 10.
The correlation between organic carbon and condensation sink on nucleation days and non-nucleation days.
If biogenic VOC plays a role in particle formation and growth at this site, as suggested by the relationship between condensation sink and organic carbon in PM, a relationship between nucleation characteristics and atmospheric oxidative capacity may also be expected. Based on in situ measurements collected during the Chemical Emission, Loss, Transformation, and Interactions with Canopies (CELTIC) campaign and subsequent longer term measurements of organic and elemental carbon, the modeling results from Geron [46] show that isoprene, monoterpenes, and sesquiterpenes contribute 90%, 6%, and 4% of secondary organic aerosol at this site, which dominates total organic carbon in PM2.5 during warm months [23]. Also based on CELTIC measurements, Stroud et al. [49] concluded that local isoprene oxidation is dominated by OH, whereas O3 and OH exert similar control over monoterpene oxidation, and sesquiterpene oxidation is dominated by O3. We found moderate positive correlation between the condensation sink and O3 concentrations on nucleation days and no correlation on non-nucleation days (Figure 11). This relationship suggests that on days when nucleation occurred, rapid and sustained particle growth was associated with conditions (i.e., high O3) that favor the oxidation of gas phase organic compounds, a pattern that is consistent with the relationship between CS and the concentration of organic carbon in PM.
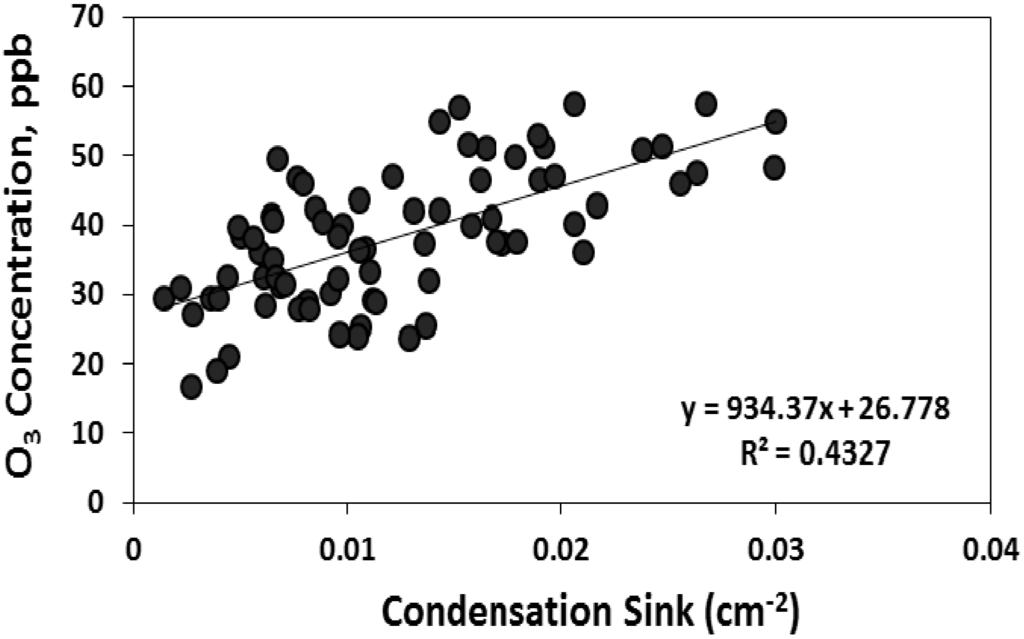
Figure 11.
The correlation between condensation sink with total particle number concentration and O3 on nucleation days.
4. Summary and Conclusions
Particle size distributions were measured from November 2005 to September 2007 at Duke Forest near Chapel Hill, North Carolina. Observations indicate that new particle formation is frequent in this region, occurring on 69% of valid measurement days, with classes A and B events occurring on 36% of valid days. Consistent with other studies, nucleation days are generally associated with sparse or no cloud cover, strong radiative flux, lower relative humidity, and little or no precipitation. Class A events occurred most frequently in the spring, a finding that is also consistent with other studies in the US The highest particle growth rates were also observed in the spring while the lowest growth rates occurred during winter. We observed no significant impact of local traffic on nucleation event days.
On nucleation days, SO2 concentrations typically showed a distinct peak between 8:00 am and 10:00 am, consistent with downward mixing of SO2 from aloft as the nocturnal boundary layer breaks down. This period of increasing SO2 concentrations often coincides with the daily minimum in condensation sink and onset of nucleation, particularly during warm months, which may be indicative of H2SO4-mediated nucleation. On days in which nucleation occurred, high values of CS were associated with relatively higher concentrations of organic carbon in PM2.5, which may indicate the participation of biogenic volatile organic carbon as precursors in the growth process. While the predominance of nucleation events on days with high PAR likely reflects a photochemical control, such days would also exhibit higher emission rates of biogenic VOC relative to low PAR days at a similar temperature. The highest particle growth rates were observed during warm months when VOC (mono- and sesquiterpene) emission rates from vegetation at this site are highest [48]. It is noteworthy that Geron and Arnts [48] observed high monoterpene emission rates in the spring, which corresponds to period of most frequent Class A nucleation events. We found moderate positive correlation between the condensation sink and O3 concentrations on nucleation days, suggesting that on days when nucleation occurred, rapid and sustained particle growth was associated with conditions (i.e., high O3) that favor the oxidation of gas phase organic compounds. This pattern is consistent with the observed relationship between CS and the concentration of organic carbon in PM.
The frequency, seasonal distribution, and relationships between nucleation events and meteorology at short time scales are consistent with other studies in the US Relationships with chemical precursors and secondary aerosol products associated with nucleation, coupled with diurnal boundary layer dynamics and seasonal temperature trends, suggest that H2SO4 and biogenic VOC play a role in nucleation at this site. However, without additional detailed measurements, isolation of the nucleation mechanism is not possible, thus inviting further study. Data from this study provide a dataset for testing of particle formation and dynamics in regional modeling tools such as the Community Multi-scale Air Quality Model (CMAQ) and add to a growing understanding of the frequency, intensity, and chemical and meteorological drivers of particle formation in southeastern US. Our results may also be used to guide further studies aimed at characterizing the chemical characteristics of nucleation, with a focus on H2SO4 and organic precursors.
Acknowledgments
The authors would like to acknowledge that the Duke Forest meteorology data was obtained from Brookhaven National Laboratory under the US Department of Energy Contract No. DE-AC02-98CH10886. This research was supported in part by the Office of Science (BER), US Department of Energy, Grant No. DE-FG02-95ER62083. The work described in this paper was partially funded by the US Environmental Protection Agency. The contents do not necessarily reflect the view of the Agency, and no official endorsement should be inferred. Mention of commercial products does not constitute endorsement by the Agency. It has been subjected to the Agency’s peer and administrative review and has been approved for publication as an EPA document.
References
- Ramanathan, V.; Crutzen, P.J.; Kiehl, J.T.; Rosenfeld, D. Aerosols, climate and the hydrological cycle. Science 2001, 294, 2119–2124. [Google Scholar] [CrossRef]
- Climate Change 2007: The Physical Science Basis. Contribution of Working Group I to the Fourth Assessment Report of the Intergovernmental Panel on Climate Change; Solomon, S.; Qin, D.; Manning, M.; Chen, Z.; Marquis, M.; Averyt, K.B.; Tignor, M.; Miller, H.L. (Eds.) Cambridge University Press: Cambridge, UK, 2007.
- Ehn, M.; Petja, T.; Birmili, W.; Junninen, H.; Aalto, P.; Kulmala, M. Non-volatile residuals of newly formed atmospheric particles in the boreal forest. Atmos. Chem. Phys. 2007, 7, 677–684. [Google Scholar] [CrossRef]
- Kulmala, M.; Korhonen, P.; Napari, I.; Karlsson, A.; Berresheim, H.; O’Dowd, C.D. Aerosol formation during PARFORCE: Ternary nucleation of H2SO4, NH3, and H2O. J. Geophys. Res. 2002. [Google Scholar] [CrossRef]
- Kulmala, M. How particles nucleate and grow. Science 2003, 302, 1000–1001. [Google Scholar] [CrossRef]
- Yu, F.Q.; Turco, R.P. From molecular clusters to nanoparticles: Role of ambient ionization in tropospheric aerosol formation. J. Geophys. Res. 2001, 106, 4797–4814. [Google Scholar] [CrossRef]
- Zhang, R.; Suh, I.; Zhao, J.; Zhang, D.; Fortner, E.C.; Tie, X.; Molina, L.T.; Molina, M.J. Atmospheric new particle formation enhanced by organic acids. Science 2004, 304, 1487–1490. [Google Scholar] [CrossRef]
- Stanier, C.O.; Khlystov, A.Y.; Pandis, S.N. Ambient aerosol size distributions and number concentrations measured during the Pittsburgh Air Quality Study (PAQS). Atmos. Environ. 2004, 38, 3275–3284. [Google Scholar] [CrossRef]
- Kulmala, M.; Vehkamäki, H.; Petäjä, T.; Dal Maso, M.; Lauri, A.; Kerminen, V.M.; Birmili, W.; McMurry, P.H. Formation and growth rates of ultrafine atmospheric particles: A review of observations. J. Aerosol Sci. 2004, 35, 143–176. [Google Scholar] [CrossRef]
- Kulmala, M.; Petäjä, T.; Mönkkönen, P.; Koponen, I.K.; Dal Maso, M.; Aalto, P.P.; Lehtinen, K.E.J.; Kerminen, V.M. On the growth of nucleation mode particles: Source rates of condensable vapor in polluted and clean environments. Atmos. Chem. Phys. 2005, 5, 409–416. [Google Scholar] [CrossRef]
- Stanier, C.O.; Khlystov, A.Y.; Pandis, S.N. Nucleation events during the Pittsburgh air quality study: Description and relation to key meteorological, gas phase, and aerosol parameters. Aerosp. Sci. Technol. 2004, 38, 253–264. [Google Scholar] [CrossRef]
- Cheung, H.C.; Morawska, L.; Ristovski, Z.D. Observation of new particle formation in subtropical urban environment. Atmos. Chem. Phys. Discuss. 2010, 10, 22623–22652. [Google Scholar] [CrossRef]
- Jeong, C.H.; Evans, G.J.; McGuire, M.L.; Chang, R.Y.W.; Abbatt, J.P.D.; Zeromskiene, K.; Mozurkewich, M.; Li, S.M.; Leaitch, W.R. Particle formation and growth at five rural and urban sites. Atmos. Chem. Phys. Discuss. 2010, 10, 11615–11657. [Google Scholar] [CrossRef]
- Boy, M.; Kazil, J.; Lovejoy, E.R.; Guenther, A.; Kulmala, M. Relevance of ion-induced nucleation of sulfuric acid and water in the lower troposphere over the boreal forest at northern latitudes. Atmos. Res. 2008, 90, 151–158. [Google Scholar] [CrossRef]
- Gerrit, D.L.; Kunz, G.J.; Buzorius, G.; O’Dowd, C.D. Meteorological influences on coastal new particle formation. J. Geophys. Res. 2002. [Google Scholar] [CrossRef]
- O’Dowd, C.D.; Hämeri, K.; Mäkelä, J.M.; Väkeva, M.; Aalto, P.; de Leeuw, G.; Kunz, G.J.; Becker, E.; Hansson, H.-C.; Allen, A.G.; et al. Coastal new particle formation: Environmental conditions and aerosol physicochemical characteristics during nucleation bursts. J. Geophys. Res. 2002. [Google Scholar] [CrossRef]
- Place, P.F.; Ziemba, L.D.; Griffine, R.J. Observations of nucleation-mode particle events and size distributions at a rural New England site. Atmos. Environ. 2010, 44, 88–94. [Google Scholar] [CrossRef]
- Erupe, M.E.; Benson, D.R.; Li, J.; Young, L.H.; Verheggen, B.; Al-Refai, M.; Tahboub, O.; Cunningham, V.; Frimpong, E.; Viggiano, A.; et al. Correlation of aerosol nucleation rate with sulfuric acid and ammonia in Kent, Ohio: An atmospheric observation. J. Geophys. Res. 2010. [Google Scholar] [CrossRef]
- O’Halloran, T.L.; Fuentes, J.D.; Collins, D.R.; Cleveland, M.J.; Keene, W.C. Influence of air mass source region on nanoparticle events and hygroscopicity in central Virginia, U.S. Atmos. Environ. 2009, 43, 3586–3595. [Google Scholar] [CrossRef]
- Stroud, C.A.; Nenes, A.; Jimenez, J.L.; DeCarlo, P.F.; Huffman, J.A.; Bruintjes, R.; Nemitz, E.; Delia, A.E.; Toohey, D.W.; Guenther, A.B.; et al. Cloud activating properties of aerosol observed during CELTIC. J. Atmos. Sci. 2007, 64, 441–459. [Google Scholar] [CrossRef]
- Woo, K.S.; Chen, D.R.; Pui, D.Y.H.; McMurry, P.H. Measurements of Atlanta aerosol size distributions: Observations of ultrafine particle events. Aerosp. Sci. Technol. 2001, 34, 75–87. [Google Scholar]
- Pryor, S.C.; Spaulding, A.M.; Barthelmie, R.J. New particle formation in the Midwestern USA: Event characteristics, meteorological context and vertical profiles. Atmos. Environ. 2010, 44, 4413–4425. [Google Scholar] [CrossRef]
- Geron, C.D. Carbonaceous aerosol over a Pinus taeda forest in central North Carolina, USA. Atmos. Environ. 2009, 43, 659–969. [Google Scholar] [CrossRef]
- Frank, B.P.; Saltiel, S.; Hogrefe, O.; Grygas, J.; Lala, G.G. Determination of mean particle size using the electrical aerosol detector and the condensation particle counter: Comparison with the scanning mobility particle sizer. J. Aerosol Sci. 2008, 39, 19–29. [Google Scholar] [CrossRef]
- Von der Weiden, S.-L.; Drewnick, F.; Borrmann, S. Particle loss calculator—A new software tool for the assessment of the performance of aerosol inlet systems. Atmos. Meas. Tech. 2009, 2, 479–494. [Google Scholar] [CrossRef]
- Dal Maso, M.; Kulmala, M.; Riipinen, I.; Wagner, R.; Hussein, T.; Aalto, P.P.; Lehtinen, K.E.J. Formation and growth of fresh atmospheric aerosols: Eight years of aerosol size distribution data from SMEAR II, Hyytiälä, Finland. Bor. Environ. Res. 2005, 10, 323–336. [Google Scholar]
- Boy, M.; Karl, T.; Turnipseed, A.; Mauldin, R.L.; Kosciuch, E.; Greenberg, J.; Rathbone, J.; Smith, J.; Held, A.; Barsanti, K.; et al. New particle formation in the front range of the Colorado Rocky Mountains. Atmos. Chem. Phys. Discuss. 2008, 7, 15581–15617. [Google Scholar]
- Pryor, S.C.; Barthelmie, R.J.; Sørensen, L.L.; McGrath, J.G.; Hopke, P.; Petäjä, T. Spatial and vertical extent of nucleation events in the Midwestern USA: Insights from the Nucleation In Forests (NIFTy) experiment. Atmos. Chem. Phys. 2011, 11, 1641–1657. [Google Scholar]
- Dal Maso, M.; Kulmala, M.; Lehtinen, K.E.J.; Makela, J.M.; Aalto, P.; O’Dowd, C.D. Condensation and coagulation sinks and formation of nucleation mode particles in coastal and boreal forest boundary layers. J. Geophys. Res. 2002. [Google Scholar] [CrossRef]
- Kulmala, M.; Dal Maso, M.; Makela, J.M.; Pirjola, L.; Vakeva, M.; Aalto, P.; Miikkulainen, P.; Ha¨meri, K.; O’Dowd, C.D. On the formation, growth and composition of nucleation mode particles. Tellus B 2001, 53B, 479–490. [Google Scholar]
- Fuchs, N.A.; Sutugin, A.G. High-Dispersed Aerosols. In Current Aerosol Research; Hidy, G.M., Brock, J., Eds.; Pergamon: Oxford, UK, 1971; pp. 1–60. [Google Scholar]
- Kuuluvainen, H.; Kannosto, J.; Virtanen, A.; Mäkelä, J.M.; Kulmala, M.; Aalto, P.; Keskinen, J. Technical note: Measuring condensation sink and ion sink of atmospheric aerosols with the electrical low pressure impactor (ELPI). Atmos. Chem. Phys. 2010, 10, 1361–1368. [Google Scholar] [CrossRef]
- Sihto, S.L.; Kulmala, M.; Kerminen, V.M.; Dal Maso, M.; Petaja, T.; Riipinen, I.; Korhonen, H.; Arnold, F.; Janson, R.; Boy, M.; et al. Atmospheric sulphuric acid and aerosol formation: Implications from atmospheric measurements for nucleation and early growth mechanisms. Atmos. Chem. Phys. 2006, 6, 4079–4091. [Google Scholar] [CrossRef]
- McMurry, P.; Fink, M.; Sakurai, H.; Stolzenburg, M.; Mauldin, R.; Smith, J.; Eisele, F.; Moore, K.; Sjostedt, S.; Tanner, D.; et al. A criterion for new particle formation in the sulfur-rich Atlanta atmosphere. J. Geophys. Res. 2005. [Google Scholar] [CrossRef]
- Qian, S.; Sakurai, H.; McMurry, P.H. Characteristics of regional nucleation events in urban East St. Louis. Atmos. Environ. 2007, 41, 4119–4127. [Google Scholar] [CrossRef]
- Boy, M.; Kulmala, M. Nucleation events in the continental boundary layer: Influence of physical and meteorological parameters. Atmos. Chem. Phys. 2002, 2, 1–16. [Google Scholar]
- Jaatinen, A.; Hamed, A.; Joutsensaari, J.; Mikkonen, S.; Birmili, W.; Wehner, B.; Spindler, G.; Wiedensohler, A.; Decesari, S.; Mircea, M.; et al. A comparison of new particle formation events in the boundary layer at three different sites in Europe. Bor. Environ. Res. 2009, 14, 481–498. [Google Scholar]
- Berresheim, H.; Elste, T.; Tremmel, H.G.; Allen, A.G.; Hansson, H.C.; Rosman, K.; Dal Maso, M.; Makela, J.M.; Kulmala, M. Gas-aerosol relationships of H2SO4, MSA, and OH: Observations in the coastal marine boundary layer at Mace Head, Ireland. J. Geophys. Res. 2002. [Google Scholar] [CrossRef]
- Bonn, B.; Moortgat, G.K. New particle formation during α- and β-pinene oxidation by O3, OH, and NO3, and the influence of water vapor: Particle size distribution studies. Atmos. Chem. Phys. 2002, 2, 183–196. [Google Scholar] [CrossRef]
- Zhang, X.; Chen, Z.M.; Wang, H.L.; He, S.Z.; Huang, D.M. An important pathway for ozonolysis of alpha-pinene and beta-pinene in aqueous phase and its atmospheric implications. Atmos. Environ. 2009, 43, 4465–4471. [Google Scholar] [CrossRef]
- Hamed, A.; Korhonen, H.; Sihto, S.-L.; Joutsensaari, J.; Järvinen, H.; Petäjä, T.; Arnold, F.; Nieminen, T.; Kulmala, M.; Smith, J.N.; et al. The role of relative humidity in continental new particle formation. J. Geophys. Res. 2011. [Google Scholar] [CrossRef]
- Hagler, G.S.W.; Baldauf, R.W.; Thoma, E.D.; Long, T.R.; Snow, R.F.; Kinsey, J.S.; Oudejans, L.; Gullett, B.K. Ultrafine particles near a major roadway in Raleigh, North Carolina: Downwind attenuation and correlation with traffic-related pollutants. Atmos. Environ. 2009, 43, 1229–1234. [Google Scholar] [CrossRef]
- Weber, R.J.; Marti, J.J.; McMurry, P.H.; Eisele, F.L.; Tanner, D.J.; Jefferson, A. Measurements of new particle formation and ultrafine particle growth rates at a clean continental site. J. Geophys. Res. 1997, 102, 4375–4385. [Google Scholar]
- Metzger, A.; Verheggen, B.; Dommen, J.; Duplissy, J.; Prevot, A.S.H.; Weingartner, E.; Riipinen, I.; Kulmala, M.; Spracklen, D.V.; Carslaw, K.S.; et al. Evidence for the role of organics in aerosol particle formation under atmospheric conditions. Proc. Natl. Acad. Sci. USA 2010, 107, 6646–6651. [Google Scholar] [CrossRef]
- Laaksonen, A.; Kulmala, M.; O’Dowd, C.D.; Joutsensaari, J.; Vaattovaara, P.; Mikkonen, S.; Lehtinen, K.E.J.; Sogacheva, L.; Dal Maso, M.; Aalto, P.; et al. The role of VOC oxidation products in continental new particle formation. Atmos. Chem. Phys. 2008, 8, 2657–2665. [Google Scholar]
- Geron, C.D. Carbonaceous aerosol characteristics over a Pinus taeda plantation: Results from the CELTIC experiment. Atmos. Environ. 2011, 45, 794–801. [Google Scholar] [CrossRef]
- Guenther, A.; Zimmerman, P.R.; Harley, P. Isoprene and monoterpenes emission rate variability: Model evaluations and sensitivity analysis. J. Geophys. Res. 1993, 98, 12609–12617. [Google Scholar] [CrossRef]
- Geron, C.D.; Arnts, R.R. Seasonal monoterpene and sesquiterpene emissions from Pinus taeda and Pinus virginiana. Atmos. Environ. 2010, 44, 4240–4251. [Google Scholar] [CrossRef]
- Stroud, C.; Makar, P.; Karl, T.; Guenther, A.; Geron, C.; Turnipseed, A.; Nemitz, E.; Baker, B.; Potosnak, M.; Fuentes, J.D. Role of canopy-scale photochemistry in modifying biogenic-atmosphere exchange of reactive terpene species: Results from the CELTIC field study. J. Geophys. Res. 2005. [Google Scholar] [CrossRef]
© 2013 by the authors; licensee MDPI, Basel, Switzerland. This article is an open access article distributed under the terms and conditions of the Creative Commons Attribution license (http://creativecommons.org/licenses/by/3.0/).