Article

Decreases in Mercury Wet Deposition over the United States during 2004–2010: Roles of Domestic and Global Background Emission Reductions

Department of Atmospheric Sciences, University of Washington, Seattle, WA 98195, USA
*
Author to whom correspondence should be addressed.
Atmosphere 2013, 4(2), 113-131; https://doi.org/10.3390/atmos4020113
Submission received: 8 April 2013 / Revised: 26 April 2013 / Accepted: 6 May 2013 / Published: 10 May 2013
(This article belongs to the Special Issue Atmospheric Mercury)

Abstract

:
Wet deposition of mercury (Hg) across the United States is influenced by changes in atmospheric conditions, domestic emissions and global background emissions. We examine trends in Hg precipitation concentrations at 47 Mercury Deposition Network (MDN) sites during 2004–2010 by using the GEOS-Chem nested-grid Hg simulation. We run the model with constant anthropogenic emissions and subtract the model results from the observations. This helps to remove the variability in observed Hg concentrations caused by meteorological factors, including precipitation. We find significant decreasing trends in Hg concentrations in precipitation at MDN sites in the Northeast (−4.1 ± 0.49% yr−1) and Midwest (−2.7 ± 0.68% yr−1). Over the Southeast (−0.53 ± 0.59% yr−1), trends are weaker and not significant, while over the West, trends are highly variable. We conduct model simulations assuming a 45% decrease in Hg emissions from domestic sources in the modeled period and a uniform 12% decrease in background atmospheric Hg concentrations. The combination of domestic emission reductions and decreasing background concentrations explains the observed trends over the Northeast and Midwest, with domestic emission reductions accounting for 58–46% of the decreasing trends. Over the Southeast, we overestimate the observed decreasing trend, indicating potential issues with our assumption of uniformly decreasing background Hg concentrations.

1. Introduction

Mercury (Hg) is listed as a Hazardous Air Pollutant (HAP) by the US Environmental Protection Agency (EPA) because of its neurotoxicity [1]. Atmospheric Hg is emitted in two forms: gaseous elemental Hg (GEM or Hg(0)) and divalent oxidized Hg (Hg(II)), which can partition into both gaseous oxidized Hg (GOM) and particulate-bound Hg (PBM). Hg originates from both natural sources, mainly in the form of Hg(0), and anthropogenic sources, as Hg(0) and Hg(II) [2,3]. It is generally assumed that 1/3 of global Hg emissions are natural, 1/3 are anthropogenic and 1/3 are derived from re-emission of previously deposited anthropogenic Hg [4,5]. Hg(0) has an atmospheric lifetime of several months to a year and can thus be transported on large scales before being deposited or oxidized to Hg(II), while Hg(II) is readily deposited and thus has shorter transport distances [6]. Deposition of Hg to water surfaces and the resulting possibility of fish contamination is the main human exposure pathway to Hg in North America [7,8].
In the United States, the main anthropogenic sources of Hg include coal-fired power plants (CFPP), waste incineration, cement manufacturing, chemical production, primary metal production and metal mining [9]. The relative contribution of these domestic anthropogenic emissions to Hg deposition over the United States has been evaluated in several studies [10,11,12]. For example, Seigneur et al. [10] used a multi-scale modeling system and found North American anthropogenic emissions contributions to deposition to be 24% (wet deposition) and 43% (dry deposition). Selin and Jacob [11] found that North American anthropogenic sources contribute 27% (wet) and 17% (dry) to deposition fluxes over the US in 2004–2005. To account for the observed small fraction of Hg(II) in plumes downwind of power plants [13,14], Zhang et al. [12] modified the source profiles of Hg emitted from power plants, as well as waste incinerators and estimated lower contributions of 10% (wet) and 13% (dry) in 2008–2009.
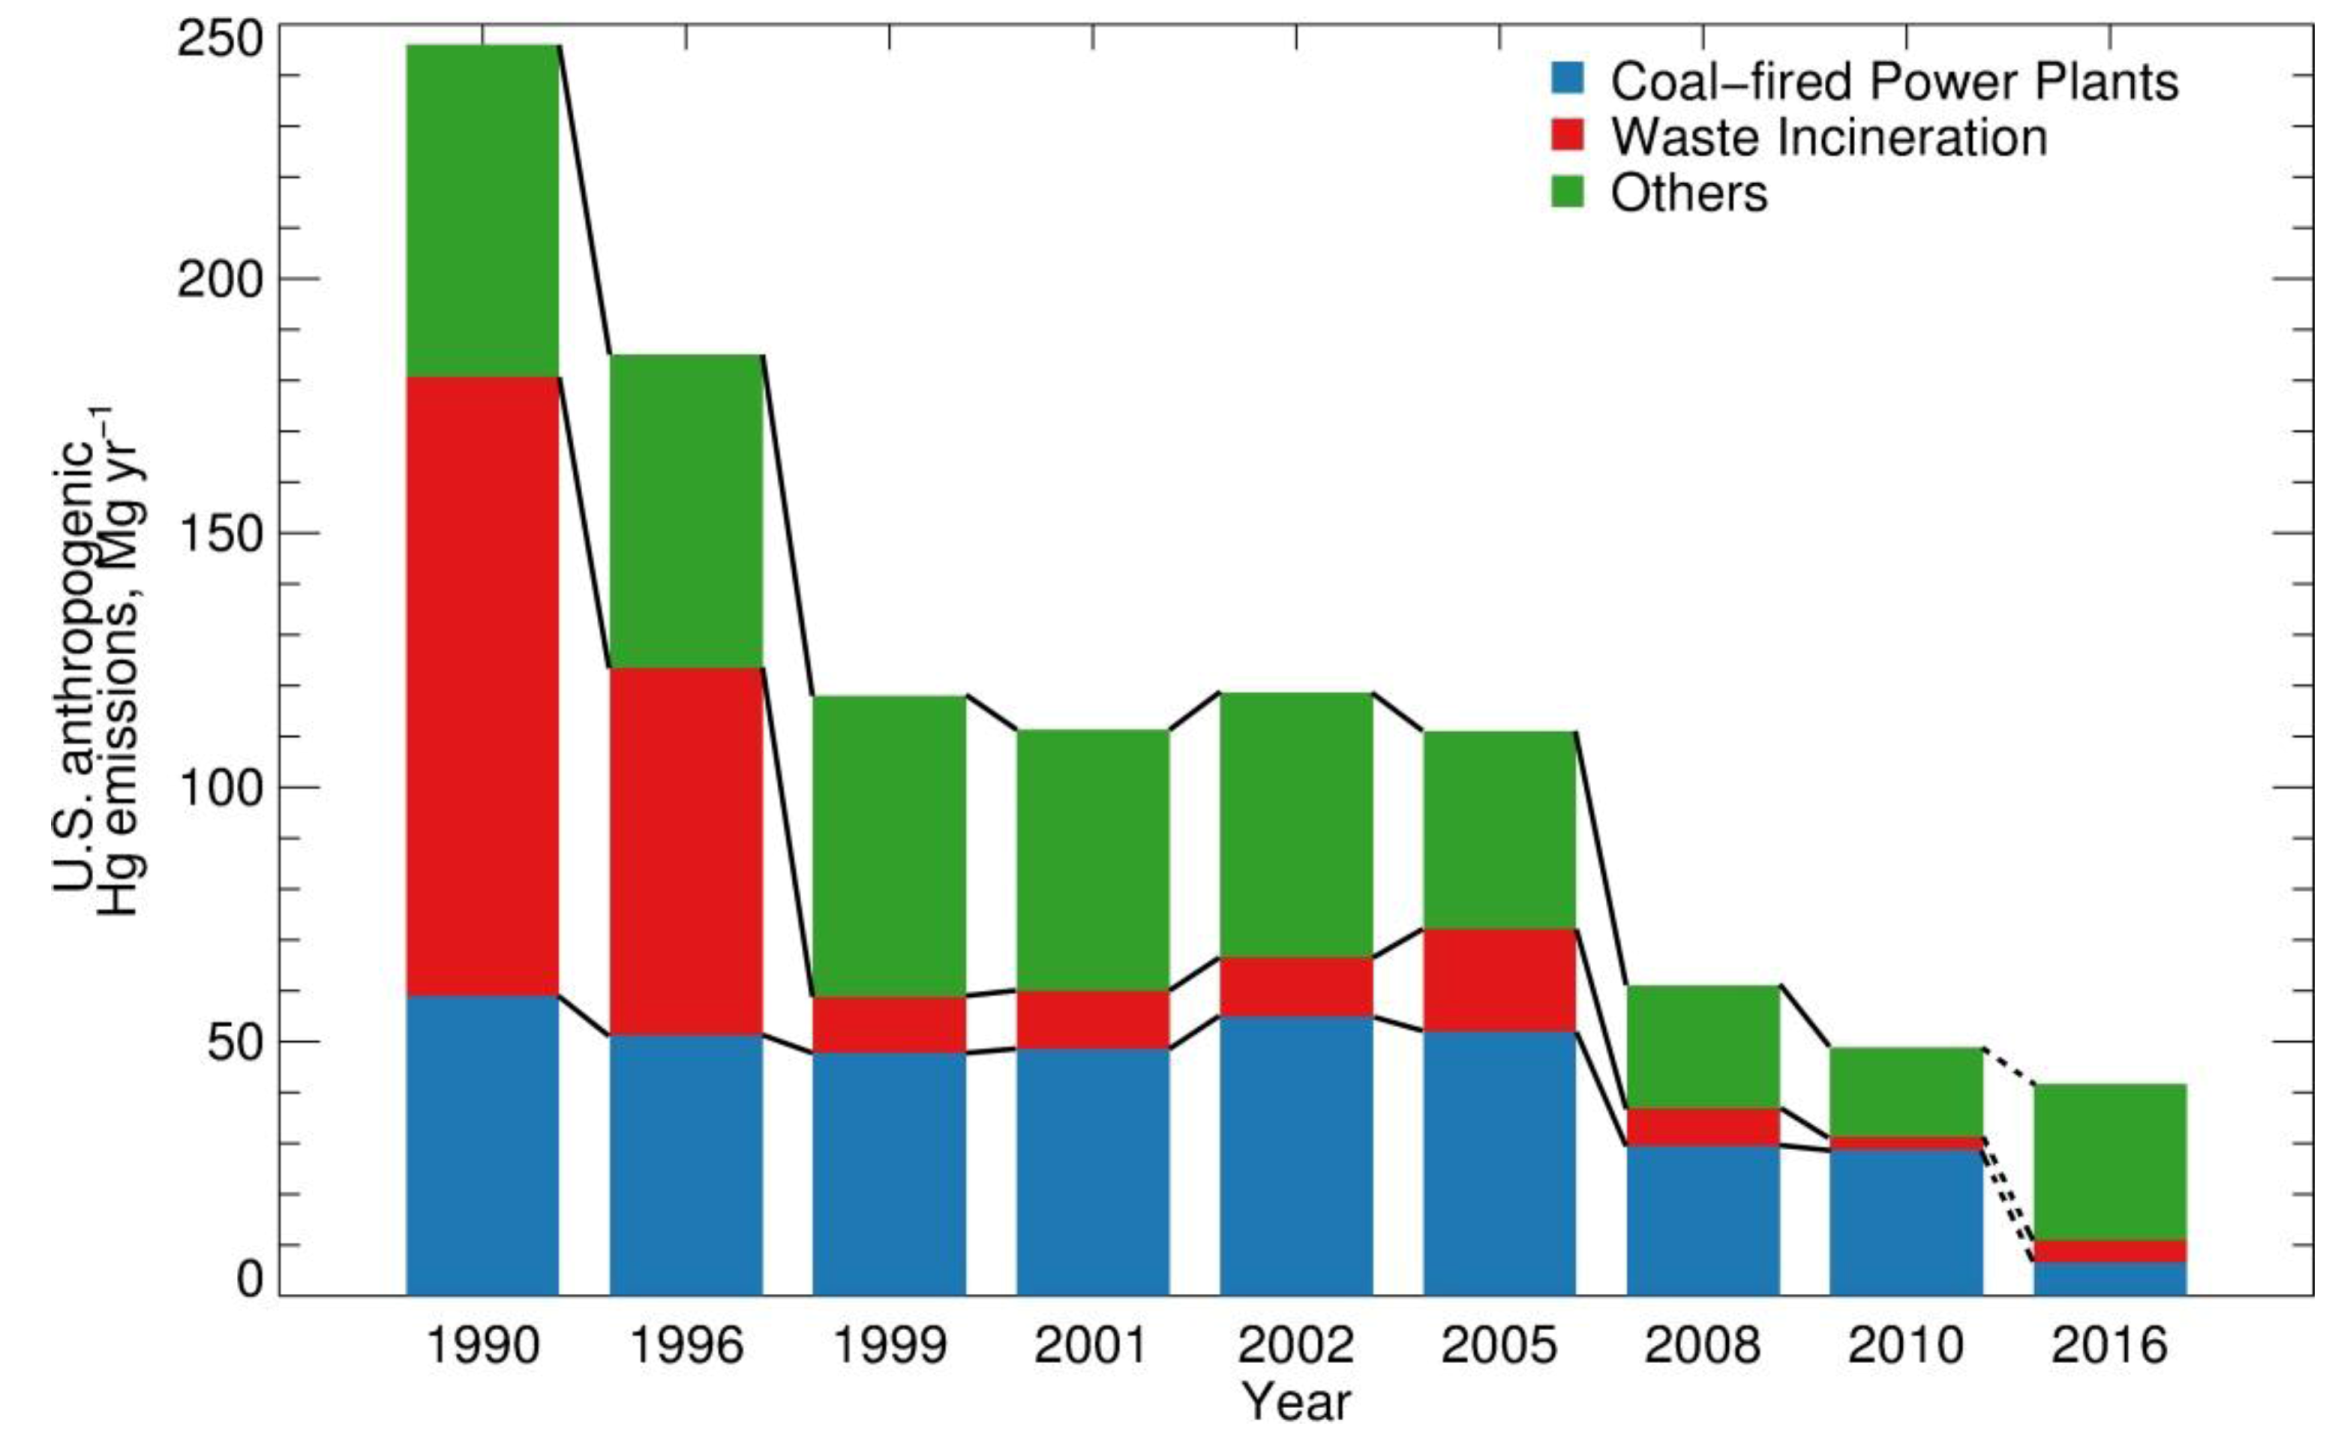
Figure 1 summarizes US Hg anthropogenic emissions for 1990–2010 based on several inventories: the Toxics Release Inventory (TRI) [15], the National Toxics Inventory (NTI) [16] and the National Emission Inventory (NEI) [17]. We separate emissions into three categories: CFPP, waste incinerators and “others” (the remaining US anthropogenic source categories). The implementation of the 1990 Solid Waste Combustion Rule as part of the Clean Air Act has led to the decrease of Hg emissions from medical, municipal, commercial and industrial waste incinerators from 122 Mg∙yr−1 in 1990 to 10.9 Mg∙yr−1 in 1999 (Figure 1) [18]. Anthropogenic Hg emissions remained nearly constant between 1999 and 2005, with CFPPs accounting for 50% of Hg emissions. In 2005, the EPA issued the Clean Air Mercury Rule to cap and reduce CFPP emissions [19]. Although this rule was overturned in 2008, Hg emissions from the CFPP sector are estimated by EPA to have decreased by 43%, from 52 Mg∙yr−1 in 2005 (NEI2005) to 29.5 Mg∙yr−1 in 2008 (NEI2008) and remained constant during 2008–2010 based on the recent release of 2010 Information Collection Request (ICR) estimates by the EPA [20]. The causes for these large emission reductions are not fully understood, but likely include compliance with state Hg-specific rules, voluntary reductions by utility operators and co-benefits of Hg reductions from control devices installed for the reduction of other pollutants, such as SO2 and particulate matter [9]. In parallel, between 2005 and 2008 Hg emissions from waste incinerators decreased from 20 Mg∙yr−1 (NEI2005) to 7 Mg∙yr−1 (NEI2008). Emissions from other sectors also decreased from 39 Mg∙yr−1 (NEI2005) to 24 Mg∙yr−1 (NEI2008). With the announcement of the Mercury and Air Toxics Standard (MATS) in December 2011 [21], Hg emissions from CFPPs are projected to decrease to less than 7 Mg∙yr−1 in 2016 [9,22]. The significant decreases in Hg emissions over the 1990–1999 and 2005–2010 time periods provide an opportunity to quantitatively evaluate the contribution of anthropogenic emissions to Hg deposition over the US.
Figure 1. Anthropogenic Hg emissions in the US between 1990 and 2010 and projected emissions for 2016. Hg emissions are lumped into three source categories: coal-fired power plants (CFPPs), waste incineration (including hospital/medical/infectious, municipal, industrial/commercial and hazardous waste incineration and sewage sludge) and others (mainly stone/clay/glass/cement production, chemical production, primary metal production and metal mining). Emissions for 1990, 1999, 2002, 2005 and 2008 are from the National Emission Inventories (NEI) [17]. The 1996 emissions are from the National Toxics Inventories (NTI) [16]. The data for 2001 is from US EPA [23]. The CFPP emission for 2010 is based on Information Collection Request (ICR) by the EPA [20]. For 2010, non-CFPP emissions are estimated based on Toxic Release Inventories (TRI) for 2005 and 2010 [15]. Emissions for 2016 are projected by the Integrated Planning Model (IPM) [22].
Atmosphere 04 00113 g001
Likely as a response to these anthropogenic emission reductions, the observed Hg wet deposition fluxes and Hg concentrations in precipitation at Mercury Deposition Network (MDN) sites over the US have decreased during these periods, although the reported trends vary depending on the study and time period, as summarized in Table 1. For example, Butler et al. [24] find trends ranging from −1.7% yr−1 to −3.5% yr−1 in Hg concentrations at most sites in the Northeast and Midwest for 1998–2005, but found no significant trend over the Southeast. Prestbo and Gay [25] also report decreasing Hg concentration trends (1–2% yr−1 during 1996–2005), but only at half of the MDN sites, particularly across Pennsylvania and extending up through the Northeast region. Risch et al. [26] find Hg wet deposition to be unchanged in the Great Lakes region during 2002–2008 by evaluating five monitoring networks in the US and Canada. Furthermore, they find that the small decreases in Hg concentrations were offset by increases in precipitation. Gratz et al. [27] describe how declines in precipitation Hg concentrations at remote sites in the Northeast are linked to local-scale meteorological variability rather than to reductions in emissions. In Florida, trends in Hg wet deposition have been minimal or non-existent, despite large reductions in regional emissions of Hg [24,28]. One issue associated with these different studies is the significant interannual variation of Hg concentrations in precipitation and Hg wet deposition fluxes due to variability in precipitation. Indeed, an increase in precipitation results in an increase in the Hg deposition flux. This is accompanied by a decrease in Hg concentrations in rain due to the dilution of the washout loading [25,29]. Thus, interannual changes in meteorological conditions, especially precipitation, complicate the interpretation of MDN observations and might mask any trends due to changes in Hg emissions.
Table 1. Summary of trends in Hg concentrations in precipitation and atmospheric concentrations from selected studies in the literature.
PeriodTrends (% yr−1)Reference
Hg concentrations in precipitation
over North America
NortheastMidwestSoutheastWest
1998–2005−1.7 ± 0.51a−3.5 ± 0.740.01 ± 0.71 24
1996–20052.1 ± 0.88 b1.8 ± 0.281.3 ± 0.301.4 ± 0.4225
2002–20080.84 ± 2.9 b2.0 ± 3.8 26
2004–2010−4.1 ± 0.49 a −2.7 ± 0.680.53 ± 0.592.6 ± 1.5This study
Atmospheric Hg concentrations
1995–2005Canada−1.3 ± 1.933
1996–2009Mace Head, Ireland−1.434
Cape Point−2.7
1990–2009North Atlantic−2.5 ± 0.5435
South Atlantic 1.9 ± 0.91
2000–2009Temperate Canada−1.9 ± 0.336
Significant trends are indicated in bold fonts, trends that are insignificant are indicated in italics, while trends that lack of the information for significance are indicated in normal fonts. a Mean ± standard error, calculated by random coefficient model with site as a random effect; b calculated by averaging trends at individual sites.
Over the last two decades, anthropogenic Hg emissions over East Asia, especially in China, have rapidly increased [3,30]. Streets et al. [31] estimate that Hg emissions from Asia and Oceania increased from 975 Mg∙yr−1 in 1996 to 1,318 Mg∙yr−1 in 2006, equivalent to an annual increase rate of +3.1% yr−1. Wu et al. [30] found that anthropogenic Hg emissions from China have increased at an annual average growth rate of +2.9% yr−1 during 1995–2003, reaching 696 Mg∙yr−1 in 2003. In particular, emissions from CFPPs in China increased from 63 to 100 Mg∙yr−1 with a +5.9% annual growth rate during 1995–2003 [30] and reached 132 Mg∙yr−1 in 2007 [32].
Despite increases in anthropogenic emissions in Asia, there are indications that global background atmospheric Hg concentrations are decreasing (Table 1). Temme et al. [33] evaluated the trend of total gaseous mercury (TGM, defined as the sum of Hg(0) and gas phase Hg(II)) at 11 sites from the Canadian Atmospheric Mercury Network (CAMNet), finding a decreasing trend of −1.3±1.9% yr−1 with large site by site variation for the 1996–2005 period. Cole et al. [34] found that TGM concentrations measured at three temperate Canadian sites displayed trends ranging from −1.6 % yr−1 to −2.2% yr−1 (mean of −1.9% yr−1) during 2000–2009. Slemr et al. [35] evaluated long-term observations at stations in the Southern and Northern Hemisphere combined with cruise measurements over the Atlantic Ocean and found that TGM concentrations decreased by 20–38% between 1996 and 2009. In particular, TGM concentrations at Mace Head, Ireland, have decreased from 1.75 ng m−3 in 1996–1999 to 1.4 ng m−3 in 2009, showing a trend of −0.024 ± 0.005 ng m−3 yr−1 (equivalent to −1.4% yr−1). Soerensen et al. [36] analyzed 1977–2010 trends in atmospheric Hg from 21 ship cruises over the North Atlantic Ocean (NA) and 15 over the South Atlantic Ocean (SA). During the 1990–2009 period, they found a decline of −0.046 ± 0.010 ng m−3 yr−1 (−2.5% yr−1) over the NA and a smaller trend of −0.024 ± 0.005 ng m−3 yr−1 (−1.9% yr−1) over the SA. The causes for these decreasing trends are not fully understood, but might be due to decreasing reemissions from the legacy of historical mercury emissions in soils and ocean [35,36].
In this study, we will evaluate trends in observations of Hg concentrations in precipitation from MDN sites across the United States for the 2004–2010 period. We will use a Hg simulation in the GEOS-Chem chemical transport model to take into account the influence of variability in precipitation on the detected trends. Our objectives are (1) to evaluate recent variations and trends in Hg wet deposition and precipitation concentration over the United States; (2) to attribute the observed trends to domestic and global background emission changes.

2. Observations and Model

Wet deposition of Hg has been monitored over the US at MDN sites as part of the National Atmospheric Deposition Program since 1995 [37]. The network initially consisted of 17 sites and currently includes more than 100 active sites. MDN sites collect weekly integrated precipitation samples and report Hg wet deposition flux and the Hg concentration in precipitated water/snow. In this study, we select MDN sites with at least 75% data coverage each year during the 2004–2010 period, resulting in a group of 47 sites (see Figure S1 for the locations of these sites). To account for the lower collection efficiency of snow by MDN samplers [24,25], we correct the weekly deposition fluxes based on the average snow capture efficiency and the snow fraction over total precipitation as described in Zhang et al. [12].
In this paper, we will calculate trends based on observed volume-weighted mean (VWM) Hg concentrations in precipitated rain/snow instead of trends in observed Hg wet deposition fluxes. While both variables are affected by changes in precipitation, we found that observed VWM Hg concentrations are significantly less sensitive to precipitation than the deposition fluxes. This is discussed in more detail in the Supporting Information (see Figure S2 and related text).
We use the GEOS-Chem multi-scale nested-grid Hg simulation over North America [12]. The GEOS-Chem chemical transport model itself is described in Bey et al. [38]. The model is driven by assimilated meteorological fields from the NASA Goddard Earth Observing System (GEOS). We use here GEOS-5 meteorological fields with a horizontal resolution of 1/2° latitude by 2/3° longitude and 72 hybrid eta levels from the surface to 0.01 hPa. The lowest 2,000 m are resolved with 13 layers.
The GEOS-Chem global atmospheric Hg simulation is described by Selin et al. [39], with recent updates in Hg oxidant chemistry by Holmes et al. [40] and gas-particulate partitioning of Hg(II) by Amos et al. [41]. The model has two atmospheric mercury species: Hg(0) and Hg(II). The Hg chemistry includes Hg(0) oxidation by Br atoms with kinetic parameters from Donohoue et al. [42], Goodsite et al. [43] and Balabanov et al. [44], as well as aqueous-phase photochemical reduction of Hg(II), scaled to NO2 photolysis [40].
Over the US and Canada, we use Hg anthropogenic emissions from the 2005 EPA NEI inventory [17] and the 2005 Canadian National Pollutant Release Inventory [46]. Over the rest of the world, anthropogenic emissions are from the Global Emission Inventory Activity (GEIA) 2005 inventory of Pacyna et al. [45]. The NEI2005 and Canadian anthropogenic emission inventories assume a 55%/45% partitioning for Hg(0)/Hg(II), with 56.8%/43.2% for CFPP emissions. However, observations in power plant plumes suggest that most of the Hg(II) emitted is quickly reduced to Hg(0) within a few kilometers downwind [13,14]. In Zhang et al. [12], we demonstrated that using a 83%/17% partitioning for N. American anthropogenic Hg emissions (89%/11% in CFPPs) significantly improves model performance in reproducing observations of Hg wet deposition and atmospheric Hg speciation, especially over the Ohio River Valley region, where numerous CFPPs are situated. In this study, we use the same anthropogenic Hg partitioning as in Zhang et al. [12]. For global anthropogenic emissions, we assume a partitioning of 87%/13% (89%/11% Hg(0)/Hg(II) from CFPP emissions). Re-emission of Hg(0) from soil and ocean are also considered based on legacy Hg concentrations in these media [39,47]. GEOS-Chem simulates wet scavenging of Hg(II) following the scheme of Liu et al. [48], with recent updates by Amos et al. [41] and Wang et al. [49]. The model simulates the dry deposition of Hg(0) and Hg(II) based on the resistance-in-series scheme of Wesely [50]. Loss of Hg(II) via uptake onto sea-salt aerosol in the marine boundary layer is also considered [51].
The nested-grid model preserves the original resolution of the GEOS-5 meteorological fields(1/2° latitude × 2/3° longitude) over North America (10°–70°N and 40°–140°W) and uses results from a global (4° × 5°) simulation as initial and boundary conditions with self-consistent chemistry, deposition and meteorology between the nested and global domains. A full evaluation of the nested-grid Hg simulation is given in Zhang et al. [12]. The model reproduces the magnitude of MDN Hg wet deposition over the US with a small negative bias (−16%) and captures both the spatial distribution and seasonal cycle of wet deposition quite well. Furthermore, the model shows no bias in its simulation of ground-based and aircraft observations of GEM over the US The model reproduces the seasonal cycle of observed PBM. The model overestimates GOM observations by a factor of two, which is not unreasonable given the large variability and uncertainty of GOM measurements.
We run this nested-grid Hg simulation over North America for 2004–2010 assuming constant anthropogenic emissions based on the 2005 EPA NEI inventory (“BASE simulation”). We also conduct three additional sensitivity simulations. In the “US simulation”, we use the 2008 NEI inventory, which shows a 45% decrease in domestic anthropogenic Hg emissions compared to the 2005 NEI inventory. If we assume that US domestic anthropogenic Hg emissions remained nearly unchanged during 2004–2005 and 2008–2010 (Figure 1), this corresponds to a −7.5% yr−1 trend for 2004–2010. In the “NH simulation”, we apply a uniform 12% decrease in the nested-grid lateral boundary concentrations of Hg(0) and Hg(II). This reflects the decrease in background Northern Hemisphere TGM concentrations observed by Slemr et al. [35] at Mace Head, Ireland (from 1.60 ng∙m−3 in 2003 to 1.40 ng∙m−3 in 2009, corresponding to 12% decrease or a −2% yr−1 trend). Finally, the last sensitivity simulation “EA simulation” assumes a 32% increase in anthropogenic Hg emissions from East Asia (70–150°E, 8–45°N) [30,32], corresponding 5.4% yr−1 annual increase. In the EA simulation, US anthropogenic emissions remain unchanged at their 2005 levels (NEI2005). Each of these sensitivity simulations (US, NH and EA) is run for 2008–2009, and we compare the VWM Hg concentrations in these two years against the results in the same year range for the BASE simulation. The modeled trend, in % yr−1, is calculated by difference with the BASE simulation ( Atmosphere 04 00113 i001). We divide the difference by six because we assume that the change occurs over the six years elapsed between 2004 and 2010.
We calculate the trend in observed monthly VWM Hg concentrations using two methods. In the “direct regression” method, we first remove the seasonal cycle in Hg concentrations by subtracting the mean 2004–2010 seasonal cycle at each of the 47 individual MDN sites. We then conduct a least-square linear regression of the resulting time series against month number (n = 84 for seven years), and the slope of the regression line is the trend in VWM Hg concentrations. We express the calculated slope into a percent trend (in % yr−1) relative to the multi-year mean VWM Hg concentration of each site. The accompanying probability (p) for the slope is calculated based on the t-score of the regression. In a second method (“model subtraction”), we further subtract the deseasonalized modeled time series of VWM Hg concentrations from the observed deseasonalized time series before calculating the trend. We use our BASE simulation with constant anthropogenic emissions. In this manner, we take into account the influence of varying meteorological conditions, in particular precipitation, on observed VWM Hg concentrations. We thus expect the variability and trend of the residual after subtraction to be caused by changes in domestic anthropogenic emissions and/or in background Hg concentrations (including changes in natural sources and non-domestic anthropogenic sources). The model subtraction approach assumes that the model has no bias in precipitation, which as we will show below is generally the case. We do acknowledge that model errors in precipitation can introduce additional uncertainty in this model subtraction approach; however, we will demonstrate below that this approach leads to more consistent and statistically significant trends relative to the direct regression approach. To calculate the overall regional trend in Hg concentrations for multiple sites in a specific region (see next section for the four regions we use), we employed the random coefficient model with site as a random effect following Butler et al. [24]. We determine the significance of the trends by using p < 0.1 for the regressions at individual sites and p < 0.05 for the regional trends calculated with the random coefficient models.

3. Results and Discussion

3.1. Seasonal and Interannual Variability in Hg Wet Deposition
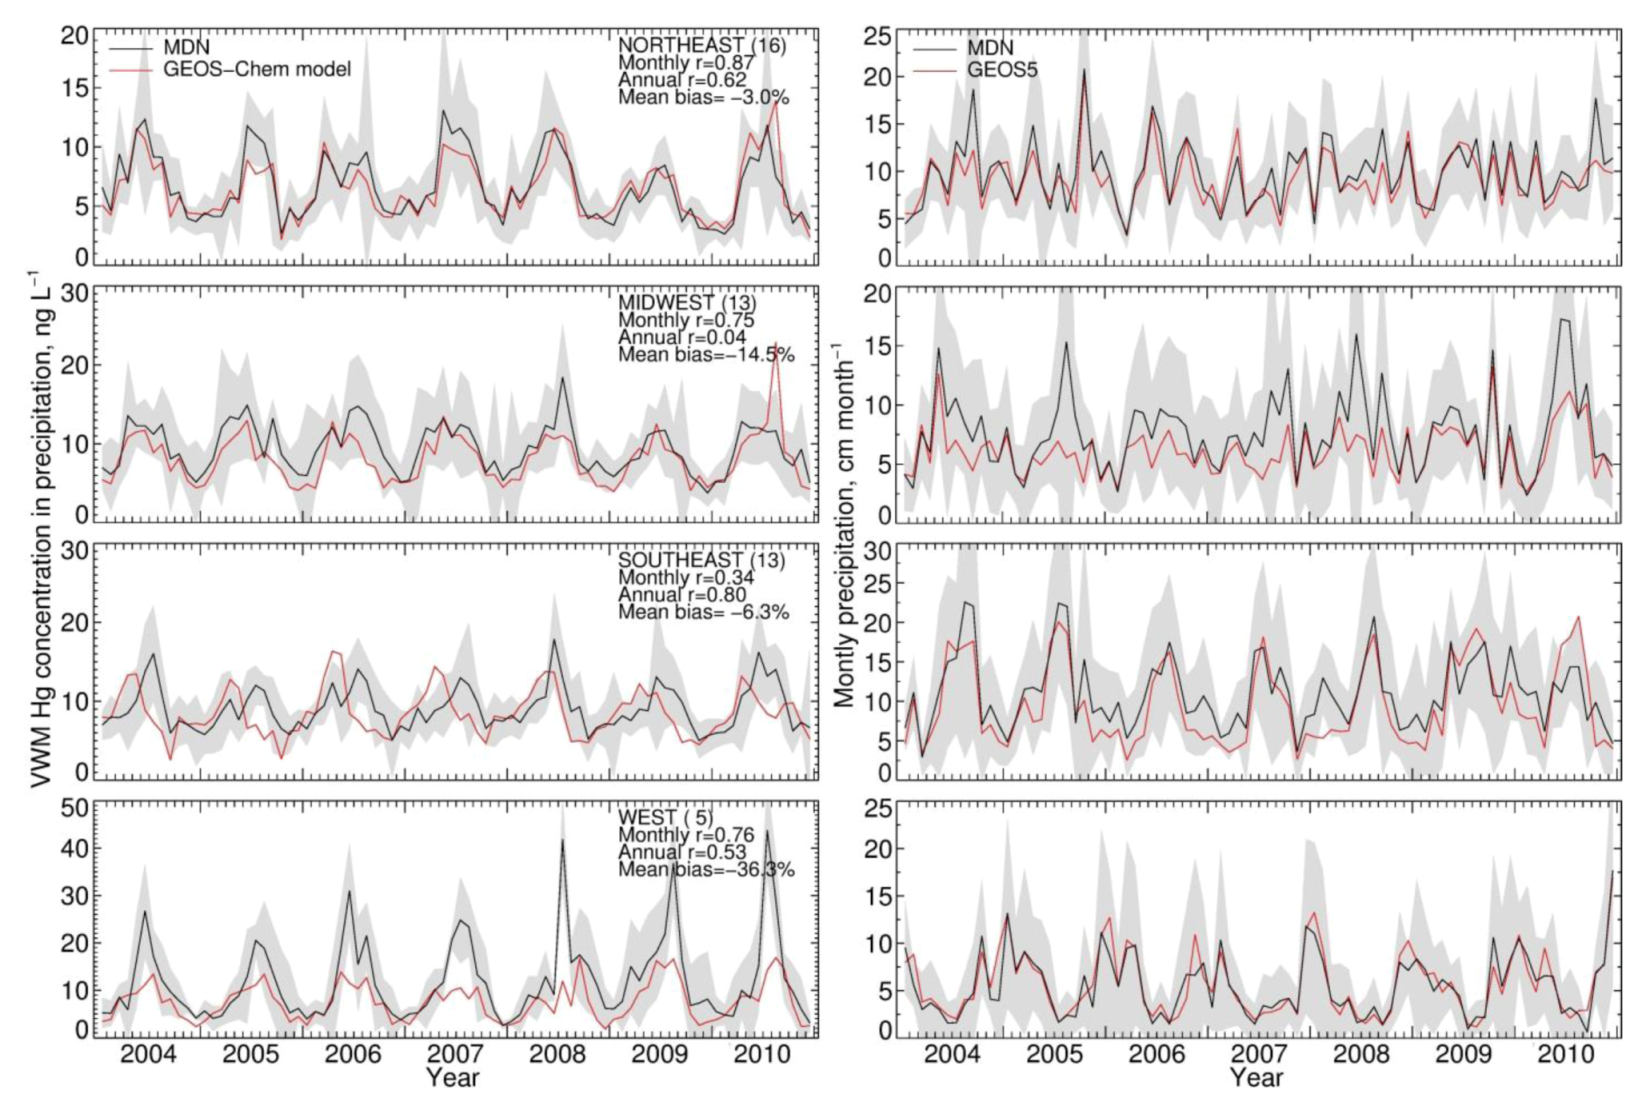
Figure 2 shows the observed monthly MDN VWM Hg concentrations in precipitation (left column) for 2004–2010. We aggregate observations at the 47 MDN sites into four regions: Northeast (16 sites), Midwest (13 sites), Southeast (13 sites) and West (five sites). Regional boundaries are defined in Figure 4. Hg concentrations in precipitation display a summer maximum and wintertime minimum. Summertime concentrations are larger than the wintertime concentrations by a factor of 2–3. This seasonality has been reported in many different studies [52,53,54,55] and reflects the stronger oxidation of Hg(0) to Hg(II) during summer, providing more Hg(II) for scavenging in rain [12,40]. The GEOS-Chem BASE simulation of VWM Hg concentration is within one standard deviation of MDN observations (Figure 2, left panels). The model shows a mean negative bias of −3.0% (Northeast), −15% (Midwest), −6.3% (Southeast) and −36% (West). The model negative bias in the West takes place in the summer, when there is little precipitation. The model captures the observed seasonal cycle, with temporal correlation coefficients (r) of 0.87 (Northeast), 0.75 (Midwest), 0.76 (West). In the Southeast region, we find a lower correlation (r = 0.34). This lower correlation in the Southeast is caused by a systematic model underestimate of the observed VWM Hg concentrations during summer, when convective scavenging from the free troposphere dominates wet deposition. We found previously [12] that this underestimate is likely the result of model errors in the height of convective precipitation. Compared to observations, the GEOS-5 precipitation fields used to drive the GEOS-Chem model have no bias over the Northeast and Southeast, but show a small underestimate of MDN precipitation over the Midwest (−17%) and an overestimate over West (+17%) (Figure 2, right panels). The r values for monthly precipitation depths are larger than 0.8 in each of our four regions.
Figure 2. Monthly volume-weighted mean (VWM) Hg concentrations in precipitation (left) and precipitation depths (right) from Mercury Deposition Network (MDN) observations and the GEOS-Chem BASE simulation (constant anthropogenic emissions) for 2004–2010. The grey shaded area shows the ± standard deviation envelope for the MDN observations.
Atmosphere 04 00113 g002
Observed annual VWM Hg concentrations display some interannual variations, with the range ( Atmosphere 04 00113 i002) varying from 20 to 40%. The coefficients of variance (ratios of standard deviation to the mean) are 12% (Northeast), 8% (Midwest), 5% (Southeast) and 12% (West). The MDN observed precipitation amounts also have significant interannual variability, with coefficients of variance of 5.0% (Northeast), 7% (Midwest), 12% (Southeast) and 20% (West). Although Hg concentrations in different years have similar seasonal patterns, the peak month and degree of seasonality can vary. For example, the West region displays much higher concentrations in August in 2008 and 2010 relative to other years. Over the Midwest, elevated Hg concentrations are measured during August 2006, 2008 and 2009, because of the relatively lower precipitation amount in these months, while the peak occurs earlier in other years. Lower Hg concentrations are observed during the summer of 2009 compared with multi-year mean in the Northeast and Midwest. The BASE simulation generally captures these features and has r values for observed and modeled annual VWM Hg concentrations of 0.54 (Northeast), 0.26 (Midwest), 0.73 (Southeast) and 0.29 (West). However, we find that the model tends to be on the high side of observations for the last three years and on the low side for the first three years, especially in the Northeast and Midwest. As we will show below, this indicates a trend in observed VWM Hg concentrations not captured by this BASE model simulation with constant anthropogenic emissions.
Table 2. Regional trends in VWM Hg concentration and precipitation depth.
RegionNumber
of Sites
VWM Hg Concentrations in PrecipitationPrecipitation Depth
(Observed)
Model SubtractionDirect Regression
% yr−1ns a% yr−1ns% yr−1ns
NORTHEAST16−4.1 ± 0.4913−3.8 ± 0.509+0.089 ± 0.263
MIDWEST13−2.7 ± 0.686−2.0 ± 0.644+0.69 ± 0.382
SOUTHEAST13−0.53 ± 0.594−0.36 ± 0.543−0.35 ± 0.326
WEST5+2.6 ± 1.53+4.0 ± 1.53+1.8 ± 0.681
Significant trends (p < 0.05) are indicated in bold fonts, trends that are insignificant are indicated in italics; a number of sites with significant trends (p < 0.1).

3.2. Trend in Hg Precipitation Concentrations for 2004–2010
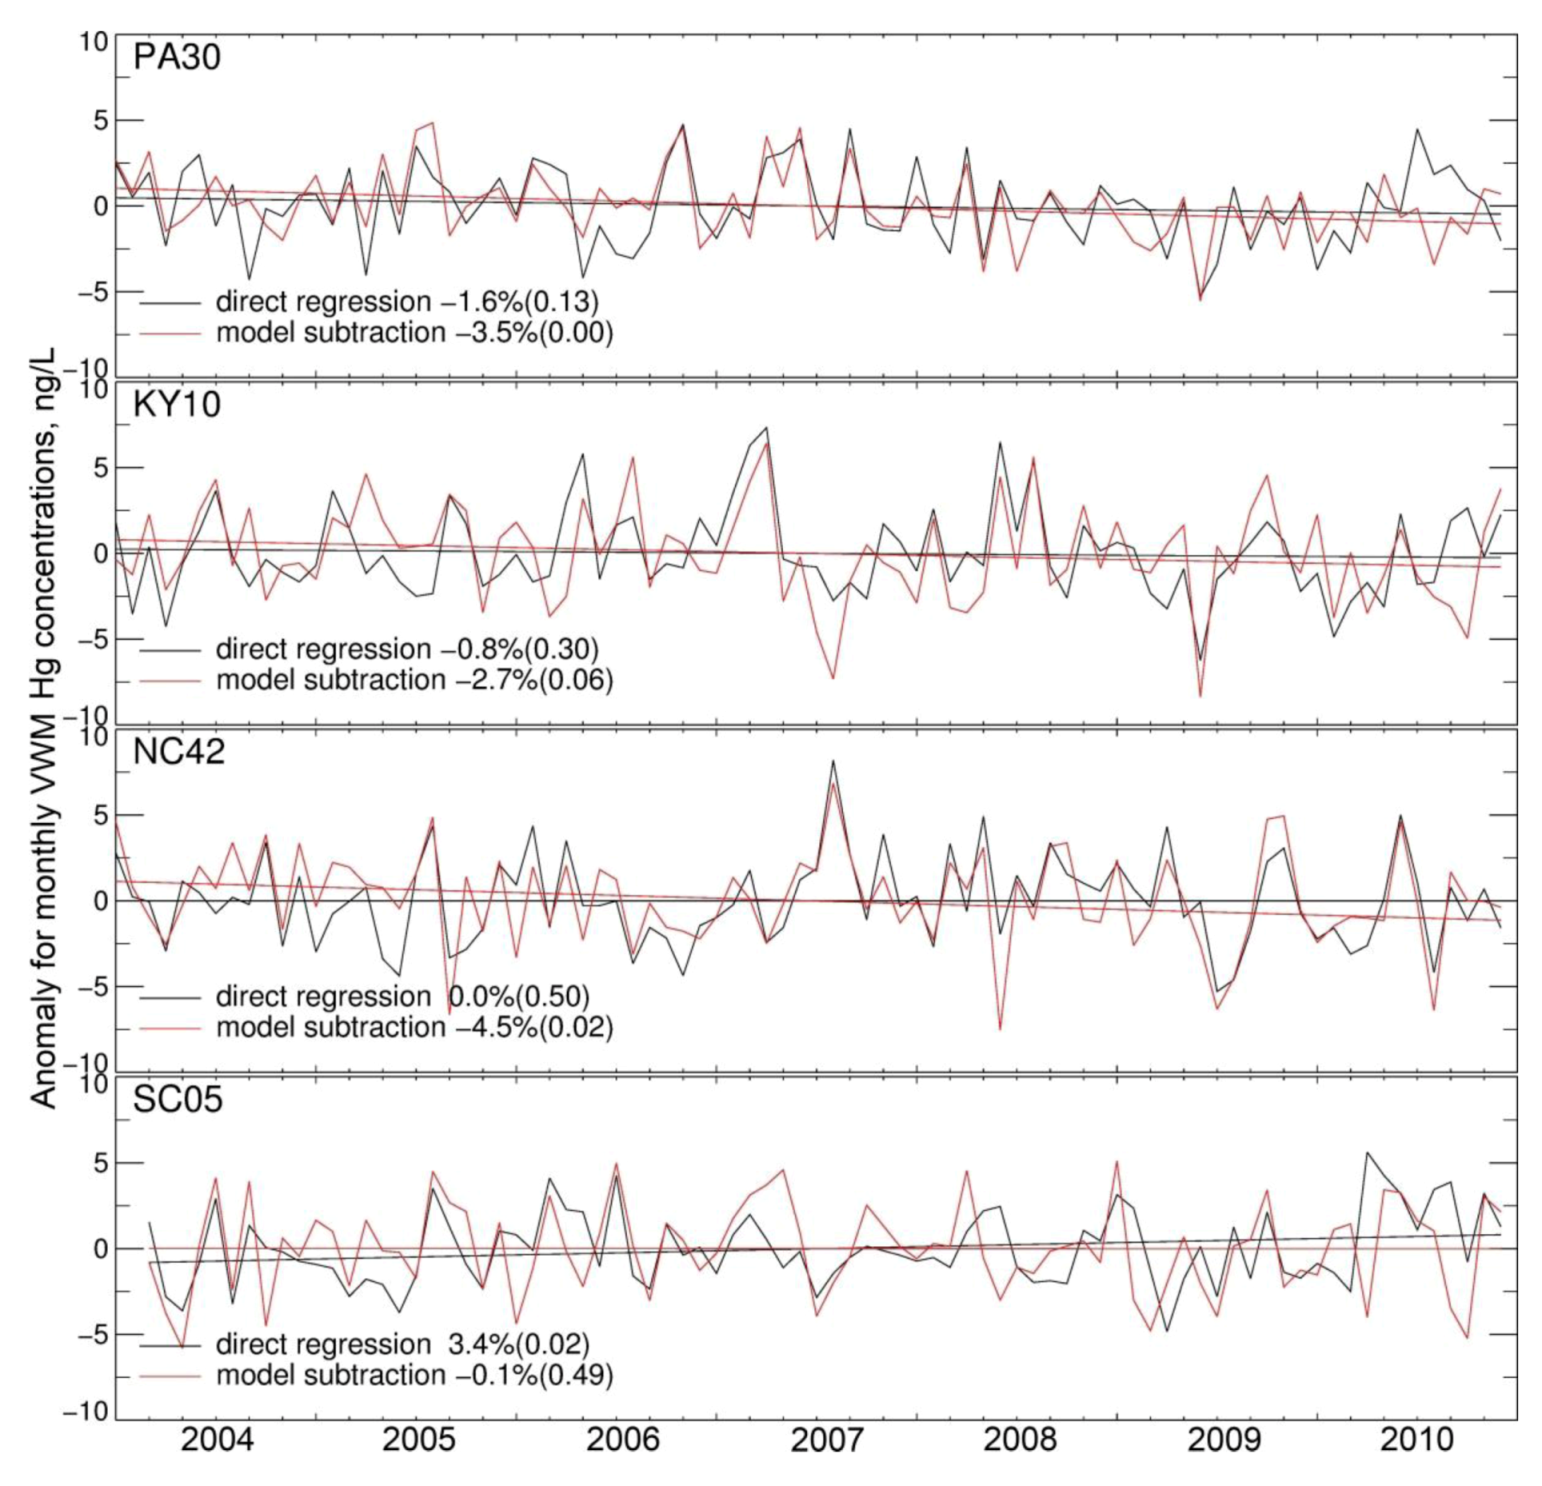
Compared to the direct regression method, we find that the model subtraction approach reduces the noise of the time series of Hg concentrations, because it removes the variability associated with changes in precipitation. The number of sites with significant trends (p < 0.1) increases from 19 for the direct regression approach to 26 for the model subtraction approach. The values of these trends at individual MDN sites are listed in Table S1. Table S1 also includes a comparison to the trends calculated with the direct regression approach, as well as trends in modeled Hg concentrations (BASE simulation) and in precipitation depths.
Figure 3 shows the deseasonalized time series of VWM Hg concentrations calculated with our two approaches at four MDN sites. At PA30 and KY10, the direct regression method yields trends of −1.64% yr−1 and −0.91% yr−1, respectively, which are not significant (p = 0.13 and 0.30). In contrast, the model subtraction approach results in stronger (−3.6% yr−1 and −2.9% yr−1) and more significant trends (p < 0.01 and p = 0.06). At these sites, it appears that changes in local precipitation (−2.1% yr−1 and −3.4% yr−1, Table S1) yield a positive trend in the VWM Hg concentrations calculated in the BASE model simulation (+2.0% yr−1 for both sites). At the NC42 site, the direct regression method yields no trend (0.01% yr−1, p = 0.50). However, a strong decrease of precipitation occurred during 2004–2010 (−7.1% yr−1, p = 0.02). The BASE model thus predicts a significant increasing trend of Hg concentration in precipitation (+4.8% yr−1, p < 0.01). By subtracting this trend, the model subtraction approach yields a significant negative trend at NC42 (−4.8% yr−1, p = 0.02). At SC05, although the direct regression approach yields a significant increasing trend in Hg concentration (+3.5% yr−1, p = 0.02), this trend appears to be caused by decreasing precipitation (−2.5% yr−1, p = 0.25). By taking this into account, the model subtraction approach results in no trend (−0.07% yr−1, p = 0.49). More generally, we find that at 28 sites out of the 47 MDN sites, the model subtraction method increases the absolute value of the trend and for almost all these 28 sites; the p-value of the trend is reduced (more significant trends).
Figure 3. Monthly deseasonalized time series of VWM Hg concentrations in precipitation for the direct regression method (black) and the model subtraction method (red). Four MDN sites are shown, from top to bottom: Erie site, Pennsylvania (PA30); Mammoth Cave National Park-Houchin Meadow, Kentucky (KY10); Pettigrew State Park, North Carolina (NC42) and Cape Romain National Wildlife Refuge, South Carolina (SC05). See Figure S1 for the location of these sites. The resulting trends, in % yr−1 and p-scores (in parenthesis) are indicated in the legend.
Atmosphere 04 00113 g003
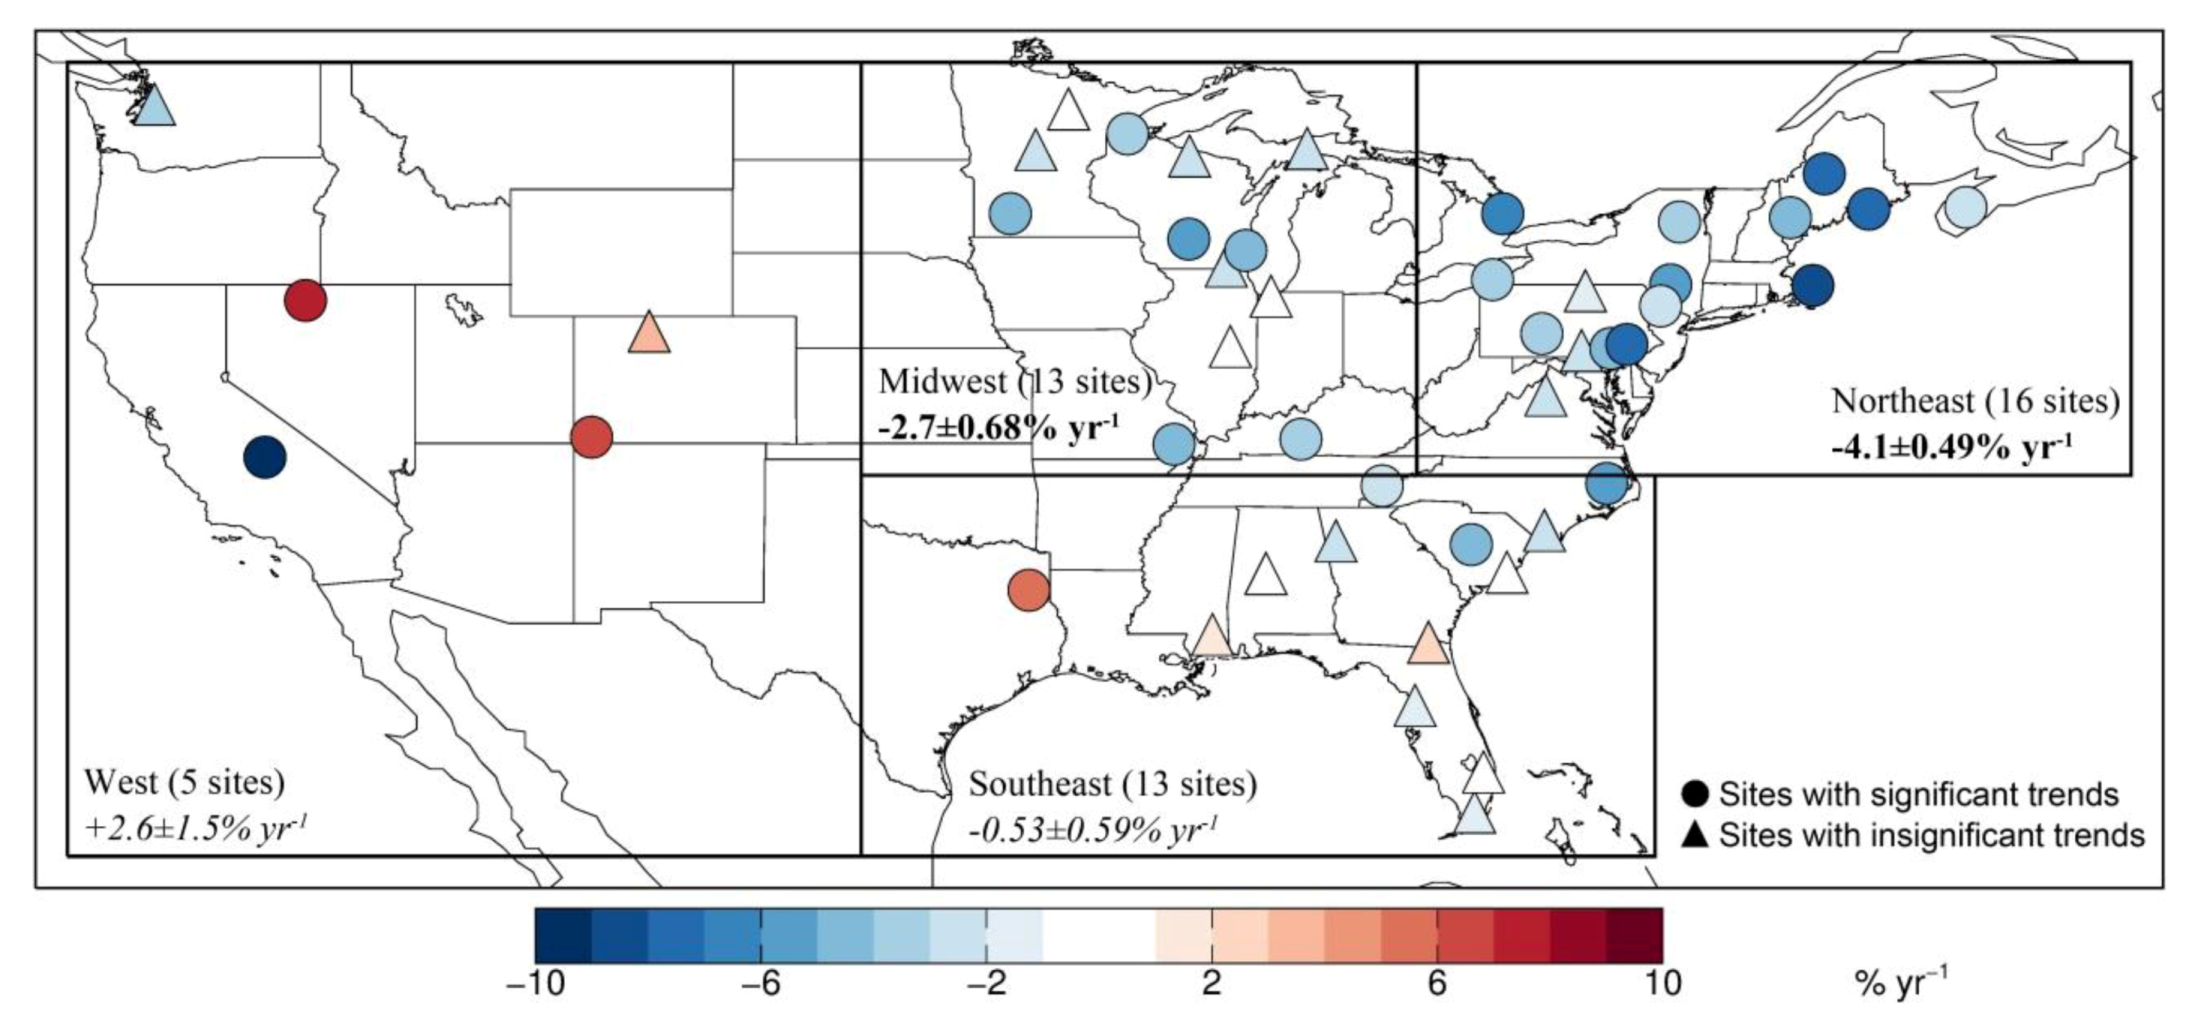
Figure 4 shows the spatial distribution of the regression trends (model subtraction method) in monthly VWM Hg concentrations for all 47 MDN sites. Sites with a significant trend (p < 0.1) are shown as colored circles (26 sites), while sites with insignificant trend are in triangles (21 sites). The fractions of sites with significant trends vary by region: Northeast (13 significant sites out of a total of 16), Midwest (six out of 13), Southeast (four out of 13) and West (three out of five). The mean trends for the sites in each region are summarized in Table 2. The result of random coefficient model indicates that the calculated trends for Northeast and Midwest are significant (p < 0.05), while the trends are not significant over the Southeast and West. Over the Northeast, the 13 sites with significant trends display trends ranging from −8% yr−1 to −2.4% yr−1 (Table S1). As the trend in precipitation is weak and non-significant (+0.089 ± 0.26% yr−1, p = 0.73), there is not much difference in the trend calculated with the model subtraction and direct regression methods for this region (Table 2). In the Midwest, the six significant sites display trends in VWM Hg concentrations ranging from −2.9% yr−1 to −4.8% yr−1. On the other hand, only three of 13 sites in the Southeast show significant negative trends, and those sites are located near the northern bound of this region. One site in Eastern Texas (Longview, TX 21) displays a significant increasing trend of nearly +5% yr−1. Most of the other sites with non-significant trends show neutral or slightly decreasing trends. Two of five sites in the West (CO99 in Colorado and NV02 in Nevada) show significant and strong increasing trends, while the sites in Washington (WA18) and California (CA75) show decreasing trends. The overall trend of all the 47 sites is −1.7 ± 0.36% yr−1 (p < 0.01), with large spatial variability.
Figure 4. Trend in monthly VWM Hg concentrations at 47 MDN sites during 2004–2010. Sites with significant trend (p < 0.1) are shown as circles, while sites where the trend is not significant are shown as triangles. The symbols are color-coded based on the magnitude of the trend (in % yr−1). We use the results of the model subtraction method to calculate the trends (see details in Section 2). The regional trends calculated by the random coefficient model (Northeast, Midwest, Southeast and West) are also shown, with significant trends (p < 0.05) shown in bold font and insignificant ones shown in italics.
Atmosphere 04 00113 g004
The precipitation shows a general increasing trend during 2004–2010 ranging from +0.089 ± 0.26% yr−1 (p = 0.73) (Northeast) to +1.8 ± 0.68% yr−1 (p = 0.065) (West), except in the Southeast, where it decreased (−0.35 ± 0.32% yr−1, p = 0.27). At most of the sites, these precipitation trends are not statistically significant, with only 12 sites (out of 47) displaying significant trends in precipitation depth. This overall positive trend in precipitation would cause a decrease in Hg concentration even without any change in Hg emissions. The Hg concentration trends calculated by direct regression approach are thus more difficult to interpret, because of the underlying trend in precipitation in these regions. Furthermore, the direct regression approach tends to miss the decreasing trend in Hg concentration if the precipitation trend is also decreasing, which would cause an increasing trend in Hg concentrations. For example, the direct regression approach predicts a weak decreasing trend of −0.36 ± 0.54% yr−1 over the Southeast region. Removing the decreasing trend of precipitation with the model subtraction approach brings the calculated trend down by ~50% to −0.53 ± 0.59% yr−1.
Over the Northeast, Butler et al. [24] calculated a trend of −1.7 ± 0.51% yr−1 during 1998–2005 by using random coefficient models with site as a random effect (Table 1). Prestbo and Gay [25] obtained similar trends in the Northeast (−2.1 ± 0.88% yr−1) during 1996–2005 by using a non-parametric statistic method. Compared with these previous studies, our trends over the Northeast for 2004–2010 are stronger (model subtraction approach: −4.1 ± 0.49% yr−1; direct regression: −3.8 ± 0.50% yr−1). Over the Midwest, our results (−2.7 ± 0.68% yr−1 and −2.0 ± 0.64%yr−1 for the two approaches) are comparable to previous studies, which ranged from −1.8% yr−1 to −3.5 %yr−1 (Table 1). Over the Southeast region, we found a weak and non-significant trend (−0.53 ± 0.59% yr−1) in Hg concentration during 2004–2010. Similar results are also obtained by previous studies focusing on the trend before 2005 and extending back for 8–10 years (Table 1). Prestbo and Gay [25] argued that the nearly steady Hg concentration in precipitation over the Southeast is because of the steady local emissions after an abrupt emission decrease by the closure or emission controlling of municipal and waste incinerators in the early 1990s. Butler et al. [24] attributed the steady Hg concentrations over Southeast region to the influence of global background Hg, which increased or remained constant during that time period. Butler et al. [24] also argued that higher halogen concentrations in the coastal environment in Southeast facilitate rapid transformation of Hg(0) from global pool to Hg(II), which can enhance Hg wet deposition.

3.3. Attribution of Observed Trends

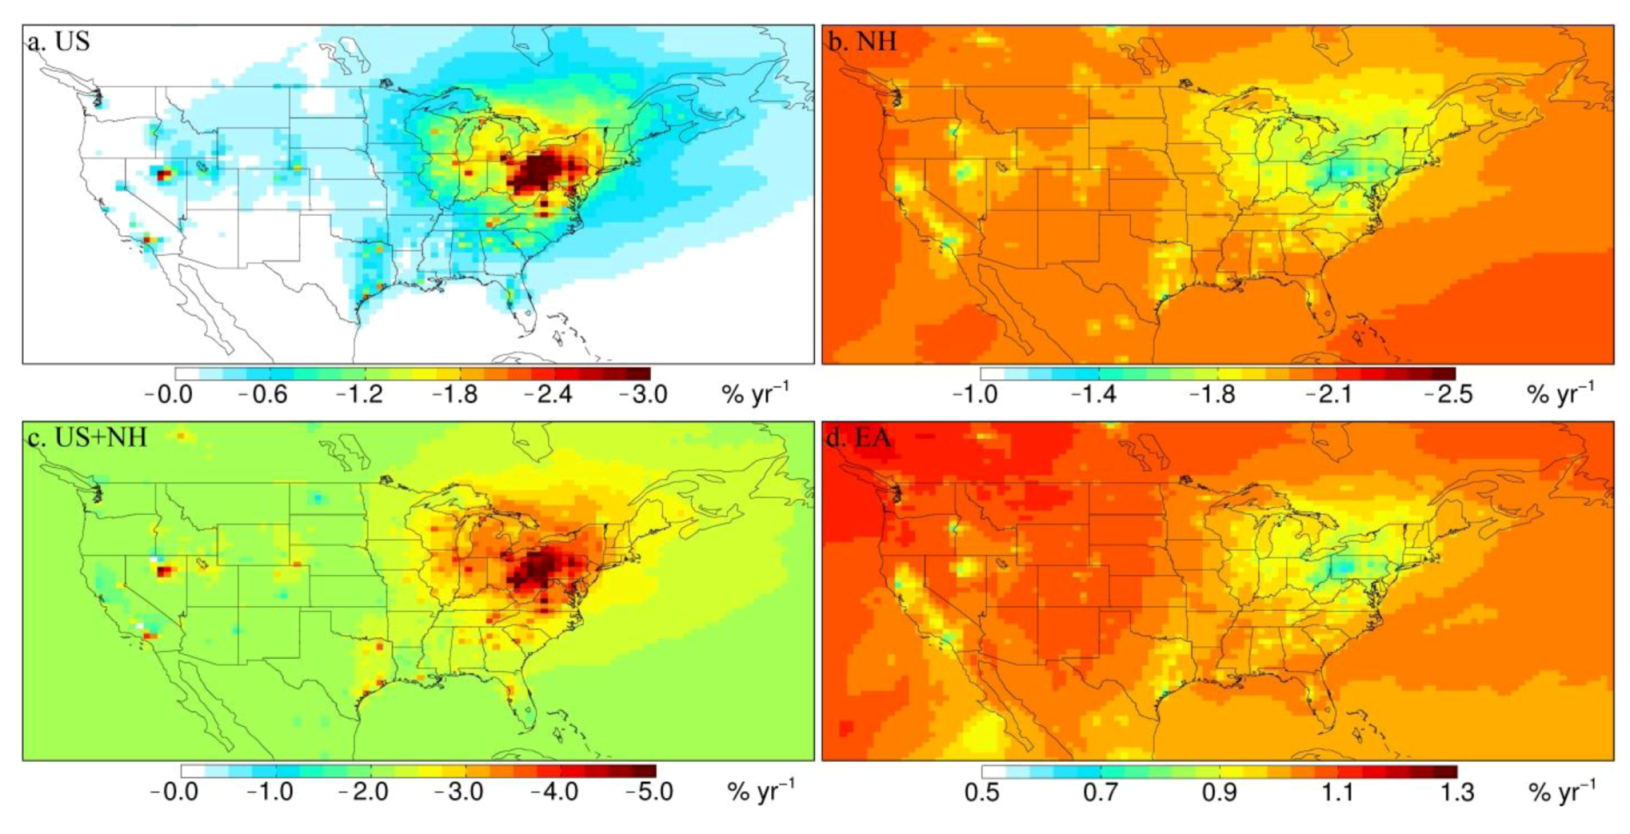
We examine here whether these observed trends can be explained by changes in emissions from domestic and global sources. Figure 5 shows the expected trends in VWM Hg concentrations for the four model simulations (see Section 2 for a description of each model simulation). The US simulation (Figure 5(a)) suggests a 2–4% yr−1 decrease in VWM Hg concentrations near source regions over the Ohio River Valley region. The largest modeled decrease occurs near the borders of Ohio, West Virginia and Pennsylvania (−6% yr−1). In the Southeast and Midwest regions the influence of decreasing domestic emissions is weaker and not as concentrated, with decreases ranging from −1% yr−1 to −2% yr−1 near point sources. The NH simulation (Figure 5(b)) displays uniform decreases in Hg concentrations across the US (1.7–2.0% yr−1). The decreases are somewhat larger in the West (−1.9 ± 0.80% yr−1) and Southeast (−1.9 ± 0.18% yr−1) and slightly smaller over the Northeast (−1.7 ± 0.1% yr−1) and Midwest (−1.7 ± 0.47% yr−1), where domestic emissions are more important. The EA simulation (Figure 5(d)) leads to a broad increase in Hg concentrations ranging from 1% yr−1 in the Northwest to 0.5% yr−1 in the Ohio River Valley region, with a factor of two for the west-to-east gradient. A similar gradient was modeled by Strode et al. [56] when evaluating the trans-Pacific transport of Asian Hg emissions. They found that the contribution of Asia to the Hg(II) total (dry + wet) deposition over the US ranged from more than 30% in the West to less than 15% in the Northeast. Note that the EA simulation is contained in the envelope of the NH simulation, i.e., the observed atmospheric North Hemispheric background Hg concentration decreases despite of the increase of emission over East Asia [3].
Figure 5. Calculated trends (% yr−1) in VWM Hg concentrations over the US for scenarios US, NH and EA, compared with the BASE simulation. (a) Trend for US scenario (45% reduction of Hg emissions from domestic sources); (b) trend for NH scenario (12% decrease of Hg background atmospheric concentrations); (c) combined US and NH scenarios; (d) trend for EA scenario (32% increase in Hg emissions from East Asia).
Atmosphere 04 00113 g005
Table 3 summarizes the results of the three simulations sampled at the locations of MDN sites in each region. The combined US and NH simulations (US + NH, see also Figure 5(c)) explain the magnitude of the observed decreasing trend over the Northeast (obs.: −4.1 ± 0.49% yr−1; model US + NH: −4.1 ± 0.52% yr−1) and Midwest (obs.: −2.7 ± 0.68% yr−1; model US + NH: −3.1 ± 0.60% yr−1) regions. We find that over the Northeast, decreases in domestic emissions account for 58% of the observed decrease, with the remaining 42% contributed by background Hg concentration decreases. Over the Midwest, the role of domestic emission reductions is slightly smaller, accounting for 46% of the decrease.
The US simulation predicts a decreasing trend of −0.55 ± 0.10% yr−1 over the Southeast, which is similar to the observed trend (−0.53 ± 0.59% yr−1). However, adding in the contribution from the NH simulation leads to a US + NH decreasing trend of −2.5 ± 0.21% yr−1, which is a factor of 4–5 higher than the observed trend. This suggests that atmospheric Hg concentrations over the free troposphere in this region may have remained nearly constant or decreased much more slowly compared to the trend over Mace Head (Table 1), which is located at a higher latitude (53°N). The three sites with significant decreasing trends in the Southeast region (in North Carolina, South Carolina and Tennessee) have the highest latitudes among sites in this region (Figure 4) and for these sites the results from the NH + US scenarios (−2.8 ± 0.26% yr−1) are more in line with observed trends (−3.5 ± 1.5% yr−1). This could indicate a latitudinal dependence of the trend in background concentrations. Our results are consistent with a recent model study by Soerensen et al. [36]. They show that the decreasing trend of surface atmospheric Hg(0) concentrations due to the decrease in subsurface ocean Hg concentrations over the North Atlantic is 2–3 times higher over Mace Head than over the southeast US Thus, our assumption of uniformly decreasing background TGM concentrations for the NH scenario overestimates the trend over lower latitudes.
Table 3. Comparison between observed regional trends in VWM Hg concentrations (model subtraction approach) and three model simulations assuming changing emissions or background conditions.
ObservationsModel Scenarios
Regionn USaNHbUS+NHEAc
% yr−1% yr−1% yr−1% yr−1% yr−1
NORTHEAST16−4.1 ± 0.49d−2.4 ± 0.51−1.7 ± 0.10−4.1 ± 0.520.84 ± 0.048
MIDWEST13−2.7 ± 0.68−1.4 ± 0.38−1.7 ± 0.47−3.1 ± 0.600.89 ± 0.22
SOUTHEAST130.53 ± 0.590.55 ± 0.10−1.9 ± 0.18−2.5 ± 0.210.92 ± 0.086
WEST5+2.6 ± 1.5+0.068 ± 0.191.9 ± 0.801.8 ± 0.821.0 ± 0.41
Significant trends (p < 0.05) are indicated in bold fonts, trends that are insignificant are indicated in italics. a Simulation assuming a 45% decrease in anthropogenic emissions over the US between 2004–2010; b simulation assuming a 12% decrease in Northern Hemisphere background TGM concentrations during 2004–2010; c simulation assuming a 32% increase in anthropogenic Hg emission from East Asia during 2004–2010; d mean ± standard error of trends at MDN sites.
For the West region, although the US + NH scenarios show decreasing trends (−1.8 ± 0.82% yr−1), the observed trend is positive (+2.6 ± 1.5%) with extremely large variations among sites. Our first hypothesis for this increasing trend is that it is caused by the recent increase of East Asian emissions. The EA scenario predicts an increasing trend over the whole US, as well as a west-to-east gradient (+1.0 ± 0.41% yr−1 in West vs. +0.84 ± 0.048% yr−1 in Northeast), but this gradient is not strong enough to explain the observed unique positive trend in the West region. Prestbo and Gay [25] also failed to detect the influence of Asian emissions after analyzing the Hg deposition flux and concentration data in precipitation observed at the MDN site WA18 located in Seattle, which is thought to be distant from large domestic Hg sources. We find similar results, with a non-significant trend of −0.23% yr−1 at WA18 for 2004–2010. We have also evaluated the trend of springtime GEM concentrations observed at the Mount Bachelor Observatory (MBO) Oregon (44°N, 122°W, 2,700 m above sea level) during 2005–2009 (Jaffe, unpublished data) and found no significant trend. Considering the small number of sites in this region, as well as the large spatial variation, the trend at individual sites is likely influenced by local emissions and high variability in precipitation. For example, the site CO99 at Mesa Verde National Park, Colorado, near the Four Corners region shows an increasing trend of +6.4% yr−1. A closer look at the weekly deposition flux at this site shows that the strong trend is caused by several strong episodic large deposition events occurring in the summers of 2009 and 2010. Wright and Nydick [57] evaluated these events by back trajectories and high-resolution dispersion modeling and found them to be due to transport of local CFPP emissions. Thus, more observations in the West, especially background sites without strong local source influence, are needed to evaluate the trend of Hg wet deposition over this region.

4. Conclusions

We calculated 2004–2010 trends in VWM Hg concentrations in precipitation at 47 Mercury Deposition Network (MDN) sites across the United States. We used the GEOS-Chem nested-grid mercury simulation to take into account the influence of meteorology on observed trends and to assess the role of domestic emission reductions in explaining the trends. The GEOS-Chem model agrees relatively well with the observed VWM Hg concentrations in precipitation, with negative bias of −3.0% (Northeast), −15% (Midwest), 6.3% (Southeast) and 36% (West). The model captures the observed seasonal cycle and interannual variability.
We removed the effect of meteorological changes on VWM Hg concentrations by subtracting from the observed monthly observations results from the GEOS-Chem model simulation with constant anthropogenic emissions. The trend associated with the remaining part is independent from meteorological fluctuations and can be directly associated with local and/or global background emission changes. We demonstrated that this approach yields more robust and consistent results than directly calculating the trend from MDN observations. We found regional mean trends for VWM Hg concentrations at MDN sites during 2004–2010 of 4.1% ± 0.49 yr−1 (Northeast), 2.7 ± 0.68% yr−1 (Midwest), 0.53 ± 0.59% yr−1 (Southeast) and +2.6 ± 1.5% yr−1 (West). Over the Northeast, 13 out of 16 sites have significant trends, while over the Midwest six out of 13 sites have significant trends. By applying a random coefficient model for the overall trend each region, we find that trends over both the Northeast and Midwest are significant (p < 0.05), with overall decreases of 25 ± 2.9% (Northeast), 16 ± 4.1% (Midwest) for 2004–2010. The trends over the Southeast and West regions are not significant because of the smaller numbers of sites with significant trends: four out of 13 in Southeast and three out of five for the West.
We conducted sensitivity simulations for three separate scenarios: a 45% decrease in domestic emissions (US), a 12% decrease in global boundary condition of atmospheric Hg concentrations (NH) and a 32% increase in East Asian anthropogenic Hg emissions (EA). The US simulation predicts a decrease in VWM Hg concentrations in the Northeast (2.4 ± 0.51% yr−1), as well as in the Midwest (1.4 ± 0.38% yr−1) and Southeast (0.55 ± 0.10% yr−1). The NH scenario displays large decreases in the West (1.9 ± 0.80% yr−1) and Southeast (1.9 ± 0.18% yr−1) and somewhat smaller decreases over Northeast (1.7 ± 0.10% yr−1) and Midwest (1.7 ± 0.47% yr−1). The EA simulation generates a nationwide increase in Hg wet deposition ranging from ~1.0% yr−1 in the West to ~0.5% yr−1 over the Ohio River Valley region.
We found that the combined US and NH simulations explains most of the observed decreasing trend over the Northeast (model US + NH: 4.1 ± 0.52% yr−1; MDN: 4.1 ± 0.49% yr−1) and Midwest (model US + NH: 3.1 ± 0.60% yr−1; MDN: 2.7 ± 0.68% yr−1). The model predicts that domestic emission reductions account for 58% of the decreasing trend in the Northeast and 46% of the trend in the Midwest. The US simulation predicts a decreasing trend of 0.55 ± 0.10% yr−1 over the Southeast, which is similar to the observed trend (0.53 ± 0.59% yr−1). However, adding the effect of decreasing background concentrations (US + NH simulation) resulted in an overestimate of the observed trend by a factor of 4–5 over the Southeast region. For three sites, located at the northern edge of the Southeast region, the US + NH simulation agrees with the observed trends. This suggests that the trend in background concentration might have a latitudinal dependence, with weaker decreases at southern latitudes. Our NH simulation might thus be overestimating the changes due to background emissions. For the West region, although the observed trend is positive (+2.6 ± 1.5%), the US + NH scenarios show decreasing trends (1.8 ± 0.82% yr−1). Considering the small number of sites in this region, more observations, especially background sites away from strong local source influence, are needed to evaluate the trend of Hg concentrations in precipitation over this region.
By combining our analysis of MDN observations and the GEOS-Chem simulations, we thus find that 58% of the observed 25% decrease in VWM Hg concentration over the Northeast for 2004–2010 can be explained by reductions in domestic Hg emissions, with the remaining 42% due to decreasing background concentrations. Over the Midwest, our model simulation suggests that 46% of the observed 16% decrease is explained by domestic emission reductions. In Zhang et al. [12], we found that domestic Hg emissions contributed to 16% of wet deposition over the Northeast in 2005. Between 2005 and 2010, domestic emissions have decreased by 60% over that region and thus now account for only 8.3% of wet deposition. Further domestic Hg emissions decreases are expected as part of the 2011 Mercury and Air Toxics Standards (MATS). While implementation of MATS will lead to significant decreases in local Hg wet deposition directly downwind of the sources, the regional influence of these decreases is likely to be small and more difficult to detect. We expect that future regional trends in wet deposition in the US will be strongly influenced by changes in background Hg concentrations.

Acknowledgments

This work was supported by funding from EPRI under contract EP-P43461/C18853. We thank EPRI program manager Leonard Levin for his support during this study. We are grateful to Dan Jaffe for his comments on this study. We would like to acknowledge and thank all the site operators for the NADP/MDN network.

Conflict of Interest

The authors declare no conflict of interest.

References and Notes

  1. The Original List of Hazardous Air Pollutants. Available online: http://www.epa.gov/ttn/atw/188polls.html (accessed on 13 March 2013).
  2. Mason, R.A. Mercury Emissions from Natural Processes and their Importance in the Global Mercury Cycle. In Mercury Fate and Transport in the Global Atmosphere: Emissions, Measurements and Models; Pirrone, N., Mason, R.A., Eds.; Springer: Dordrecht, The Netherlands, 2009; pp. 173–191. [Google Scholar]
  3. Streets, D.G.; Devane, M.K.; Lu, Z.; Bond, T.C.; Sunderland, E.M.; Jacob, D.J. All-time releases of mercury to the atmosphere from human activities. Environ. Sci. Technol. 2011, 45, 10485–10491. [Google Scholar]
  4. Pirrone, N.; Cinnirella, S.; Feng, X.; Finkelman, R.B.; Friedli, H.R.; Learner, J.; Mason, R.; Mukherjee, A.B.; Stracher, G.; Streets, D.G.; Telmer, K. Global mercury emissions to the atmosphere from natural and anthropogenic sources. In Mercury Fate and Transport in the Global Atmosphere: Emissions, Measurements and Models; Pirrone, N., Mason, R.A., Eds.; Springer: Dordrecht, The Netherlands, 2009; pp. 3–50. [Google Scholar]
  5. Selin, N.E. Global biogeochemical cycling of mercury: A review. Annu. Rev. Environ. Resour. 2009, 34, 43–63. [Google Scholar] [CrossRef]
  6. Holmes, C.D.; Jacob, D.J.; Yang, X. Global lifetime of elemental mercury against oxidation by atomic bromine in the free troposphere. Geophys. Res. Lett. 2009, 33, L20808. [Google Scholar] [CrossRef]
  7. Clarkson, T.W. The three modern faces of mercury. Environ. Health Perspect. 2002, 110, 11–23. [Google Scholar] [CrossRef]
  8. Mergler, D.; Anderson, H.A.; Chan, L.H.M.; Mahaffey, K.R.; Murray, M.; Sakamoto, M.; Stern, A.H. Methylmercury exposure and health effects in humans: A worldwide concern. Ambio 2007, 36, 3–11. [Google Scholar] [CrossRef]
  9. Houyoux, M.; Strum, M. Memorandum: Emissions Overview: Hazardous Air Pollutants in Support of the Final Mercury and Air Toxics Standard; EPA-454/R-11-014; Emission Inventory and Analysis Group Air Quality Assessment Division: Research Triangle Park, NC, USA, 2011. [Google Scholar]
  10. Seigneur, C.; Vijayaraghavan, K.; Lohman, K.; Karamchandani, P.; Scott, C. Global source attribution for mercury deposition in the United States. Environ. Sci. Technol. 2004, 38, 555–569. [Google Scholar] [CrossRef]
  11. Selin, N.E.; Jacob, D.J. Seasonal and spatial patterns of mercury wet deposition in the United States: Constraints on the contribution from North American anthropogenic sources. Atmos. Environ. 2008, 42, 5193–5204. [Google Scholar] [CrossRef]
  12. Zhang, Y.; Jaeglé, L.; van Donkelaar, A.; Martin, R.V.; Holmes, C.D.; Amos, H.M.; Wang, Q.; Talbot, R.; Artz, R.; Brooks, S.; et al. Nested-grid simulation of mercury over North America. Atmos. Chem. Phys. 2012, 12, 6095–6111. [Google Scholar] [CrossRef]
  13. Edgerton, E.S.; Hartsell, B.E.; Jansen, J.J. Mercury speciation in coal-fired power plant plumes observed at three surface sites in the southeastern US. Environ. Sci. Technol. 2006, 40, 4563–4570. [Google Scholar] [CrossRef]
  14. Weiss-Penzias, P.S.; Gustin, M.S.; Lyman, S.N. Sources of gaseous oxidized mercury and mercury dry deposition at two southeastern U.S. sites. Atmos. Environ. 2011, 45, 4569–4579. [Google Scholar] [CrossRef]
  15. Toxics Release Inventory. Available online: http://www.epa.gov/tri/ (accessed on 13 March 2013).
  16. National Toxics Inventory. Available online: http://epa.gov/air/data/netemis.html (accessed on 13 March 2013).
  17. National Emission Inventory. Available online: http://www.epa.gov/ttn/chief/net/2008inventory.html (accessed on 13 March 2013).
  18. Solid Waste Combustion Rule. Available online: http://www.epa.gov/airtoxics/129/gil2.pdf (accessed on 13 March 2013).
  19. Clean Air Mercury Rule. Available online: http://www.epa.gov/camr/ (accessed on 13 March 2013).
  20. Information Collection Request. Available online: http://www.epa.gov/ttn/atw/utility/utilitypg.html (accessed on 13 March 2013).
  21. Mercury and Air Toxics Standard. Available online: http://www.epa.gov/mats (accessed on 13 March 2013).
  22. Integrated Planning Model. Available online: http://www.epa.gov/airmarkets/progsregs/epa-ipm/index.html (accessed on 13 March 2013).
  23. USEPA, Emissions Inventory and Emissions Processing for the Clean Air Mercury Rule (CAMR); Office of Air Quality Planning and Standards Emissions, Monitoring and Analysis Division: Research Triangle Park, NC, USA, 2005.
  24. Butler, T.J.; Cohen, M.D.; Vermeylen, F.M.; Likens, G.E.; Schmeltz, D.; Artz, R.S. Regional precipitation mercury trends in the eastern USA, 1998–2005: Declines in the Northeast and Midwest, no trend in the Southeast. Atmos. Environ. 2008, 42, 1582–1592. [Google Scholar] [CrossRef]
  25. Prestbo, E.M.; Gay, D.A. Wet deposition of mercury in the US and Canada, 1996–2005: Results and analysis of the NADP mercury deposition network (MDN). Atmos. Environ. 2009, 43, 4223–4233. [Google Scholar] [CrossRef]
  26. Risch, M.R.; Gay, D.A.; Fowler, K.K.; Keeler, G.J.; Backus, S.M.; Blanchard, P.; Barres, J.A.; Dvonch, J.T. Spatial patterns and temporal trends in mercury concentrations, precipitation depths, and mercury wet deposition in the North American Great Lakes region, 2002–2008. Environ. Pollut. 2012, 161, 261–271. [Google Scholar] [CrossRef]
  27. Gratz, L.E.; Keeler, G.J.; Miller, E.K. Long-term relationships between mercury wet deposition and meteorology. Atmos. Environ. 2009, 43, 6218–6229. [Google Scholar] [CrossRef]
  28. Vijayaraghavan, K.; Stoeckenius, T.; Ma, L.; Yarwood, G.; Morris, R.; Levin, L. Analysis of Temporal Trends in Mercury Emissions and Deposition in Florida. In Proceedings of the 10th International Conference on Mercury as Global Pollutant, Halifax, NS, Canada, August 2011.
  29. Landis, M.S.; Vette, A.F.; Keeler, G.J. Atmospheric mercury in the Lake Michigan Basin: influence of the Chicago/Gary urban area. Environ. Sci. Technol. 2002, 36, 4508–4517. [Google Scholar] [CrossRef]
  30. Wu, Y.; Wang, S.; Streets, D.G.; Hao, J.; Chan, M.; Jiang, J. Trends in Anthropogenic Mercury Emissions in China from 1995 to 2003. Environ. Sci. Technol. 2006, 40, 5312–5318. [Google Scholar] [CrossRef]
  31. Streets, D.G.; Zhang, Q.; Wu, Y. Projections of Global Mercury Emissions in 2050. Environ. Sci. Technol. 2009, 43, 2983–2988. [Google Scholar] [CrossRef]
  32. Tian, H.; Wang, Y.; Xue, Z.; Qu, Y.; Chai, F.; Hao, J. Atmospheric emissions estimation of Hg, As, and Se from coal-fired power plants in China, 2007. Sci. Total Environ. 2011, 409, 3078–3081. [Google Scholar] [CrossRef]
  33. Temme, C.; Blanchard, P.; Steffen, A.; Banic, C.; Beauchamp, S.; Poissant, L.; Tordon, R.; Wiens, B. Trend, seasonal and multivariate analysis study of total gaseous mercury data from the Canadian atmospheric mercury measurement network (CAMNet). Atmos. Environ. 2007, 41, 5423–5441. [Google Scholar] [CrossRef]
  34. Cole, A.S.; Steffen, A.; Pfaffhuber, K.A.; Berg, T.; Pilote, M.; Poissant, L.; Tordon, R.; Hung, H. Ten-year trends of atmospheric mercury in the high Arctic compared to Canadian sub-Arctic and mid-latitude sites. Atmos. Chem. Phys. 2013, 13, 1535–1545. [Google Scholar] [CrossRef] [Green Version]
  35. Slemr, F.; Brunke, E.G.; Ebinghaus, R.; Kuss, J. Worldwide trend of atmospheric mercury since 1995. Atmos. Chem. Phys. 2011, 11, 4779–4787. [Google Scholar] [CrossRef]
  36. Soerensen, A.L.; Jacob, D.J.; Streets, D.G.; Witt, M.L.I.; Ebinghaus, R.; Mason, R.P.; Andersson, M.; Sunderland, E.M. Multi-decadal decline of mercury in the North Atlantic atmosphere explained by changing subsurface seawater concentrations. Geophys. Res. Lett. 2012, 39, L21810. [Google Scholar]
  37. National Atmospheric Deposition Program, Mercury Deposition Network Information. Available online: http://nadp.sws.uiuc.edu/mdn/ (accessed on 13 March 2013).
  38. Bey, I.; Jacob, D.J.; Yantosca, R.M.; Logan, J.A.; Field, B.D.; Fiore, A. M.; Li, Q.B.; Liu, H.G.Y.; Mickley, L.J.; Schultz, M.G. Global modeling of tropospheric chemistry with assimilated meteorology: Model description and evaluation. J. Geophys. Res.-Atmos. 2001, 106, 23073–23095. [Google Scholar] [CrossRef]
  39. Selin, N.E.; Jacob, D.J.; Park, R.J.; Yantosca, R.M.; Strode, S.; Jaegle, L.; Jaffe, D. Chemical cycling and deposition of atmospheric mercury: Global constraints from observations. J. Geophys. Res. 2007, 112, D02308. [Google Scholar]
  40. Holmes, C.D.; Jacob, D.J.; Corbitt, E.S.; Mao, J.; Yang, X.; Talbot, R.; Slemr, F. Global atmospheric model for mercury including oxidation by bromine atoms. Atmos. Chem. Phys. 2010, 10, 12037–12057. [Google Scholar] [CrossRef]
  41. Amos, H.M.; Jacob, D.J.; Holmes, C.D.; Fisher, J.A.; Wang, Q.; Yantosca, R.M.; Corbitt, E.S.; Galarneau, E.; Rutter, A.P.; Gustin, M.S.; et al. Gas-particle partitioning of atmospheric Hg(II) and its effect on global mercury deposition. Atmos. Chem. Phys. 2012, 12, 591–603. [Google Scholar] [CrossRef]
  42. Donohoue, D.L.; Bauer, D.; Cossairt, B.; Hynes, A.J. Temperature and pressure dependent rate coefficients for the reaction of Hg with Br and the reaction of Br with Br: A pulsed laser photolysis-pulsed laser induced fluorescence study. J. Phys. Chem. A 2006, 110, 6623–6632. [Google Scholar]
  43. Goodsite, M.E.; Plane, J.M.C.; Skov, H. A theoretical study of the oxidation of Hg0 to HgBr2 in the troposphere. Environ. Sci. Technol. 2004, 38, 1772–1776. [Google Scholar] [CrossRef]
  44. Balabanov, N.B.; Shepler, B.C.; Peterson, K.A. Accurate global potential energy surface and reaction dynamics for the ground state of HgBr2. J. Phys. Chem. A 2005, 109, 8765–8773. [Google Scholar]
  45. Pacyna, E.G.; Pacyna, J.M.; Sundseth, K.; Munthe, J.; KinNHom, K.; Wilson, S.; Steenhuisen, F.; Maxson, P. Global emission of mercury to the atmosphere from anthropogenic sources in 2005 and projections to 2020. Atmos. Environ. 2010, 44, 2487–2499. [Google Scholar] [CrossRef]
  46. National Pollutant Release Inventory. Available online: http://www.ec.gc.ca/inrp-npri/ (accessed on 13 March 2013).
  47. Soerensen, A.L.; Sunderland, E.M.; Holmes, C.D.; Jacob, D.J.; Yantosca, R.M.; Skov, H.; Christensen, J.H.; Strode, S.A.; Mason, R.P. An Improved Global Model for Air-Sea Exchange of Mercury: High Concentrations over the North Atlantic. Environ. Sci. Technol. 2010, 44, 8574–8580. [Google Scholar]
  48. Liu, H.; Jacob, D.; Bey, I.; Yantosca, R.M. Constraints from Pb210 and Be7 on wet deposition and transport in a global three-dimensional chemical tracer model driven by assimilated meteorological fields. J. Geophys. Res. 2001, 106, 12109–12128. [Google Scholar]
  49. Wang, Q.; Jacob, D.J.; Fisher, J.A.; Mao, J.; Leibensperger, E.M.; Carouge, C.C.; Le Sager, P.; Kondo, Y.; Jimenez, J.L.; Cubison, M.J.; Doherty, S.J. Sources of carbonaceous aerosols and deposited black carbon in the Arctic in winter-spring: implications for radiative forcing. Atmos. Chem. Phys. 2011, 11, 12453–12473. [Google Scholar]
  50. Wesely, M.L. Parameterization of surface resistances to gaseous dry deposition in regional-scale numerical-models. Atmos. Environ. 1989, 23, 1293–1304. [Google Scholar]
  51. Holmes, C.D.; Jacob, D.J.; Mason, R.P.; Jaffe, D.A. Sources and deposition of reactive gaseous mercury in the marine atmosphere. Atmos. Environ. 2009, 43, 2278–2285. [Google Scholar]
  52. Guentzel, J.L.; Landing, W.M.; Gill, G.A.; Pollman, C.D. Processes influencing rainfall deposition of mercury in Florida: The FAMS Project (1992–1996). Environ. Sci. Technol. 2001, 35, 863–873. [Google Scholar] [CrossRef]
  53. Hoyer, M.; Burke, J.; Keeler, G.J. Atmospheric sources, transport and deposition of mercury in Michigan: two years if event precipitation. Water Air Soil Pollut. 1995, 80, 199–208. [Google Scholar] [CrossRef]
  54. Landis, M.S.; Keeler, G.J. Atmospheric Mercury Deposition to Lake Michigan during the Lake Michigan Mass Balance Study. Environ. Sci. Technol. 2002, 36, 4518–4524. [Google Scholar] [CrossRef]
  55. Dvonch, J.T.; Keeler, G.J.; Marsik, F.J. The influence of meteorological conditions on the wet deposition of mercury in southern Florida. J. Appl. Meteorol. 2005, 44, 1421–1435. [Google Scholar] [CrossRef]
  56. Strode, S.A.; Jaeglé, L.; Jaffe, D.A.; Swartzendruber, P.C.; Selin, N.E.; Holmes, C.; Yantosca, R.M. Trans-Pacific transport of mercury. J. Geophys. Res. 2008, 113, D15305. [Google Scholar] [CrossRef]
  57. Wright, W.G.; Nydick, K. Sources of Atmospheric Mercury Concentrations and Wet Deposition at Mesa Verde National Park, Southwestern Colorado, 2002–08; Mountain Studies Institute Report: Silverton, CO, USA, 2010. [Google Scholar]