1. Introduction
Tropical cyclone (TC) track forecasts directly affect estimates of landfall location, the spatial extent of hazards, and disaster-preparedness decisions. Over recent decades, advances in observing systems, data assimilation, and numerical weather prediction have substantially improved TC track forecasts over the western North Pacific and extended useful forecast lead times [
1,
2]. Nevertheless, TC tracks remain difficult to predict under complex circulation regimes, and numerical models can still produce substantially different solutions [
3]. Track predictability is closely related to the quality of the forecast environmental steering flow; the relatively low steering-flow forecast skill over the western North Pacific remains an important constraint on track prediction [
4].
TC motion is governed primarily by the environmental steering flow, with additional contributions from beta drift, environmental potential-vorticity (PV) anomalies, asymmetric vortex structure, and diabatic processes [
5]. Under weak environmental steering, the relative contributions of vortex asymmetries, convective feedbacks, and initial-condition uncertainty increase, and ensemble members may separate rapidly [
6]. Recurvature and unusual track changes can also arise from changes in deep-layer steering and interactions with anomalous environmental circulation systems [
7,
8,
9]. Thus, diagnosing track errors requires not only an examination of the local vortex structure but also a quantitative assessment of the surrounding environmental flow and its vertical distribution.
When a TC approaches an island or coastal mountain range, terrain–vortex interaction introduces additional complexity. Idealized and real-case studies have shown that island mountains can alter upstream tracks and translation speeds, or even produce discontinuous center relocations, through dynamical blocking, flow splitting and deflection, terrain-induced pressure anomalies, vortex deformation, lee-vortex formation, and center reorganization [
10,
11,
12,
13]. Terrain effects depend not only on mountain height, but also on mountain width and slope, static stability, vortex intensity and size, translation speed, landfall position, and approach angle [
14]. Numerical and idealized studies further show that terrain height, island geometry, and surface characteristics can modify upstream deflection and circulation adjustment [
15,
16,
17,
18]. Comparisons of Taiwan and Philippine topographies indicate that conclusions derived from Taiwan’s continuous Central Mountain Range cannot be applied uncritically to the multi-island and multi-range environment of the Philippines [
16].
Recent high-resolution simulations have emphasized the case dependence of terrain-induced track deflection. Taiwan’s terrain modified the motion, circulation, and intensity evolution of Typhoon Lekima and Tropical Cyclone Atsani [
19,
20], while terrain effects on precipitation and vorticity evolution have also been documented for landfalling storms [
21]. Experiments with different storm tracks relative to Taiwan further demonstrate that the response depends on storm–terrain geometry [
22]. Typhoon Chanthu exhibited successive rightward and leftward deflections near Taiwan, showing that terrain does not impose a single preferred deflection direction [
23]. Recent dynamical modeling and a WRF study of Typhoon Doksuri across the Luzon Strait likewise indicate that terrain slope, vortex intensity, approach angle, and physical configuration jointly control the track response [
24,
25].
Potential-vorticity tendency (PVT) diagnostics provide a useful dynamical framework for linking environmental circulation, vortex propagation, and track deflection. A TC may be viewed as a positive PV anomaly embedded in the environment, and its motion can be related to the azimuthal wavenumber-1 component of PVT [
26,
27]. PVT diagnostics have subsequently been applied to high-resolution simulations, although convective-scale PV anomalies and spatial noise can reduce diagnostic stability and require regridding, smoothing, and azimuthal decomposition [
28]. In the present study, we focus specifically on the horizontal-advection contribution to PVT, denoted PVT
h, which is interpreted together with the environmental flow and observed motion rather than as a unique predictor of TC motion.
Most terrain–TC studies have focused on mature storms with well-organized structures or on prescribed axisymmetric idealized vortices, whereas terrain responses during early development remain less well understood. Weak or organizing storms often have relatively shallow circulations, and the low-level circulation center, midlevel vorticity center, and deep-convection center may not be vertically aligned. The Kong-Rey case demonstrated that asymmetric latent heating can separate upper- and lower-level centers and substantially affect storm structure and motion [
29]. These characteristics imply that terrain-deflection mechanisms derived for mature intense TCs may not apply directly to an early-stage, vertically evolving vortex.
In addition to terrain elevation, surface roughness, soil conditions, and land–atmosphere heat exchange influence the boundary-layer structure of a TC approaching land. Idealized studies have shown that land–sea roughness contrasts generate asymmetric near-surface winds and can influence TC motion, whereas the direct track effect of land sensible heat flux is generally weaker than that of friction and roughness [
30]. Landfalling-TC studies also show that terrain and land–sea contrasts can modify circulation, precipitation, and translation speed [
20,
21,
31]. A no-sensible-heat experiment can therefore diagnose sensitivity to land-surface thermal forcing, but it should be interpreted as a perturbation to boundary-layer thermodynamics and asymmetric circulation rather than evidence of a systematic sensible-heat bias in the real atmosphere.
Typhoon Yagi developed east of the Philippines in 2024, crossed Luzon, entered the South China Sea, and subsequently intensified into a super typhoon. Its early track, passage across the Philippines, and later intensification posed substantial challenges for operational models [
32]. Observational analysis indicates that Yagi’s subsequent evolution over the South China Sea involved pronounced oceanic and thermodynamic changes [
33]. The case combines an organizing vortex, complex Luzon topography, and land-surface thermal exchange, and is therefore suitable for assessing the relative contributions of terrain dynamics and sensible heating to track-simulation errors.
Building on these considerations, this study examines Typhoon Yagi during its early development near Luzon to assess the relative contributions of complex-island terrain dynamics and land sensible heating to simulated track error, and to clarify the mid-tropospheric dynamical link between terrain-height changes and track deflection. In contrast to studies focused primarily on mature tropical cyclones or prescribed axisymmetric vortices, the present analysis targets an organizing storm and separates terrain-dynamic sensitivity from land-surface thermal sensitivity within a common numerical framework.
Three questions are addressed: (1) whether the premature northward turn and northward track bias in CTRL are associated with an overly strong model response to terrain-related blocking and flow-around adjustment over Luzon; (2) how terrain-height changes modify the mid-tropospheric environmental flow and horizontal-advection PVTh asymmetry; and (3) how land sensible heat flux provides secondary modulation of the track and surrounding circulation when terrain dynamics dominate. Addressing these questions provides a process-oriented basis for attributing early-stage TC track errors and interpreting terrain and land-surface sensitivity experiments near complex islands.
2. Materials and Methods
2.1. Data Sources
The CMA tropical cyclone best-track dataset compiled by the Shanghai Typhoon Institute of the China Meteorological Administration was used to represent the observed position of Yagi and to evaluate track and motion-direction errors in the simulations [
34,
35]. ERA5, the fifth-generation global atmospheric reanalysis produced by the European Centre for Medium-Range Weather Forecasts (ECMWF), was used as the reference for the mid-tropospheric environmental field and horizontal-advection potential-vorticity tendency (PVT
h) diagnostics [
36]. The analyzed ERA5 variables included zonal and meridional wind, potential vorticity (PV), and geopotential height. For direct comparison, the WRF wind and PV fields used in the PVT
h analysis were interpolated onto the same regular latitude–longitude grid as ERA5.
Initial and lateral boundary conditions for WRF were obtained from the National Centers for Environmental Prediction Global Forecast System (NCEP GFS) 0.25° historical archive [
37]. The GFS data have a temporal interval of 6 h and provide the atmospheric temperature, moisture, wind, pressure, and land-surface states required for model initialization and boundary forcing.
Static terrain and land-surface data were obtained from the geographical datasets distributed with the WRF Preprocessing System (WPS) [
38], including terrain elevation, land-use category, soil type, and vegetation information. This study focuses on terrain elevation over Luzon and its surrounding region; terrain-removal and terrain-enhancement experiments were constructed from the control-terrain field to assess the influence of complex topography on tropical cyclone (TC) motion and the mid-tropospheric circulation.
2.2. WRF Model Configuration and Sensitivity Experiments
2.2.1. WRF Model Configuration
The Weather Research and Forecasting Model version 4.3 (WRF v4.3) was used for the case simulation [
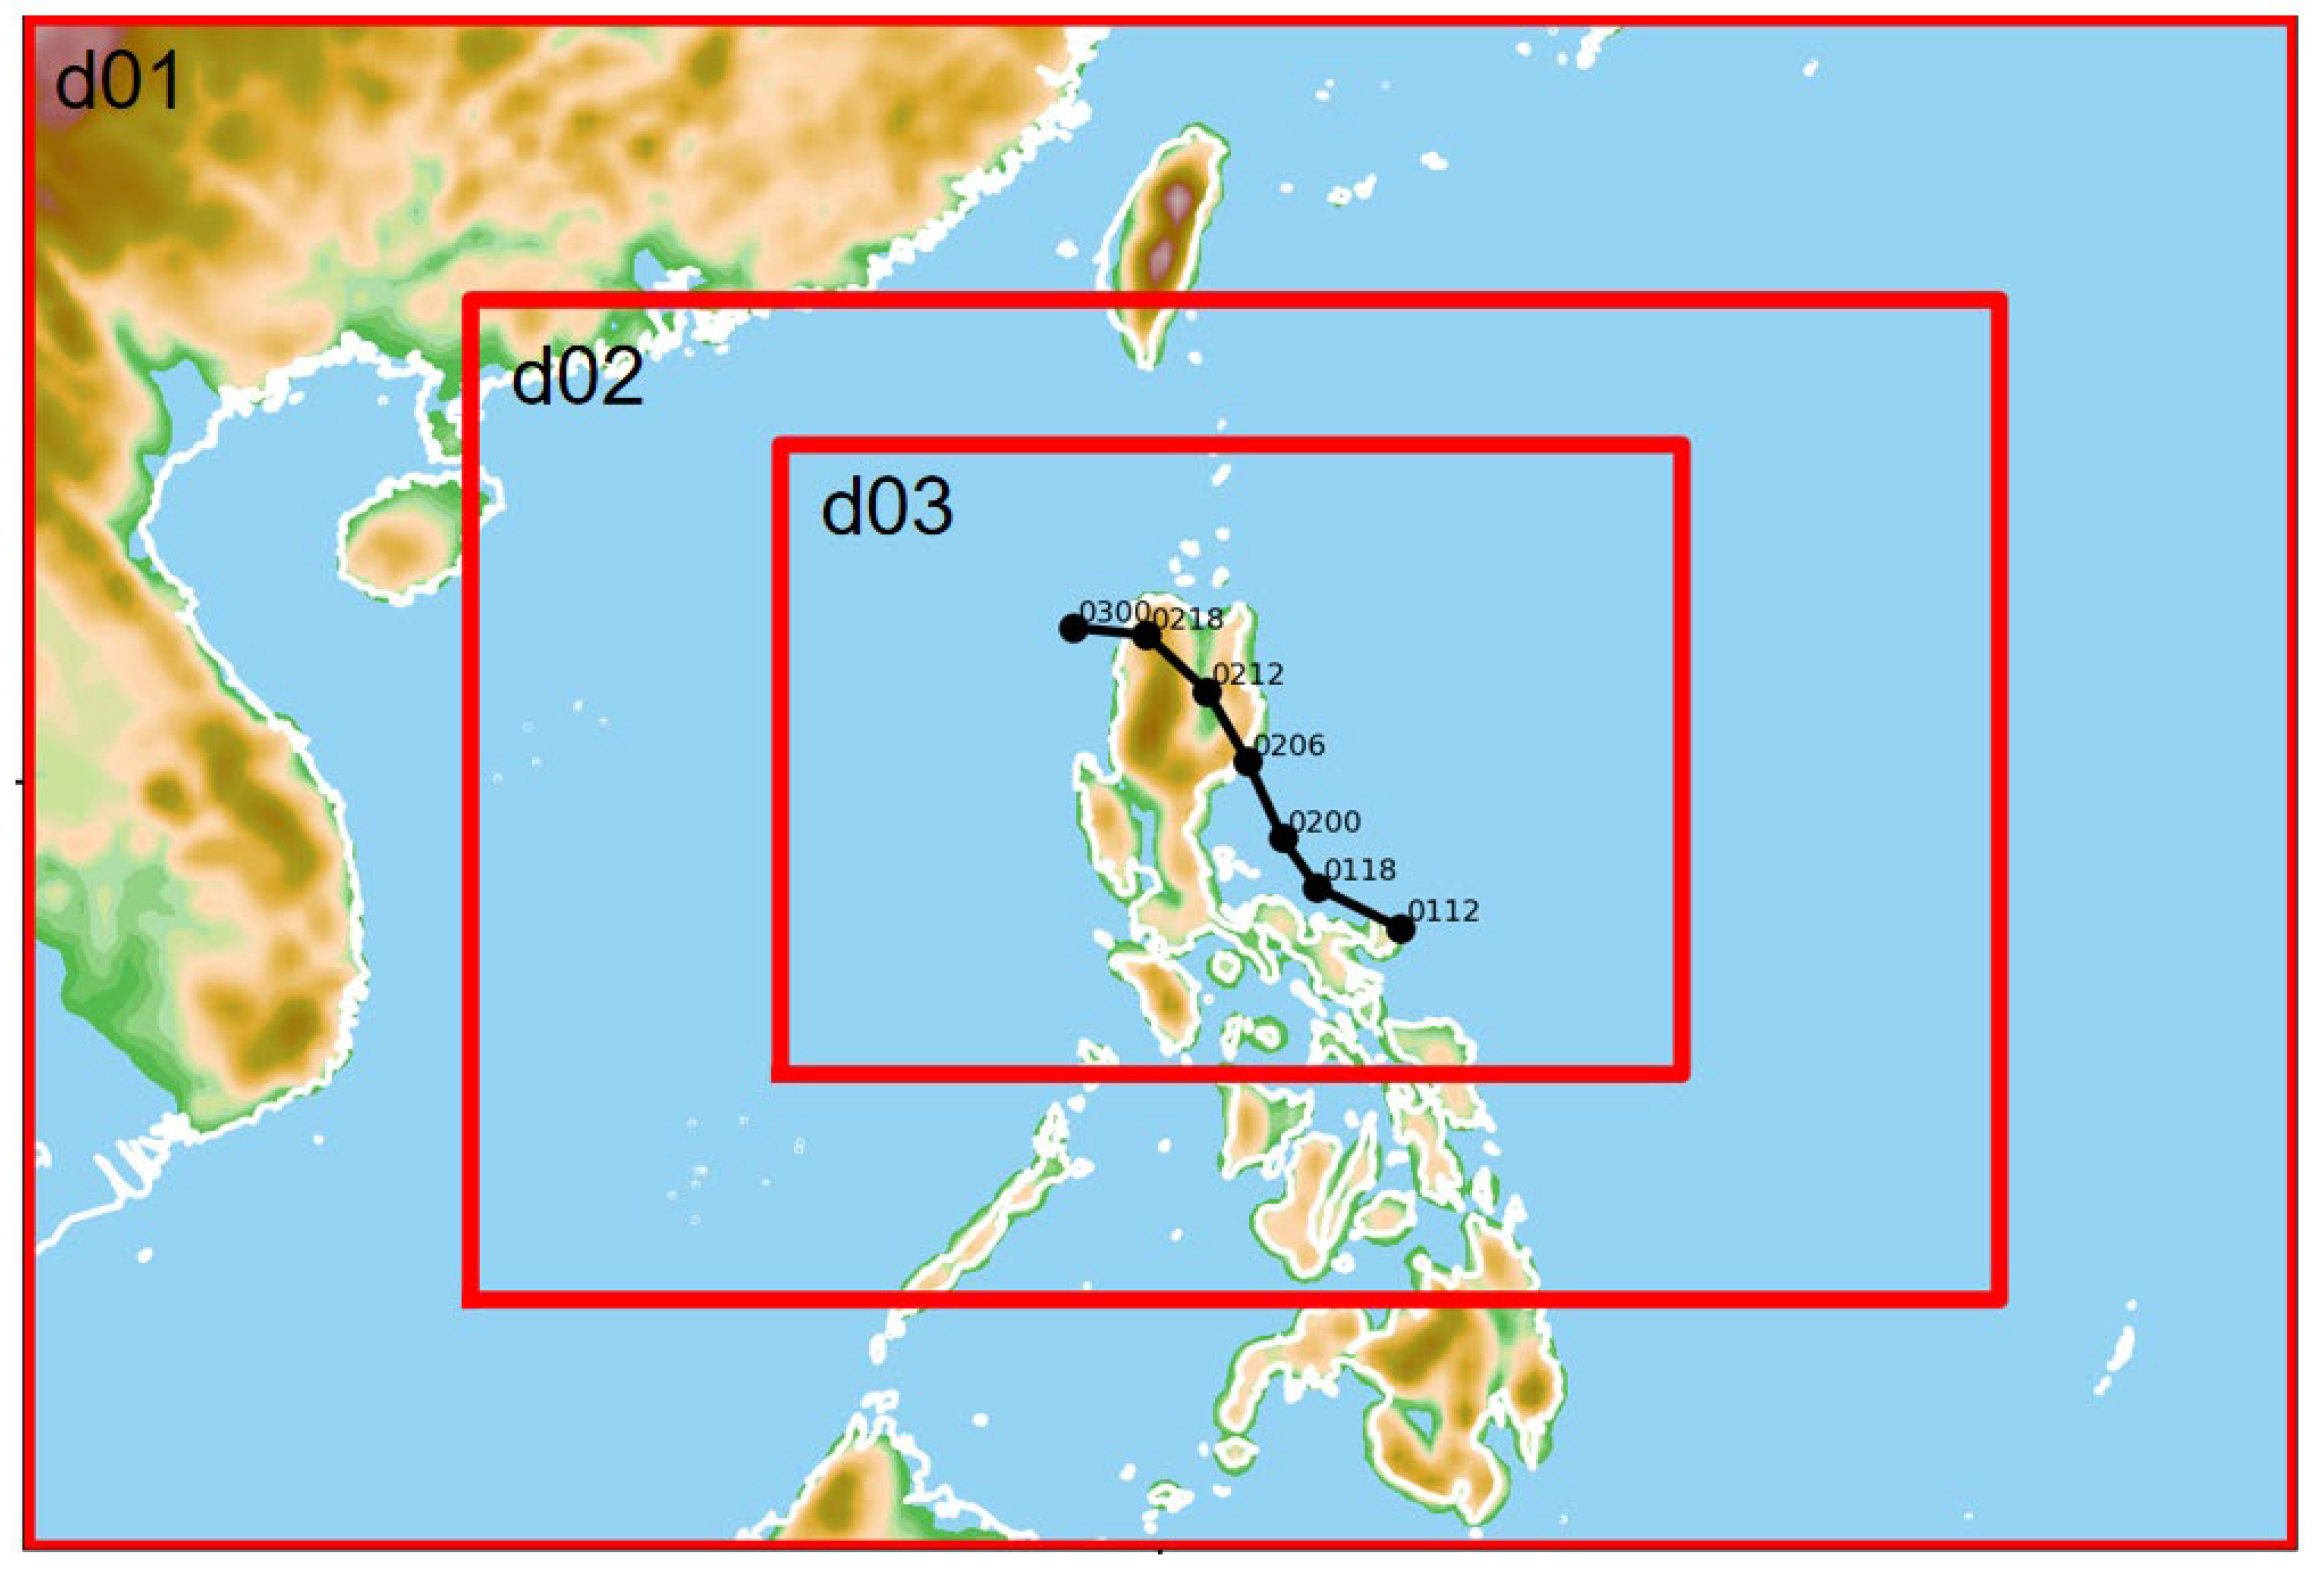
38]. Three two-way nested domains were configured with horizontal grid spacings of 18, 6, and 2 km and grid dimensions of 199 × 135, 400 × 262, and 706 × 493, respectively. The model employed 34 vertical levels with a model top at 50 hPa. The integration extended from 1800 UTC 1 September to 0600 UTC 3 September 2024, for a total of 36 h. The main model time step was 30 s. Output intervals were 180 min for d01 and d02 and 60 min for d03.
The physical parameterization configuration was based on the WRF Tropical Physics Suite and adjusted according to the resolution of each nested domain. The WRF Single-Moment 6-Class scheme (WSM6) was used for cloud microphysics [
39], and the Rapid Radiative Transfer Model for General Circulation Models (RRTMG) was used for both longwave and shortwave radiation [
40]. The Kain–Fritsch cumulus parameterization was applied in d01 and d02 [
41], whereas cumulus parameterization was disabled in the 2 km d03 domain so that deep convection was represented primarily by the model dynamics and explicit microphysics. The Yonsei University (YSU) scheme was used for the planetary boundary layer [
42], the revised MM5 Monin–Obukhov scheme for the surface layer [
43], and the Noah land-surface model for land processes [
44,
45].
The nested-domain configuration is shown in
Figure 1.
2.2.2. Sensitivity Experiment Design
One control simulation and three sensitivity experiments were conducted to distinguish the effects of Luzon terrain dynamics and land sensible heat flux. CTRL used the realistic terrain, standard land-surface fluxes, and the common physical parameterizations. In Te0P, terrain elevation within the Luzon target region was set to 0 m while the land-surface properties were retained. In Te2P, terrain elevation within the target region was set to twice that in CTRL. HFX0 retained the realistic terrain but set the sensible heat flux to 0 W m−2 over land. Except for the perturbed variable, all experiments used the same initial and boundary conditions, integration period, model domains, physical parameterizations, and output frequency.
The experiment design is summarized in
Table 1.
2.3. Diagnostic Methods
The CMA best-track positions were used as the observed TC track. The WRF TC center was identified from the minimum sea-level pressure and cross-checked against the low-level cyclonic circulation and vortex structure to reduce the possibility of misidentification caused by local pressure perturbations over complex terrain. The temporal continuity of the resulting track was also examined, and no unrealistic center jumps were found during the analyzed period. No spatial or temporal smoothing was applied to the retained TC-center coordinates. Track error was defined as the great-circle distance between the simulated and CMA centers at the same time. TC motion direction was calculated from the displacement between adjacent center positions. Direction angles of 0, 90, 180, and 270° denote motion toward the east, north, west, and south, respectively.
To characterize the mid-tropospheric environmental flow surrounding the TC, the area-weighted mean horizontal wind was calculated separately at 500, 600, and 700 hPa within an annulus 300–550 km from the center, followed by averaging across the three pressure levels. The area weight on the regular latitude–longitude grid was proportional to cos φ, where φ is latitude. ERA5 diagnostics were centered on the contemporaneous CMA best-track position, whereas each WRF experiment was centered on its own simulated TC position. The resulting zonal and meridional components are denoted by u and v. The environmental-flow speed was calculated as , and the vector direction was calculated using .
This quantity is used as a proxy for the mid-tropospheric environmental steering flow. The analysis emphasizes relative differences among ERA5 and the WRF experiments rather than requiring the vector direction to coincide with the instantaneous TC motion at every time.
To investigate the dynamical processes associated with track deflection, the horizontal-advection potential-vorticity tendency (PVT
h) was calculated and averaged over 500, 600, and 700 hPa according to Equation (1):
where PV denotes potential vorticity, and u and v are the horizontal components of wind velocity. Positive PVT
h indicates a local tendency for PV to increase, and its azimuthal distribution is used here to characterize the orientation of the dominant horizontal-advection asymmetry relative to the TC center. For the PVT
h diagnostic, the WRF PV and horizontal wind fields at 500, 600, and 700 hPa were first vertically averaged and then interpolated onto a 0.25° regular latitude–longitude grid comparable to ERA5. Before the horizontal PV gradients were calculated, the layer-mean PV field was lightly smoothed with a Gaussian filter using σ = 0.8 grid points. After PVT
h was calculated, the resulting field was further smoothed with σ = 1.0 grid point to suppress residual grid-scale noise. The same smoothing parameters were applied to the ERA5 diagnostic. The analysis therefore emphasizes the spatial orientation of dominant positive PVT
h anomalies rather than grid-scale extrema or exact pointwise agreement in magnitude, and interprets that orientation together with the observed and simulated motion vectors.
Difference fields CTRL−Te0P and CTRL−HFX0 were calculated to compare the responses to terrain and sensible heating. CTRL−Te0P represents the combined environmental-field difference between simulations with realistic and removed terrain, whereas CTRL−HFX0 compares simulations with and without land sensible heat flux. As the simulated tracks diverge, these difference fields include not only direct environmental adjustment to the perturbed process but also contributions from differences in TC position, intensity, and structure. They are therefore interpreted together with the track, annular environmental-flow, streamline, and PVTh diagnostics rather than as pure responses to a single forcing.
All post-processing was performed in Python 3.12. WRF output was read with netCDF4 and wrf-python; numerical extraction, interpolation, area weighting, and statistical calculations used NumPy and pandas; Gaussian filtering used SciPy; and figures were produced with Matplotlib 3.10.0 and Cartopy 0.25.0. Intermediate annular-mean, directional, and error diagnostics were exported to machine-readable CSV or statistical tables where appropriate before plotting. These procedures were applied consistently when compiling the data shown in the Results figures.
3. Results
3.1. Track Responses and Mid-Tropospheric Circulation Changes
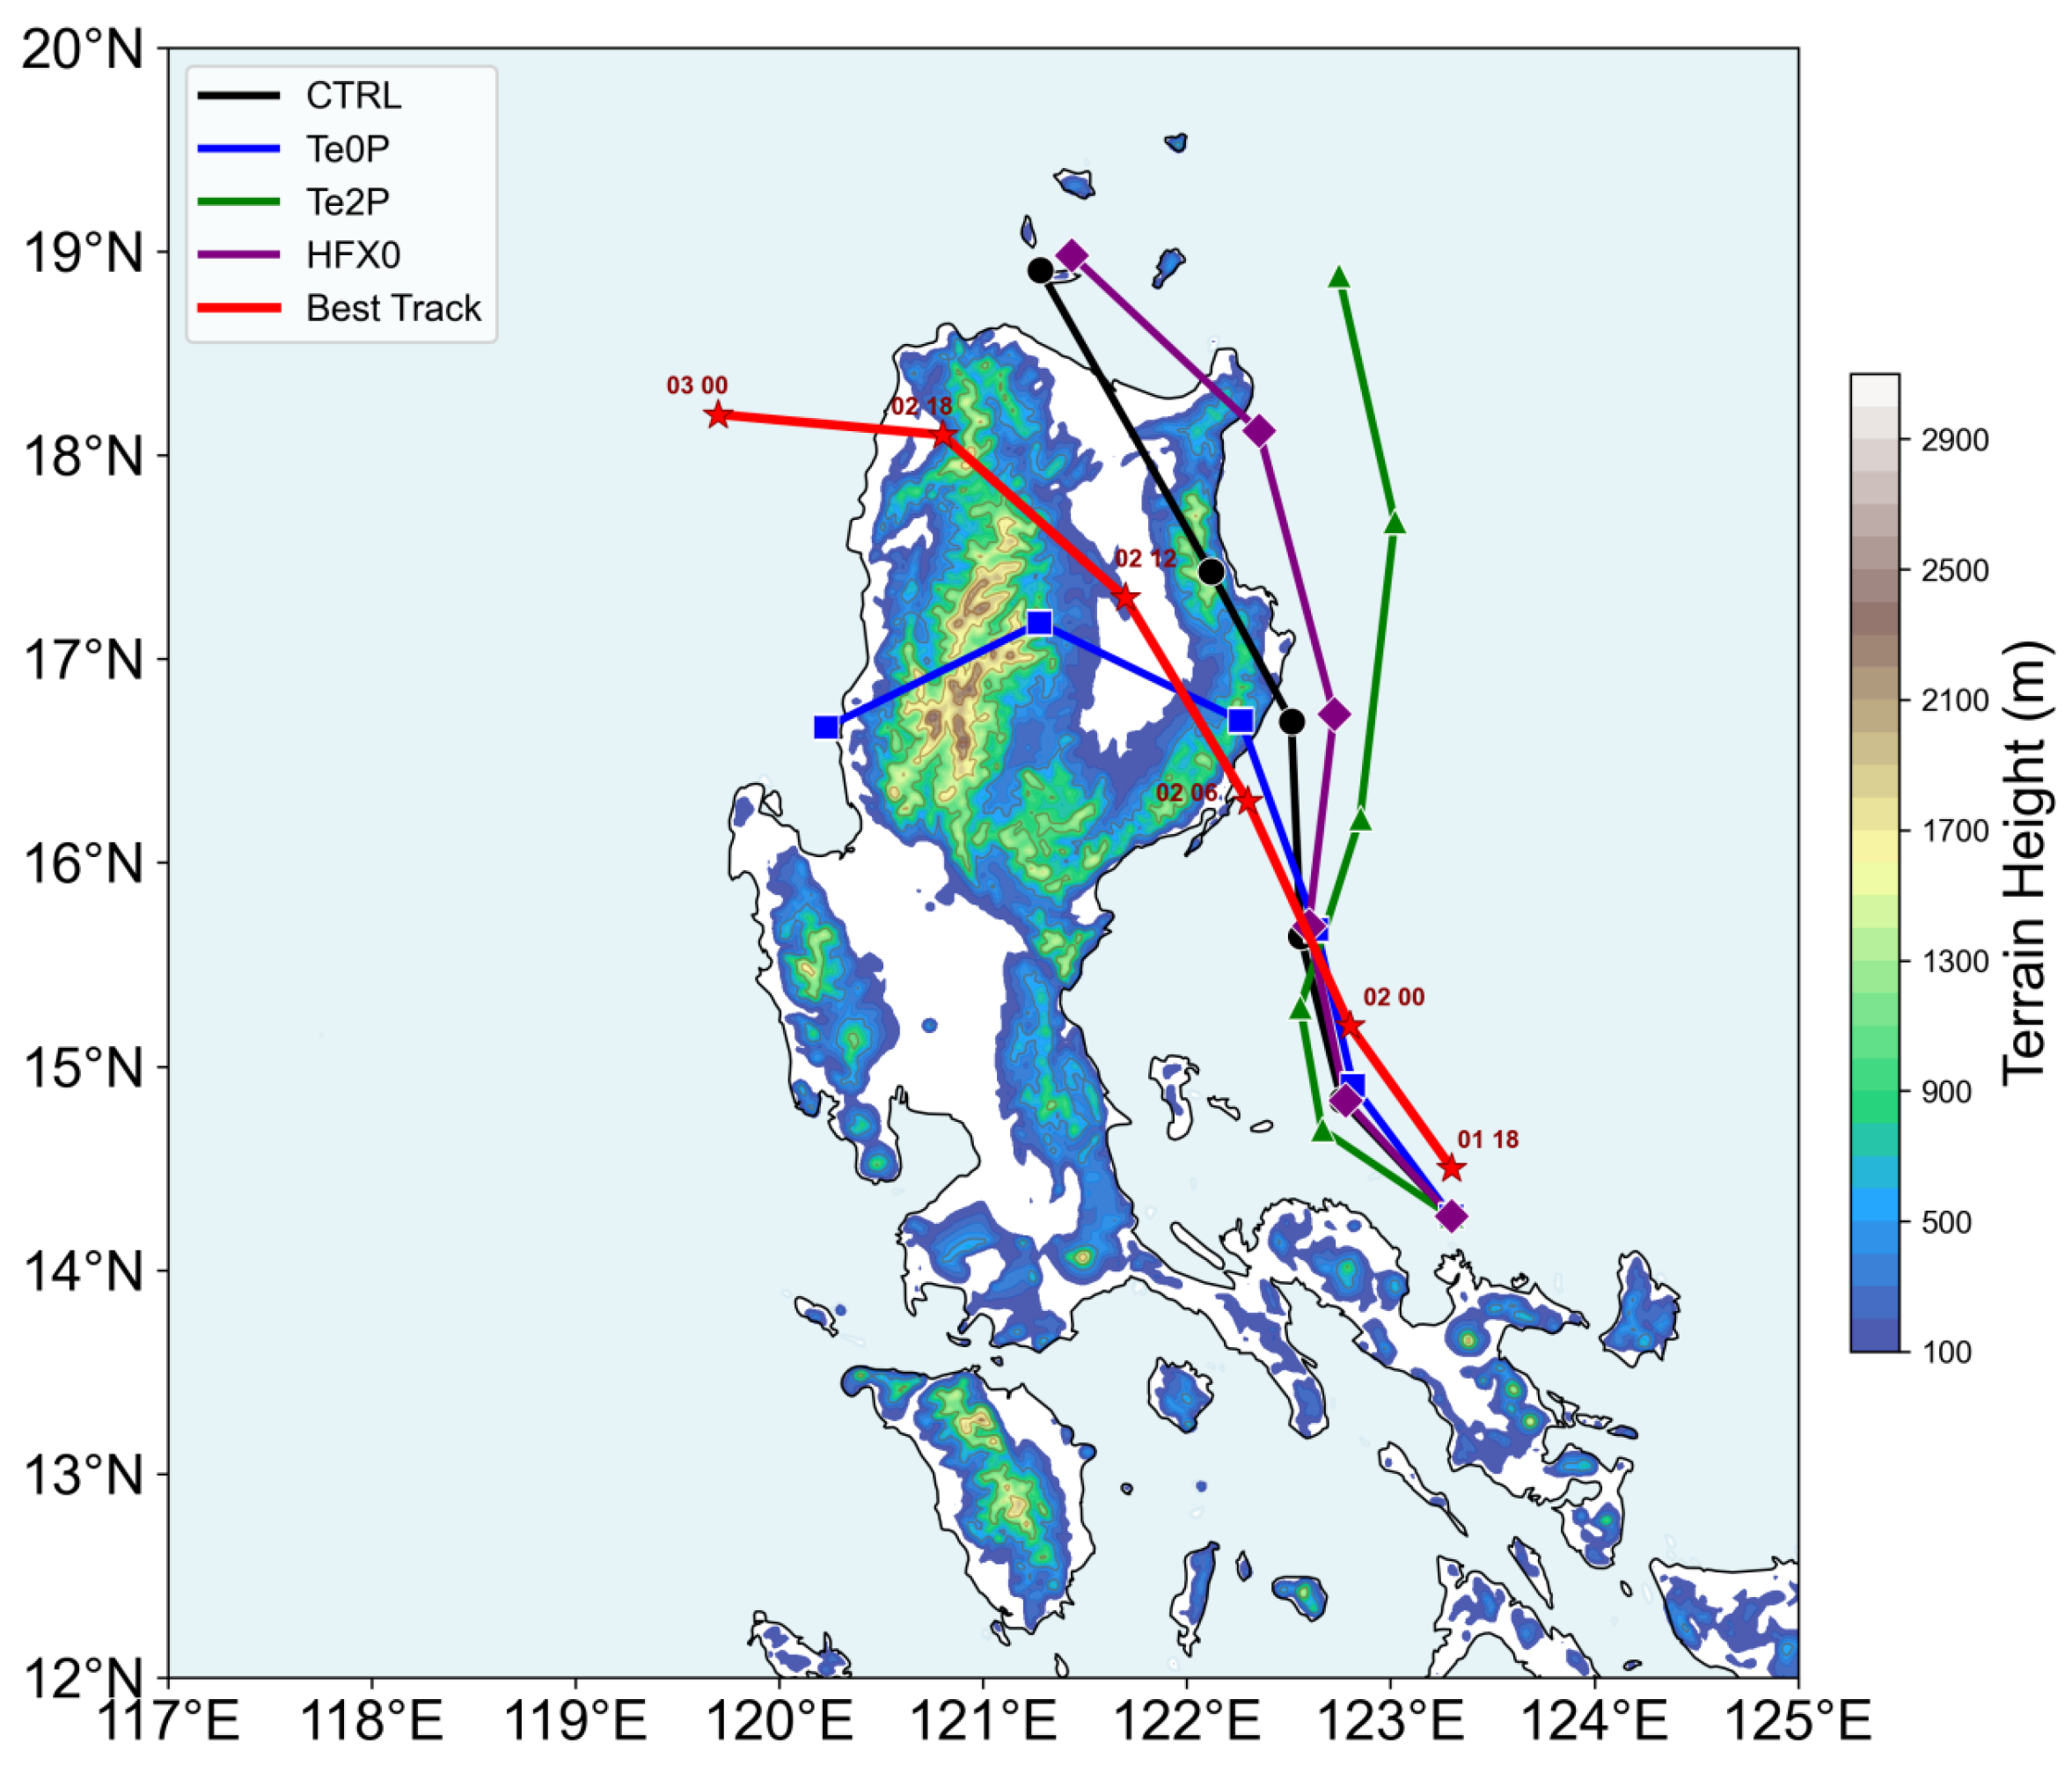
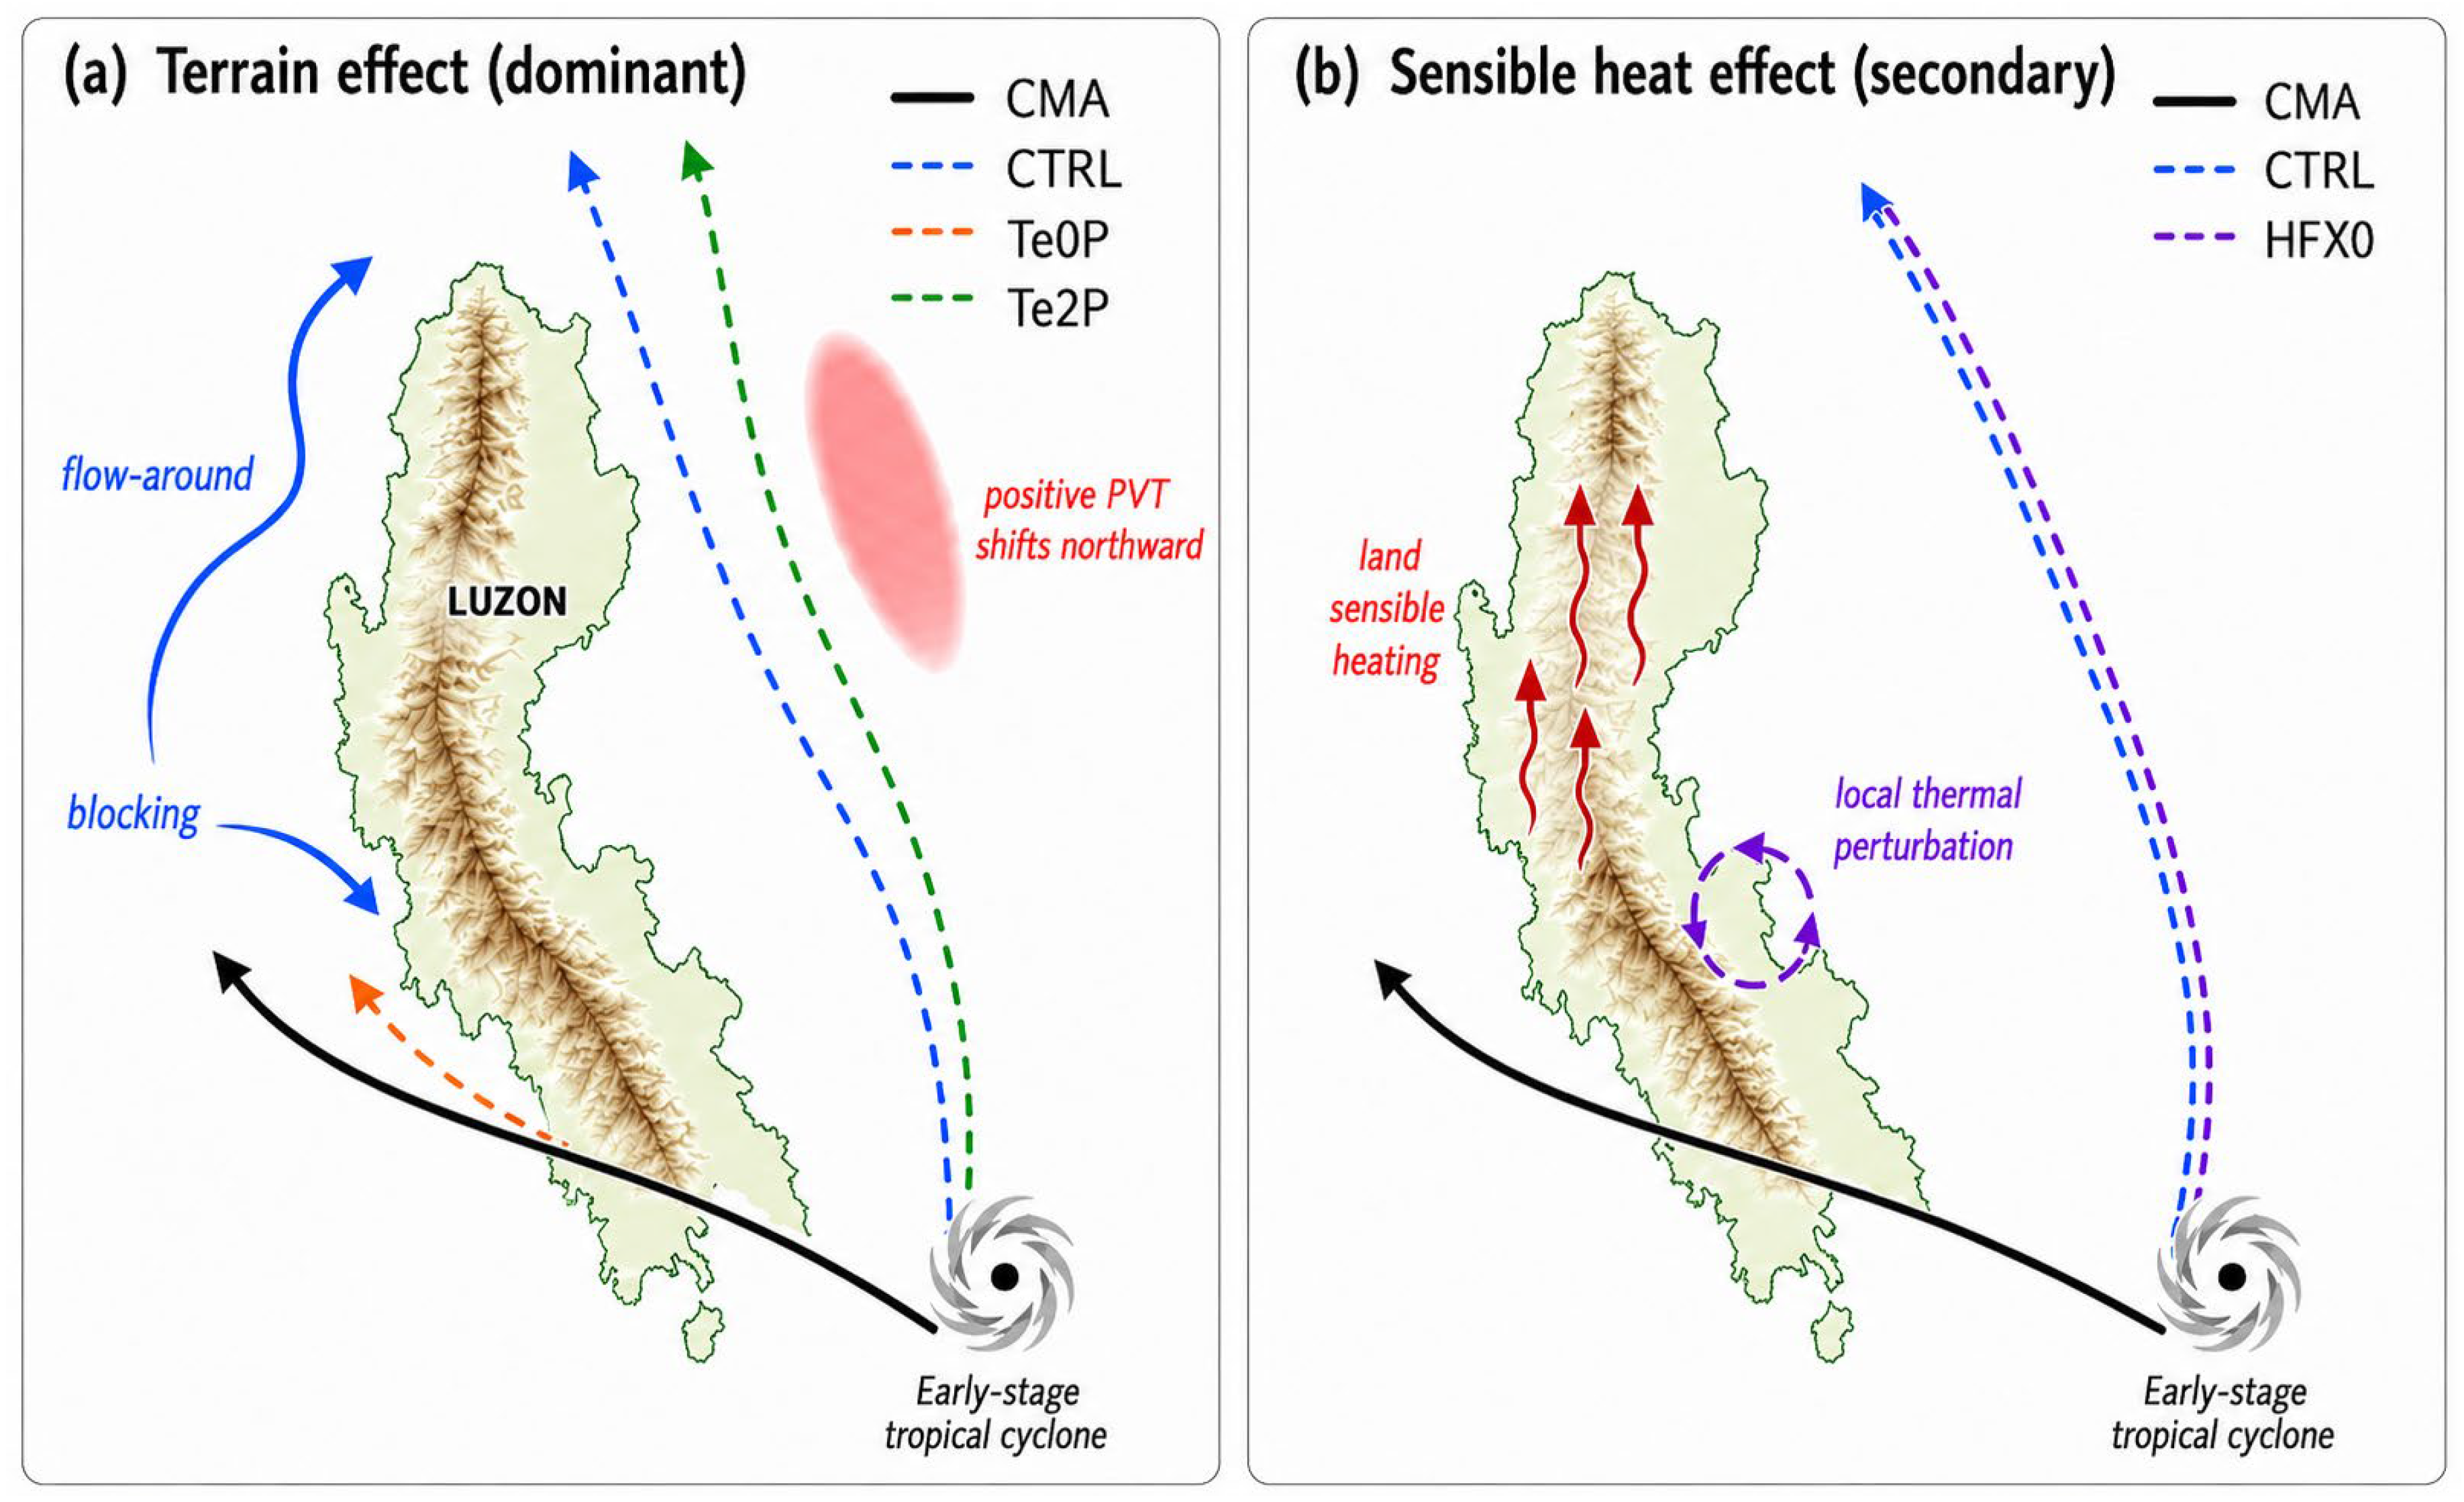
Figure 2 compares the CMA best track with the simulated tracks. CTRL lies markedly north of the CMA track, indicating that the control simulation did not accurately reproduce Yagi’s motion near Luzon. Te0P shifts westward and is generally closer to the CMA track, whereas Te2P exhibits the strongest northward bias. HFX0 differs from CTRL, but the difference is substantially smaller than those in the terrain-sensitivity experiments.
These results show that the northward CTRL track bias is closely related to the model sensitivity to Luzon topography. The closer agreement of Te0P with the CMA track does not imply that a no-terrain state is more realistic; rather, it indicates that the terrain-related northward track response in CTRL may be too strong under the present model configuration. The further northward displacement in Te2P confirms that stronger terrain forcing can amplify this response in the present case.
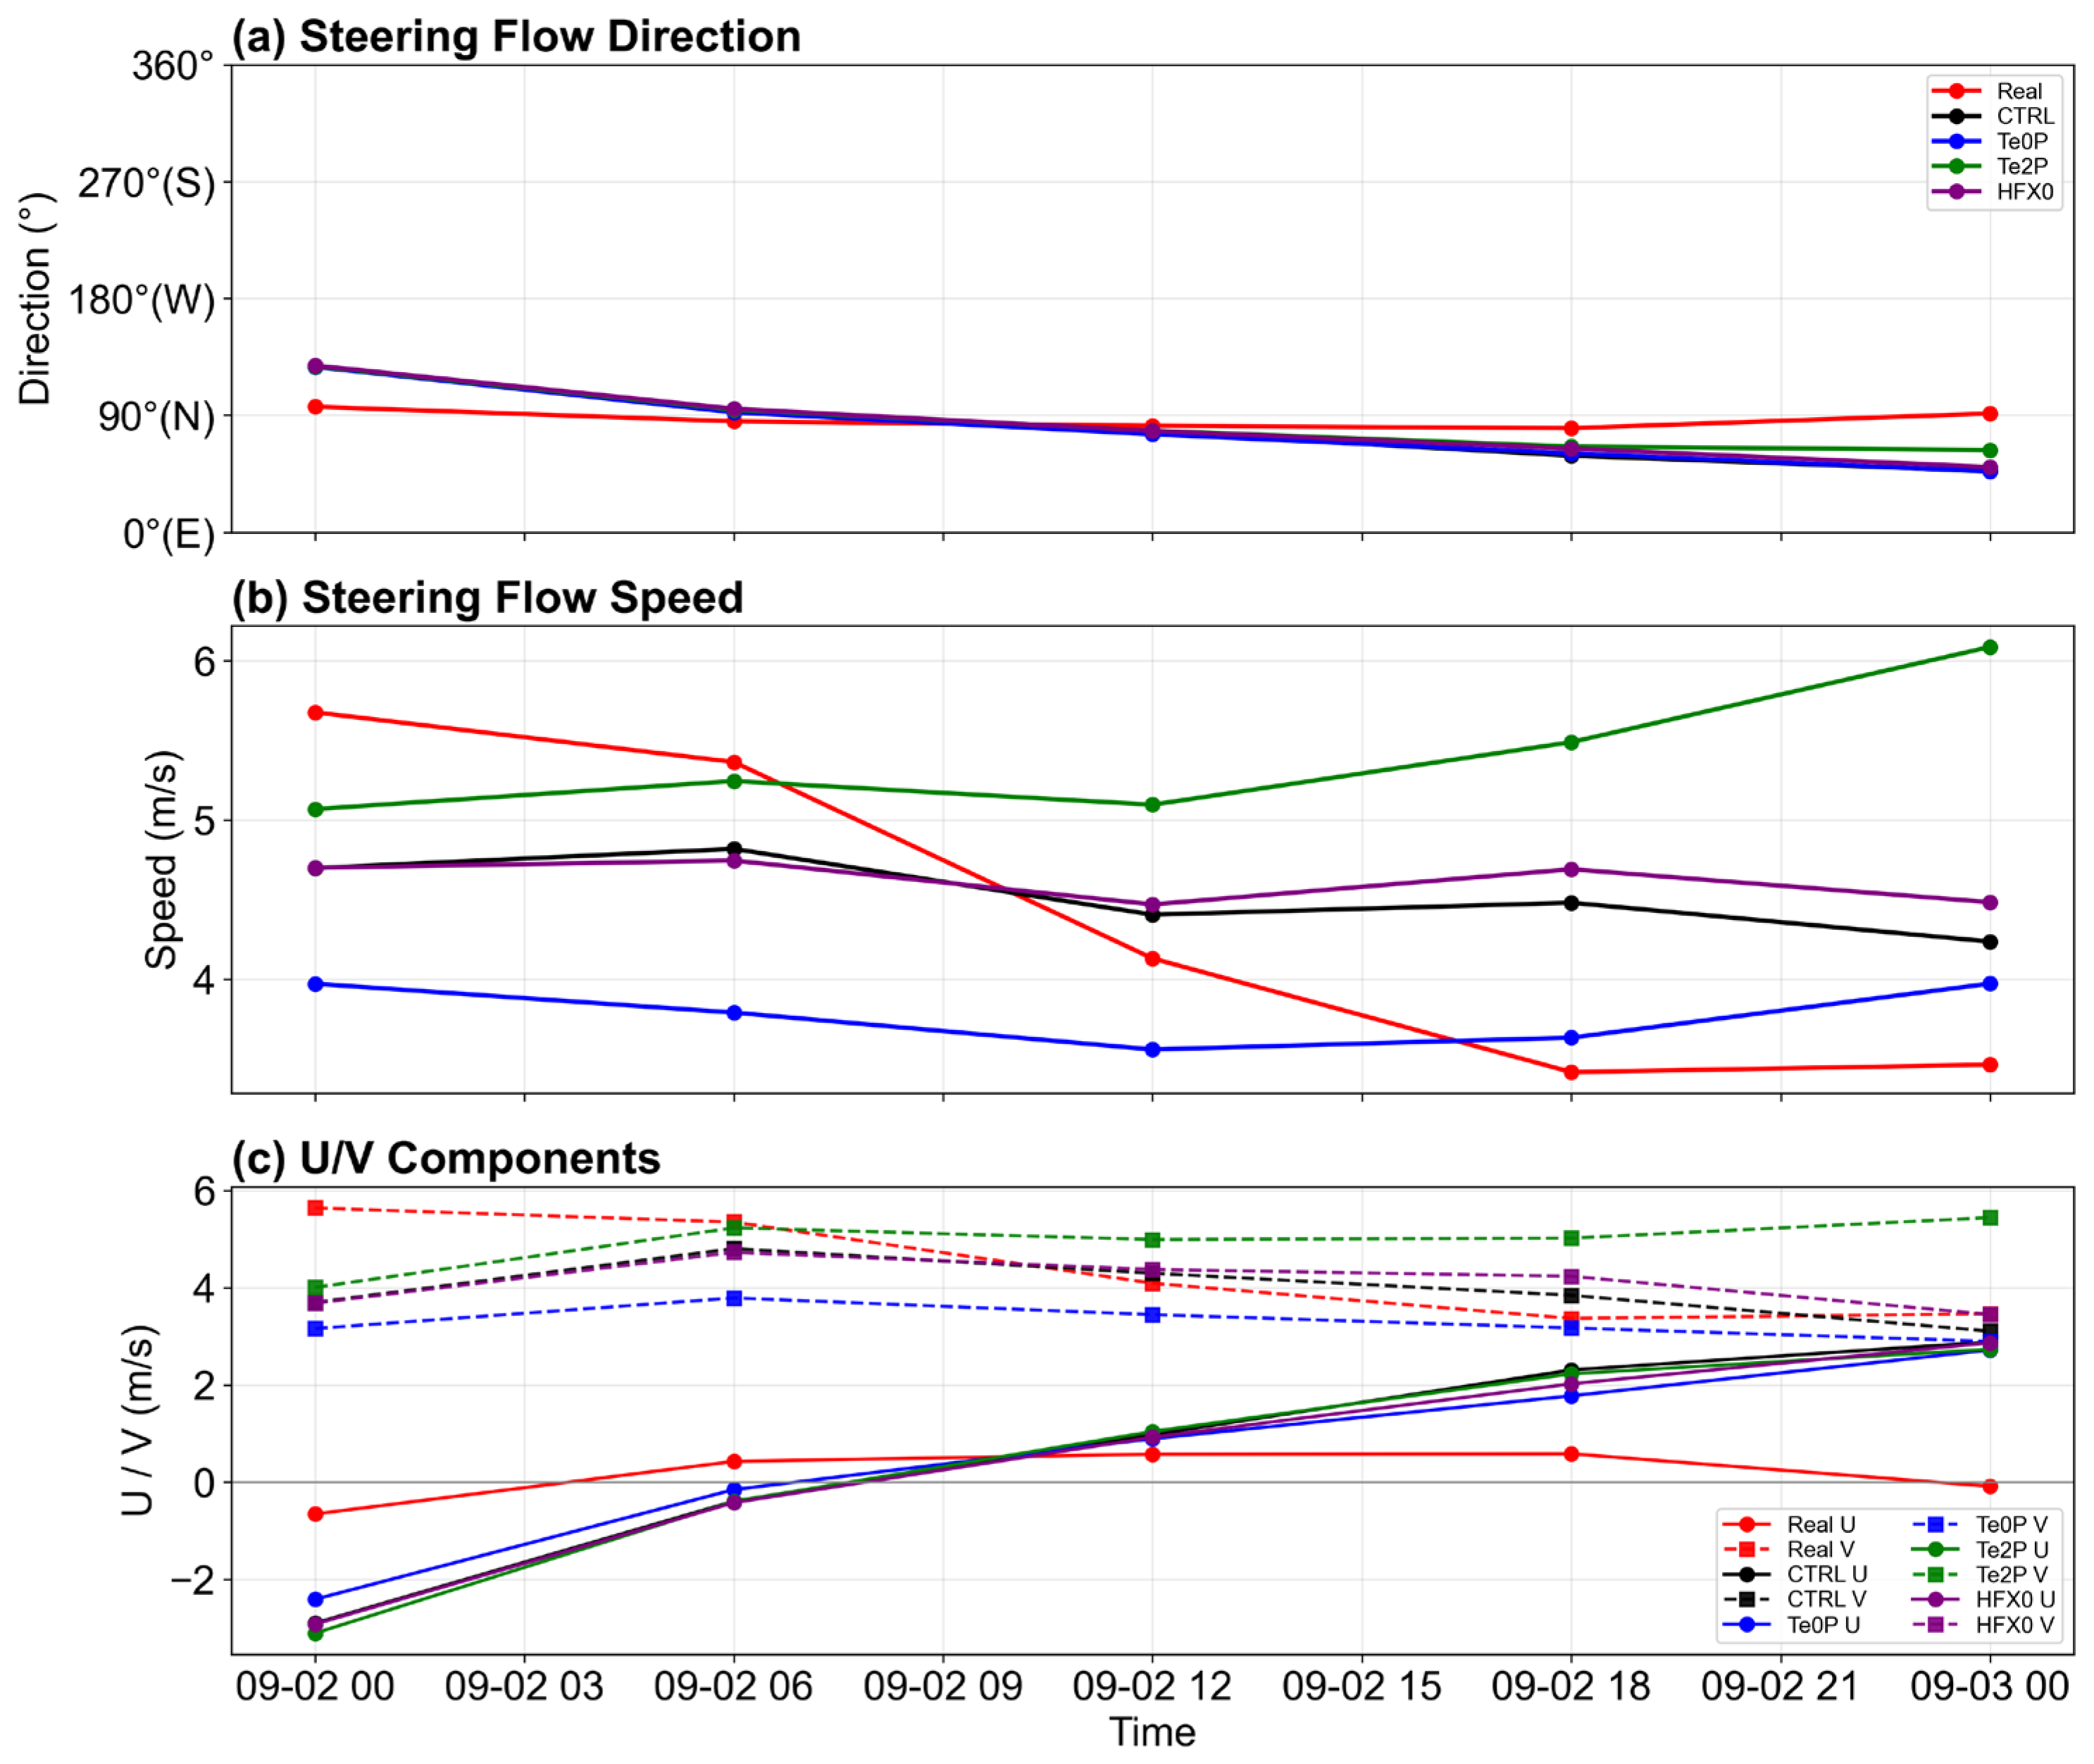
Figure 3 shows the evolution of the three-level mean environmental-flow proxy within the 300–550 km annulus. ERA5 exhibits a pronounced northward component at all analyzed times. Differences among the experiments are relatively small initially but increase after 1200 UTC 2 September. Te2P develops a stronger resultant flow and northward component, reaching approximately 6.1 and 5.4 m s
−1, respectively, at 0000 UTC 3 September. Te0P maintains a weaker environmental flow and northward component. CTRL and HFX0 remain close, indicating that suppressing land sensible heat flux does not substantially alter the surrounding mid-tropospheric flow. The zonal component varies non-monotonically, showing that the terrain response is stage-dependent; its clearest signal is the strengthening of the northward component and resultant flow during the key interaction period, rather than a persistent weakening of the westward component throughout the simulation.
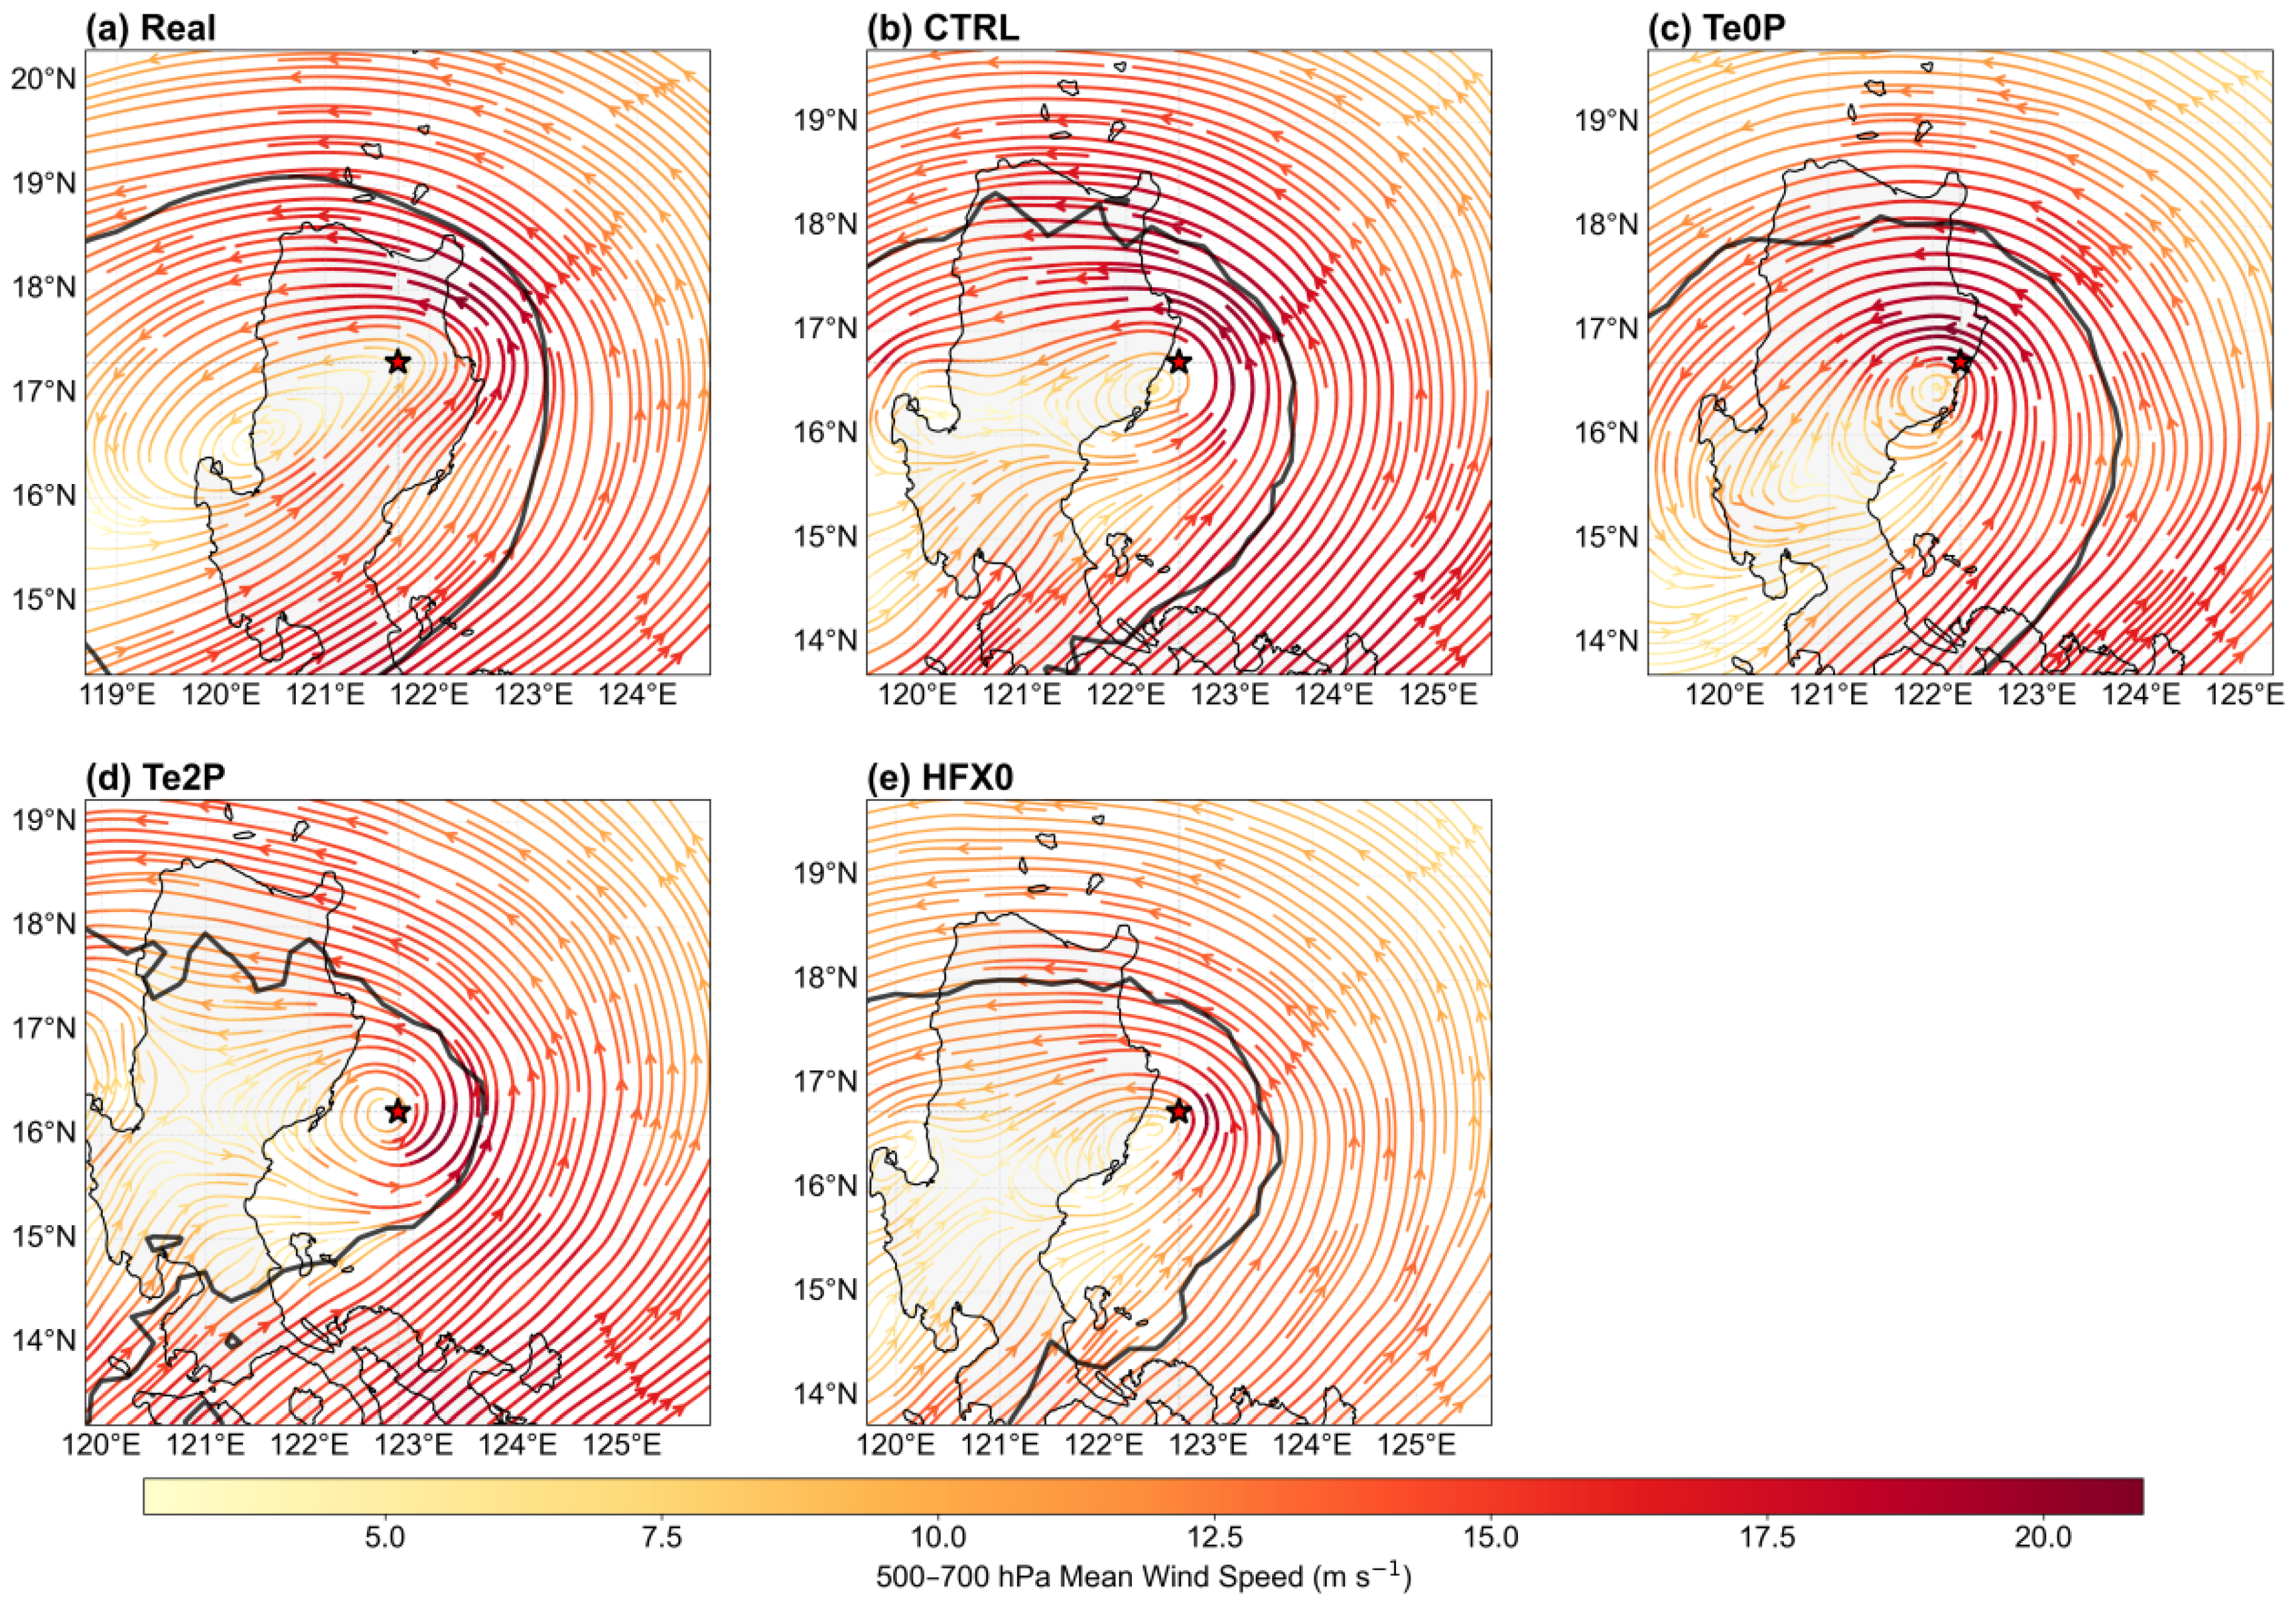
Figure 4 presents the three-level mean wind field at 1200 UTC 2 September. All datasets and experiments contain a pronounced cyclonic circulation, but the circulation center, strong-wind-band location, and streamline curvature differ. In ERA5, the midlevel circulation center lies southwest of the CMA best-track center, indicating that the reanalysis midlevel vortex center does not fully coincide with the low-level composite position represented by the best track. This offset may reflect incomplete vertical alignment during early development and the smoothing of the inner-core circulation in ERA5; however, the cause is not the focus of the present analysis and should be interpreted cautiously. The WRF midlevel circulations are approximately centered on their respective simulated centers. Te2P exhibits more tightly packed streamlines and a more concentrated strong-wind band to the east and northeast of the center. Te0P has a comparatively diffuse circulation, whereas CTRL and HFX0 are broadly similar.
These results indicate that Luzon terrain does not directly pull the TC toward a fixed direction. Instead, it changes the spatial organization of the surrounding mid-tropospheric circulation, the position of the strong-wind band, and streamline curvature, thereby establishing different environmental backgrounds for the track response. Together with
Figure 3, the results show that enhanced terrain strengthens the northward component and resultant environmental flow during the key stage, while the zonal response remains stage-dependent.
3.2. PVTh Responses and Comparison of Terrain-Dynamic and Sensible-Heat Effects
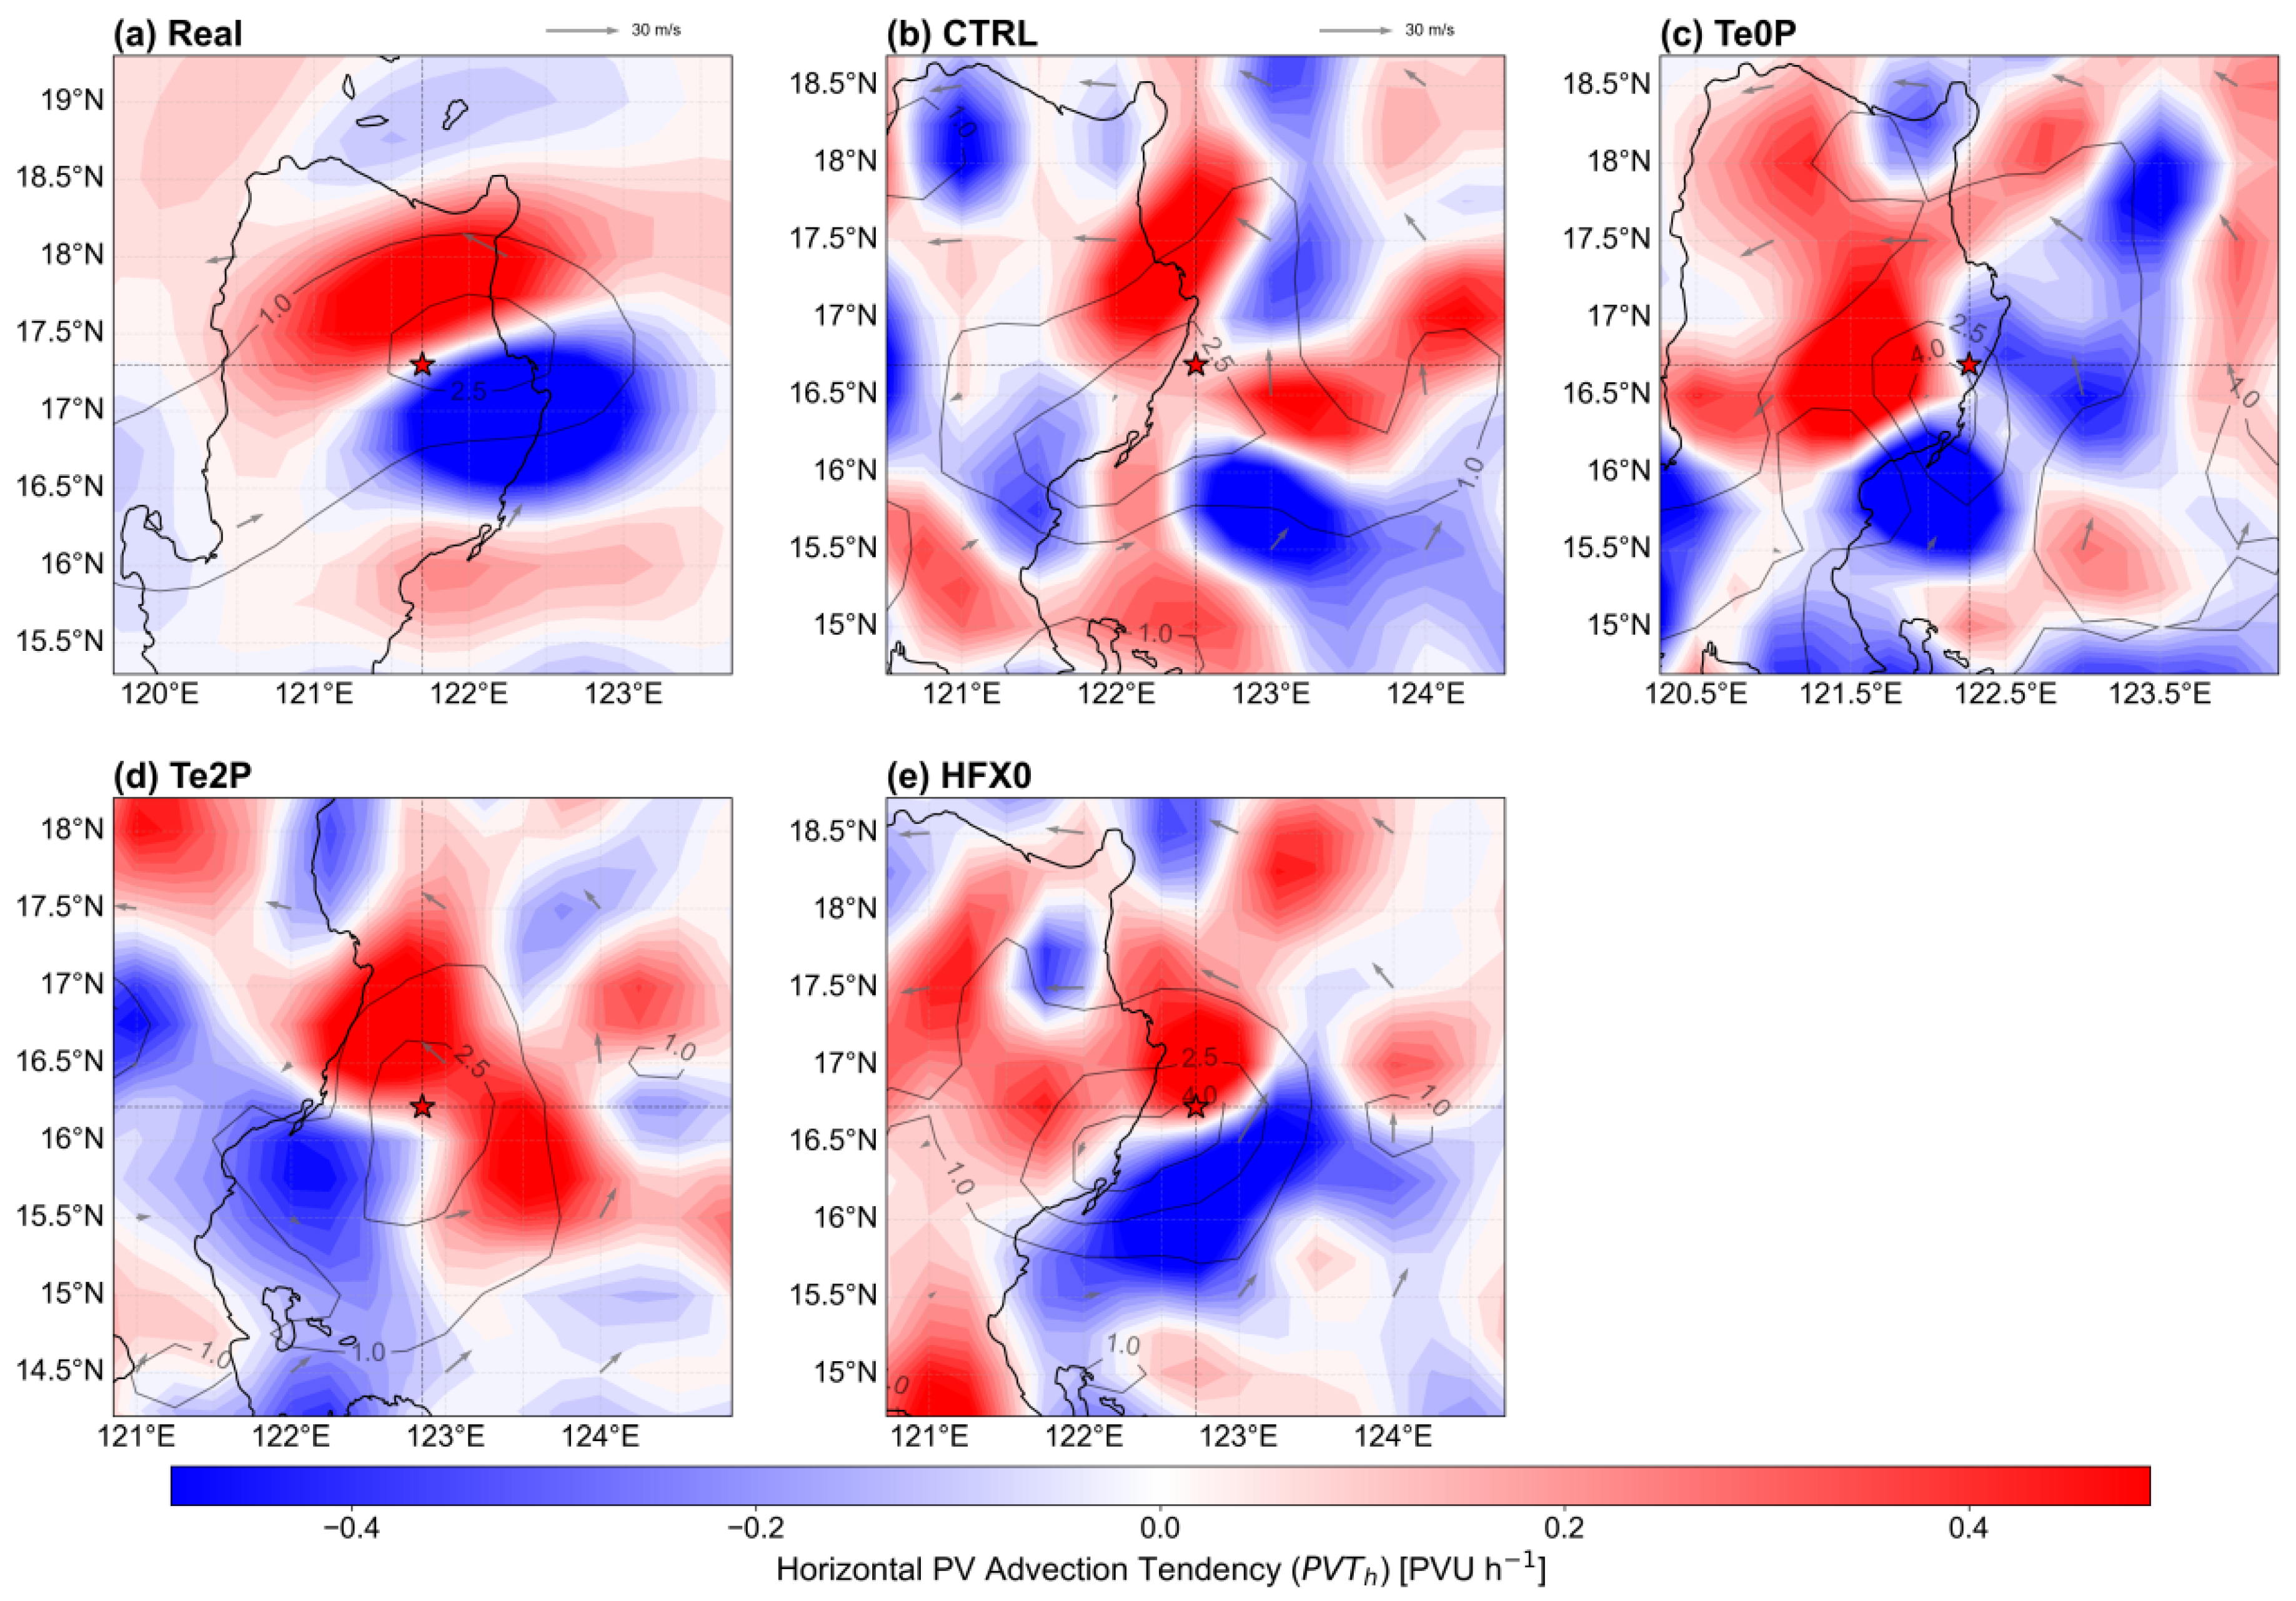
Figure 5 shows the three-level mean horizontal-advection PVT
h at the same time. In ERA5, positive PVT
h anomalies are located mainly north to northwest of the CMA center, indicating a dynamical asymmetry favorable for northward or northwestward propagation. Positive PVT
h in CTRL is also concentrated north to northwest of the center but is more localized. In Te2P, positive PVT
h is more pronounced north and northeast of the center, consistent in orientation with its stronger northward track response. The PVT
h configurations in Te0P and HFX0 differ from CTRL to varying degrees, indicating that both terrain height and land-surface thermal processes can modify horizontal PV advection, although the terrain response is more evident.
The PVTh analysis suggests one possible pathway by which terrain affects the track: modification of the mid-tropospheric horizontal wind changes the asymmetric distribution of horizontal PV advection. Concentration of positive PVTh north or northwest of the TC is generally favorable for propagation in those directions. This relationship is not one-to-one, however, and must be interpreted together with the environmental flow and actual motion.
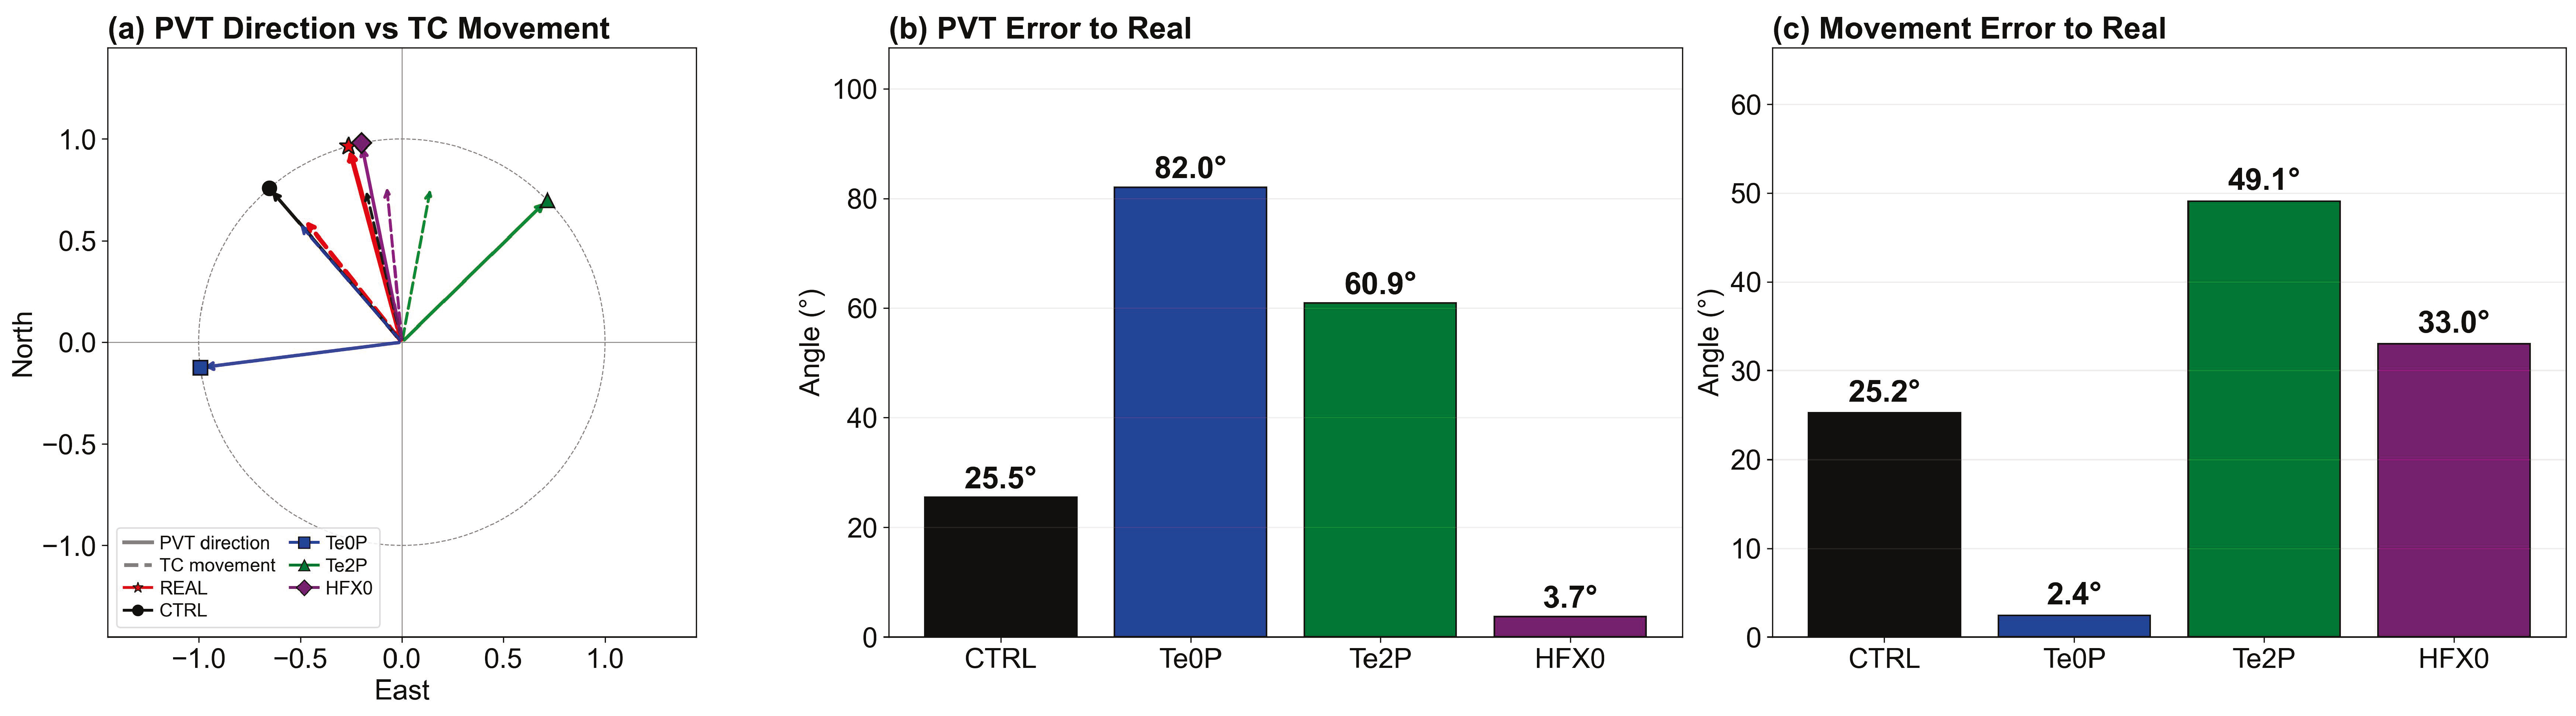
Figure 6 compares the diagnosed PVT
h orientation with the TC motion direction. The ERA5 PVT
h-orientation vector contains a clear northward component, whereas the CMA motion is more northwestward, indicating an overall relationship but not exact correspondence. The PVT
h-orientation error and motion-direction error in CTRL are 25.5° and 25.2°, respectively. CTRL therefore reproduces part of the northward PVT
h characteristic in ERA5, although its motion remains too far north.
Among the sensitivity experiments, Te0P has the motion direction closest to the CMA track, with an error of only 2.4°, whereas Te2P has the largest motion-direction error, 49.1°. Removing terrain therefore weakens the modeled northward track response, while enhanced terrain amplifies the error. However, Te0P has the largest PVTh-orientation error relative to ERA5, 82.0°. HFX0 has a PVTh-orientation error of only 3.7° but a motion-direction error of 33.0°.
The closer Te0P track therefore does not imply that its complete mid-tropospheric dynamical structure is closest to ERA5. Instead, it may reflect compensating suppression of the overly strong terrain-related northward response in CTRL. PVTh is thus an important diagnostic linking changes in the environmental flow to the track response, but it is not a unique predictor of TC motion.
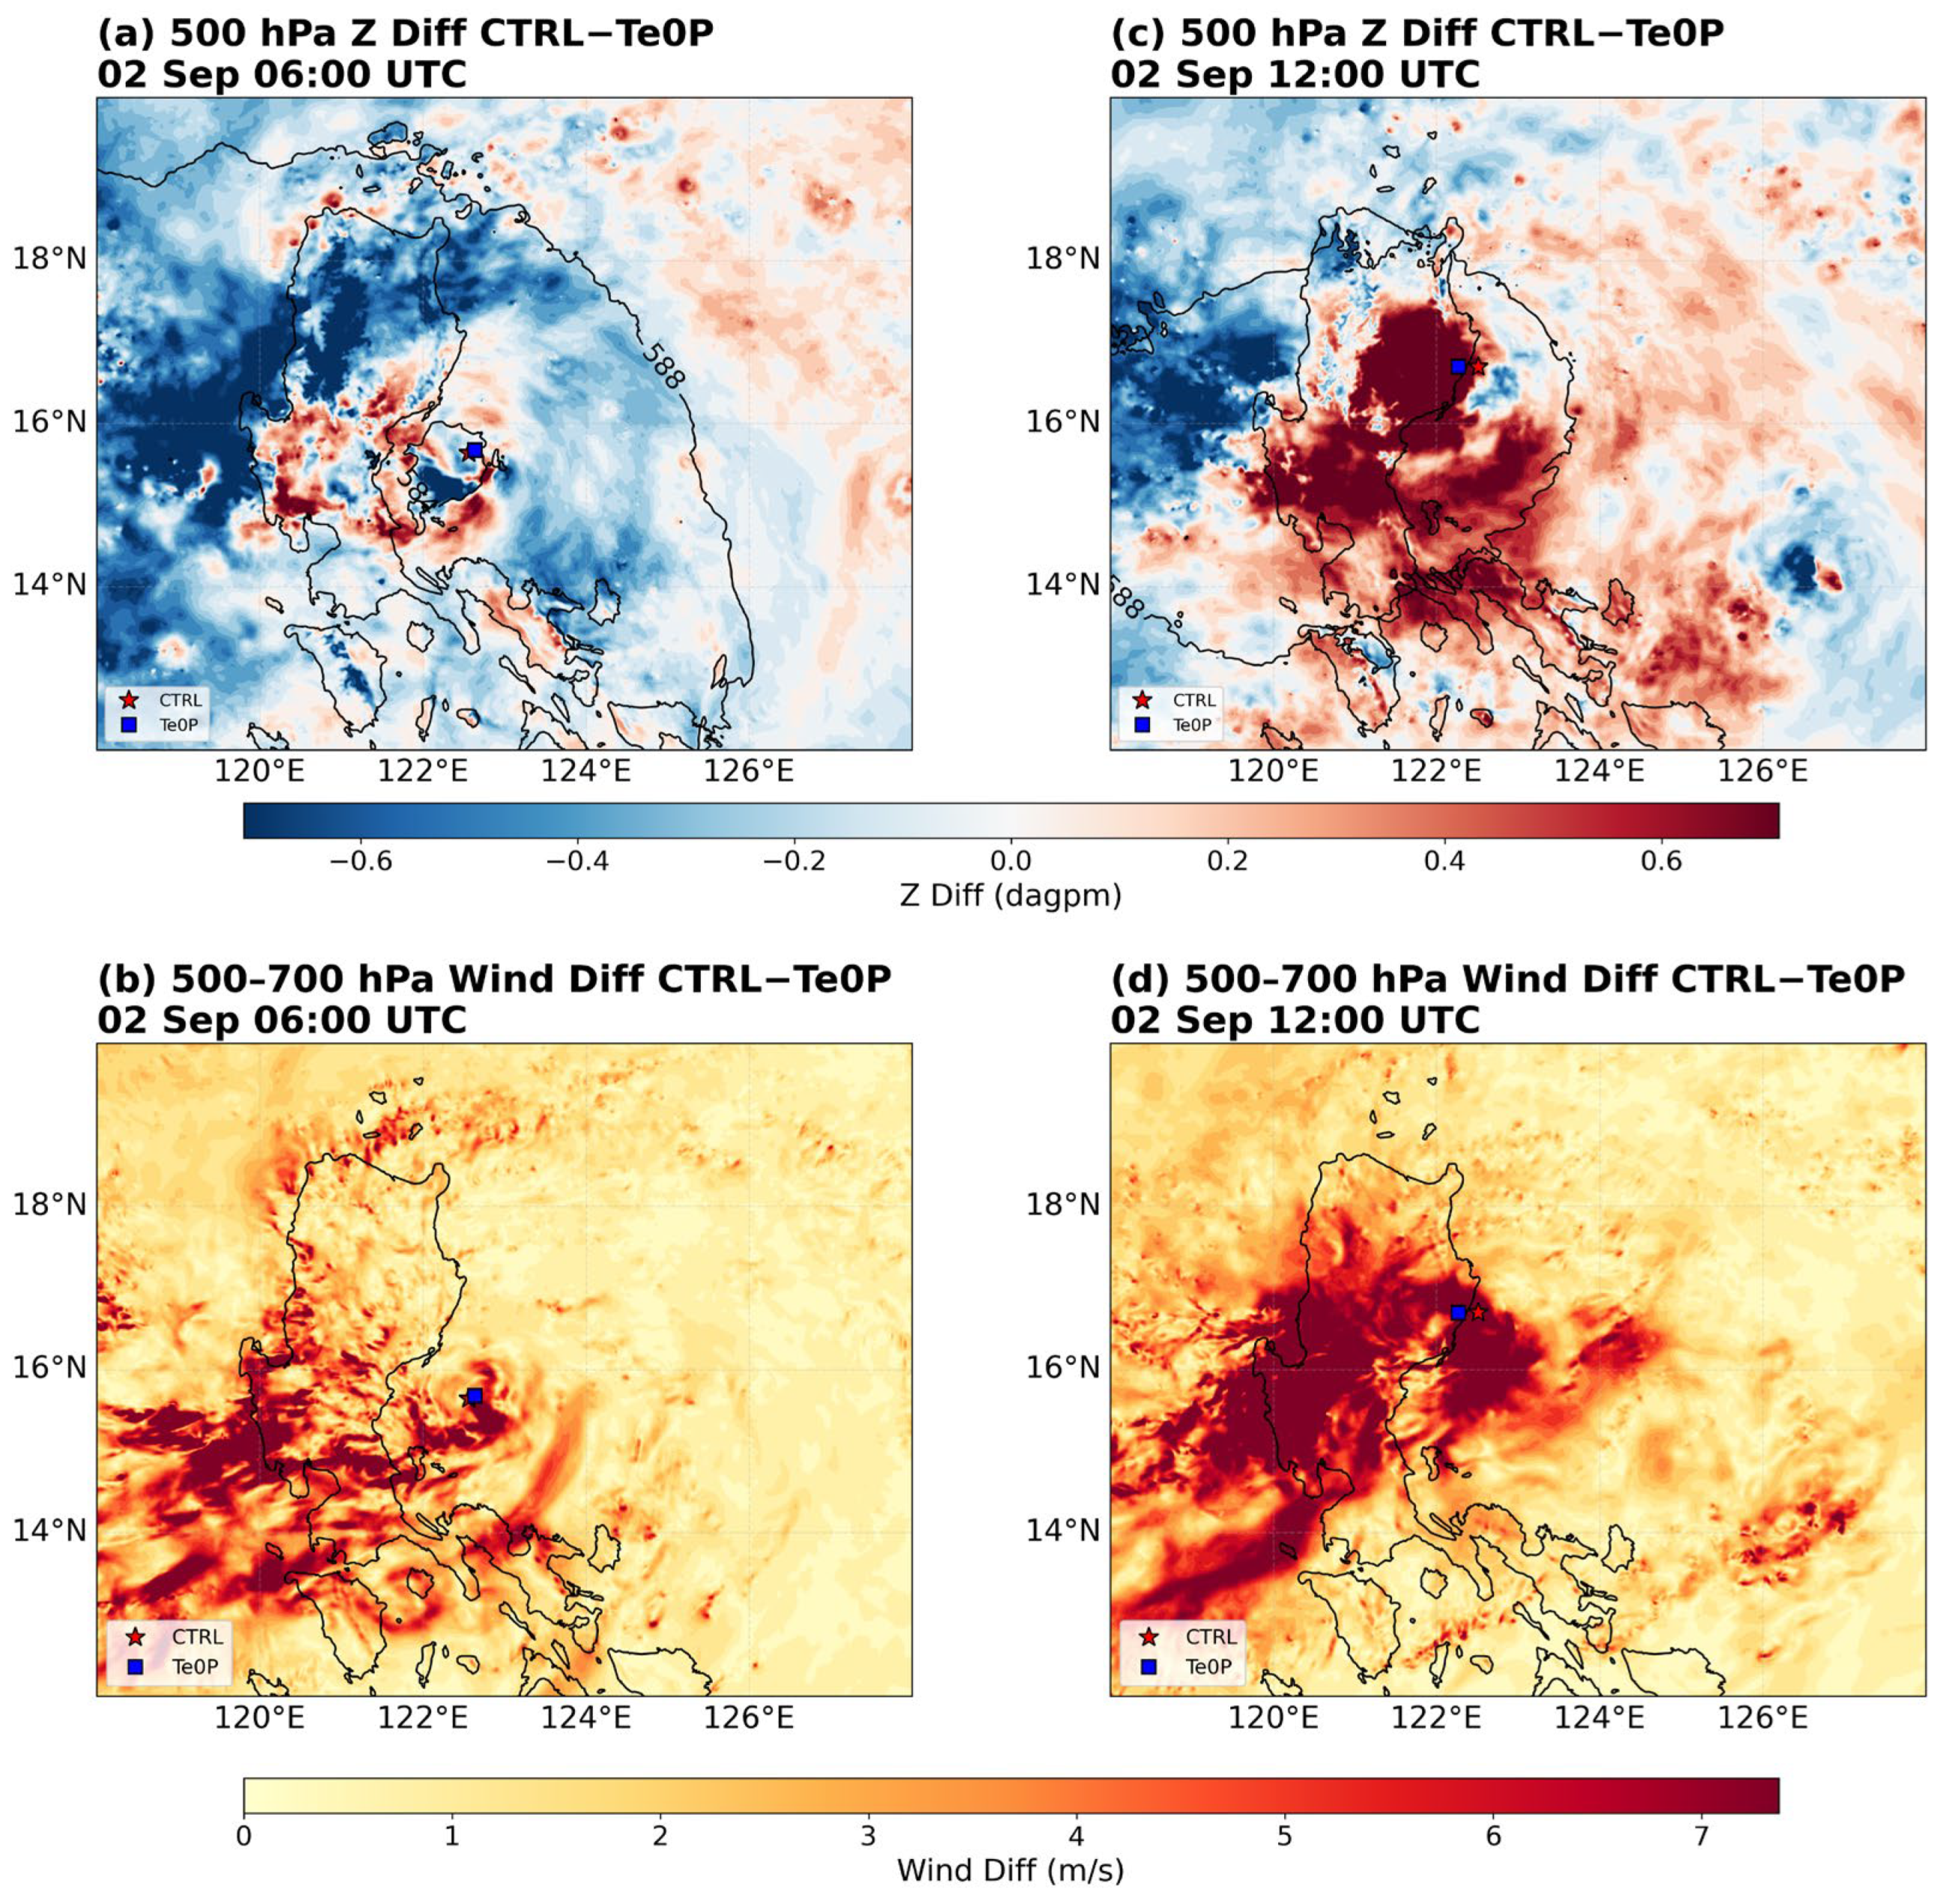
Figure 7 shows the mid-tropospheric field differences between CTRL and Te0P. At 0600 and 1200 UTC 2 September, the 500 hPa geopotential-height difference and the three-level mean wind-speed difference are concentrated near Luzon and within the outer TC circulation. Both the extent and magnitude of the differences increase markedly by 1200 UTC, indicating that terrain-height changes substantially modify the surrounding mid-tropospheric environment. Because the TC centers in the two experiments have already separated, strong differences near the centers include contributions from environmental adjustment as well as differences in vortex position and structure; they should not be interpreted entirely as direct terrain forcing.
In combination with the track, annular environmental flow, streamline, and PVTh results, the CTRL−Te0P differences indicate that Luzon terrain can reorganize the mid-tropospheric flow through blocking, flow splitting, and terrain–vortex interaction, and thereby modify the asymmetry of horizontal PV advection. The terrain-dynamic response is therefore the main factor separating the CTRL and Te0P tracks.
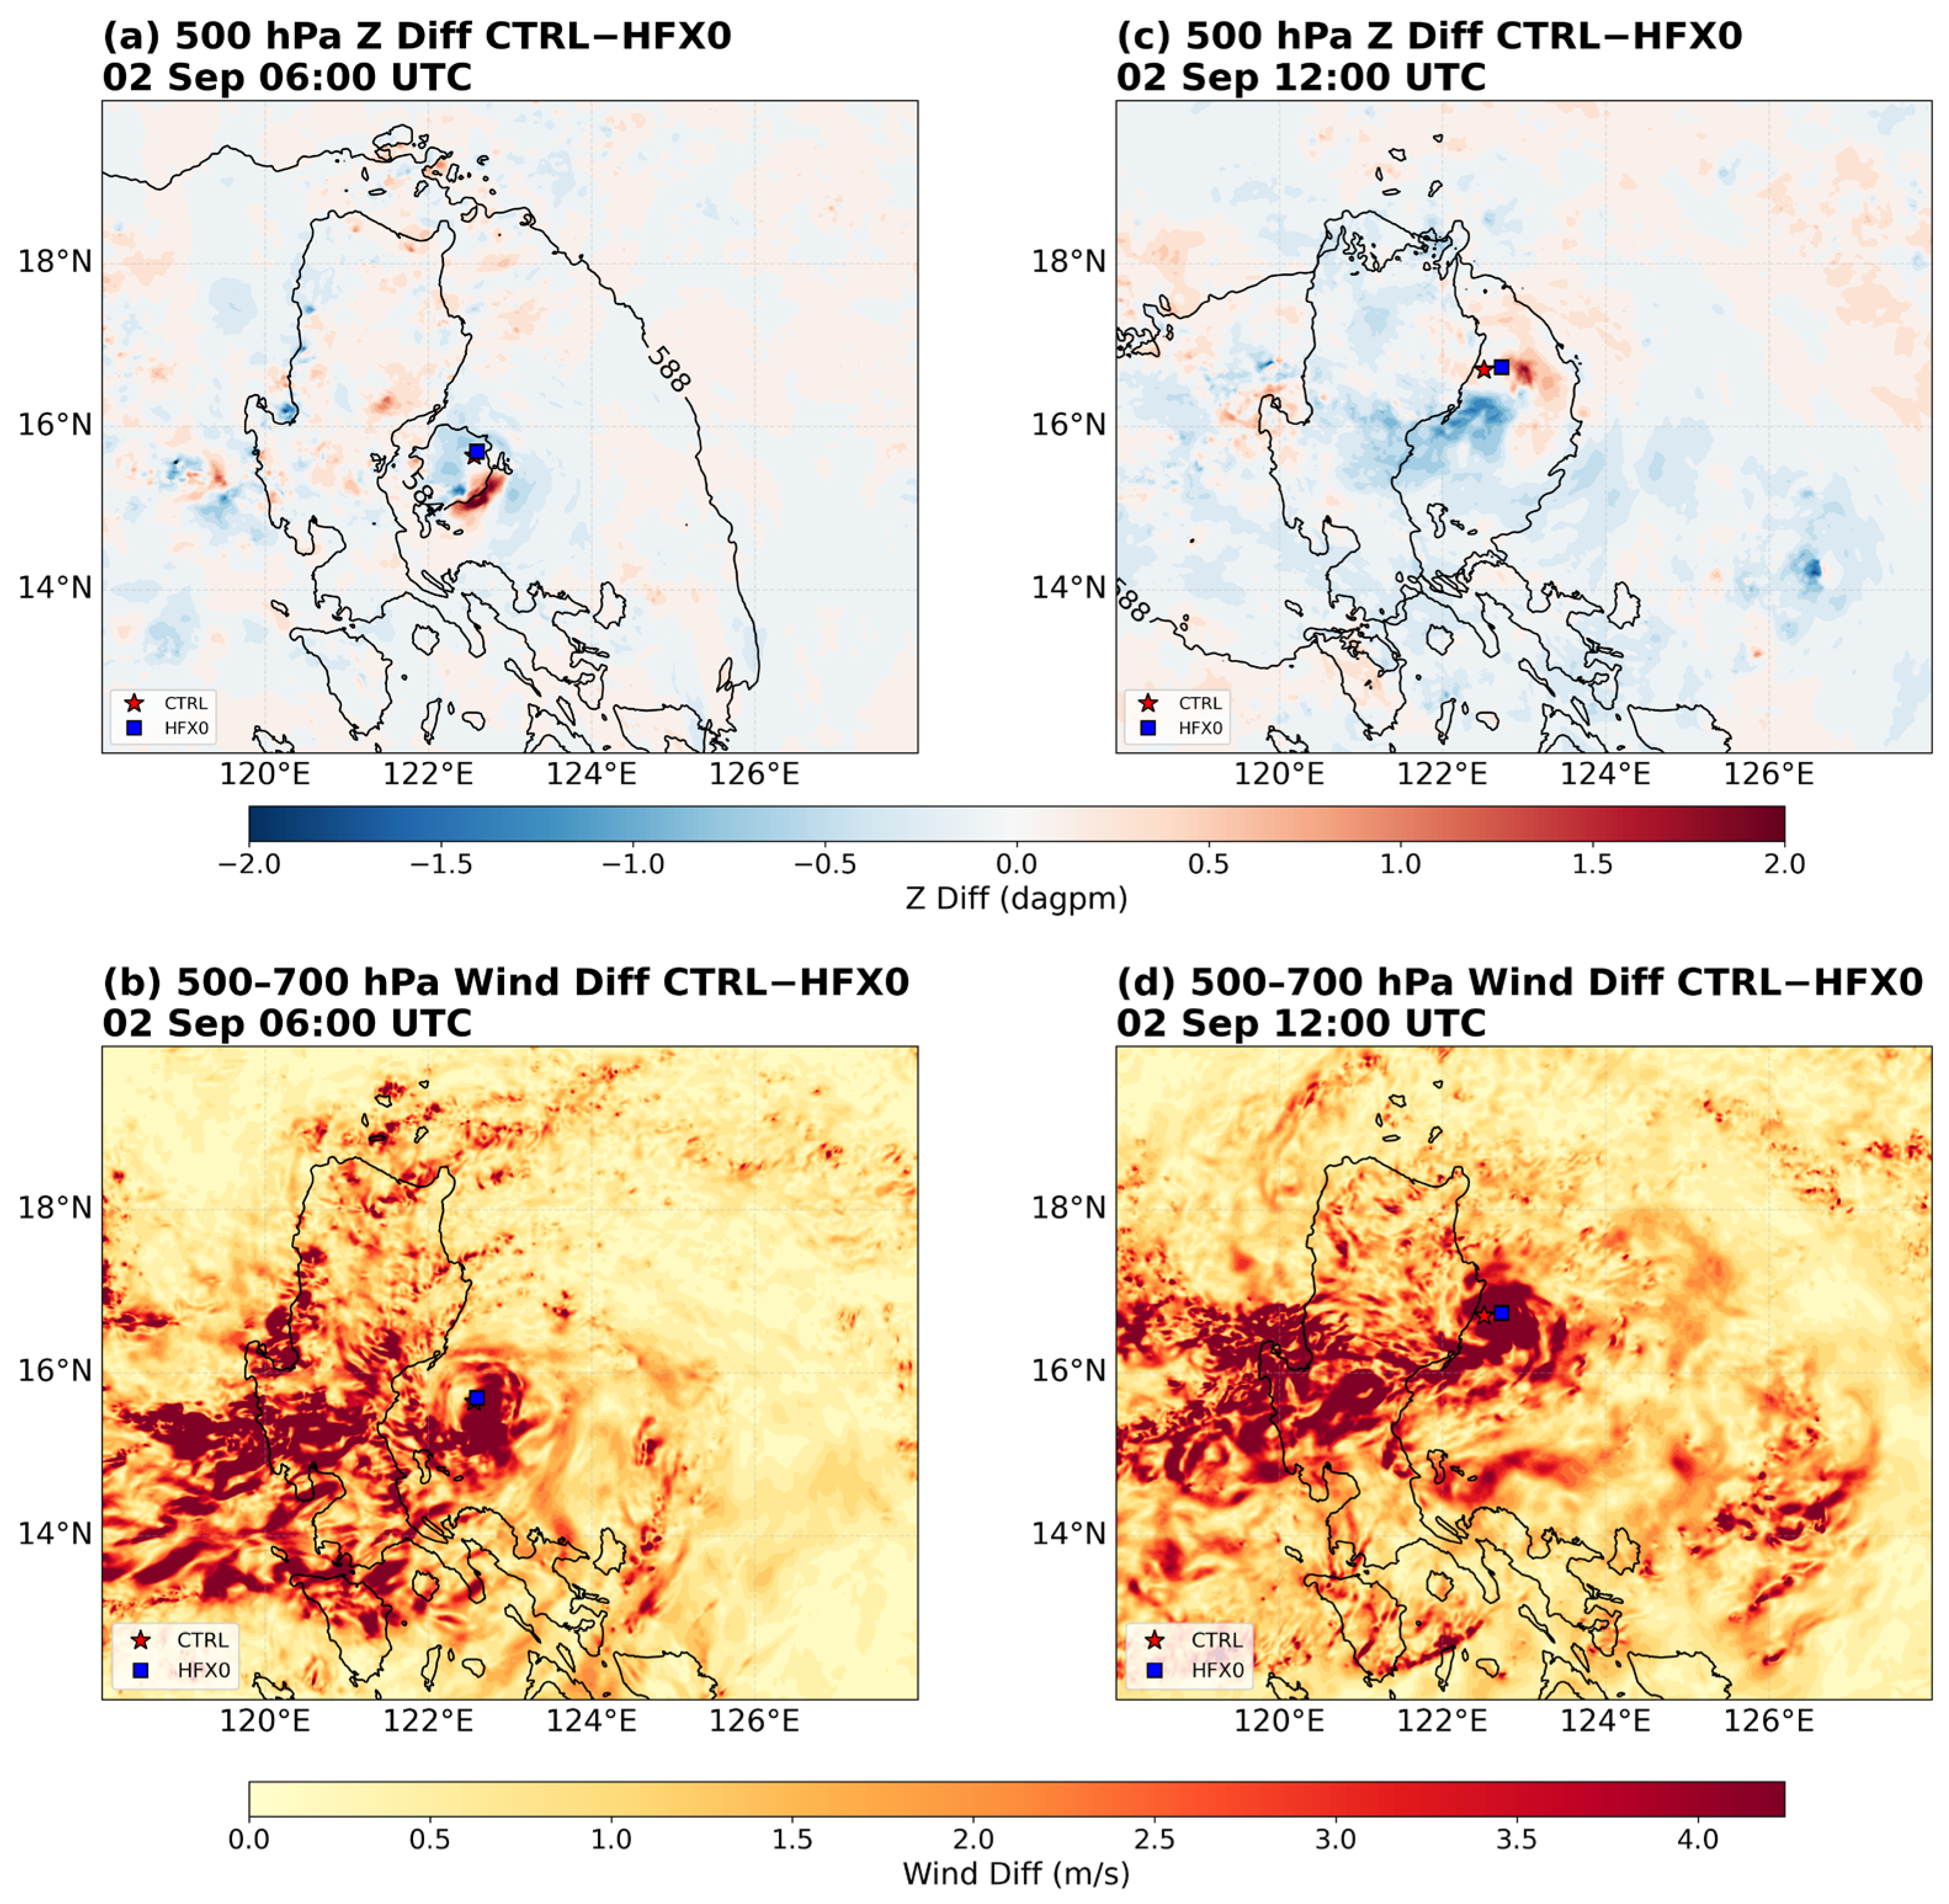
Figure 8 shows the corresponding CTRL−HFX0 differences. Compared with
Figure 7, the three-level mean wind-speed differences are smaller in magnitude and more localized, mainly around the TC inner region, rainbands, and land areas. The 500 hPa geopotential-height difference is also primarily local and does not exhibit an adjustment over the same spatial extent as in the terrain experiment. Land sensible heat flux can therefore affect local thermal structure, boundary-layer convergence, and the near-center wind field, but its overall effect on the surrounding mid-tropospheric environmental flow and PVT
h configuration is weaker than that of terrain-height changes.
Thus, in this case, land sensible heat flux primarily provides a local and secondary modulation rather than the dominant cause of the northward CTRL track bias.
Taken together, the track, environmental-flow, mid-tropospheric circulation, PVT
h, and difference-field diagnostics are summarized conceptually in
Figure 9. Terrain-height changes substantially reorganize the surrounding mid-tropospheric circulation and, during the key interaction period, strengthen the northward environmental-flow component while modifying the spatial configuration of positive PVT
h anomalies, thereby favoring a stronger northward track response. In contrast, the relatively small CTRL–HFX0 track and circulation differences indicate that land sensible heating mainly provides more localized, secondary adjustment.
Figure 9 is a conceptual synthesis of multiple diagnostics rather than a strict one-variable-to-track causal mapping.
4. Discussion
These findings imply that the influence of Luzon’s complex terrain cannot be reduced to the fixed deflection relationships obtained in some idealized Taiwan experiments. In the present case, enhanced terrain amplifies the northward rather than southward track response. This contrast indicates that terrain height alone does not determine the sign of deflection; the response depends on storm–terrain geometry, the background environmental flow, and the spatial configuration of the island terrain and coastline. Over Luzon, blocking, flow splitting, and flow-around effects first modify the lower-tropospheric circulation and can extend their influence upward through pressure adjustment, mass continuity, vertical momentum transport, and vortex-structure adjustment. The diagnosed 500–700 hPa environmental-flow and PVT
h changes should therefore be interpreted as the integrated mid-tropospheric response to terrain–vortex interaction rather than as a direct mechanical forcing of the TC toward a fixed direction. An observational study of TCs crossing Mindanao and the Visayas also found that track-deflection behavior differed between island groups and between weaker and stronger storms [
46]. Although that study did not isolate a causal terrain mechanism, its results support the cautious interpretation that terrain-related track responses may depend on island configuration and storm intensity.
From a model-error perspective, the closer Te0P track does not imply that a no-terrain atmosphere is more realistic. ERA5 already exhibits a clear northward environmental-flow component and positive PVTh anomalies on the northern side of the cyclone, indicating that the real environment contained a dynamical background favorable for poleward turning. The main CTRL problem is therefore not the creation of an entirely spurious northward signal, but a likely over-strong terrain-related circulation adjustment and track response under the present model configuration. Removing terrain suppresses this response and shifts Te0P westward, reducing the geometric track and motion-direction errors. However, Te0P has the smallest motion-direction error while its PVTh orientation is not the closest to ERA5. Its track improvement is therefore best interpreted as dynamical compensation rather than as a uniformly improved dynamical state. This result also cautions against judging the realism of an individual physical process solely from whether a sensitivity experiment produces a smaller track error.
The PVTh results further show that horizontal PV advection is a useful link between changes in the mid-tropospheric flow and the track response, but it is not a unique predictor of TC motion. The present PVTh diagnostic isolates only the horizontal-advection contribution and does not separately quantify diabatic PV generation associated with asymmetric latent heating. Because Yagi was still developing during the analyzed period, asymmetric convective heating, rainband reorganization, boundary-layer convergence, and vertical vortex alignment may also affect displacement or reorganization of the low-level center. An auxiliary circulation-center check at 850, 700, and 500 hPa did not show a systematic correspondence between vertical alignment and the inter-experiment track differences during the key deflection period. Vertical-structure evolution may therefore modulate individual early-stage center displacements, but it does not appear to be the primary explanation for the improved Te0P track.
Consistent with this limitation, Wang et al. [
47] showed that terrain blocking produced an asymmetric rainfall pattern during Typhoon Fanapi (2010) and that the associated asymmetric latent heating caused a temporary reduction in translation speed. Their PV-tendency diagnosis explicitly included horizontal PV advection, vertical PV advection, and diabatic heating, confirming that the horizontal-advection PVT
h term examined here represents only one component of the complete PV tendency. Compared with terrain-height sensitivity, the track response to land sensible heat flux is substantially weaker in this case. The similarity between CTRL and HFX0 and the more localized CTRL−HFX0 differences indicate that land sensible heating mainly perturbs boundary-layer thermodynamics and nearby circulation. Such perturbations may indirectly affect the developing vortex through changes in stability, turbulent mixing, low-level convergence, and convective asymmetry, but these pathways and the complete diabatic PV budget were not quantified separately here. The present evidence therefore supports a local and secondary sensitivity to land sensible heating, rather than a claim that CTRL contains a systematic sensible-heat bias or that sensible heating is the primary cause of the northward track error.
Several limitations remain. The ERA5 midlevel circulation center is offset from the CMA best-track center, so annular environmental-flow estimates centered on the CMA position may be affected by center mismatch. In addition, each WRF experiment uses its own simulated center for the annular average, so inter-experiment differences contain both genuine environmental changes and sampling differences caused by track separation. The CTRL−Te0P and CTRL−HFX0 difference fields also combine center displacement, intensity evolution, and structural deformation and therefore cannot be interpreted as pure responses to a single forcing. Finally, the conclusions are based on one early-stage TC case. Their generality should be tested with storms of different intensities, approach angles, terrain configurations, and environmental-flow regimes. A useful future direction is to convert high-resolution physical descriptors—such as terrain height, slope and orientation, storm–terrain geometry, land–sea contrast, blocking and flow-splitting indices, and terrain-induced circulation or PVTh asymmetries—into physically interpretable predictors for deep-learning track frameworks. Such a physics-informed approach could test whether the terrain-dynamic signals identified here improve track prediction near complex islands while retaining dynamical interpretability.
5. Conclusions
Using WRF control and sensitivity experiments together with the CMA best track and ERA5 reanalysis, we examined how Luzon topography and land sensible heat flux affected the simulated early-stage track of Typhoon Yagi (2024), with particular emphasis on the likely source of the northward CTRL track bias. The main conclusions are as follows.
Luzon terrain dynamics are the dominant source of the track differences among the sensitivity experiments. CTRL lies markedly north of the CMA best track; Te0P shifts westward and closer to observations, whereas Te2P further amplifies the northward bias. HFX0 remains much closer to CTRL. Together with the northward dynamical background present in ERA5, these results suggest that the CTRL bias is more consistent with a likely over-strong terrain-related circulation adjustment and northward track response under the present model configuration than with an entirely spurious northward signal.
Terrain-height changes affect the track mainly through stage-dependent reorganization of the surrounding mid-tropospheric circulation and PVTh asymmetry. During the key interaction period, Te2P develops a stronger 500–700 hPa northward environmental-flow component and resultant speed, whereas Te0P remains weaker; the zonal component does not show a persistent monotonic response. Te0P nevertheless has the smallest motion-direction error while its PVTh orientation differs substantially from ERA5, indicating dynamical compensation and confirming that PVTh orientation must be interpreted together with environmental flow and actual TC motion.
Land sensible heat flux provides a weaker, more localized modulation of the early-stage track than terrain dynamics. HFX0 remains close to CTRL in both track and surrounding mid-tropospheric flow, while CTRL−HFX0 differences are more localized than CTRL−Te0P differences. The sensible-heat effect is therefore most consistent with secondary adjustment of boundary-layer thermodynamics and nearby circulation rather than the primary cause of the CTRL northward bias.
The principal advantage of this study is the separation of terrain-dynamic sensitivity from land-surface thermal sensitivity for an organizing TC, while evaluating the resulting track response jointly with environmental-flow and PVTh diagnostics. The results show that geometric track improvement in a sensitivity experiment does not necessarily imply a uniformly more realistic dynamical structure, an important consideration for physical attribution of track errors near complex islands.
The conclusions are based on a single case and remain subject to uncertainties associated with center mismatch, track-dependent sampling, and vortex-position and structural differences in the difference fields. Their applicability should therefore be tested with additional storms spanning different intensities, approach tracks, terrain configurations, and environmental-flow regimes.