Article

Carbon Emission Characteristics and Differentiated Control Strategies of Highway Construction Based on Cluster Analysis


1
Guangdong Provincial Transport Planning and Research Center, Guangzhou 510101, China
2
Shandong Provincial Communications Planning and Design Institute Group Co., Ltd., Jinan 250031, China
3
School of Civil and Transportation Engineering, Guangdong University of Technology, Guangzhou 510006, China
4
Guangzhou Beierhuan Transportation Technology Co., Ltd., No. 78, Nonglinxia Road, Yuexiu District, Guangzhou 510000, China
*
Author to whom correspondence should be addressed.
Atmosphere 2026, 17(9), 813; https://doi.org/10.3390/atmos17090813 (registering DOI)
Submission received: 17 July 2026 / Revised: 20 August 2026 / Accepted: 21 August 2026 / Published: 23 August 2026
(This article belongs to the Section Air Pollution Control)

Abstract

Low-carbon construction of highway projects constitutes a critical pathway toward achieving the carbon peaking target in the transportation sector. Existing studies have been unable to simultaneously address the identification of carbon emission sources across different engineering types and the delineation of responsible entities for implementing management strategies. This study employs the emission factor method to conduct construction-phase carbon emission accounting for a mountainous expressway in Guangdong Province, China, and reveals significant clustering characteristics of highway construction carbon emissions along two dimensions: the proportion of total emissions and the proportion of material-derived carbon emission sources. Based on K-Means cluster analysis, nine engineering categories—temporary works, subgrade works, pavement works, bridge/culvert works, tunnel works, intersection works, traffic engineering works, greening works, and other works—are classified into four types. Accordingly, a dual-factor classification framework is established, comprising “Core–Material Dominant (CMD)”, “Core–Mixed Balanced (CMB)”, “Peripheral–Material Dominant (PMD)”, and “Peripheral–Mixed Balanced (PMB)”. Differentiated carbon abatement strategies are proposed for each engineering type, with explicit definition of implementation stages and primary responsible entities. Application of the proposed framework to the case project achieved a total carbon abatement of 5.2% during the construction phase. This research provides systematic methodological support for differentiated carbon emission mitigation in highway construction.

1. Introduction

Global climate change has emerged as a significant challenge confronting humanity, with carbon dioxide being one of the primary greenhouse gases (GHGs). The Paris Agreement, adopted in 2015, established long-term targets for limiting global temperature rise, prompting nations worldwide to formulate carbon abatement roadmaps. China has put forward the strategic objectives of achieving carbon peaking by 2030 and carbon neutrality by 2060, hereinafter referred to as the “Dual Carbon” goals, with recent policy attention focused on key sectors such as power generation, steel, cement, and aluminium smelting. The highway construction sector, given its substantial scale and considerable carbon emissions during the construction phase, is poised to contribute critically to the realization of China’s “Dual Carbon” goals [1].
Accurate carbon emission accounting constitutes the foundation for formulating carbon abatement strategies. Regarding carbon accounting methods, numerous studies have drawn upon the theory of Life Cycle Assessment (LCA) [2], wherein the system boundary typically encompasses processes such as material production and transportation, energy production, and on-site combustion [3]. In engineering practice, the emission factor method has become the predominant carbon accounting method [4], attributable to its advantages in data accessibility and direct compatibility with design documentation. This methodological preference is further corroborated by the Standard for Calculation of Building Carbon Emissions (GB/T 51366-2019) [5], issued by the Ministry of Housing and Urban-Rural Development of the People’s Republic of China (MOHURD), which likewise adopts the emission factor method for calculating carbon emissions in building construction works. Regarding carbon emission factors, recent reviews underscore the importance of emission factor databases and their considerable regional variability, and machine learning methods are now being used to improve factor-based carbon accounting and LCA modelling [6,7].
Previous studies on carbon emission characteristics have primarily focused on two aspects: the differences in carbon emission intensity among various engineering types, and the structural characteristics of carbon emission sources. Research findings indicate that transportation structures such as bridges and tunnels exhibit significantly higher carbon emission intensity than ancillary works such as temporary works and greening works [8]. Regarding the composition of carbon emission sources, material-derived carbon emission sources generally account for over 75% of the total. Machinery-derived carbon emission sources account for less than 25% [9,10,11]. The proportion of material-derived emissions is particularly high for bridges and tunnels [12,13]. Multi-project analyses further reveal systematic regional gradients, with dominant emission sources shifting from subgrade and interchange works in lowland regions to bridges and tunnels in mountainous regions [14]. In the field of carbon abatement technologies, existing studies have generally concentrated on the assessment of carbon abatement effectiveness for specific technical measures. These measures include geotechnical carbon abatement measures [15], the impact of material substitution on carbon emissions [16,17], and the influence of electrification on carbon emissions from construction machinery [18,19,20].
A comprehensive analysis of the previous literature reveals two research deficiencies. First, the findings from the analysis of carbon emission characteristics have not been effectively translated into foundations for carbon abatement decision-making. There remains a significant disconnect between feature identification and abatement strategies. Second, existing carbon emission mitigation technologies exhibit a fragmented nature. Their integration with engineering management procedures remains insufficient. Consequently, critical managerial issues regarding the timing of implementation and responsible entities for implementation remain unresolved. Recent years have seen artificial intelligence and automation enter sustainable construction management [21], yet these techniques have not been translated into carbon abatement decision frameworks for highway construction.
To address the research gaps, this study selects a mountainous expressway in Guangdong Province as the case project and conducts systematic construction-phase carbon emission accounting. Cluster analysis is employed to identify characteristic patterns along two dimensions: the dimension of total carbon emission proportion and the dimension of carbon emission source composition. A dual-factor classification matrix is subsequently constructed, categorizing nine types of subdivisional works into four distinct types. Differentiated carbon abatement strategies are then designed for each engineering type. The implementation stages and responsible entities for each strategy are explicitly defined. Finally, the effectiveness of the proposed framework is validated on the actual case project. Although the contribution of construction-related emissions to the total emissions over the highway life cycle is expected to be minimal, this study may still be academically meaningful, as it provides a systematic decision-making tool that is replicable and implementable for carbon emission mitigation in highway construction. The novelty of this study is the dual-factor classification matrix proposed here. Built on the total emission proportion and the material-derived emission proportion, this matrix offers a new way to set differentiated mitigation priorities while explicitly identifying implementation stages and responsible entities.

2. Materials and Methods

2.1. Carbon Emission Accounting Method

2.1.1. Accounting Method

Carbon emission accounting primarily encompasses three methodological approaches: the material balance method, the emission factor method, and the direct measurement method. The emission factor method represents a simplified form of the material balance method. It directly utilizes engineering quantities and machinery working shifts data from highway engineering design documentation as activity level data. This approach significantly reduces data acquisition difficulty and enables disaggregated accounting at the engineering hierarchy. This study adopts the emission factor method, and its fundamental calculation expression is:
CO2 emissions = ∑(emission factor × activity level data)

2.1.2. System Boundary

The research objects of this study are highway construction-phase carbon emissions. The system boundary encompasses two categories of carbon emissions: (1) carbon emissions from material production, which refer to carbon dioxide emissions generated during the upstream production stage of all building materials used in construction; and (2) carbon emissions from construction machinery, which refer to carbon dioxide emissions produced during energy production, transportation, and on-site combustion of energy sources (electricity, gasoline, and diesel) consumed by transportation machinery and construction machinery.

2.1.3. Accounting Model and Data Sources

This study adopts a “bottom-up” accounting approach. Following the highway engineering management hierarchy, construction projects are decomposed into three hierarchical levels: “unit works–subdivisional works–work items.” Work items serve as the minimum accounting units. The carbon emissions of each work item consist of two components: carbon emissions from material production and carbon emissions from energy consumption by construction machinery, both calculated following the principle of Equation (1). The calculation formula is expressed as follows:
E F X = i = 1 n E i × E F i + j = 1 n N j × F j × E F j
where E F X denotes the construction-phase carbon emissions of a given work item (t CO2),
E i is the material consumption of material i (t or m3), sourced from the cost estimation chapters of engineering design documentation,
E F i is the carbon emission factor of material i during its production stage (t CO2/t or t CO2/m3). This project encompasses 165 material categories, including blended materials and pavement mixtures, metals and metal products, fundamental energy materials and products, chemical raw materials and products, mineral-soil materials and products, and specialized engineering materials. Carbon emission factors were obtained through a literature review and field measurements by the research team, following the localized latest-factor priority principle. The carbon emission factors for selected primary materials are as follows: HRB400 steel rebar, 3.589 t CO2/t; ordinary Portland cement (Grade 42.5), 0.920 t CO2/t.
N j is the working shift consumption of equipment j (shifts), sourced from the cost estimation chapters of engineering design documentation,
F j is the fuel and electricity consumption per working shift in equipment j (kg or kWh). This project involves 112 equipment types, including pile driving equipment, horizontal transportation machinery, lifting and vertical transportation machinery, and concrete mixing equipment. Energy consumption data were sourced from the Quota of Highway Construction Machinery Working Shift Costs (JTG/T 3833—2018) [22].
E F j is the comprehensive emission factor for energy production and on-site combustion, incorporating emissions from energy extraction, processing, and transportation. The emission factors adopted in this study are electricity, 0.000581 t CO2/kWh; gasoline, 4.24 t CO2/t; diesel, 4.6 t CO2/t.
Upon completion of carbon emission calculations at the work item level, progressive upward aggregation is conducted to obtain carbon emissions for subdivisional works, unit works, construction sections, and ultimately the total carbon emissions for the entire highway construction phase.
It should be noted that the accounting results are subject to the uncertainty inherent in emission inventories, which in this study arises mainly from three sources. (i) Emission factors: although the factors were selected following the localized latest-factor priority principle and supplemented by field measurements of the research team, reported values for the same material still differ inherently across databases and the literature—for steel and cement in particular, the discrepancy across sources can reach ±20% or more, and the documented range of steel emission factors even exceeds twice the mean value [23]. (ii) Activity data: the material quantities and machinery shifts used in this study were taken from the cost estimation chapters of the engineering design documentation and have undergone budgetary review, so their uncertainty is considered negligible. (iii) Engineering assumptions: parameters such as transport distances and machinery shift efficiency were assigned from quota standards and empirical values, which entails some approximation. It should be emphasized, however, that the subsequent classification analysis is based on relative proportion indicators (the total emission proportion and the material-derived emission proportion) rather than absolute amounts: systematic biases in emission factors act proportionally on both the numerator and the denominator and therefore largely cancel out in the ratios. Consequently, the inventory uncertainty is not transferred proportionally to the proportion indicators, and its influence on the classification framework of this study is limited.

2.2. Analysis Methods of Carbon Emission Characteristics

2.2.1. Proportion of Carbon Emissions from Each Engineering Type

The proportion of carbon emissions from each engineering type measures the ratio of carbon emissions from a specific engineering type to the total carbon emissions from all engineering types within the corresponding construction section. This metric reflects the relative importance of that engineering type in the overall carbon emission profile. A higher value indicates greater carbon abatement potential.
Proportion of Carbon Emissions from Each Engineering Type i = Total Carbon Emissions of Engineering Type i Sum of Carbon Emissions from All Engineering Types in the Section × 100 %
where i denotes the engineering type, including Temporary, Subgrade, Pavement, Bridge/Culvert, Tunnel, Intersection, Traffic, Greening, and Others.
In Section 3.2.1, we will calculate and present the share of carbon emissions for each engineering type across different construction sections, derived from Equation (3).

2.2.2. Proportion of Material-Derived Carbon Emissions

The proportion of material-derived carbon emissions is employed to analyze the ratio of material-derived carbon emissions from a specific engineering type to the sum of material-derived carbon emissions and machinery-derived carbon emissions from that same type. This metric reflects the dominant share of material carbon emissions within that engineering type. A higher value indicates that the focus of carbon abatement targets should be directed toward material-derived carbon emission sources.
Material Carbon Emission Proportion = Emat/(Emat + Emach) × 100%
where E m a t and E m a c h are the material-derived carbon emissions and machinery-derived carbon emissions (t CO2).

2.2.3. Classification Based on the K-Means Clustering Algorithm of the Proportion of Material-Derived Carbon Emissions

Cluster analysis partitions samples into groups with minimized intra-group differences and maximized inter-group differences. This principle corresponds directly to the objective of carbon emission characteristic analysis: engineering works with similar emission source structures are expected to fall into the same group, so that a common abatement pathway can be formulated for each group. Cluster analysis partitions samples into groups such that intra-group differences are minimized while inter-group differences are maximized. Carbon emission characteristic analysis shares this objective: engineering works with similar emission source structures are expected to fall into the same group, so that a common abatement pathway can be formulated for each group. The validity of this approach has been demonstrated in emission pattern studies at the regional and sectoral levels [24,25]. On this basis, the K-Means algorithm is specialized for the present problem in three aspects. First, the material-derived emission proportion is adopted as the clustering variable, because it characterizes the emission source structure of each work type and thus determines the direction of its abatement pathway: material-dominant types call for design-phase material substitution, whereas machinery-dominant types call for construction-phase scheme optimization. Second, each clustering sample is constructed as a “work type × construction section” pair, yielding 30 non-zero samples, so that the classification reflects cross-section commonalities rather than the particularities of any single section. Third, the number of clusters k is determined jointly by the Elbow Method and the Silhouette Coefficient, and the resulting k = 2 carries an explicit engineering interpretation, namely, the material-dominant type and the mixed-balanced type.
To objectively classify the proportion of material-derived carbon emissions for subdivisional works in highway construction, and to avoid classification bias arising from subjective threshold selection, this study employs the K-Means clustering algorithm for unsupervised classification of sample data. To determine the optimal number of clusters, two validation metrics are simultaneously adopted: the Elbow Method and the Silhouette Coefficient.
The Elbow Method determines the optimal number of clusters by evaluating the Sum of Squared Errors (SSE) corresponding to different k values. As k increases, the SSE decreases monotonically. The optimal k is located at the elbow point where the rate of SSE decline sharply decelerates. This indicates that the marginal gain from further increasing the number of clusters diminishes significantly. The formula is expressed as:
W S S = j = 1 k x i C j x i μ j 2
where k is the number of clusters,
C j is the j-th cluster;
μ j is the centroid of cluster C j ;
x i is the i-th sample point.
The Silhouette Coefficient quantifies clustering quality along two dimensions: intra-cluster compactness and inter-cluster separation. The value range of the Silhouette Coefficient is [−1, 1]. A value approaching 1 indicates compact and well-separated cluster structures. A value near 0 indicates overlap between clusters. A negative value implies misclassification of samples. The calculation formula is:
S ¯ = 1 n i = 1 n ( b ( i ) a ( i ) ) m a x ( a ( i ) , b ( i ) )
where a ( i ) is the average distance from sample i to all other samples within the same cluster, reflecting intra-cluster compactness;
b ( i ) is the average distance from sample i to all samples in the nearest neighbor cluster, reflecting inter-cluster separation.

2.2.4. Analysis of Carbon Abatement Benefits

To evaluate the carbon abatement benefits of different scenarios, this study establishes a calculation model of carbon abatement volume. The carbon abatement volume is defined as the difference in material-derived carbon emissions and machinery-derived carbon emissions between the implementation scenario and the comparative scenario. The calculation formula is expressed as follows:
E = ( E m a t + E m a c h ) ( E m a t + E m a c h )
where E is the carbon abatement volume (t CO2),
E m a t and E m a c h are the material-derived carbon emissions and machinery-derived carbon emissions of the implementation scenario, respectively (t CO2),
E m a t and E m a c h are the material-derived carbon emissions and machinery-derived carbon emissions of the comparative scenario, respectively.

2.3. Case Selection

This study selects a highway in Guangdong Province as the case project (hereinafter referred to as the “case highway”). The project is located in the northern mountainous area of Guangdong Province, China, where red-bed soft rock of the Nanxiong Basin is widely exposed along the corridor. The route has a total length of 41.317 km and adopts the standard of a four-lane expressway, with a design speed of 120 km/h and a subgrade width of 26.5 m. Construction ran from July 2022 to July 2024, and the route was divided into four construction sections built in parallel, each responsible for approximately 10 km of construction works.
Constrained by the mountainous terrain, this project involves a total earthwork volume of 16.20 million m3, comprising 8.49 million m3 of excavation and 7.71 million m3 of embankment filling; all excavated red-bed material was reused in situ as subgrade filler, so that no purchased fill was required. The mainline comprises 33 bridges totaling 7.390 km (29 major bridges and 4 medium bridges), accounting for approximately 17.9% of the route length; all bridge superstructures adopt standardized 25 m prestressed precast concrete box girders, and accessory elements such as drainage ditches were likewise manufactured with standardized precasting. The project further includes 122 culverts, five intersections, and one service area. One tunnel of 0.686 km was envisaged in the preliminary design but was subsequently changed to a deep cutting scheme by the design unit, so that no tunnel was actually constructed. The pavement adopts an asphalt concrete structure, with the surface courses totaling 3.218 million m2 in paved area.
These engineering characteristics directly determined the carbon emission structure of the project. The high earthwork volume imposed by the mountainous terrain and the bridge share of approximately 17.9% make subgrade and bridge/culvert works the dominant carriers of material consumption and machinery use. The full in situ reuse of red-bed material markedly cuts emissions associated with purchased materials and haulage, and the standardized precasting of bridge girders and drainage components further concentrates emissions in the material production stage. Moreover, the four sections were constructed in parallel under the same technical standard during the same period, yielding four comparable construction samples under similar engineering conditions, which provides the data basis for the cluster analysis and the classification framework presented below.

3. Results

3.1. Case Project Accounting Results

In accordance with the methodology described in Section 2.1, this study conducted carbon emission accounting for various engineering types across the scope of responsibility of the four construction sections. The total carbon emissions amount to 628,700 t CO2. The carbon emission intensity per route-kilometer is 15,216 t CO2/km. The carbon emission intensity per lane-kilometer is 3804 t CO2/(km·lane). The average carbon emission intensity of subgrade works is 917 t CO2/(km·lane). The average carbon emission intensity of bridge works is 6948 t CO2/(km·lane). The carbon emission inventory by construction section and engineering type is presented in Table 1.

3.2. Analysis of Emission Structure Characteristics

3.2.1. Feature 1: Dimension of Total Carbon Emissions—Significant Disparity Between Main Works and Ancillary Works

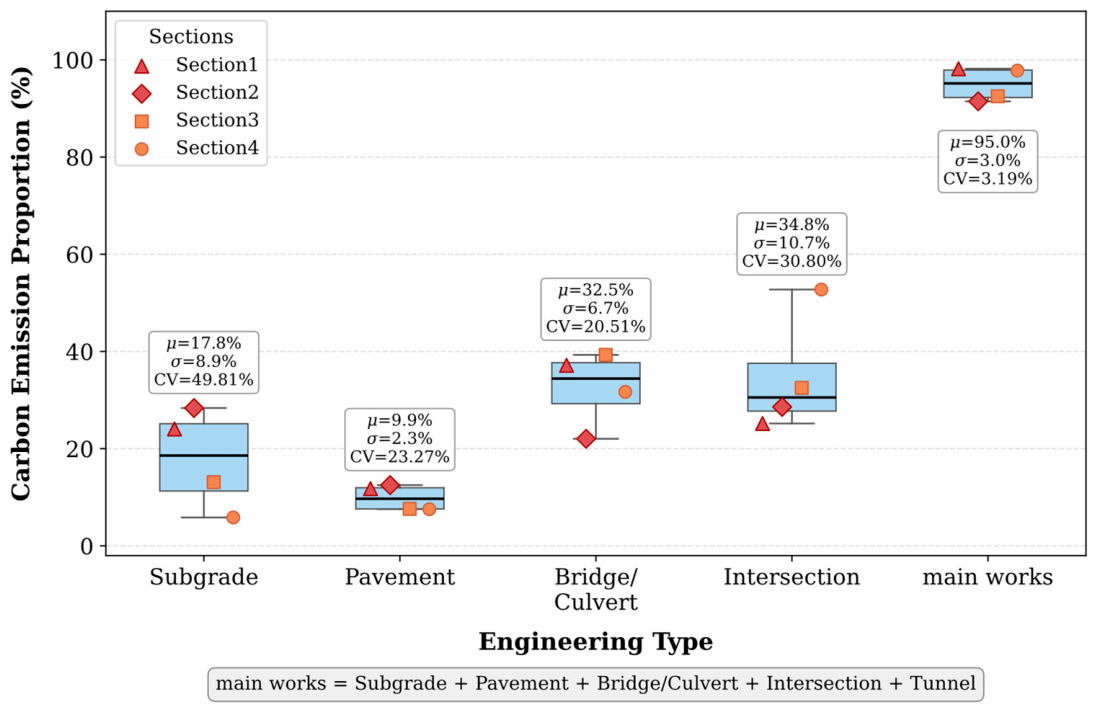
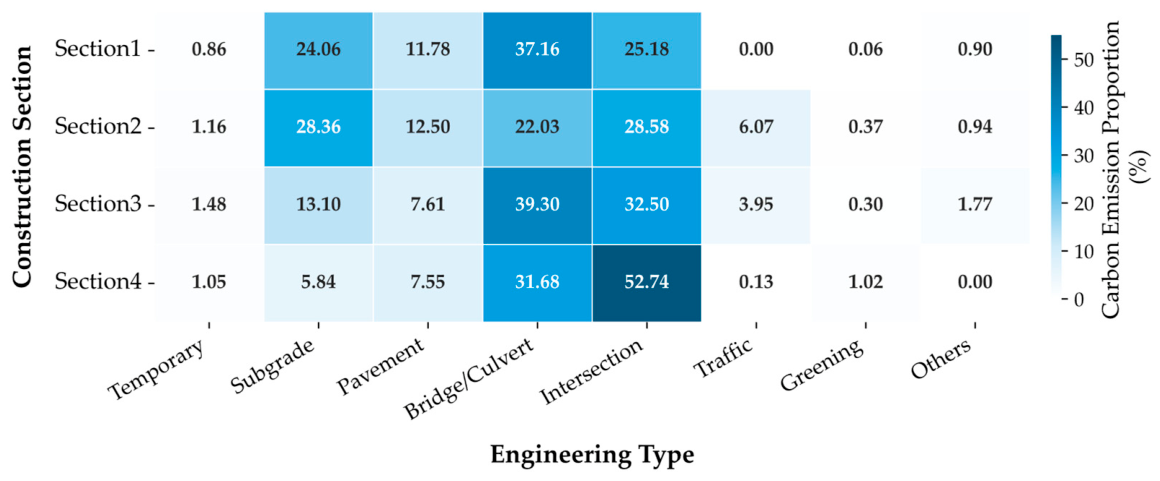
Based on Equation (3), the proportion of carbon emissions from each engineering type relative to the total carbon emissions of the corresponding construction section was calculated, and a carbon emission heatmap was generated. As shown in Figure 1, the average proportions of intersection works, bridge and culvert works, subgrade works, and pavement works are 34.7%, 32.5%, 17.8%, and 9.8%, respectively. These values are generally high; however, the coefficients of variation (CV) are 30.8%, 20.5%, 49.8%, and 23.3%, respectively. This indicates that the engineering type with the highest proportion varies across sections. This variability arises from the heterogeneity of engineering composition among the sections, such as differences in bridge density and the presence or absence of tunnel works. In contrast, temporary works, traffic works, greening works, and other works exhibit relatively low proportions of carbon emissions. The carbon emissions of other works in Construction Section 4 are zero. Compared with published studies, the construction-phase emission intensity of this project, 3804 t CO2/(km·lane), falls within the reported range (approximately 912–1901 t CO2/(km·lane) for projects with low bridge–tunnel ratios and up to 5500–13,733 t CO2/(km·lane) for projects with high bridge–tunnel ratios) [26]. The cross-project data consistently show that the emission intensity increases with the bridge–tunnel ratio; with a bridge share of approximately 17.9%, the moderate intensity of this project is consistent with this pattern.
In highway engineering management, subgrade works, pavement works, bridge and culvert works, intersection works, and tunnel works are collectively designated as main works. These five categories constitute the focal points of engineering cost, safety, and schedule management. This study further analyzes the carbon emission proportion of main works. The mean carbon emission proportion of main works across the four construction sections reaches 94.99%. The standard deviation is merely 3.03%. The coefficient of variation is as low as 3.19%. This extremely low level of variation demonstrates that, despite substantial fluctuations in the carbon emission proportions of individual engineering types across different sections, main works consistently occupy the absolutely dominant position in carbon emissions (approximately 95%). This dominance is maintained with a high degree of consistency across all sections. Therefore, carbon emission mitigation in highway construction should draw upon the established practices of cost, safety, and schedule management. The dominant share of the main works (approximately 95%) is also supported by cross-project evidence: in existing studies, the per-kilometer emissions of bridge/culvert and tunnel works are markedly higher than those of other types (e.g., 18,956.8 t CO2/(km·lane) for bridges in the material production stage alone) [27], indicating that the pronounced disparity between main and ancillary works is a general characteristic of highway construction emissions and that designating the main works as the core mitigation targets is justified across studies. Main works should be designated as the core objects of carbon emission mitigation (Figure 2).

3.2.2. Feature 2: Dimension of Carbon Emission Sources—Clear Distinction Between Material-Dominant and Mixed-Balanced Types

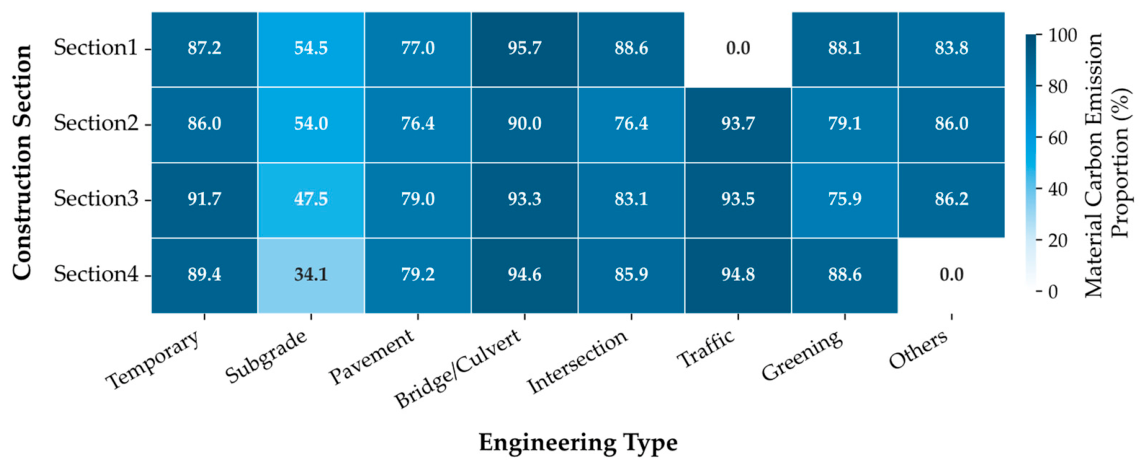
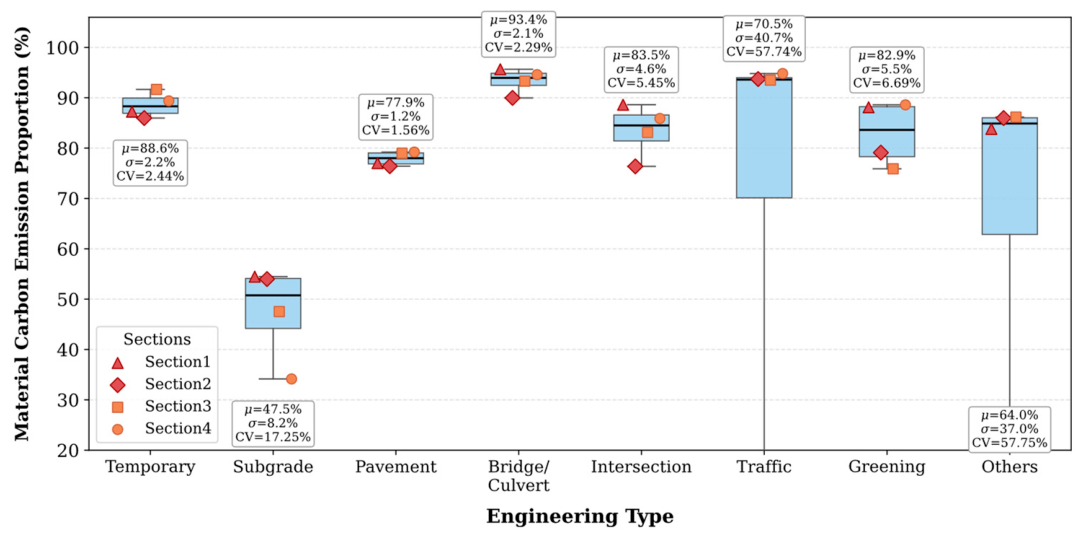
Based on Equation (4), the proportion of material-derived carbon emissions was calculated for each engineering type. The results are presented in Figure 3. The material-derived carbon emission proportion of Bridge/Culvert exceeds 90% across all construction sections. This is the highest proportion among all engineering types. The proportions for Intersection and Greening are also generally high. The proportions for Temporary and Pavement remain stable across all sections, with minimal fluctuation. The proportion for Subgrade is relatively low (34.1–54.5%). Notably, Section 4 records only 34.1%, which is markedly lower than the other sections. For Traffic, all sections except Section 4 report zero; Section 4 records 94.8%. Overall, with the exception of Subgrade, Tunnel, and partial Traffic data, the material-derived carbon emission proportions of most engineering types are concentrated within the range of 75–95%. Bridge and culvert works consistently represent the most significant source of material-derived carbon emissions. Although the final construction scheme of this project contains no tunnel works, a comparative analysis between tunnel and subgrade schemes was conducted during the design phase for the mountainous section of Section 2. In that comparative analysis, the tunnel scheme exhibited a material-derived carbon emission proportion of 91%, which is substantially consistent with the reported values for mountainous expressway tunnels [13,26]. The dominance of the material production stage is likewise a consistent cross-study finding: Wang et al. reported that raw material production accounts for more than 80% of the emissions from highway construction [11], and Gao et al. reported that material production contributes 95.2% of the total emissions of an expressway in central China, with type-specific proportions (97.7% for bridges, 94.3% for tunnels, 88.5% for ancillary facilities, 81.6% for subgrade, and 80.2% for pavement) highly consistent with the concentration of most engineering types within 75–95% observed in this study [26]. Mechanistically, this dominance stems from the energy-intensive upstream production of cement and steel, which together account for approximately 99% of the material-derived emissions [26].
From the perspective of distribution characteristics, the material-derived carbon emission proportions of Traffic, Bridge/Culvert, and Temporary all exceed 83%, while that of Pavement remains slightly lower (76.4–79.2%) but equally stable. Their coefficients of variation (CV) are all below 3%. This indicates that the material-derived carbon emission proportions of these engineering types are highly stable across different construction sections. In contrast, Subgrade (CV = 18.3%) and Greening (CV = 6.3%) exhibit relatively larger fluctuations. Accordingly, the boundary of 83% adopted in this study to distinguish material-dominant from mixed-balanced types falls within the proportion range reported above and is therefore reasonable across studies. In addition, the mean material-derived proportion of subgrade works (47.5%) is markedly lower than the 81.6% reported in comparable research [26], which is attributable to the full in situ reuse of excavated red-bed material in this project (Section 2.3) that substantially reduced the dependence on purchased fill. This indicates that the material-derived emission proportion essentially reflects the dependence of an engineering type on purchased materials, which is the mechanistic basis for its use in identifying the appropriate control lever (the material side or the machinery side). Notably, the proportion of Subgrade in Section 4 (34.1%) is significantly lower than that in other sections, as shown in Figure 4.
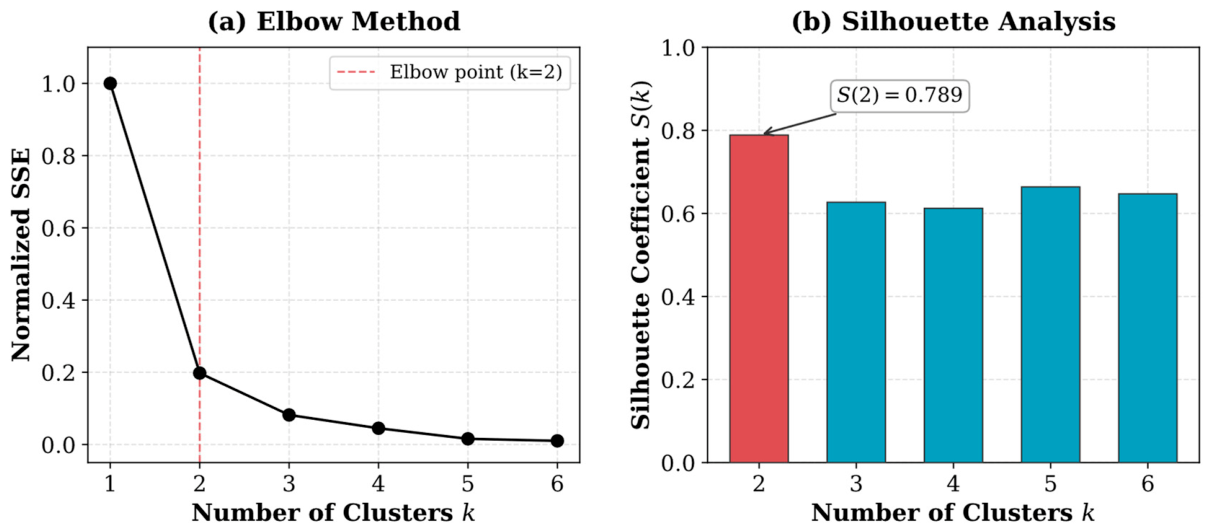
Non-zero data from nine types of subdivisional works across the four construction sections were extracted for cluster analysis. The elbow curve exhibits a distinct elbow point at k = 2, beyond which the SSE decline tends to flatten, and the Silhouette Coefficient reaches its maximum value of 0.789 at k = 2—markedly higher than those at k = 3 (0.627), k = 4 (0.612), k = 5 (0.664), and k = 6 (0.647). Both validation metrics consistently support dividing the sample into two clusters (Figure 5). This binary structure carries clear engineering meaning: the high-value cluster (26 samples, centroid ≈ 86.3%) represents a material-dominated emission structure, whereas the low-value cluster (four subgrade samples, centroid ≈ 47.5%) represents a balanced machinery–material structure, the latter stemming from the full in situ reuse of excavated red-bed material and the intensive earthwork operations described in Section 2.3. When k ≥ 3, the Silhouette Coefficient drops to 0.61–0.66, indicating that the additional clusters are merely subtypes within the high-value cluster and do not correspond to any new emission-source structure. Moreover, in engineering management a finer classification is not necessarily a better one, as an excessive number of categories would multiply the control strategies and undermine the operability of the framework. The choice of k = 2 therefore reflects consistency between the statistical metrics and engineering interpretability.

3.3. Construction of Dual-Factor Classification Framework and Design of Differentiated Strategies

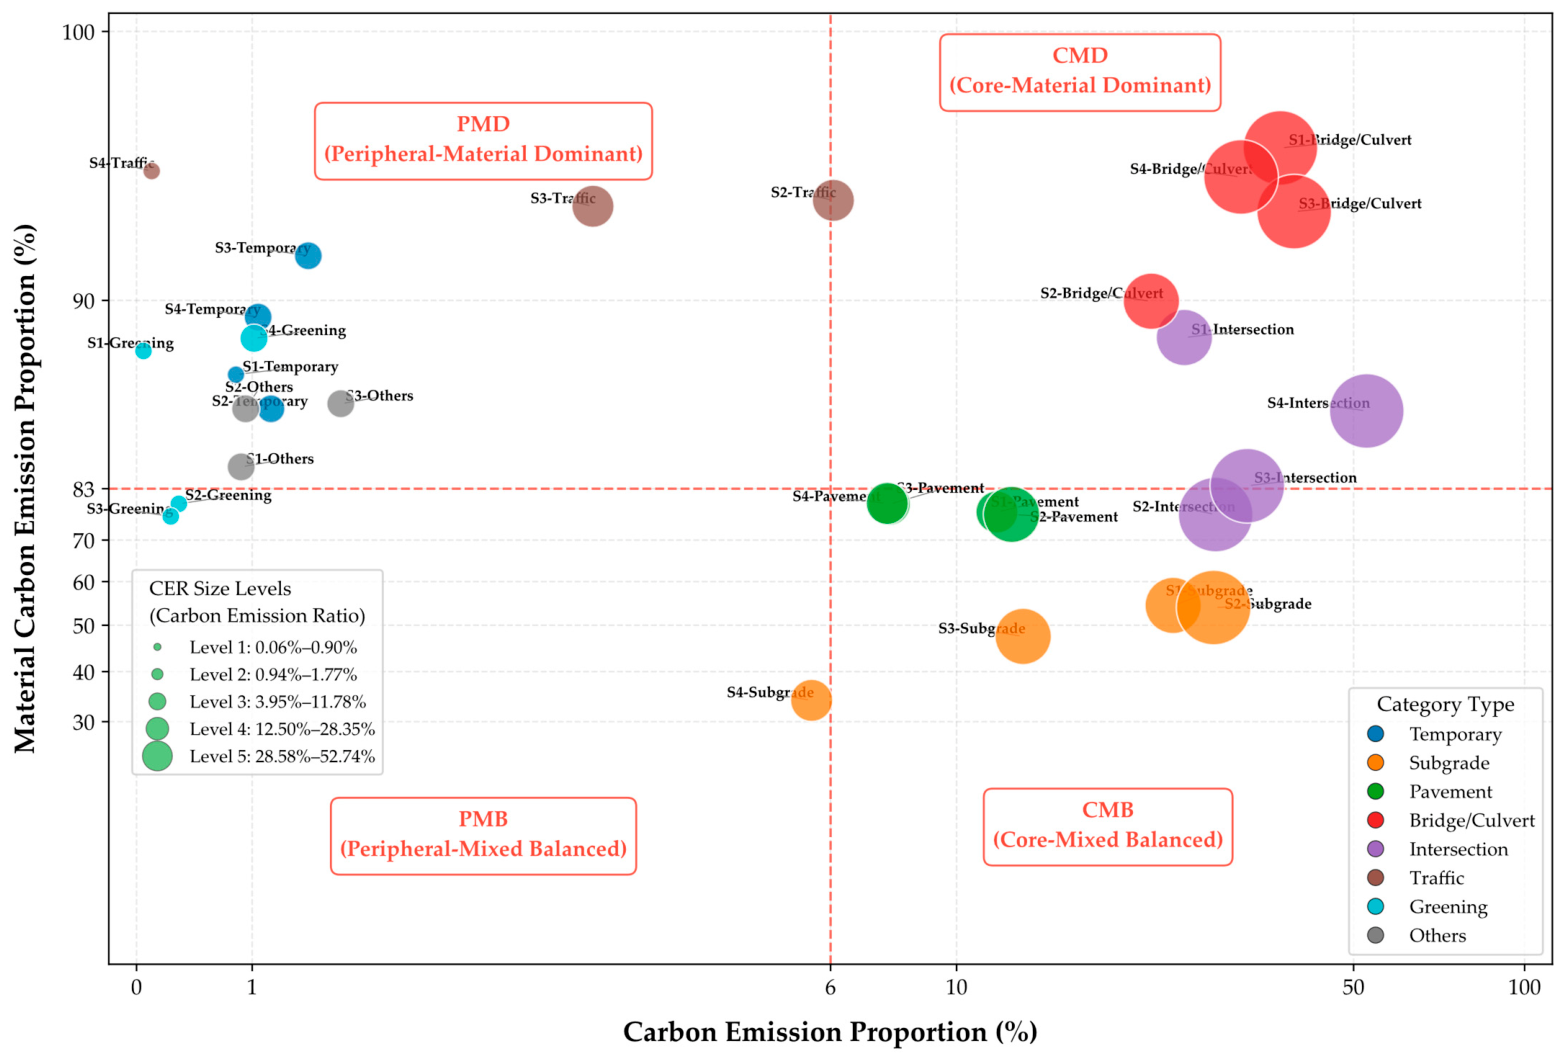
Based on the two feature dimensions identified in Section 3.2, a dual-factor classification matrix is constructed in this section (Figure 6). The horizontal axis of the matrix is the total emission proportion (Equation (3)), corresponding to Feature 1 in Section 3.2.1—the proportion of emissions from each engineering type relative to the total emissions of its construction section, which reflects the magnitude of emissions; the vertical axis is the material-derived emission proportion (Equation (4)), corresponding to Feature 2 in Section 3.2.2—the proportion of emissions from the material production stage relative to the emissions of the corresponding type; it reflects the structure of emission sources. The matrix was developed through four steps: (i) the two indicators were calculated for the nine types of subdivisional works across the four construction sections according to Equations (3) and (4); (ii) K-Means clustering was applied to the material-derived emission proportion to identify the natural binary structure of the samples (k = 2, Figure 5), providing the statistical basis for the vertical-axis threshold; (iii) in the absence of unified standards, the thresholds were set at 6% for the total emission proportion and 83% for the material-derived emission proportion, after weighing the overall distribution of the data, the interpretability of the classification results, the needs of subsequent abatement-measure selection, and the feasibility of validation; the robustness of these thresholds is examined in Table 2; and (iv) each of the nine engineering types, represented by its four-section mean, was assigned to a quadrant, yielding the 2 × 2 classification matrix: CMD (Core–Material Dominant), CMB (Core–Mixed Balanced), PMD (Peripheral–Material Dominant), and PMB (Peripheral–Mixed Balanced). Types with a total emission proportion of no less than 6% belong to the core control tier, and the remainder to the peripheral tier; types with a material-derived emission proportion of no less than 83% are classified as material-dominant, and the remainder as mixed-balanced.
To verify that the adopted thresholds are not arbitrary choices, a sensitivity analysis of the classification results was conducted. Taking the baseline classification (6% for the total emission proportion and 83% for the material-derived emission proportion) as the reference, the threshold on the total emission proportion was perturbed from 3% to 9%, and that on the material-derived emission proportion from 78% to 88%, in steps of one percentage point. Reclassification was tracked at two levels: the type level (eight work types, averaged over the four sections) and the point level (30 section-by-type samples). The results are summarized in Table 2. At the type level, no reassignment occurs when the total-emission-proportion threshold varies within (3.4%, 9.9%) or the material-derived-proportion threshold within (82.9%, 83.5%). Each interval is bounded by the type means themselves—the former by Traffic (3.4%, the highest among the auxiliary types) and Pavement (9.9%, the lowest among the main types), and the latter by Greening (82.9%) and Intersection (83.5%)—indicating that the thresholds fall within natural gaps between observed values rather than coinciding with any of them. At the point level, at most 3 of the 30 samples change category, and these are borderline samples whose reassignment does not alter the strategy assignment of any work type. Moreover, when the material-derived-proportion threshold moves outside its stable interval, the resulting reassignments remain within the same control tier: Intersection switches between CMD and CMB (both core-tier), while Greening and Others switch between PMB and PMD (both peripheral-tier). The core–peripheral priority structure underlying the differentiated control strategies is therefore preserved. Overall, the 6% and 83% thresholds fall within stability intervals arising from the structure of the data itself, and the classification matrix is robust to reasonable threshold perturbations.

3.3.1. Core–Material-Dominant (CMD) Engineering Works and Mitigation Strategies

CMD typically comprises bridge and culvert works, intersection works, and tunnel works within main works. Its carbon emission characteristics are marked by both high total carbon emissions and a high proportion of material-derived carbon emissions. Due to the high proportion of total carbon emissions, CMD represents the top control priority for carbon emission mitigation. Given the extremely high proportion of material-derived carbon emissions, the marginal benefit of construction machinery optimization during the construction phase is relatively low. Therefore, carbon abatement strategies should focus on the early project stages.
Design optimization strategies: During the preliminary design phase, the design institute shall, subject to functional and safety requirements, substitute bridge or tunnel schemes with subgrade schemes (subgrade substitution for bridges, subgrade substitution for tunnels). This approach can yield significant carbon abatement benefits.
Material selection strategy: During the detailed design phase, the design institute shall adopt high-strength steel rebar (e.g., HRB500E, HRB600) and corrosion-resistant steel rebar. This can reduce steel consumption by 20–40% while ensuring structural safety. During the material procurement phase, the project owner shall promote the use of low-carbon cement (e.g., slag-based cement, fly ash-based cement) and the substitution of industrial solid wastes for a portion of cement clinker. This achieves direct carbon abatement at the raw material source [27].
Construction scheme selection strategies: During the construction phase, the construction contractor shall prioritize energy-efficient hole-forming processes, such as rotary drilling rigs for pile formation, although these still generate certain machinery-derived carbon emissions. Furthermore, diesel-to-electric retrofitting of large-scale construction equipment shall be implemented. The use of green electricity for power supply can achieve near-zero carbon emissions from construction equipment.

3.3.2. Core–Mixed-Balanced (CMB) Engineering Works and Mitigation Strategies

CMB typically comprises subgrade works and pavement works. Its carbon emission characteristics are as follows: the proportion of total carbon emissions is relatively high, whereas the proportion of material-derived carbon emissions is relatively low. Due to the high proportion of total carbon emissions, CMB represents the secondary control priority for carbon emission mitigation. Given the relatively high proportion of machinery-derived carbon emissions, the focus can be directed toward construction scheme optimization during the construction phase.
Design optimization strategies: During the detailed design phase, the design institute shall apply refined longitudinal alignment design for subgrade works and optimize the cut-and-fill balance. Subject to geological conditions, alignment indices, ecological red lines, and land acquisition and demolition costs, borrow earth and waste shall be minimized. This reduces the total earthwork transportation volume at the source. This is the fundamental pathway for reducing approximately 50% of machinery-derived carbon emissions. Concurrently, the locations of the borrow area and waste area shall be rationally selected to shorten the average haul distance. For pavement works, the blending proportion of Reclaimed Asphalt Pavement materials shall be increased. Alternatively, steel slag and other industrial solid wastes shall be utilized [28]. The application of warm mix asphalt (WMA) technology can reduce the mixing temperature by 30–40 °C, thereby significantly reducing fuel consumption [29].
Construction scheme selection strategies: During the construction phase, the construction contractor shall promote the use of electric excavators, wheel loaders, and heavy trucks. For pavement works, the focus shall be on the clean energy transition of asphalt mixing plants. This includes promoting diesel-to-gas conversion and electric heating technologies, as well as the active deployment of on-site distributed photovoltaic systems [30].

3.3.3. Peripheral–Material-Dominant (PMD) Engineering Works and Mitigation Strategies

PMD comprises traffic works, temporary works, and other works. Its carbon emission characteristics are as follows: the proportion of total carbon emissions is relatively low, whereas the proportion of material-derived carbon emissions is relatively high. Due to the relatively low proportion of total carbon emissions, the carbon abatement potential of PMD is limited. The carbon abatement cost should therefore be given greater consideration. Strategies that simultaneously satisfy cost reduction and carbon abatement are preferred.
Site selection strategies: During the construction phase, the construction contractor shall prioritize leasing existing buildings along the route for project headquarters and staff dormitories. This reduces the construction of new temporary works. For productive temporary works such as steel rebar processing yards and mixing plants, site selection shall be optimized. These facilities should be located at the project center or within intersection loop areas to shorten the service radius. This approach reduces carbon emissions from on-site secondary transportation.
Standardized production strategies: Temporary works shall adopt prefabricated steel structures to enable rapid assembly and disassembly and repeated reuse. Standardized precasting shall be promoted for traffic safety facilities. All components shall be centrally precast in factories and subsequently transported to the site for assembly. However, a certain project scale is required for the amortization of precasting costs [31].

3.3.4. Peripheral–Mixed-Balanced (PMB) Engineering Works and Mitigation Strategies

PMB typically comprises greening works. Its carbon emission characteristics are as follows: both the proportion of total carbon emissions and the proportion of material-derived carbon emissions are relatively low. The strategy for this engineering type is distinctive. It requires a shift from pure carbon emission reduction to an economic benefit analysis of carbon sequestration.
Carbon sequestration strategy: During the greening design phase, the design institute shall scientifically select native tree species with strong carbon sequestration capacity that are adapted to the local climate. Plant configuration shall be optimized to maximize carbon absorption capacity during the operation phase [32]. Although this approach cannot reduce construction-phase carbon emissions, and roadside vegetation cannot be incorporated into voluntary carbon emission reduction schemes due to scale limitations, it nonetheless enhances carbon sequestration, which can be accounted for as an indirect benefit in the economic analysis of the engineering feasibility study.

3.4. Engineering–Strategy Matching and Application Validation

3.4.1. Decision-Making Workflow for Differentiated Carbon Abatement

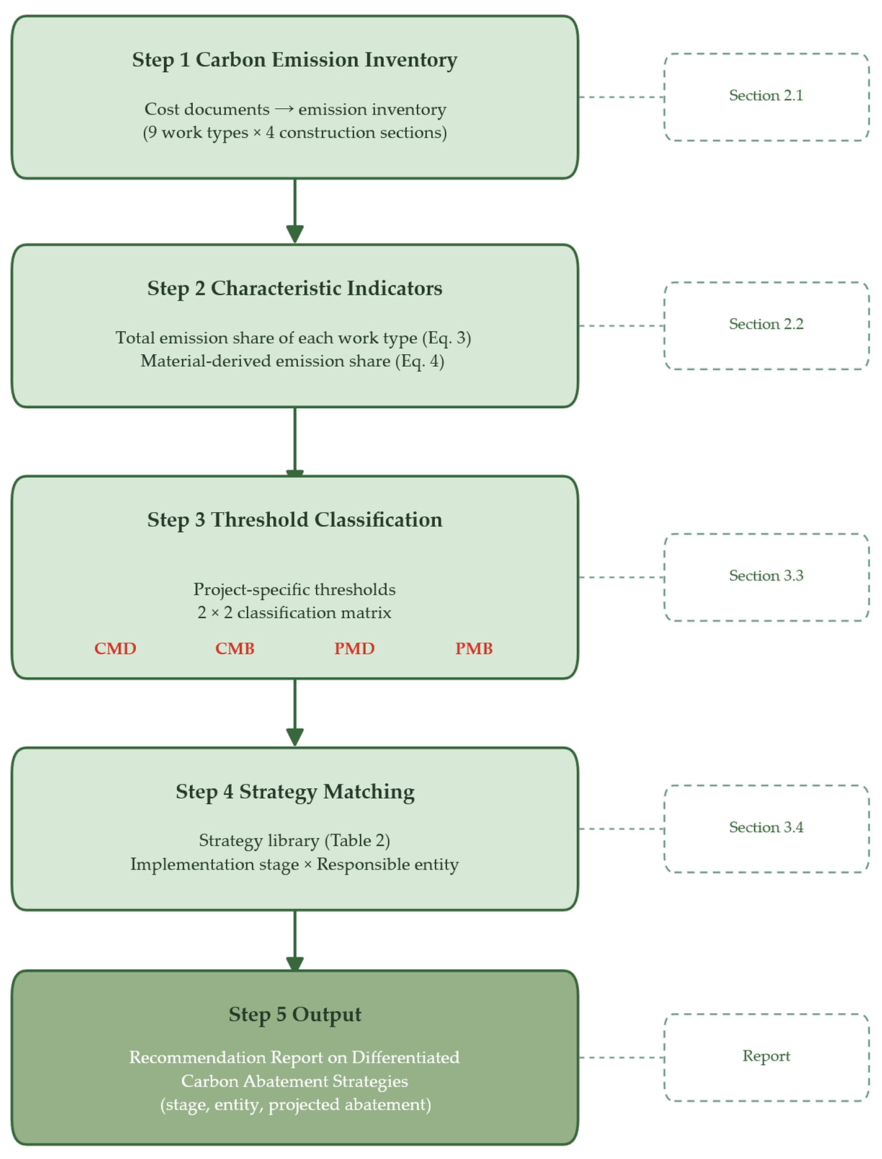
To translate the dual-factor classification framework into a reusable engineering decision-support tool, the implementation of differentiated carbon abatement is formalized as a five-step decision-making workflow (Figure 7). The workflow takes the carbon emission inventory as its input and produces a Recommendation Report on Differentiated Carbon Abatement Strategies as its output. The calculation rules and data basis of each step have been presented in the preceding sections, ensuring the reproducibility and transferability of the workflow. Similar “inventory accounting–feature classification–differentiated strategy” decision-making paradigms have been applied and validated in carbon mitigation research [33], and have demonstrated favorable applicability in the construction engineering domain [34,35].
Step 1 (Data acquisition and inventory construction): During the feasibility study phase, emission factors and activity level data are extracted from engineering cost documentation, and the carbon emissions of each work item are calculated according to Equation (2), forming a carbon emission inventory covering nine types of subdivisional works (see Section 2.1). Using cost documentation as the data source ensures the compatibility of the workflow with the existing engineering management system.
Step 2 (Calculation of characteristic indicators): The proportion of carbon emissions from each engineering type and the proportion of material-derived carbon emissions are calculated according to Equations (3) and (4), characterizing the emission features of each engineering type along the dimensions of total emission share and emission source composition (see Section 2.2).
Step 3 (Threshold determination and type classification): Classification thresholds for the two indicators are determined in combination with the data distribution of the specific project (the thresholds are project-specific parameters; their determination basis and robustness verification are presented in Section 3.3 and the sensitivity analysis), and the nine engineering types are accordingly assigned to the four quadrants of CMD, CMB, PMD, and PMB (see Figure 6 and Section 3.3). Cluster- and threshold-based classification methods have been demonstrated to effectively support the formulation of differentiated mitigation strategies [33].
Step 4 (Strategy matching): According to the quadrant to which each engineering type belongs, corresponding carbon abatement strategies are matched from the strategy library (Table 3). The strategy library is organized along two dimensions—implementation stage and responsible entity—covering the feasibility study, preliminary design, detailed design, material procurement, and construction implementation stages, with responsibilities explicitly assigned to the design institute, the project owner, and the construction contractor. The abatement potential of the technical options in the strategy library is supported by quantitative assessments of emerging construction-phase mitigation technologies [36].
Step 5 (Output generation): The Recommendation Report on Differentiated Carbon Abatement Strategies is subsequently generated, explicitly defining the implementation stage, responsible entity, and projected carbon abatement volume for each strategy, thereby serving as the decision-making basis for carbon emission control throughout the project stages.
The input data, calculation rules, and output format of the above workflow are independent of any specific project, and the workflow is therefore transferable to other highway construction projects. However, the classification thresholds and the specific technical parameters in the strategy library require localized calibration according to the regional context and engineering characteristics of each project.

3.4.2. Strategy Validation

The framework was applied to the case project. The specific applications are as follows:
(1) Tunnel works belong to the CMD category. During the design phase, the original design for the K7+300 section of the case highway involved a tunnel traversing the mountain mass. This scheme incurred both high costs and high carbon emissions. Following a comprehensive techno-economic evaluation [37], the tunnel scheme was replaced by a Class 6 cutting slope scheme. This change reduced carbon emissions by 26,392 t CO2 during the construction phase. This implements the design optimization strategy of the CMD category.
(2) Subgrade works belong to the CMB category. During the construction phase, in response to the fact that 81% of the route of the case highway is located within the Nanxiong red beds, a disposal scheme was adopted in which the excavated red sandstone was reused as subgrade fill. This reduced carbon emissions by 6232 t CO2. This implements the construction scheme selection strategy of the CMB category.
(3) Drainage ditch works belong to the PMD category. During the construction phase, the construction contractor promoted a small-component precasting and site assembly scheme as a substitute for the cast-in situ scheme. A total of 73,886 m3 of drainage ditches were constructed. This reduced carbon emissions by approximately 247 t CO2. This implements the standardized production strategy of the PMD category.
(4) Greening works belong to the PMB category. During the design phase, the case highway was designed with over 9300 trees and shrubs in service areas and greenable areas along the route. Based on a 25-year operation phase, this can achieve carbon sequestration of 875.76 t CO2. This implements the carbon sequestration strategy of the PMB category.
Among the above carbon abatement strategies, the carbon abatement volumes for CMD and CMB engineering works account for 4.2% and 1.0% of the total project carbon emissions, respectively, totaling 5.2%. The carbon abatement effect of PMD is relatively low. The strategies listed for PMB engineering works yield no direct carbon abatement effect during the construction phase; however, when extended to the full life cycle, favorable carbon sequestration effects can be achieved. This benefit distribution fully aligns with the differentiated priority sequence of CMD → CMB → PMD → PMB, thereby validating the effectiveness of the proposed framework.

4. Conclusions and Recommendations

This study investigates carbon emission management during the construction phase of mountainous expressways in Guangdong Province, China. Carbon emissions of the entire project are accounted for using the emission factor method, and the emission characteristics of each engineering type are identified along two dimensions—the total emission proportion and the material-derived emission proportion—using the K-Means clustering algorithm. A four-category framework comprising CMD, CMB, PMD, and PMB is constructed, and differentiated carbon abatement strategies are matched to implementation stages and responsible entities. The main conclusions are as follows:
(1) Regarding the total emission proportion, the main works—subgrade, pavement, bridge and culvert, and intersection works—far exceed the peripheral works such as temporary, greening, and traffic ancillary works, with a mean proportion of 94.99% across the four construction sections and an extremely low dispersion (a coefficient of variation of merely 3.19%). The main works therefore offer greater carbon abatement potential; in particular, carbon emissions vary considerably among different structural forms of the main works, and the selection of structural forms is a critical precondition for controlling total project emissions.
(2) Regarding the material-derived emission proportion, the engineering types can be divided into two clusters: material-dominant and mixed-balanced. Bridge and culvert, intersection, traffic, and temporary works exhibit a stable material-derived emission proportion above 83%; subgrade works show only 34.1–54.5%; and pavement works lie between the two clusters. Carbon abatement strategies should therefore be tailored to each cluster.
(3) Based on thresholds of the total emission proportion and the material-derived emission proportion, the constructed four-category framework enables precise and differentiated management: the abatement pathways of each engineering type belong to different stages—feasibility study, preliminary design, detailed design, and construction implementation—and correspond to three categories of responsible entities, namely the design institute, the project owner, and the construction contractor, forming a complete closed-loop management process.
(4) A procedure for formulating carbon abatement strategies was developed and applied to an actual mountainous expressway project in Guangdong. Through four coordinated measures—deep cutting substitution for tunnels, local utilization of red sandstone, small-component precasting, and vegetation carbon sequestration along the route—the total direct carbon abatement during the construction phase reached 5.2%. The CMD and CMB categories, as the two core engineering types, contributed the entire direct abatement volume, while PMD works achieved modest abatement and PMB works realized long-term carbon sequestration compensation. The abatement benefits fully aligned with the differentiated management priorities, preliminarily validating the practicality and effectiveness of the dual-factor classification system for similar mountainous expressway projects.
The abatement strategies in this study were developed from and validated on the same highway project, and their applicability to standalone extra-large bridges, ultra-long tunnels, and large-scale interchange projects is limited. The emission factors employed in the accounting process were selected from the literature and field measurements following the localized latest-factor priority principle; nevertheless, they exhibit regional variations, and further local calibration would improve the accuracy of the accounting results. The marginal abatement costs of individual measures are not quantified, making it difficult to balance carbon abatement with engineering investment. Future research may validate the framework across additional highway projects with different geographical, geological, and construction characteristics, refine the secondary classification rules for single-structure projects, establish a dynamic emission factor database at the national multi-regional level, perform quantitative uncertainty characterization (e.g., Monte Carlo simulation) based on localized emission factor databases, introduce multi-objective cost–abatement optimization models, and incorporate quantitative analyses of carbon pricing and green incentive policies, so as to develop an integrated low-carbon management system for highway engineering.

Author Contributions

Conceptualization, Y.L.; methodology, G.H., X.G. and Y.L.; software, G.H.; validation, G.H., X.G., J.C., H.Z. and Y.L.; formal analysis, G.H. and X.G.; investigation, G.H., X.G., J.C. and H.Z.; resources, J.C. and H.Z.; data curation, G.H., X.G. and J.C.; writing—original draft preparation, G.H.; writing—review and editing, X.G. and Y.L.; visualization, G.H. and X.G.; supervision, Y.L.; project administration, Y.L.; funding acquisition, Y.L. All authors have read and agreed to the published version of the manuscript.

Funding

Supported by the Guangdong Province Soft Science Research Program Project (2023A1111120018).

Institutional Review Board Statement

Not applicable.

Informed Consent Statement

Not applicable.

Data Availability Statement

Data are available upon request from the authors.

Conflicts of Interest

Authors Xinxin Gu and Hao Zhang were employed by the companies Shandong Provincial Communications Planning and Design Institute Group Co., Ltd. and Guangzhou Beierhuan Transportation Technology Co., Ltd. The remaining authors declare that the research was conducted in the absence of any commercial or financial relationships that could be construed as a potential conflict of interest.

Abbreviations

The following abbreviations are used in this manuscript:
LCALife Cycle Assessment
GHGsGreenhouse Gases
CVCoefficient of Variation
CMDCore–Material Dominant
CMBCore–Mixed Balanced
PMDPeripheral–Material Dominant
PMBPeripheral–Mixed Balanced
SSESum of Squared Errors

References

  1. Liu, Y.; Li, H.; Wang, H.; Wang, Y.; Han, S. Integrated Life Cycle Analysis of Cost and CO2 Emissions from Vehicles and Construction Work Activities in Highway Pavement Service Life. Atmosphere 2023, 14, 194. [Google Scholar] [CrossRef] [Scilit]
  2. Luo, W.; Sandanayake, M.; Zhang, G.; Tan, Y. Construction Cost and Carbon Emission Assessment of a Highway Construction—A Case towards Sustainable Transportation. Sustainability 2021, 13, 7854. [Google Scholar] [CrossRef] [Scilit]
  3. Liu, Y.; Wang, Y.; Li, D.; Feng, F.; Yu, Q.; Xue, S. Identification of the potential for carbon dioxide emissions reduction from highway maintenance projects using life cycle assessment: A case in China. J. Clean. Prod. 2019, 219, 743–752. [Google Scholar] [CrossRef] [Scilit]
  4. Gao, S.; Yang, L.; Zhong, P.; Zhang, F. Carbon Emission Calculation Method Study of Highway Project Based on a Quota Analysis. Highway 2024, 69, 352–357. [Google Scholar]
  5. GB/T 51366-2019; Standard for Calculation of Building Carbon Emissions. China Architecture & Building Press: Beijing, China, 2019. Available online: https://www.mohurd.gov.cn/gongkai/zc/wjk/art/2019/art_17339_240723.html (accessed on 20 August 2026).
  6. Hua, J.; Wang, R.; Hu, Y.; Chen, Z.; Chen, L.; Osman, A.I.; Farghali, M.; Huang, L.; Feng, J.; Wang, J.; et al. Artificial intelligence for calculating and predicting building carbon emissions: A review. Environ. Chem. Lett. 2025, 23, 783–816. [Google Scholar] [CrossRef] [Scilit]
  7. Neupane, B.; Belkadi, F.; Formentini, M.; Rozière, E.; Hilloulin, B.; Abdolmaleki, S.F.; Mensah, M. Machine learning algorithms for supporting life cycle assessment studies: An analytical review. Sustain. Prod. Consum. 2025, 56, 37–53. [Google Scholar] [CrossRef] [Scilit]
  8. Huang, S.; Gao, S.; Wang, X.; Tian, M.; Lu, C. Quantitative Analysis and Assessment on Highway Infrastructure Carbon Emission Research. J. Highw. Transp. Res. Dev. 2024, 41, 203–214. [Google Scholar]
  9. Sandanayake, M.; Zhang, G.; Setunge, S.; Luo, W.; Li, C. Estimation and comparison of environmental emissions and impacts at foundation and structure construction stages of a building—A case study. J. Clean. Prod. 2017, 151, 319–329. [Google Scholar] [CrossRef] [Scilit]
  10. Liu, Y.; Wang, Y.; An, D. Life-cycle CO2 emissions and influential factors for asphalt highway construction and maintenance activities in China. Int. J. Sustain. Transp. 2018, 12, 497–509. [Google Scholar] [CrossRef] [Scilit]
  11. Wang, X.; Duan, Z.; Wu, L.; Yang, D. Estimation of carbon dioxide emission in highway construction: A case study in southwest region of China. J. Clean. Prod. 2015, 101, 705–714. [Google Scholar] [CrossRef] [Scilit]
  12. Song, T.; Fu, J.; Lu, C.; Chen, G.; Gao, S.; Wang, X. Carbon Emissions Calculation and Analysis of Continuous Rigid Frame Bridge Construction in Guangdong-Hong Kong-Macao Greater Bay Area. Highway 2025, 70, 318–326. [Google Scholar]
  13. Li, H.; Du, Y. Quantitative Analysis of Carbon Emission from Surrounding Rock Support in Highway Tunnel Construction and Research on Carbon Reduction Path. J. Chongqing Jiaotong Univ. (Nat. Sci.) 2023, 42, 93–102. [Google Scholar]
  14. Ren, Y.; Wang, C.; Zhang, Y.; Fang, X.; Xu, H. Regional variation and prediction model of carbon emissions in the highway construction stage. Sci. Rep. 2026, 16, 18949. [Google Scholar] [CrossRef] [Scilit] [PubMed]
  15. Bao, H.; Wang, G.; Yan, C.; Lan, H.; Xie, Y. Highway Construction Carbon Emission Assessment and Low-carbon Measures and Carbon Compensation for Geotechnical Engineering: A Review. China J. Highw. Transp. 2025, 38, 46–72. [Google Scholar] [CrossRef]
  16. Perri, G.; De Rose, M.; Domitrović, J.; Vaiana, R. CO2 Impact Analysis for Road Embankment Construction: Comparison of Lignin and Lime Soil Stabilization Treatments. Sustainability 2023, 15, 1912. [Google Scholar] [CrossRef] [Scilit]
  17. Gao, Y.; Sun, H.; Wang, X.; Ma, F. Uncertainties in carbon emissions and reduction pathways during highway construction. J. Saf. Environ. 2025, 25, 4513–4523. [Google Scholar]
  18. Tang, W.; Wang, W.; Mu, M.; Qin, X.; Yao, S.; Liao, Z. Carbon emission accounting in expressway construction and emission reduction potential quantification in electrification scenario. J. Highw. Transp. Res. Dev. 2025, 42, 205–214. [Google Scholar]
  19. Zheng, S.; Xie, X.; Zhou, B. Accounting Method and Indicators of Multilevel CO2 Emissions Based on Cost During Construction of Shield Tunnels. Appl. Sci. 2024, 14, 9552. [Google Scholar] [CrossRef] [Scilit]
  20. Duan, X.; Wang, Y.; Yang, D.; Zeng, W.; Du, Y.; Li, N. Evaluation of road performance and carbon emission accounting analysis of recycled aggregates from construction and demolition waste. Sci. Rep. 2025, 15, 29395. [Google Scholar] [CrossRef] [Scilit] [PubMed]
  21. Elmousalami, H.; Maxy, M.; Hui, F.K.P.; Aye, L. AI in automated sustainable construction engineering management. Autom. Constr. 2025, 175, 106202. [Google Scholar] [CrossRef] [Scilit]
  22. JTG/T 3833—2018; Quota of Highway Construction Machinery Working Shift Costs. China Communications Press Co., Ltd.: Beijing, China, 2019.
  23. Marsh, E.; Orr, J.; Ibell, T. Quantification of uncertainty in product stage embodied carbon calculations for buildings. Energy Build. 2021, 251, 111340. [Google Scholar] [CrossRef] [Scilit]
  24. Yu, S.; Wei, Y.; Fan, J.; Zhang, X.; Wang, K. Exploring the regional characteristics of inter-provincial CO2 emissions in China: An improved fuzzy clustering analysis based on particle swarm optimization. Appl. Energy 2012, 92, 552–562. [Google Scholar] [CrossRef] [Scilit]
  25. Jiang, J.; Ye, B.; Xie, D.; Tang, J. Provincial-level carbon emission drivers and emission reduction strategies in China: Combining multi-layer LMDI decomposition with hierarchical clustering. J. Clean. Prod. 2017, 169, 178–190. [Google Scholar] [CrossRef] [Scilit]
  26. Gao, S.; Liu, X.; Lu, C.; Zhang, H.; Wang, X.; Kong, Y. Quantitative Analysis of Carbon Emissions from Highway Construction Based on Life Cycle Assessment. Sustainability 2024, 16, 5897. [Google Scholar] [CrossRef] [Scilit]
  27. Guo, X.; Liu, J.; Fu, S.; Gu, J. Research on Influencing Factors of Carbon Emissions in the Regional Construction Industry: A Case Study of Jiangxi Province. Sustainability 2026, 18, 469. [Google Scholar] [CrossRef] [Scilit]
  28. Liu, D.; Fan, L.; Zhang, L.; Dai, X. Carbon Emission Accounting and Multi-Objective Analysis for Steel Slag Road Paving: A Case Study from Xinjiang. Processes 2026, 14, 1075. [Google Scholar] [CrossRef] [Scilit]
  29. Liu, Y.; Liu, Z.; Zhu, Y.; Zhang, H. A Review of Sustainability in Hot Asphalt Production: Greenhouse Gas Emissions and Energy Consumption. Appl. Sci. 2024, 14, 10246. [Google Scholar] [CrossRef] [Scilit]
  30. Kafetzis, A.; Chouvardas, M.; Bampaou, M.; Ntavos, N.; Panopoulos, K.D. Renewable Hydrogen Integration in a PV–Biomass Gasification–Battery Microgrid for a Remote, Off-Grid System. Energies 2026, 19, 1705. [Google Scholar] [CrossRef] [Scilit]
  31. Jin, J.; Xu, Y.; Huang, Q.; Liu, W. Research on Carbon Footprint Calculation for the Materialisation Phase of Prefabricated Housing. Buildings 2025, 15, 3588. [Google Scholar] [CrossRef] [Scilit]
  32. Zhang, H.; Song, C.; Geng, Y.; Luo, Z.; Chen, Z. Carbon Neutrality Benefit by Developing Underground Space and Overlying Green Land: Calculation Methodology and Case Study. Buildings 2025, 15, 78. [Google Scholar] [CrossRef] [Scilit]
  33. D’Arcangelo, F.M.; Kruse, T.; Pisu, M. Identifying and tracking climate change mitigation strategies with a cluster-based assessment. npj Clim. Action 2024, 3, 86. [Google Scholar] [CrossRef] [Scilit]
  34. Drewniok, M.P.D.; Azevedo, J.M.C.; Dunant, C.F.; Allwood, J.M.; Cullen, J.M.; Ibell, T.; Hawkins, W. Mapping material use and embodied carbon in UK construction. Resour. Conserv. Recycl. 2023, 197, 107056. [Google Scholar] [CrossRef] [Scilit]
  35. Guo, Y.; Wen, S.; Guo, Z.; Tan, X.; Wang, Y.; Hu, N.; Jia, P.; Su, K.; Guo, C. Rising carbon emissions from expanding highway tunnels and reduction pathways in China. npj Sustain. Mobil. Transp. 2025, 2, 46. [Google Scholar] [CrossRef] [Scilit]
  36. Liu, Z.; Xia, Z.; Li, J.; Wang, Y.; Zhang, Y.; Li, X.; Yang, Q. Carbon reduction potential and selection strategies of emerging construction-phase technologies. Sci. Rep. 2026, 16, 7863. [Google Scholar] [CrossRef] [Scilit] [PubMed]
  37. Liu, X.; Liu, W.; Jiang, L.; Hao, G.; Chen, Z. Carbon Emission Benefit Analysis of Tunnel Plan and Excavated Slope Plan for Lingnan Mountain Highway. In Proceedings of the International Conference on Geotechnics and Hydraulic Structures (GHS), Online, 6 September 2024; pp. 250–257. [Google Scholar]
Figure 1. Heat map of carbon emission proportions of each engineering type relative to construction section totals.
Atmosphere 17 00813 g001
Figure 2. Distribution of carbon emission proportion of different engineering types within each construction section.
Atmosphere 17 00813 g002
Figure 3. Heat map of material carbon emission source proportions of each engineering type.
Atmosphere 17 00813 g003
Figure 4. Box plot of material carbon emission source proportions of each engineering type.
Atmosphere 17 00813 g004
Figure 5. Clustering validation of material carbon emission proportions. (a) Elbow curve; (b) Silhouette Coefficients for k = 2 to 6.
Atmosphere 17 00813 g005
Figure 6. Dual-factor classification matrix of highway construction carbon emissions. The four quadrants represent: CMD (Core–Material Dominant), CMB (Core–Mixed Balanced), PMD (Peripheral–Material Dominant), and PMB (Peripheral–Mixed Balanced).
Atmosphere 17 00813 g006
Figure 7. Decision-making workflow for differentiated carbon abatement.
Atmosphere 17 00813 g007
Table 1. Carbon emission inventory by construction section and engineering type (t CO2).
SectionTypeTemporarySubgradePavementBridge/CulvertIntersectionTrafficGreeningOthers
1Material126522,10715,30059,97037,6400891279
Machinery18518,4784564271548350.0812247
2Material146522,44714,00629,05932,00583404241189
Machinery23919,133432532409904559112194
3Material20449350902955,06940,57055413372285
Machinery18610,323240139538242385107367
4Material15243233970048,61273,48720114590
Machinery18162352546277912,069111880
Table 2. Reclassification of work types and section-level samples under perturbed classification thresholds (baseline: 6% for the total emission proportion; 83% for the material-derived emission proportion).
Threshold (%)Work Types Changing Category (of 8)Samples Changing Category (of 30)Work Types That Changed Category
(a) Total emission proportion
312Traffic: PMD → CMD
401
501
6 (baseline)00
701
803
903
(b) Material-derived emission proportion
7813Greening: PMB → PMD
7912Greening: PMB → PMD
8010Greening: PMB → PMD
8110Greening: PMB → PMD
8210Greening: PMB → PMD
83 (baseline)00
8412Intersection: CMD → CMB
8512Intersection: CMD → CMB
8625Intersection: CMD → CMB; Others: PMD → PMB
8726Intersection: CMD → CMB; Others: PMD → PMB
8827Intersection: CMD → CMB; Others: PMD → PMB
Table 3. Engineering–Strategy Matching Overview.
Engineering CategoryEngineering TypeImplementation Stage/Responsible EntityPrimary Strategy
CMDBridge and culvert, intersection, tunnelPreliminary design/Design instituteDesign optimization: subgrade substitution for bridges, subgrade substitution for tunnels
Detailed design/Design instituteMaterial selection: high-strength steel rebar, low-carbon cement
Procurement phase/Project ownerMaterial selection: green building materials
Construction phase/Construction contractorConstruction scheme: high-efficiency hole forming, diesel-to-electric retrofitting
CMBSubgrade, pavementDetailed design/Design instituteDesign optimization: cut-and-fill balance, RAP utilization
Construction phase/Construction contractorConstruction scheme: electric equipment, green electricity
PMDTraffic facilities, temporary worksConstruction phase/Construction contractorSite selection optimization, standardized precasting
PMBGreeningDesign phase/Design instituteCarbon sequestration strategy: native tree species configuration
Disclaimer/Publisher’s Note: The statements, opinions and data contained in all publications are solely those of the individual author(s) and contributor(s) and not of MDPI and/or the editor(s). MDPI and/or the editor(s) disclaim responsibility for any injury to people or property resulting from any ideas, methods, instructions or products referred to in the content.