1. Introduction
Dust storms are among the most significant environmental hazards in arid and semi-arid regions, affecting air quality, human health, ecosystems, transportation, and infrastructure [
1,
2]. They are generated when strong surface winds entrain loose soil particles from sparsely vegetated drylands into the atmosphere [
3,
4,
5,
6,
7]. Dust particles smaller than approximately 20 μm in diameter can remain suspended in the atmosphere and be transported hundreds to thousands of kilometers from their source regions, thereby influencing regional weather and climate. During severe dust events, this long-range transport can substantially reduce horizontal visibility, often to less than 1 km, creating significant hazards for aviation and surface transportation [
8]. Severe episodes can lead to near-zero visibility, posing serious risks to public safety and economic activities [
2]. Dust storms have also been associated with increased respiratory and cardiovascular diseases, disruption of transportation systems, and damage to infrastructure and agricultural productivity [
1,
9,
10,
11,
12].
The Arabian Peninsula is one of the world’s major dust-producing regions due to its extensive deserts, arid climate, limited vegetation cover, and frequent strong winds [
3,
13,
14,
15]. Across central and northern Saudi Arabia, including Riyadh, annual precipitation is low, ranging from 80 to 150 mm [
16], and summers are extremely hot, with mean daily maximum temperatures ranging from 35 °C to 45 °C [
17]. Together with intense evaporation and sparse vegetation, these arid conditions expose large areas of loose soil that are highly susceptible to wind erosion, resulting in frequent dust emissions and long-range transport across the region [
18]. In addition, Modaihsh et al. [
19] reported that dust storms were the primary cause of elevated particulate matter levels in Riyadh. During the dust season, monthly mean PM
10 concentrations reached 696 µg m
−3, with peak daily values exceeding 2234 µg m
−3, while PM
2.5 concentrations also increased markedly during these events [
19].
Accordingly, Riyadh, the capital of Saudi Arabia, is frequently affected by dust storms, particularly during the spring and summer months [
20,
21]. These events have substantial environmental, health, and socioeconomic impacts. Maghrabi et al. [
22] reported that the severe dust storm of 10 March 2009 caused heavy dust deposition, near-zero visibility, airport closure, and widespread damage to infrastructure and vegetation. Meo et al. [
23] found that dust storm exposure significantly increased respiratory and general health complaints, including eye irritation, cough, wheezing, headache, sleep disturbances, and asthma exacerbations. During the April 2015 dust storm, King Khalid International Airport recorded zero visibility, resulting in a seven-hour operational closure and disruption to air traffic affecting more than 164,500 passengers [
24]. These studies highlight the importance of understanding the characteristics, transport pathways, and source regions of dust affecting Riyadh.
Ground-based observations from the Aerosol Robotic Network (AERONET) have substantially improved the characterization of atmospheric aerosols by providing long-term measurements of aerosol optical depth (AOD), Ångström exponent, single scattering albedo, and other aerosol optical properties [
25,
26]. In Saudi Arabia, long-term observations from the Solar Village AERONET station indicate increasing AOD associated with frequent dust events and expanding anthropogenic emissions [
27]. Likewise, Maghrabi and Alotaibi [
28] reported increasing annual and seasonal AOD trends, particularly during spring, reflecting the dominant influence of transported desert dust over the central Arabian Peninsula. Previous studies have also shown that dust events in Riyadh are characterized by high aerosol loading and coarse-mode particles, as indicated by elevated AOD and low Ångström exponent values [
29].
The Hybrid Single-Particle Lagrangian Integrated Trajectory (HYSPLIT) model has been widely applied to identify dust transport pathways and source regions across the Middle East. Previous studies consistently identified the Rub’ al Khali, the Iraqi and Syrian deserts, and the Sahara Desert as the principal dust source regions influencing Saudi Arabia, with transport largely controlled by Shamal winds and regional synoptic circulation [
30,
31,
32,
33]. More recent studies have shown that transported dust events substantially increase PM
2.5 and PM
10 concentrations, degrading air quality and posing significant public health risks [
34].
Although previous studies have characterized aerosol optical properties using AERONET observations and identified dust transport pathways using HYSPLIT, relatively few studies have integrated aerosol optical properties, atmospheric transport pathways, potential source contribution function (PSCF) and concentration weighted trajectory (CWT) source-receptor analyses, and surface meteorological observations within a single event-based framework to investigate dust events affecting Riyadh. Integrating these complementary datasets provides a more comprehensive characterization of dust events by linking aerosol optical properties, transport pathways, probable source regions, surface observations, and dust-event severity.
Accordingly, this study investigates the characteristics, transport pathways, source regions, and severity of dust events affecting Riyadh during 2024–2025 through an integrated analysis of AERONET observations, HYSPLIT backward trajectories, PSCF/CWT source–receptor analyses, and NOAA Integrated Surface Database (ISD) observations. Specifically, the study characterizes dust events using aerosol optical properties derived from AERONET, identifies atmospheric transport pathways through HYSPLIT backward trajectory analysis, determines potential dust source regions using PSCF and CWT analyses, and evaluates the relationships between aerosol optical properties, surface meteorological conditions, and dust-event severity.
2. Materials and Methods
2.1. Study Area and Data
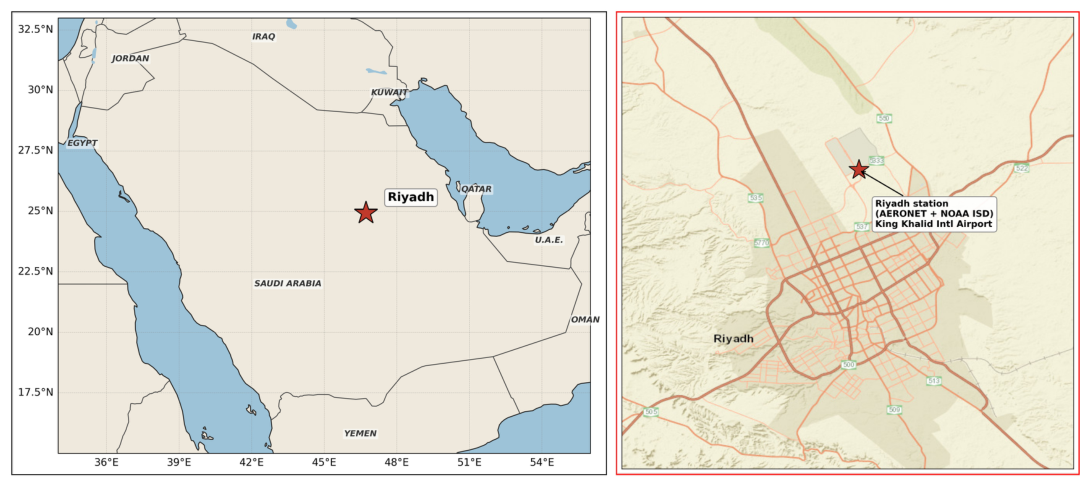
The study was conducted over Riyadh, Saudi Arabia (24.93° N, 46.72° E), located in the central Arabian Peninsula (
Figure 1). This study is based on point observations collected at the co-located Riyadh_Airport_SDSC AERONET station and NOAA ISD station (40437099999) at King Khalid International Airport.
Aerosol optical observations were obtained from the Riyadh_Airport_SDSC station of AERONET, a global ground-based sun-photometer network for aerosol monitoring [
35]. Version 3 Level 1.5 cloud-screened direct-sun observations were used for the period from January 2024 to December 2025 [
36]. Level 1.5 data were used because Level 2.0 requires final post-deployment calibration, which has not been completed for this recently established site, so Level 2.0 data are unavailable in the AERONET data portal. Level 1.5 observations are automatically cloud-screened and quality-controlled, and their use is standard practice for characterizing recently established AERONET sites. The variables extracted included AOD at 500 nm; the Ångström exponent (440–870 nm); and coarse-mode aerosol optical depth, fine-mode aerosol optical depth, and fine-mode fraction (FMF) derived from the AERONET spectral deconvolution algorithm (SDA).
The NOAA ISD station serves as the synoptic and METAR reporting station used for surface observations in this study. Its spatial co-location with the Riyadh_Airport_SDSC AERONET site allows direct temporal comparison between the column-integrated aerosol observations and surface meteorological records from the same observation location. Present-weather observations and horizontal visibility measurements are reported in accordance with World Meteorological Organization observing standards and undergo automated and manual quality-control procedures implemented by the NOAA National Centers for Environmental Information (
Figure 1). The datasets used in this study and their respective roles in the analysis are summarized in (
Table 1).
Furthermore, surface observations used for event validation were obtained from the NOAA ISD station. Its co-location with the Riyadh_Airport_SDSC AERONET site at King Khalid International Airport allowed the AERONET observations to be compared with present-weather and visibility records from the same observation location. No additional surface stations were included in the validation analysis, so the surface validation and dust-event classification represent conditions recorded at the co-located airport station. Events classified as “elevated” indicate that no dust-related present-weather code was reported at this station during the corresponding event day.
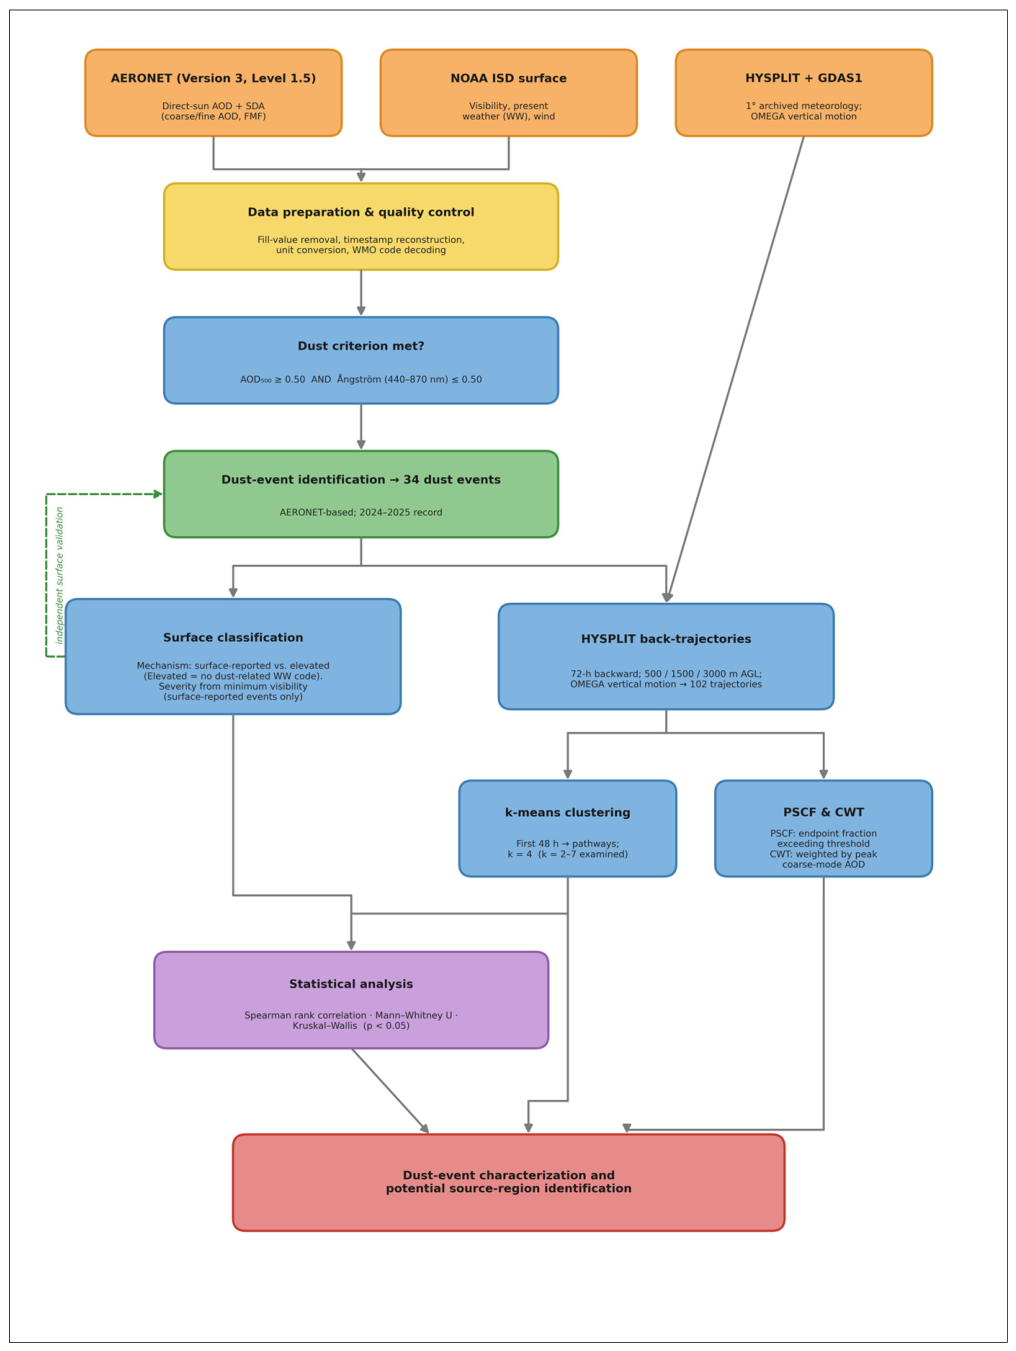
An overview of the data-processing and analytical workflow used in this study is presented in
Figure 2.
2.2. Dust Event Identification and Classification
Dust events were identified using a dual optical criterion based on AERONET observations. A day was classified as a dust event when the daily mean AOD at 500 nm was ≥0.50 and the daily mean Ångström exponent (440–870 nm) was ≤0.50 [
37]. Daily mean values were calculated from all available AERONET observations for each day. For each identified event, peak total AOD, peak coarse-mode AOD, mean coarse-mode AOD, mean fine-mode AOD, and FMF were extracted to characterize the aerosol conditions.
The corresponding NOAA ISD present-weather (ww) observations and horizontal visibility records were then examined for each identified event day. Surface confirmation was based on the occurrence of at least one dust-related ww code during that day. The dust-related ww codes included 06 (suspended dust), 07 (dust or sand raised by wind at or near the station), 08 (dust whirls), 09 (dust or sandstorm), and 30–35 (dust or sandstorm codes). The number of dust-related present-weather observations recorded during each event day was counted as the surface dust observation count. An event with at least one such observation was considered surface-confirmed, whereas an event with no dust-related ww code recorded during the available observations (ndust = 0) was classified as elevated (aloft) dust. Thus, the elevated classification was based on the absence of a reported surface dust code rather than on a specific visibility threshold.
For surface-confirmed events, dust-event severity was classified using the minimum horizontal visibility recorded during the event day. Events with minimum visibility <1 km were classified as dust storms, those with visibility ≥1 and <5 km as dense dust, and those with visibility ≥5 km as moderate dust. These thresholds were applied only after confirming the presence of at least one surface dust report. Consequently, minimum visibility was not used to determine the elevated category.
The dust-raising mechanism was classified separately using the NOAA ISD ww codes. Events containing code 06 were classified as transported (suspended) dust, whereas events containing code 07 were classified as locally raised dust. Events in which both suspended and locally raised dust were reported during the same event day were classified as mixed. Events without any reported dust-related ww code were retained as elevated (aloft). Dust-related codes 08, 09, and 30–35 were included in the surface-confirmation procedure.
2.3. HYSPLIT Trajectory Analysis
Backward air-mass trajectories were calculated using the NOAA HYSPLIT model with meteorological fields from the Global Data Assimilation System (GDAS1). For each identified dust event, 72 h backward trajectories were initialized at the Riyadh receptor site (24.93° N, 46.72° E) at arrival heights of 500, 1500, and 3000 m above ground level. The hour corresponding to the peak AOD of each event was used as the trajectory arrival time. The HYSPLIT calculations used the OMEGA vertical-motion method. Trajectories were calculated at the three arrival heights to examine air-mass transport at different vertical levels.
A total of 102 trajectories were generated for the 34 identified dust events, corresponding to three trajectories per event. For transport-pathway classification, the first 48 h of each trajectory were used. Each trajectory was represented by its latitude and longitude coordinates over this period, and the complete set of 102 trajectories was analyzed using k-means clustering. Candidate solutions with k-values from 2 to 7 were examined using the within-cluster sum of squares. Four clusters were selected based on the resulting spatial grouping and the geographic distinction among the transport pathways. The final k-means analysis was performed with k = 4, n_init = 10, and random_state = 0.
For event-level analyses, each dust event was assigned to the cluster containing the majority of its three trajectories at 500, 1500, and 3000 m. When the three trajectories were assigned to three different clusters, the cluster assigned to the 500 m trajectory was used for the event-level classification.
2.4. PSCF and CWT Analysis
Potential dust source regions were investigated using the PSCF and CWT methods based on the complete set of backward trajectories. Peak coarse-mode aerosol optical depth was used as the weighting variable for the CWT analysis. PSCF was used to identify grid cells frequently associated with dust-event trajectories, whereas CWT calculated the average coarse-mode aerosol loading associated with trajectories crossing each grid cell. The resulting PSCF and CWT fields were used to identify the principal source regions associated with the identified dust events.
Both analyses were computed on a 1° × 1° grid over the domain 10–40° N, 30–60° E. For the PSCF, each grid cell (
i,
j) was assigned
, where
nij is the total number of trajectory endpoints in the cell, and
mij is the number of endpoints associated with dust events whose peak coarse-mode AOD exceeded the event-mean peak coarse-mode AOD. To reduce the influence of cells sampled by few trajectories, the PSCF values were multiplied by an empirical weight function that down-weights sparsely sampled cells, following the general approach of Polissar et al. [
38]; cells were assigned weights of 1.00, 0.70, 0.42, and 0.17 when their endpoint count exceeded 3.0, 1.5, and 1.0 times the mean cell count, or fell below it, respectively. For the CWT, each cell was assigned
, the mean peak coarse-mode AOD over all trajectory endpoints
l passing through the cell. Cells containing fewer than three trajectory endpoints were masked in both fields.
2.5. Statistical Analysis
The 34 identified dust events were statistically analyzed using Python 3.13. Spearman rank-correlation analysis was used to examine relationships between peak coarse-mode AOD, mean and maximum surface wind speed, minimum surface visibility, sea-level pressure, and dust-event severity. Dust-event severity was treated as an ordinal variable, coded as elevated = 0, moderate = 1, dense = 2, and dust storm = 3, consistent with the event-classification scheme described in
Section 2.2. Differences in mean surface wind speed between locally raised and transported dust events were evaluated using the Mann–Whitney U test. The Kruskal–Wallis H test was used to compare peak coarse-mode AOD among the four transport-pathway clusters and maximum surface wind speed among the dust-event severity classes. Statistical significance was defined as
p < 0.05.
3. Results
3.1. Dust Climatology and Event Frequency
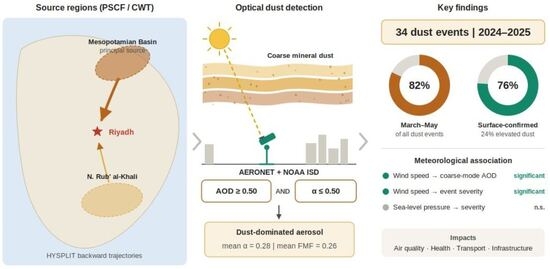
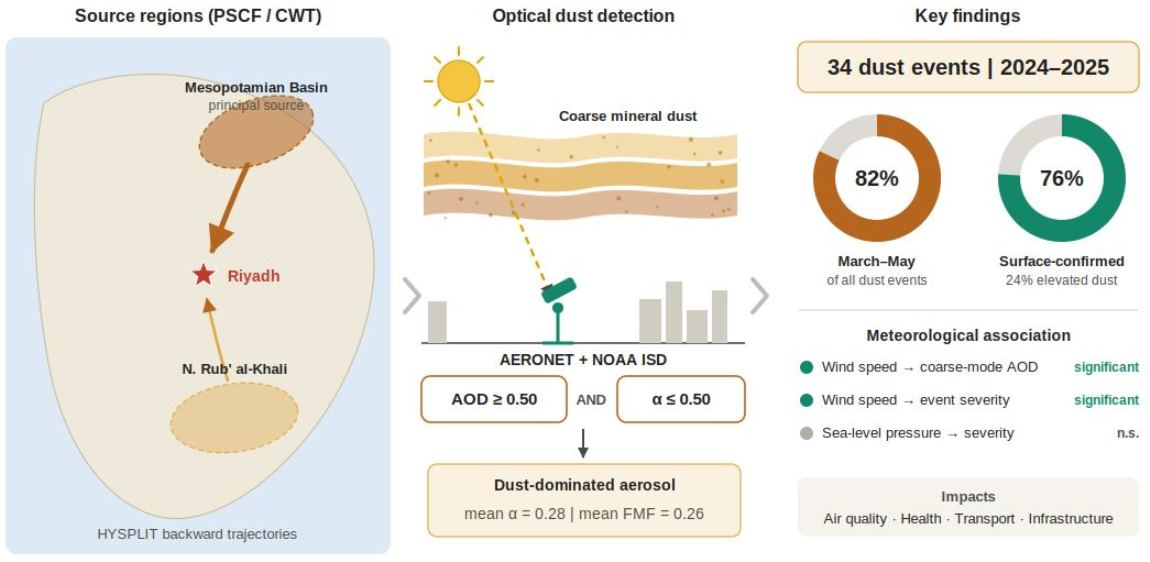
Application of the dual optical criterion to the 2024–2025 dataset identified 34 dust events over Riyadh. Dust activity exhibited a marked seasonal cycle, with events concentrated during spring and early summer. May recorded the highest frequency (13 events), followed by April (8 events) and March (7 events), together accounting for 82% of all identified events. The remaining events occurred during February, June, July, and August.
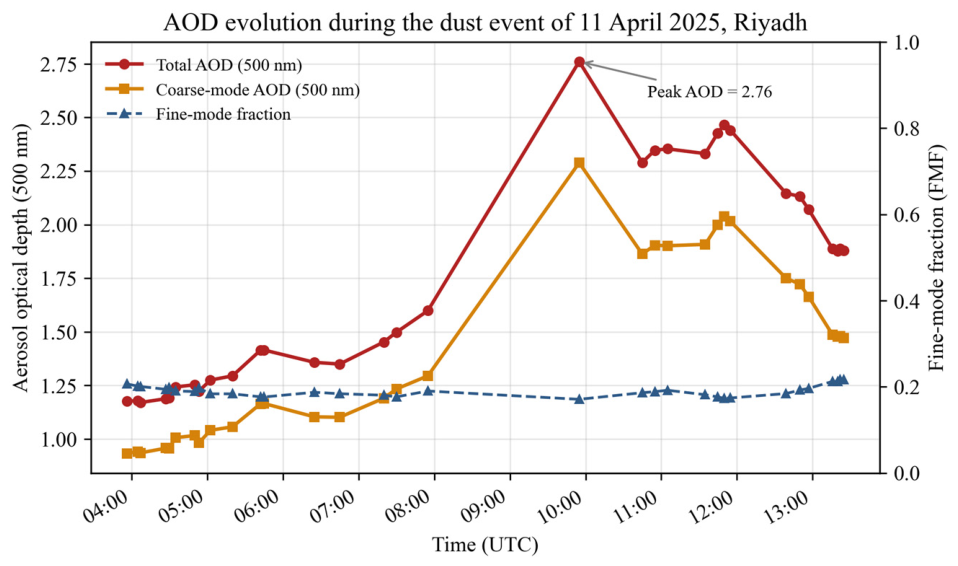
Across all identified events, the mean peak total AOD at 500 nm was 0.89 (median = 0.80), while the mean peak coarse-mode AOD reached 0.48. The mean Ångström exponent (0.28) and FMF (0.26) indicate that the aerosol burden was dominated by coarse mineral dust. The most intense event occurred on 11 April 2025, when the peak total AOD reached 2.76, accompanied by a coarse-mode AOD of 2.29 and an FMF of only 0.19. This event coincided with a surface dust storm that reduced visibility to 0.5 km.
To illustrate the temporal evolution of the dust event,
Figure 3 presents the sub-hourly variations in total AOD, coarse-mode AOD, and FMF during the most intense event observed on 11 April 2025. Total AOD increased rapidly between 08:00 and 10:00 UTC, reaching a peak value of 2.76. Throughout this period, the FMF remained consistently low (approximately 0.18–0.20), indicating that the increase in aerosol loading was dominated by coarse-mode mineral dust rather than fine anthropogenic particles (
Figure 3).
3.2. Aerosol Optical Properties and Type
The aerosol optical properties consistently indicate that all identified events were dominated by coarse mineral dust. The uniformly low mean Ångström exponent (0.28) and FMF (0.26) place all 34 events within the coarse-particle aerosol regime, confirming that mineral dust rather than fine anthropogenic aerosol governed the column loading during dust episodes over Riyadh.
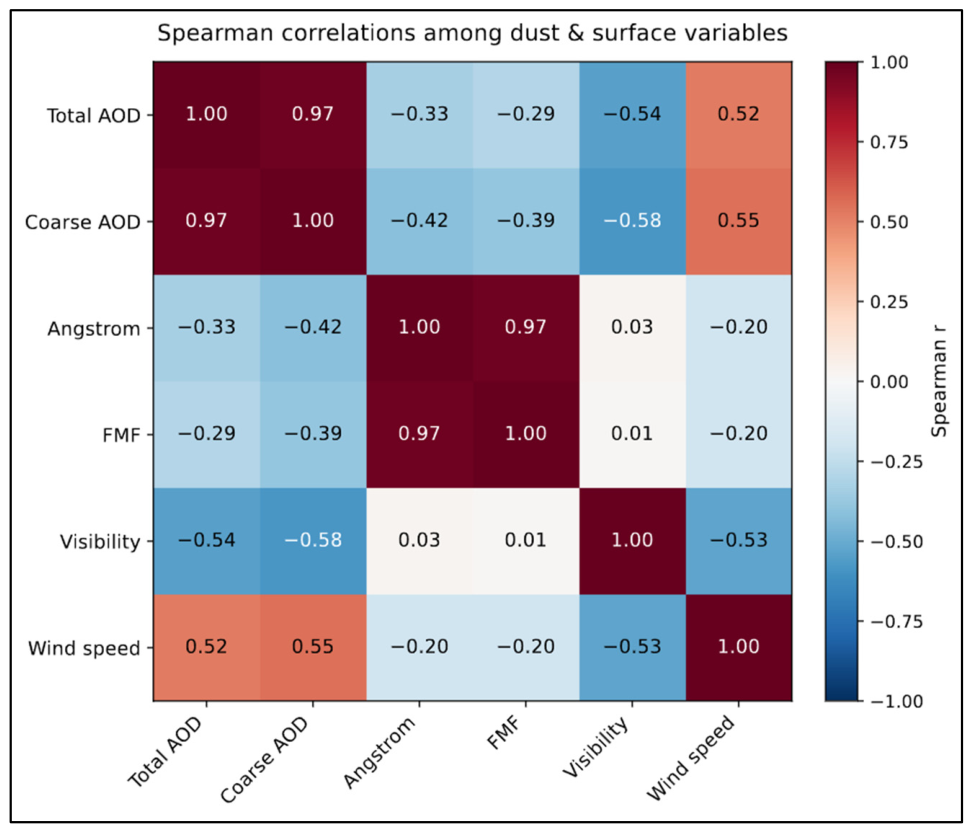
This interpretation is supported by the very strong positive association between total and coarse-mode AOD (Spearman’s
ρ = 0.97;
Figure 4). The near-unity correlation confirms that variations in total column loading were driven almost entirely by the coarse particle mode, consistent with a mineral-dust-dominated aerosol regime. In contrast, both total and coarse-mode AOD were only weakly and negatively correlated with the Ångström exponent (−0.33 and −0.42, respectively) and FMF (−0.29 and −0.39), indicating a limited and secondary contribution from fine anthropogenic particles, even during elevated-loading conditions. The Ångström exponent and FMF were themselves very strongly correlated (
ρ = 0.97), as expected, since both parameters characterize the fine-to-coarse partitioning of the aerosol size distribution, providing an internal consistency check on the retrievals.
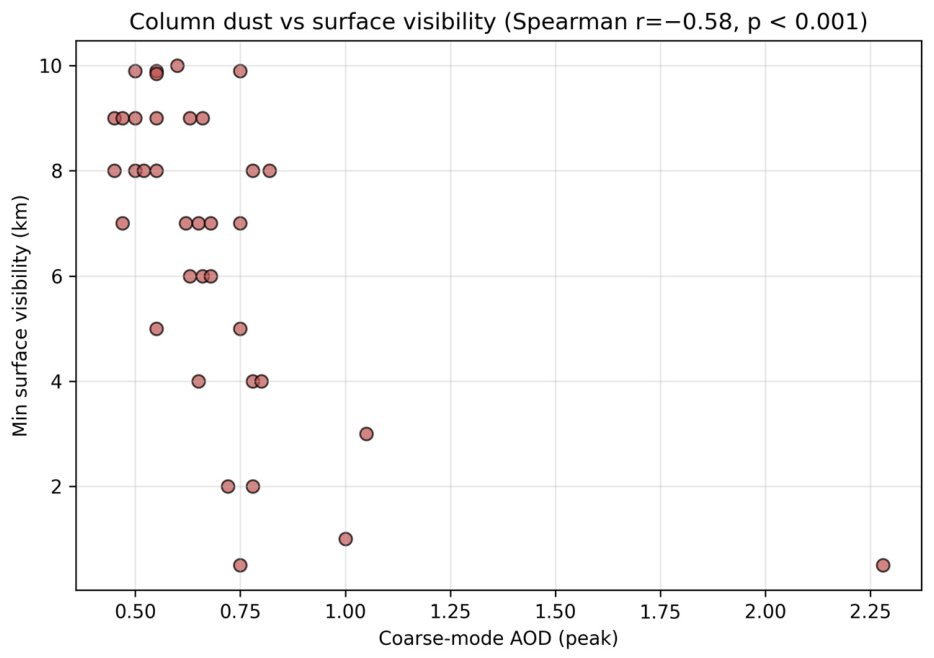
The optical parameters also showed physically coherent links with the surface conditions. Both total and coarse-mode AOD were negatively correlated with horizontal visibility (−0.54 and −0.58) and positively correlated with surface wind speed (0.52 and 0.55), consistent with wind-driven mobilization of coarse dust that simultaneously increases column loading and reduces surface visibility. Accordingly, coarse-mode AOD was adopted as the principal optical indicator of dust intensity in the subsequent transport-pathway and source-region analyses.
3.3. Event Classification
The 34 identified events exhibited substantial variability in surface severity and dust-raising mechanism (
Table 2). Based on visibility, two events were classified as dust storms (visibility < 1 km), seven as dense dust (1–5 km), 17 as moderate dust (5–10 km), and eight as elevated dust events, during which the atmospheric column was dust-laden while surface visibility remained largely unaffected.
Classification according to dust-raising mechanism showed that transported (suspended) dust was the most frequent category, accounting for 19 events, followed by four mixed events and three locally raised events. The remaining eight elevated events could not be assigned to a surface dust-generation mechanism because the dust layer remained aloft.
3.4. Surface Validation
Independent validation was performed using synoptic surface observations. Of the 34 photometrically identified dust events, 26 events (76%) were confirmed by surface weather observations reporting dust on the same day. The remaining eight events (24%) were classified as elevated dust events, characterized by high AOD, high coarse-mode aerosol loading, and low Ångström exponent values, while surface observations reported clear conditions with visibility close to 10 km.
The event of 17 April 2025 exemplifies this category, with elevated aerosol optical signatures together with surface visibility remaining near 10 km throughout the day. The agreement between the optical identification and the surface observations indicates that most photometrically identified dust events were independently confirmed by the surface observations.
3.5. Transport Pathways
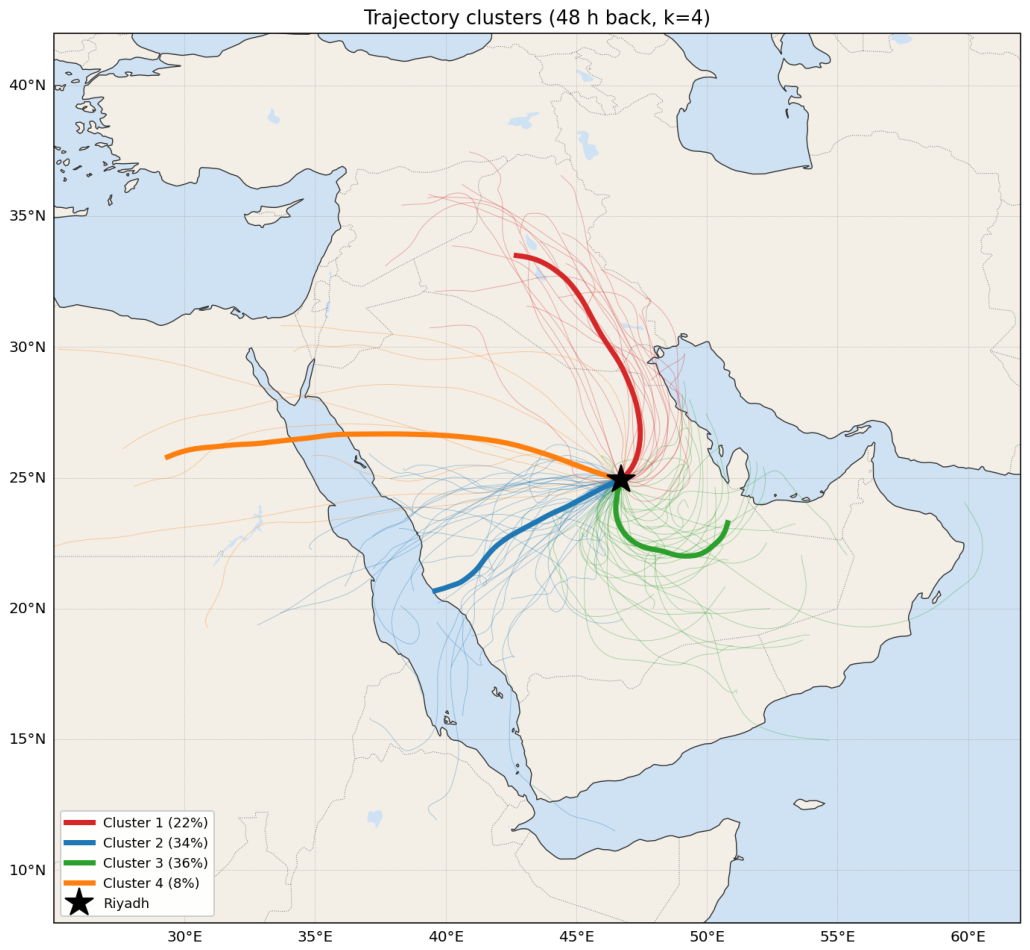
Analysis of the complete set of 102 backward trajectories (34 events × three arrival heights) revealed that air masses reaching Riyadh originated predominantly from the north, southwest, southeast, and west (
Figure 5). Cluster analysis grouped these trajectories into four representative transport pathways (
Figure 5): Cluster 1, a northern pathway originating over the Iraqi–Mesopotamian region (22% of trajectories); Cluster 2, a southwesterly pathway (34%); Cluster 3, an easterly–southeasterly pathway (36%); and Cluster 4, a long-range westerly pathway (8%).
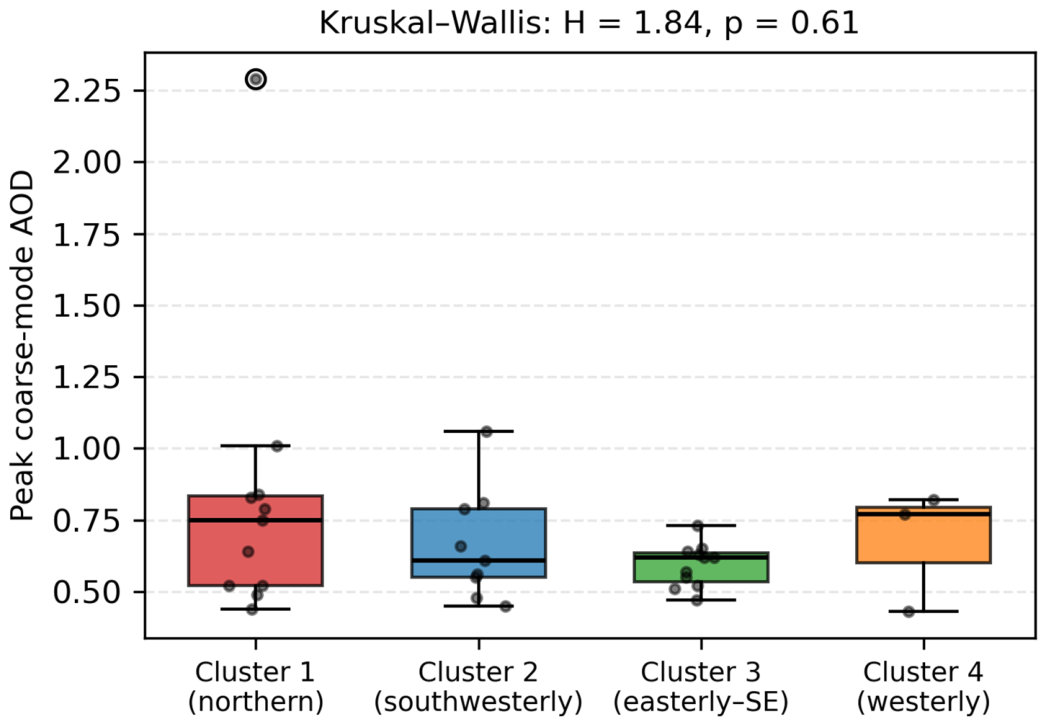
The four pathways varied in occurrence frequency and showed differences in mean associated dust loading. The easterly–southeasterly pathway (Cluster 3) was the most frequently observed yet carried the lowest mean coarse-mode aerosol loading. In contrast, the northern Iraqi–Mesopotamian pathway (Cluster 1), although less frequent, transported the highest coarse-mode concentrations (
Section 3.6). These results indicate that transport frequency and aerosol intensity are not directly coupled: the most active corridor delivers comparatively weak dust, whereas the less frequent northern pathway was associated with the highest mean peak coarse-mode AOD.
This distinction is important for interpreting the source-region analysis, because the PSCF and CWT analyses are weighted by coarse-mode AOD rather than by trajectory frequency. Consequently, the Mesopotamian Basin is identified as a major potential source region, while the northern Rub’ al-Khali is identified as a secondary potential source region. The aerosol characteristics associated with each pathway, together with their statistical significance and implications for source attribution, are examined in the following sections.
3.6. Dust Intensity Versus Transport Pathway
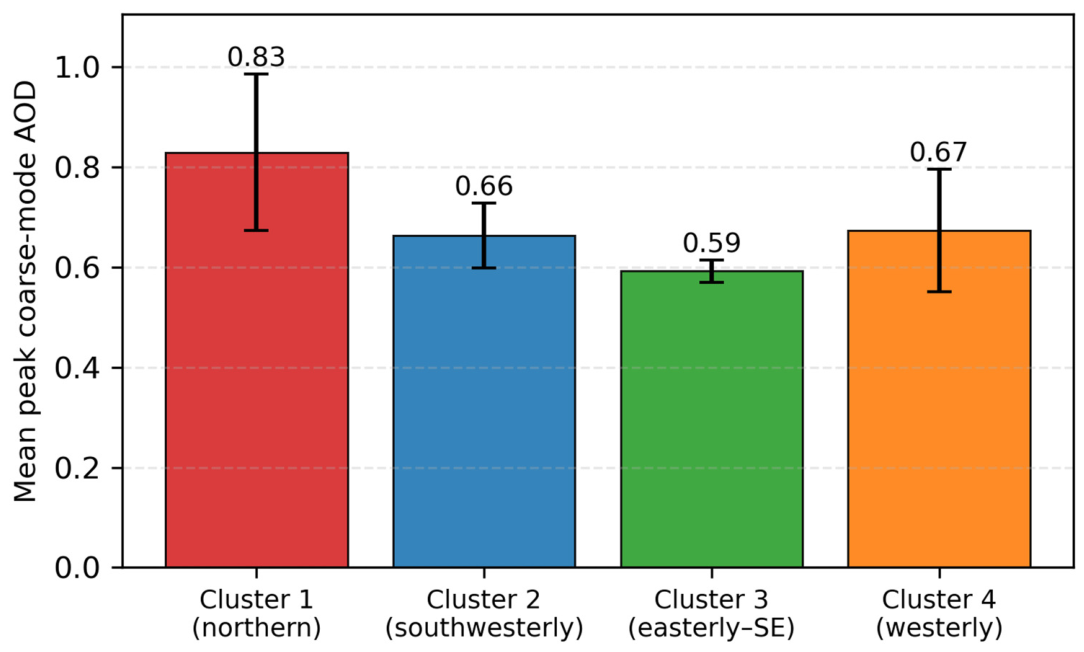
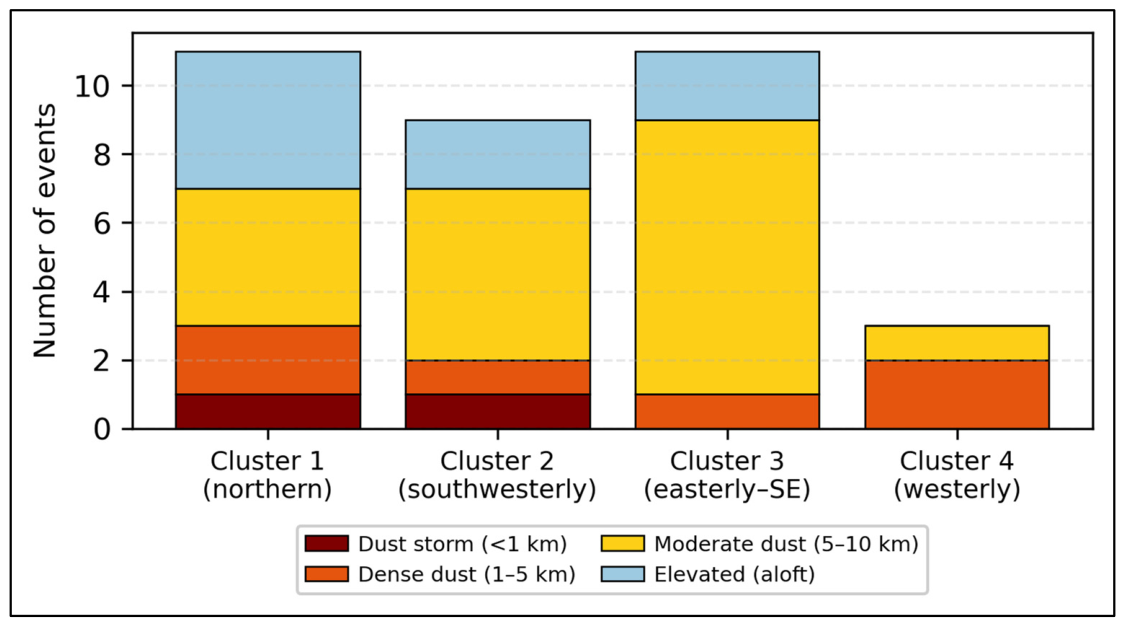
Dust intensity varied among the four transport pathways. The northern Iraqi–Mesopotamian pathway (Cluster 1) exhibited the highest mean peak coarse-mode AOD (0.83), followed by the long-range westerly (Cluster 4, 0.67) and southwesterly (Cluster 2, 0.66) pathways. The easterly–southeasterly pathway (Cluster 3), which accounted for the greatest share of trajectories (36%), showed the lowest mean peak coarse-mode AOD (0.59) and was dominated by moderate-severity events (
Figure 6,
Figure 7 and
Figure 8).
These values indicate that the most frequently activated corridor was not the most intense: The easterly–southeasterly pathway occurred most often yet delivered the weakest coarse-mode loading, whereas the less frequent northern pathway produced the highest coarse-mode concentrations. The severity composition is consistent with this pattern: Cluster 3 was dominated by moderate-severity events (8/11), whereas the northern pathway encompassed the full severity range, including the only dust-storm (<1 km) event, dense-dust events, and several elevated (aloft) events (
Figure 8).
It should be emphasized, however, that a Kruskal–Wallis test indicated that the differences in peak coarse-mode AOD among the four pathways were not statistically significant (
H = 1.84,
p = 0.61;
Figure 7). Given the limited number of events per cluster over the two-year period—particularly in the long-range westerly pathway (three events)—this ordering should be interpreted as an indicative tendency rather than a firm statistical distinction. Despite the absence of statistical significance, the broad consistency between the mean coarse-mode AOD, the severity composition, and the source-region analysis (
Section 3.7) qualitatively supports the interpretation that transport frequency and dust intensity are not directly coupled over Riyadh.
3.7. Dust-Raising Mechanism, Wind Speed, and Transport Pathway
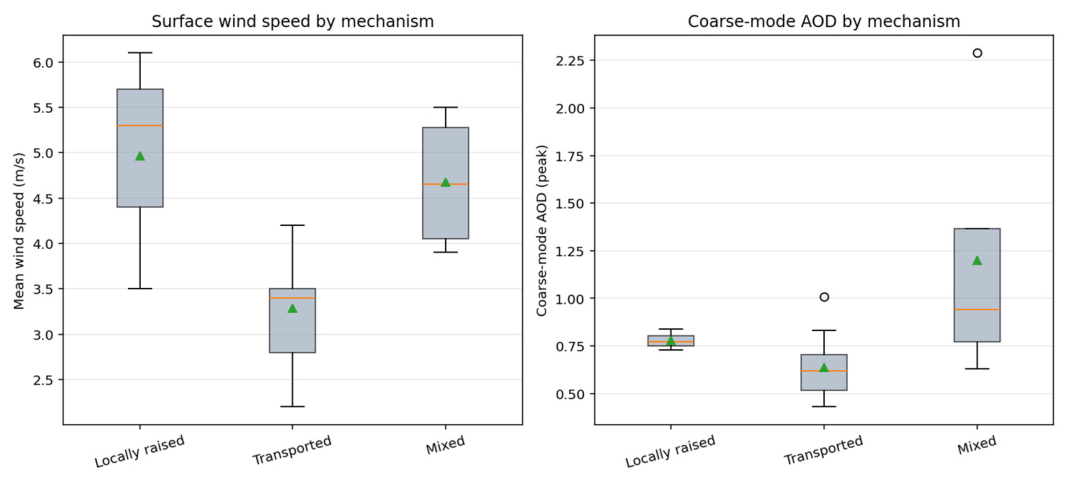
The relationship between the dust-raising mechanism, surface wind speed, and transport pathway was examined. Locally raised dust events occurred under significantly stronger surface winds than transported dust events, with mean wind speeds of 4.97 m s
−1 and 3.28 m s
−1, respectively, while mixed events showed intermediate wind speeds (mean ≈ 4.6 m s
−1). The difference between locally raised and transported events was statistically significant (Mann–Whitney U test,
p = 0.034;
Figure 9). This is physically consistent, as locally raised dust requires strong surface winds to mobilize particles, whereas transported dust can arrive under weaker local winds. The coarse-mode AOD showed a complementary pattern, with mixed and locally raised events exhibiting higher median coarse-mode loading than transported events (
Figure 9).
Transport-pathway analysis showed that elevated (aloft) dust events occurred most frequently within the northern pathway (Cluster 1); four of the eleven events assigned to this pathway were classified as elevated. Together, these results indicate that locally raised dust events were associated with higher surface wind speeds, while elevated dust events occurred most frequently within the northern transport pathway.
3.8. Correlation Analysis
Spearman rank-correlation analysis examined the relationships between aerosol optical properties, surface meteorological conditions, and dust-event severity (
Figure 4;
Table 3). Coarse-mode AOD showed a significant positive correlation with both mean (
ρ = 0.54,
p = 0.0010) and maximum (
ρ = 0.57,
p = 0.0005) surface wind speed. Likewise, coarse-mode AOD exhibited a significant negative correlation with minimum surface visibility (
ρ = −0.58,
p = 0.0004;
Figure 10).
Surface wind speed also showed a significant positive association with dust-event severity. Both mean and maximum wind speed were positively correlated with event severity (ρ = 0.57 and 0.53, respectively), while the Kruskal–Wallis test indicated significant differences in maximum wind speed among the severity classes (H = 10.83, p = 0.013). In contrast, sea-level pressure showed no statistically significant association with dust-event severity (ρ = −0.27, p = 0.12).
As expected, visibility exhibited a very strong negative correlation with dust-event severity (ρ = −0.83, p < 0.0001). Because event severity was defined using visibility thresholds, this relationship is presented as an internal consistency check rather than an independent finding.
In addition,
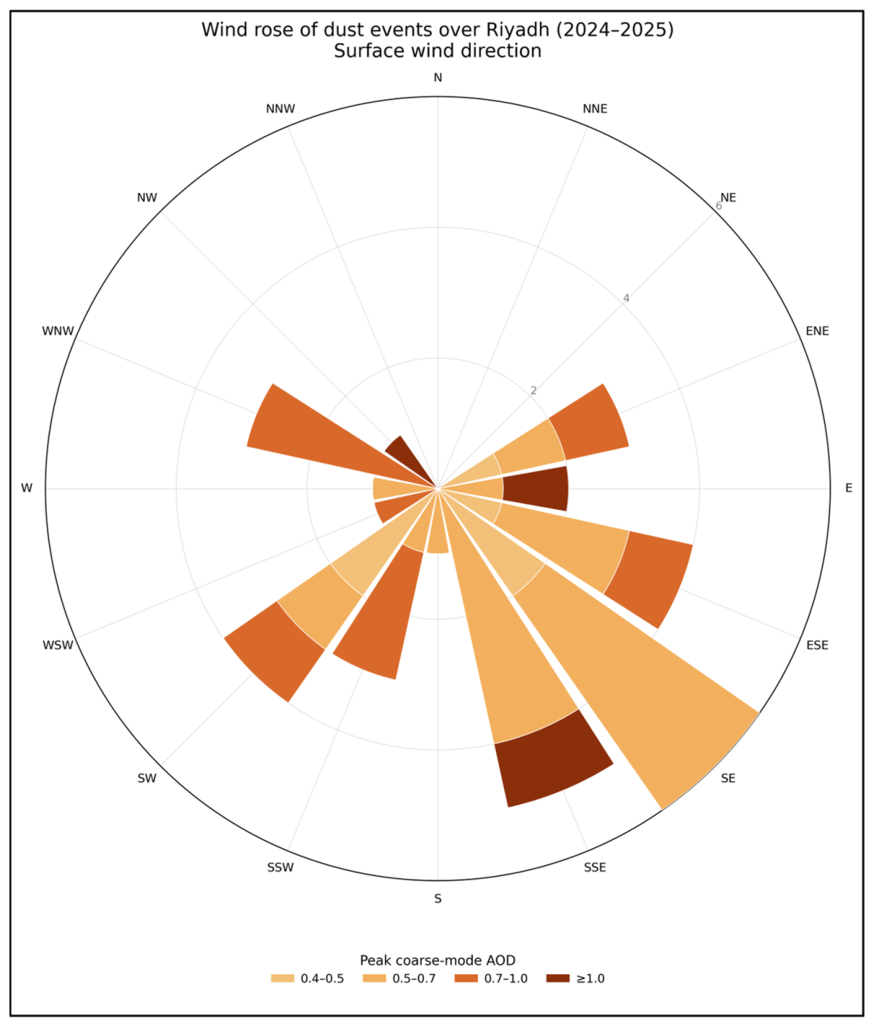
Figure 11 shows the distribution of surface wind directions during the identified dust events. Dust events occurred under a range of wind directions, with the highest frequencies associated with the southeasterly and southerly sectors. The bar colors indicate the corresponding peak coarse-mode AOD for each event, illustrating that elevated aerosol loading was observed under multiple surface wind directions.
3.9. Probable Source Regions (PSCF and CWT)
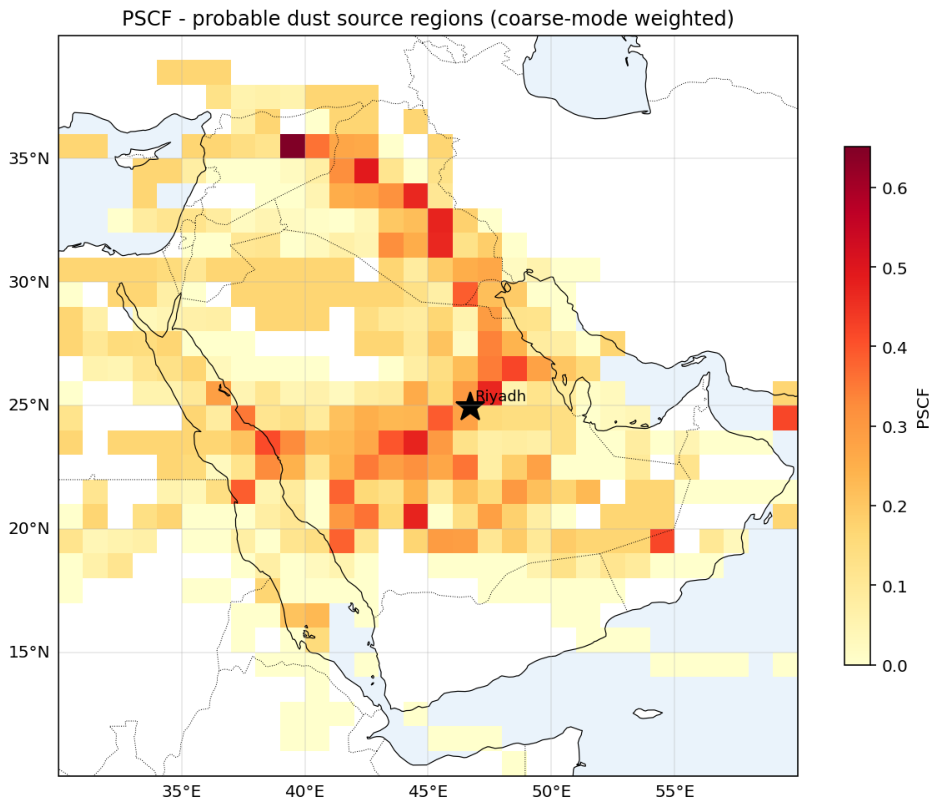
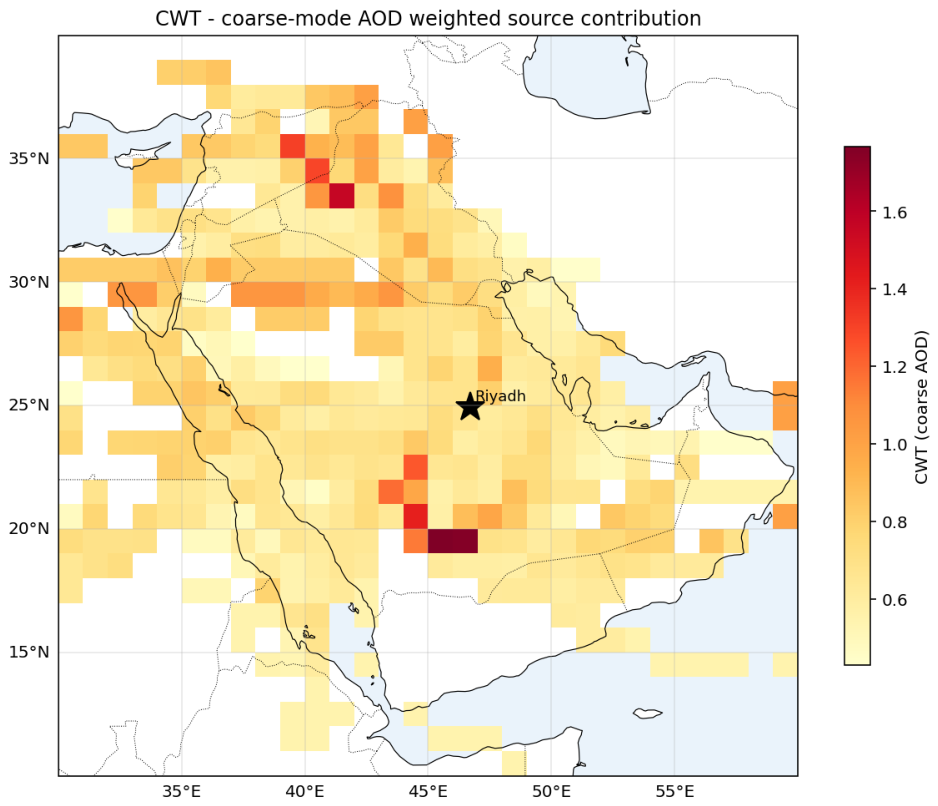
The PSCF and CWT analyses identified two potential dust source regions associated with dust events affecting Riyadh (
Figure 12 and
Figure 13). The highest CWT values were located over the Mesopotamian Basin and the northern Arabian Peninsula (approximately 33–35° N, 42–44° E). A second area of elevated CWT values was identified over the northern Rub’ al-Khali (approximately 19–22° N, 44–46° E).
The PSCF analysis identified a corresponding high-probability transport corridor extending from Iraq through central Najd to the Empty Quarter, showing a similar spatial distribution to the CWT results. Together with the backward trajectory clustering analysis, these results identify the Iraqi–Mesopotamian region and the northern Rub’ al-Khali as the principal source regions associated with the identified dust events. The identified source regions are consistent with previous regional studies.
4. Discussion
4.1. Seasonal Occurrence and Aerosol Characteristics
The predominance of spring dust events observed in the present study agrees with previous regional observations. Yu et al. [
39] reported that dust activity over the Arabian Peninsula reached its maximum during spring and summer. Similarly, Shalaby et al. [
40] identified spring as the principal dust season over Saudi Arabia, whereas Mashat et al. [
41] linked dusty spring days over central Saudi Arabia to characteristic synoptic conditions. More recently, Assiri et al. [
42] also reported that spring remained the dominant dust season across Saudi Arabia. The agreement with these studies indicates that the seasonal pattern observed in Riyadh during 2024–2025 is consistent with previously reported regional patterns.
The aerosol optical properties observed during the identified events are also consistent with previous AERONET observations over central Saudi Arabia. Al Otaibi et al. [
27] reported that spring dust events were characterized by elevated aerosol loading and a predominance of coarse particles, reflected by low Ångström exponent values and increased coarse-mode aerosols. The predominance of coarse-mode aerosols in the present study is consistent with the established optical characteristics of desert dust, which is typically associated with low Ångström exponent values and coarse-particle dominance [
43,
44]. Similar optical characteristics have been reported in other arid regions. Basart et al. [
45], using AERONET observations across North Africa and adjacent regions, reported mineral-dust conditions characterized by elevated AOD and low Ångström exponent values, consistent with coarse-particle dominance. This comparison indicates that the optical characteristics observed during the Riyadh dust events are consistent with those reported for mineral dust using AERONET observations in other dust-affected arid regions.
The intensity of the strongest event observed in the present study can also be compared with previous observations over Saudi Arabia. The peak AOD of 2.76 recorded on 11 April 2025, was slightly higher than the AOD of approximately 2.3 during a major dust storm over Riyadh on 20 March 2017, reported by Labban and Farahat [
46]. This comparison places the 2025 event among the high-aerosol-loading dust events previously documented over Riyadh. However, the comparison is limited to the reported AOD magnitude and does not imply equivalence between the two events.
4.2. Transport Pathways and Source Regions
The PSCF and CWT analyses were consistent with the backward-trajectory analysis, indicating the Mesopotamian Basin as a major potential source region and the northern Rub’ al-Khali as a secondary potential source region associated with dust events affecting Riyadh. The spatial correspondence among these trajectory-based analyses provides a consistent representation of the identified transport pathways and potential source regions. Notably, trajectory frequency did not correspond directly to the mean dust loading associated with each pathway. Although the easterly–southeasterly pathway was the most frequently observed (36% of trajectories), it was associated with the lowest mean peak coarse-mode AOD (0.59), whereas the less frequent northern Iraqi–Mesopotamian pathway (22%) was associated with the highest mean value (0.83). However, the differences in peak coarse-mode AOD among the four pathways were not statistically significant (Kruskal–Wallis, p = 0.61). The observed ordering should therefore be interpreted as an indicative tendency within the present dataset rather than a statistically established difference among transport pathways.
The identification of the Iraqi–Mesopotamian region as a potential source is consistent with previous investigations of dust transport over Saudi Arabia and the Arabian Peninsula. Notaro et al. [
47] showed that dust affecting the central Arabian Peninsula can be transported from the Iraqi and Syrian deserts by northwesterly Shamal winds, while Ashrafi et al. [
31] identified Iraq and surrounding desert regions as important contributors to dust transport across the Middle East. Yassin et al. [
33] likewise reported dust transport from northern source regions toward Saudi Arabia. The location identified in the present analysis is also consistent with the geomorphological characteristics reported for the Tigris–Euphrates basin. Gandham et al. [
48] identified fluvial and alluvial deposits, ephemeral drainage systems, and dry lakebeds as dust-emitting surfaces within this region, including active emission areas extending from southern Iraq toward the northern Saudi border. Moreover, the source-region pattern is consistent with Albanai et al. [
49], who identified southern Mesopotamia and northern Kuwait as important dust-emitting regions in the northeastern Arabian Peninsula and reported the role of northwesterly Shamal winds in regional dust transport. In addition to the northern source region, the PSCF and CWT results in the present study identified the northern Rub’ al-Khali as a secondary potential source region. Overall, the source–receptor results and backward trajectories show a consistent spatial association with the Iraqi–Mesopotamian region and, secondarily, the northern Rub’ al-Khali, while the lack of statistically significant differences in coarse-mode AOD among the trajectory clusters limits stronger conclusions regarding differences in dust intensity between individual transport pathways.
4.3. Surface Versus Elevated Dust Events
The comparison between AERONET observations and surface synoptic records showed that not all dust events detected within the atmospheric column were accompanied by reduced surface visibility. Of the 34 events identified from the AERONET record, 26 (76%) were confirmed by a same-day surface dust report. The remaining eight (24%) were classified as elevated dust events, in which the column retrievals indicated high coarse-mode loading and a low Ångström exponent, yet no dust-related ww code was reported at the co-located ISD. The 17 April 2025 event exemplifies this category, with elevated column dust signatures while surface visibility remained near 10 km.
A similar discrepancy between column-integrated aerosol observations and surface measurements was reported by Gkikas et al. [
50], who demonstrated that elevated dust layers may be clearly detected by remote-sensing observations while remaining weakly represented in surface measurements because the dust is transported aloft. This interpretation is further supported by Marinou et al. [
51], whose spaceborne-lidar climatology of Saharan dust resolved distinct elevated dust layers at 2–6 km that were vertically decoupled from near-surface observations. Observations from another arid environment also demonstrate the vertical extension of aerosol layers. Nelli et al. [
52] reported vertically extended aerosol layers over the United Arab Emirates using CALIPSO observations, with aerosol extinction extending to approximately 3–4 km in the summer. These observations provide regional context for the distinction between column-integrated aerosol detection and surface meteorological observations.
The elevated dust events identified in the present study therefore illustrate the complementary information provided by column-integrated aerosol retrievals and surface meteorological observations. AERONET characterizes aerosol loading through the atmospheric column, whereas surface visibility and synoptic weather reports describe conditions near the surface. The agreement between the AERONET-based detection and same-day surface dust reports for 26 of the 34 identified events provides independent observational support for the event-identification approach. Meanwhile, the eight elevated events demonstrate that the two observational datasets do not necessarily represent the same vertical portion of the atmosphere.
4.4. Wind Speed and Dust-Event Severity
Surface wind speed showed statistically significant associations with both dust-event severity and coarse-mode aerosol loading in the present dataset. The comparison among dust-raising mechanisms also showed that locally raised events occurred under significantly stronger surface winds than transported events, while mixed events exhibited intermediate wind conditions. These results indicate that the wind conditions measured at Riyadh differed among the identified event mechanisms and were associated with variations in both event severity and coarse-mode aerosol loading. The occurrence of elevated aerosol loading under multiple surface wind directions further shows that high coarse-mode loading was not restricted to a single wind sector.
The observed associations are consistent with previous studies conducted over Saudi Arabia. Labban and Butt [
53] reported a significant positive correlation (
r = 0.53) between sand and dust storm occurrence and wind speed based on 30 years of meteorological observations across the Kingdom. Albugami et al. [
21] documented the spatial and temporal variability of dust-storm incidence across Saudi Arabia using long-term in situ observations. Gandham et al. [
48] also reported an important role of strong northerly Shamal winds in regional dust transport over the Arabian Peninsula. In the present study, the significant associations between surface wind speed, coarse-mode aerosol loading, and event severity are consistent with the relationship between wind conditions and dust occurrence reported in these regional studies. The differences among the dust-raising mechanisms provide additional context for interpreting the surface wind measurements. Locally raised events were associated with higher surface wind speeds than transported events, whereas elevated events occurred most frequently within the northern transport pathway. These two observations describe different aspects of the identified events: the first characterizes surface meteorological conditions at Riyadh, while the second characterizes the pathways derived from the trajectory analysis. They should therefore not be interpreted as measurements of the same process.
This distinction is also important when considering the spatial characteristics of the wind observations. Surface wind speed was measured at the Riyadh receptor site, whereas the backward-trajectory and source–receptor analyses identified potential source regions outside Riyadh. Consequently, the surface wind measurements used in the correlation and mechanism analyses characterize conditions at the receptor and do not provide direct measurements of wind speed at the identified potential source regions. The significant relationships observed in the present study therefore describe statistical associations between surface wind conditions, coarse-mode aerosol loading, and event severity at Riyadh; they do not establish that local surface winds were responsible for dust emission in all events. Considering the surface observations together with the aerosol optical properties and trajectory information allows the locally raised, transported, mixed, and elevated event categories to be interpreted within the observational framework applied in this study.
4.5. Study Implications and Limitations
The integrated use of AERONET aerosol observations, co-located NOAA ISD surface records, HYSPLIT backward trajectories, and PSCF/CWT analyses provided complementary information on the aerosol characteristics, surface conditions, transport pathways, and potential source regions of dust events affecting Riyadh. Together, these complementary datasets provide an integrated event-based framework for characterizing dust events over Riyadh.
The study used the currently available 2024–2025 AERONET record, with Level 1.5 observations because Level 2.0 products are not yet available for the Riyadh Airport SDSC station. Surface validation was based on the co-located NOAA ISD station and therefore reflects conditions reported at this observation site. For elevated events, AERONET indicated column-integrated aerosol properties consistent with dust, while no dust-related ww code was reported at the surface station; the classification therefore does not represent a direct measurement of dust-layer altitude.
HYSPLIT trajectories were used to characterize air-mass transport, while PSCF and CWT identified potential source regions associated with the trajectories and aerosol loading. The identified source regions are therefore interpreted as potential rather than quantitatively determined contributions. Longer observational records, additional observation sites, and vertical-profile measurements could complement the present analysis in future studies.
5. Conclusions
This study characterized dust events affecting Riyadh during 2024–2025 using AERONET aerosol observations, co-located NOAA ISD meteorological records, HYSPLIT backward trajectories, and PSCF/CWT source–receptor analyses. A total of 34 dust events met the adopted optical criteria, of which 82% occurred during spring. The identified events were characterized by elevated aerosol loading and a predominance of coarse-mode aerosols, accompanied by low Ångström exponent and fine-mode fraction values.
Comparison with the co-located NOAA ISD observations showed that 26 of the 34 optically identified events (76%) had a same-day dust-related present-weather report at the surface station. The remaining eight events (24%) were classified as elevated events because no dust-related ww code was reported at the station during the corresponding event day. This distinction shows that column-integrated aerosol observations and surface meteorological records provide complementary information for characterizing dust events at the study site.
The HYSPLIT trajectory, PSCF, and CWT analyses showed a consistent spatial association with the Mesopotamian Basin as a major potential source region and the northern Rub’ al-Khali as a secondary potential source region. The easterly–southeasterly pathway was the most frequently observed (36%), whereas the northern Iraqi–Mesopotamian pathway had the highest mean peak coarse-mode AOD. However, differences in peak coarse-mode AOD among the four transport pathways were not statistically significant (p = 0.61). Surface wind speed was significantly and positively associated with both coarse-mode AOD and dust-event severity, whereas sea-level pressure showed no statistically significant association with severity.
The analysis was based on the available 2024–2025 AERONET record from the Riyadh_Airport_SDSC station, with surface validation based on the co-located NOAA ISD station. Accordingly, the results characterize the identified events and transport patterns during the study period at this observation site. Longer observational records and additional monitoring locations could be used in future studies to examine interannual and spatial variability in dust occurrence and transport. In addition, the combined analysis provided information on the seasonal occurrence, aerosol characteristics, surface manifestation, transport pathways, and potential source regions of dust events affecting Riyadh during 2024–2025. The results provide an observational basis for continued investigation of dust occurrence and transport over central Saudi Arabia.