Article

Policy Pathways for Coordinated CO2 and Air Pollutant Reductions in Urban Road Transport: A Case Study of Zhengzhou, China

1
Institute of Environmental Sciences, Zhengzhou University, Zhengzhou 450001, China
2
School of Ecology and Environment, Zhengzhou University, Zhengzhou 450001, China
*
Author to whom correspondence should be addressed.
Atmosphere 2026, 17(8), 790; https://doi.org/10.3390/atmos17080790
Submission received: 10 July 2026 / Revised: 10 August 2026 / Accepted: 14 August 2026 / Published: 18 August 2026

Abstract

Urban road transport policies must simultaneously address climate mitigation, local air quality, and the infrastructure requirements associated with vehicle electrification. However, these dimensions are rarely evaluated within a unified city-level framework. This study develops an integrated assessment framework that combines a bottom-up co-source inventory of CO2 and seven air pollutants, Long-range Energy Alternatives Planning (LEAP)-based scenario modeling, policy contribution analysis, elasticity-based co-benefit assessment, and electric vehicle charging demand estimation for Zhengzhou, China. In 2022, the road transport sector consumed 10,178 ktce of energy and emitted 27.8 Mt of CO2. Private cars contributed 66.7% of CO2 emissions, whereas heavy- and medium-duty trucks and light-duty trucks contributed 48.1% and 27.9% of NOx emissions, respectively, collectively accounting for 76.0% of the total. Under the existing policy scenario (EPS), CO2 emissions increase to 45 Mt in 2030 and 55 Mt in 2040. Under the dual carbon scenario (DCS), emissions peak at approximately 36 Mt in 2030 and decline to 32 Mt by 2040, representing reductions of 20% and 42% relative to the EPS, respectively. Electric vehicle promotion and green transport development contribute 42% and 32% of peak-year CO2 mitigation. Policy effectiveness differs across emission types. Electric vehicle promotion and green public transport are relatively more effective for CO2 mitigation, whereas old vehicle retirement, motorcycle phase-out, light-truck electrification, and tighter emission standards provide greater air pollutant reduction benefits. Supporting an electric vehicle stock of approximately 1.22 million in 2030 would require about 610,000 charging piles at a vehicle-to-charger ratio of 2:1. The principal contribution of this study is to demonstrate how complementary vehicle technology, transport structure, emission control, power sector, and infrastructure policies can be combined to support city-level carbon peaking and air pollution co-control.

1. Introduction

Climate change and air pollution are two major global environmental challenges [1,2]. China has made substantial progress in the low-carbon energy transition and air pollution control. The country aims to realize the “Beautiful China” vision by 2035, attain peak carbon emissions prior to 2030, and reach carbon neutrality by 2060 while accelerating coordinated reductions in CO2 and air pollutants under the dual goals of “carbon peaking” and “air quality improvement.” China’s transportation sector is a major energy consumer and emission source, consuming approximately 42.8% of national gasoline and 52.5% of diesel, while contributing about 9.1% to total energy-related CO2 emissions. Rising vehicle ownership and freight volumes have significantly intensified both CO2 and air pollutant emissions from road transport [3,4].
On-road vehicle emissions are commonly quantified using bottom-up, activity-based inventory methods [5,6,7]. Emissions are calculated by combining the vehicle population, annual vehicle kilometers traveled (VKT), and pollutant-specific emission factors differentiated by vehicle category, fuel type, emission standard, and operating condition. These inventories provide detailed temporal and spatial insights into mobile source pollution, aiding policymakers in developing targeted control measures. Source apportionment studies and emission inventories for Chinese cities indicate that road vehicles contribute 10–30% to urban PM2.5 [8] and over 40% to NOx in megacities such as Beijing, Shanghai, and Guangzhou [9]. Private cars and motorcycles have been identified as major sources of urban air pollutant emissions [10]. However, most existing inventory studies have focused predominantly on criteria air pollutants, with relatively few efforts to develop integrated inventories that simultaneously account for CO2 and air pollutant emissions from the same source categories.
Recent studies have increasingly examined the co-evolution of transport-related CO2 and air pollutants and the mitigation potential of vehicle electrification, transport mode shifts, and tighter emission standards. Scenario-based projections for road transport emissions typically employ models such as the Long-range Energy Alternatives Planning (LEAP) system, combined with emission inventory data. Ou et al. (2010) utilized LEAP to project energy consumption and pollutant emissions from China’s road transportation system, highlighting increased oil demand due to vehicle growth and the benefits of alternative fuels [11]. Subsequent studies have similarly projected rising energy consumption and CO2 emissions while evaluating the effectiveness of various control measures [12,13,14]. Liu et al. (2018) projected the energy consumption of China’s vehicle fleet from 2016 to 2050, identifying energy peaks by 2027 under strengthened scenarios involving new energy vehicles, traffic management, and green mobility [15]. Additional studies have demonstrated the potential for pollutant reductions through measures such as vehicle restrictions, stricter emission standards, accelerated retirement of high-emission vehicles, and green energy promotion [16,17,18,19]. Despite these advances, most studies have addressed CO2 and air pollutant reductions in isolation, and integrated co-reduction frameworks remain scarce, particularly at the city level where policy implementation occurs.
An increasing body of research has focused on the environmental co-benefits of electric vehicles (EVs) given their rapid market penetration. Shang et al. (2024) assessed the impacts of large-scale EV promotion in Shanghai, demonstrating that NOx, PM, and CO2 emissions could decrease by 4.94%, 22.51%, and 24.60%, respectively, in 2025 relative to 2018 levels [20]. Xu et al. (2023) reported cumulative greenhouse gas reductions of 6.62 million tons from 2020 to 2030 through vehicle electrification in Hainan Province [21]. Van Vliet et al. (2011) analyzed EV emissions across different operational cycles, finding that carbon reduction benefits improve and unit costs decline as the share of renewable electricity increases [22]. Collectively, these studies demonstrate that EV promotion can enable synergistic reductions in both carbon and air pollutant emissions. However, realizing this potential at scale requires robust charging infrastructure support.
Studies demonstrate that EV penetration correlates positively with the expansion of charging infrastructure [23,24]. Optimizing the integrated “vehicle–pile–grid–storage” system—through intelligent scheduling, efficient charger maintenance, grid demand response, and dynamic energy storage management—is essential for sustaining high-penetration EV charging efficiency [25,26]. Such optimization requires intelligent platforms capable of real-time data fusion, predictive scheduling, and distributed control [27]. China’s National Energy Administration has set a long-term target of a 1:1 vehicle-to-pile ratio, with a transitional 2:1 ratio expected post-2025 as the market matures [28].
As a rapidly motorizing inland metropolis and a major passenger and freight transport hub in central China, Zhengzhou combines a large private car fleet with intensive diesel freight activity and expanding electric mobility. This study therefore develops an integrated city-level framework to: (1) compile a co-source inventory of CO2 and major air pollutants for 2022; (2) project energy consumption and emissions to 2040 under an existing policy scenario (EPS) and a dual carbon scenario (DCS) using the LEAP model; (3) quantify the contributions and co-benefits of individual mitigation measures; and (4) estimate the charging infrastructure required to support the projected electric vehicle fleet. By linking emissions, policy contributions, co-benefit indicators, and infrastructure demand within one analytical framework, this study provides a more operational basis for coordinated urban transport decarbonization and air pollution control.

2. Methods

2.1. Study Area

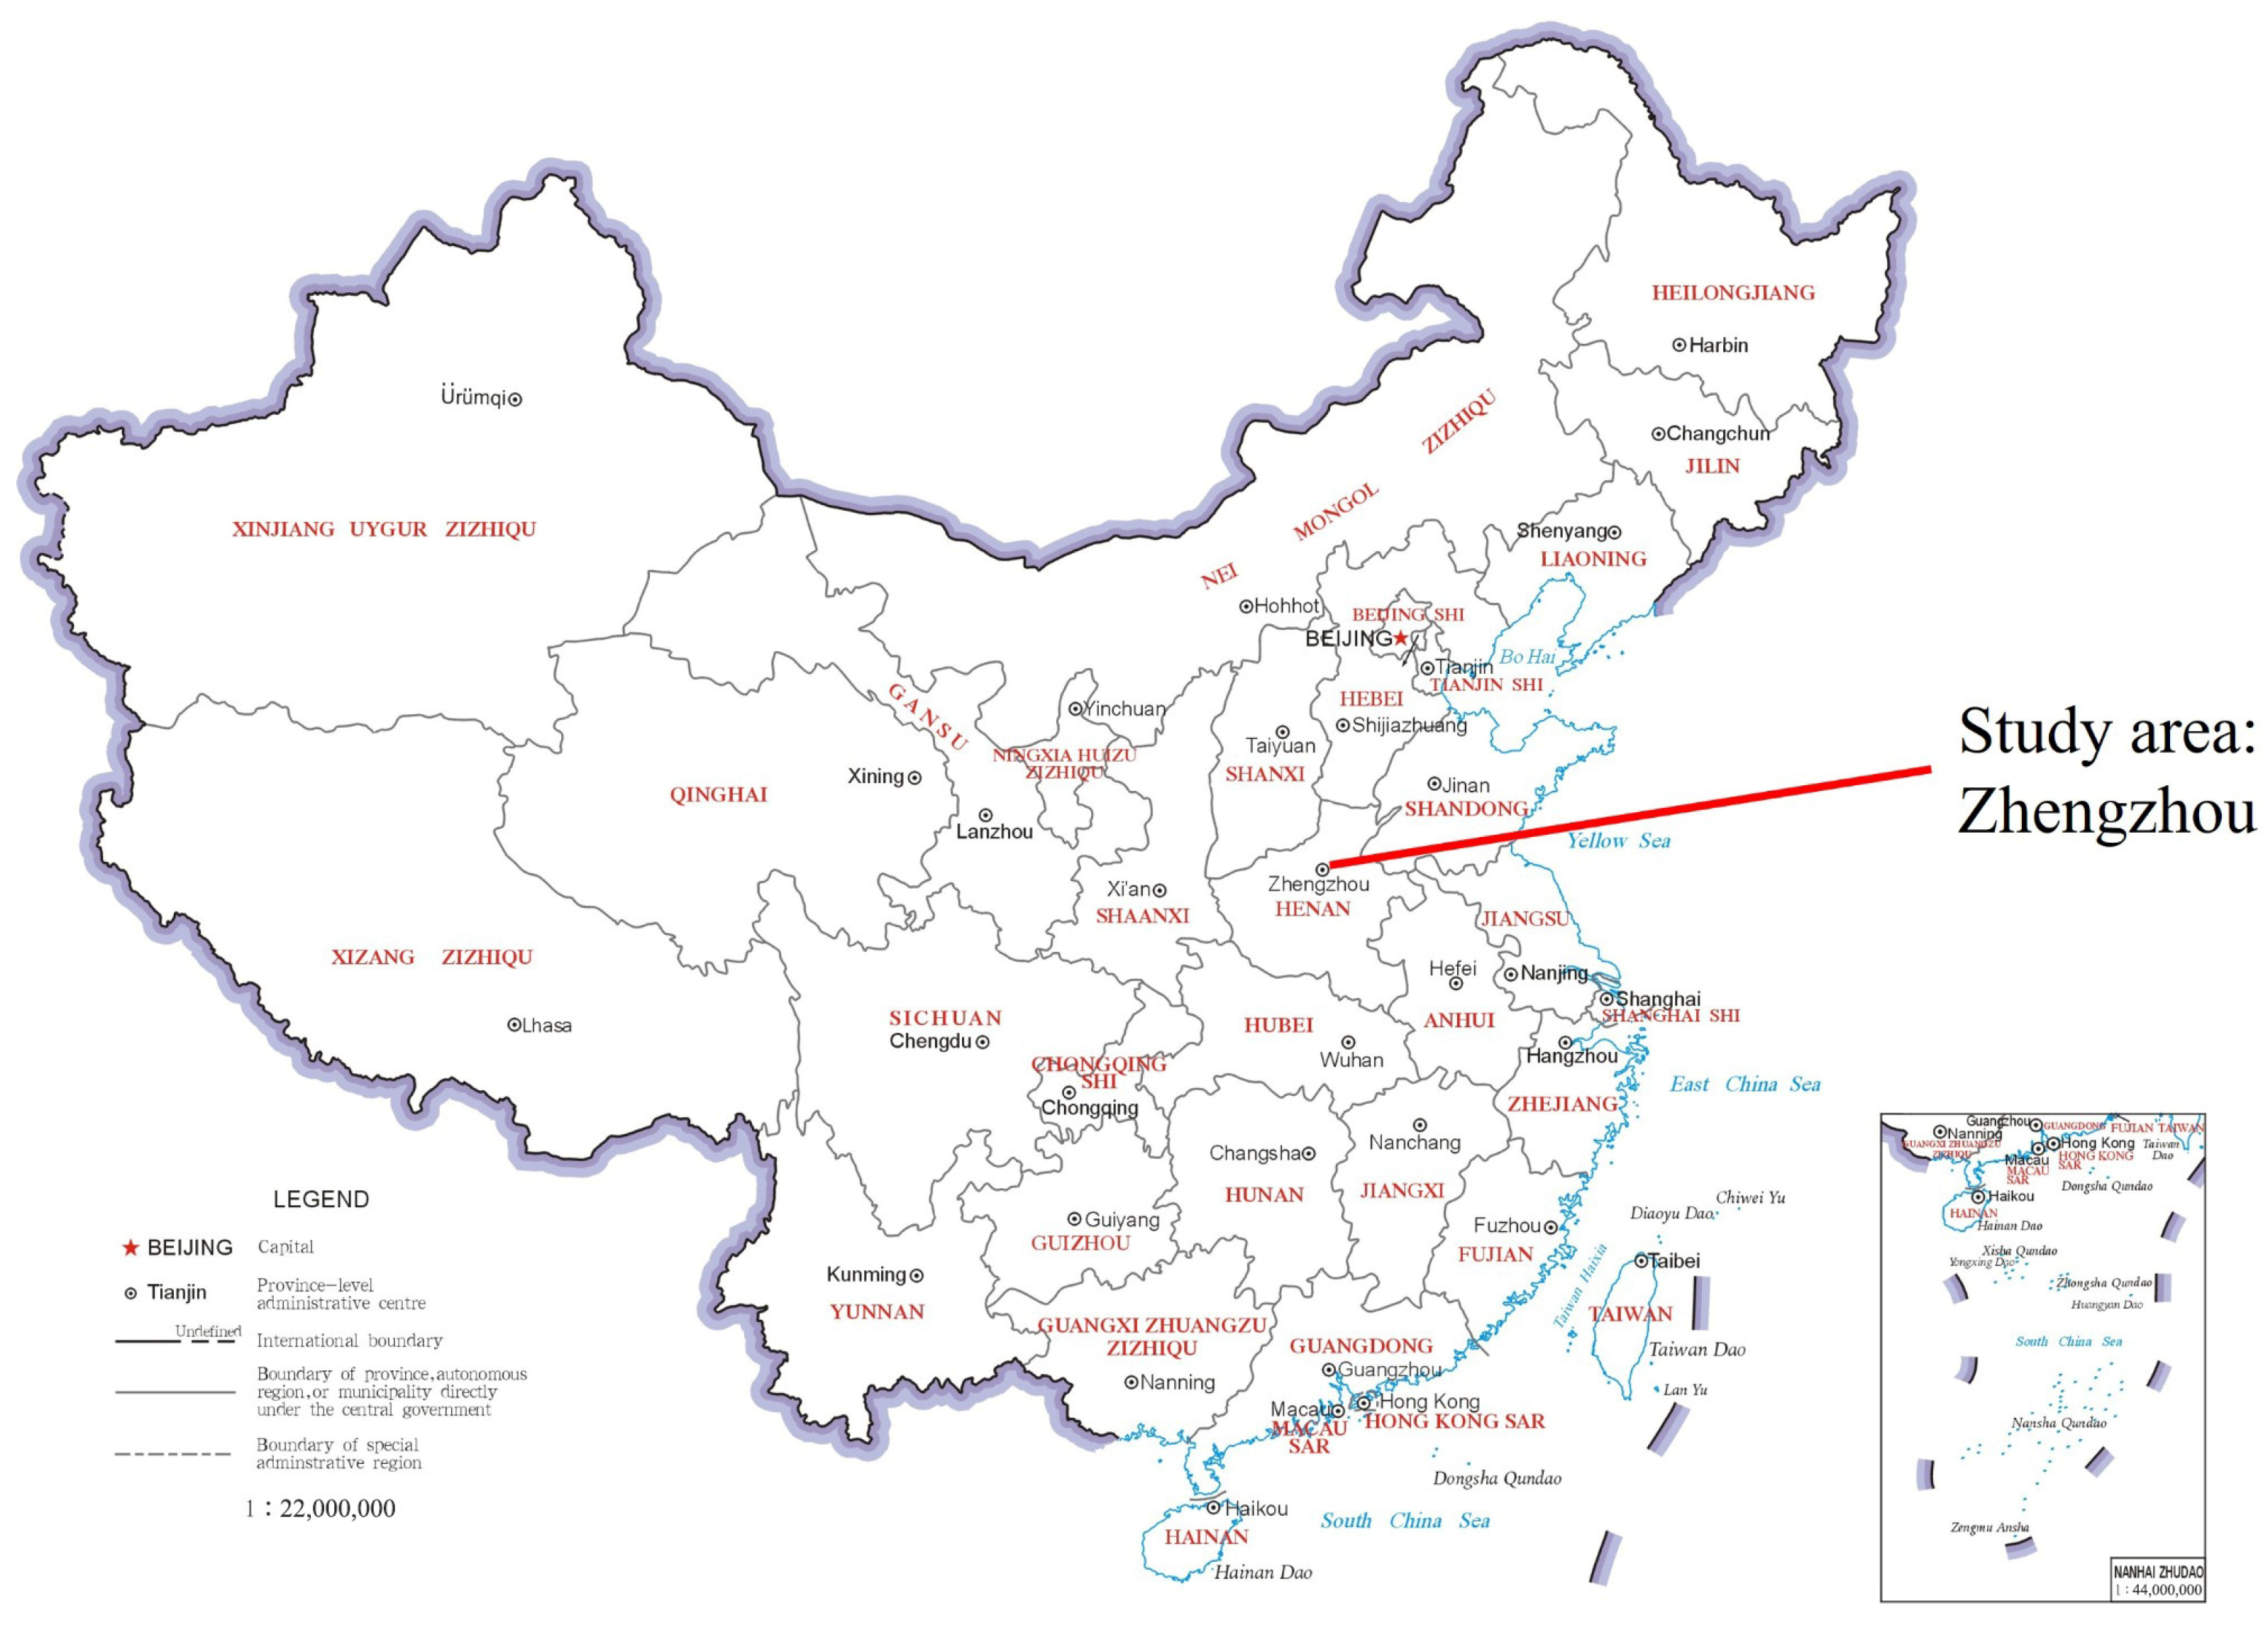
Zhengzhou, the capital of Henan Province, is located in central China (34°16′–34°58′ N, 112°42′–114°14′ E). In 2022, the city had a resident population of approximately 12.8 million and a gross domestic product of CNY 1.29 trillion. Zhengzhou is an important inland transport and logistics hub, with extensive expressway and railway connections, a major international airport, and national logistics and freight-train functions. Its large vehicle stock, rapidly growing passenger travel demand, and intensive intercity freight activity make it a representative case for assessing coordinated CO2 and air pollutant mitigation in rapidly motorizing inland cities. The analysis integrates data from the Zhengzhou Statistical Yearbook, vehicle registration records, national and local technical guidelines, previous Zhengzhou vehicle emission studies, fuel and electricity parameters, and national, provincial, and municipal policy documents. The geographical location of Zhengzhou is shown in Figure 1.

2.2. Methodological Framework

The methodological framework consists of four linked modules. First, a bottom-up co-source emission inventory was developed for Zhengzhou’s road transport sector in the 2022 base year. The inventory covers CO2 and seven air pollutants, including CO, NOx, volatile organic compounds (VOCs), PM10, PM2.5, SO2, and NH3, across seven vehicle categories and multiple emission standards. Second, the base-year inventory was incorporated into the LEAP model to project vehicle stock, energy demand, CO2 emissions, and exhaust air pollutant emissions from 2022 to 2040 under the EPS and DCS. Third, the contributions of individual mitigation measures were quantified for the carbon-peaking year, and elasticity coefficients were used to characterize the relative co-benefits between CO2 and air pollutant reductions. Fourth, future charging infrastructure demand was estimated from the projected electric vehicle stock and the target vehicle-to-charger ratio.
The accounting boundary differs between CO2 and local air pollutants. For gasoline, diesel, and liquefied-petroleum-gas vehicles, operational CO2 emissions are calculated from fuel consumption, fuel carbon content, and carbon oxidation. For EVs, tailpipe CO2 emissions are zero, while indirect CO2 emissions from electricity generation are calculated by multiplying the vehicle electricity consumption by the corresponding grid electricity emission factor. The projected decarbonization of the electricity system is incorporated through scenario-specific electricity emission factors. Local air pollutant emissions include vehicle exhaust emissions within the road transport sector. Upstream air pollutant emissions from electricity generation and fuel production, vehicle and battery manufacturing, infrastructure construction, and non-exhaust particulate emissions are outside the present system boundary and are discussed as limitations.

2.3. Inventory of Air Pollutants and CO2 Emissions

The 2022 road transport emission inventory was established using a bottom-up activity-based approach. Emissions were calculated by multiplying the vehicle population, annual vehicle kilometers traveled, and pollutant-specific emission factors for each vehicle category and emission standard. The vehicle categories included heavy- and medium-duty trucks, light-duty trucks, buses, taxis, private cars, motorcycles, and other vehicles. The emission standards covered Pre-China I to China VI vehicles in use in 2022.

2.3.1. Vehicle Emissions

For each pollutant, the annual emissions from vehicle category i and emission standard j were calculated as follows:
E p = j i V P i , j × V K T i × E F i , j , p × 10 6
where V P i , j denotes the vehicle population of type i under emission standard j; V K T i represents the annual average distance traveled (km); and E F i , j , p represents the pollutants and CO2 emission factor (g/km). The pollutants considered include CO, NOx, VOCs, PM10, PM2.5, SO2, NH3, and CO2. The emission standards for vehicles include Pre-China I to China VI standards in use in 2022.

2.3.2. Vehicle Population by Emission Standard

Vehicle populations disaggregated by emission standard are not directly available from statistical data. This study estimates them based on registration timelines and survival rates, assuming that newly registered vehicles comply with the prevailing emission standard at the time of registration [29]. Historical and annual new registration data for Zhengzhou were obtained from the Zhengzhou Statistical Yearbook. The vehicle population by emission standard was calculated using Equation (2):
P i   = j     =   0 6   N i ,   m ,   n ,
where j represents the applicable vehicle emission standard; n is the number of years during which emission standard j has been in effect for vehicle type I; m is the year in which emission standard j was first introduced; P denotes the total vehicle stock; and N is the adjusted count of newly registered vehicles accounting for survival rates.
Modified vehicle stock N was estimated using the correction formula (3):
N h , k   =   R h   ×   S h , k h   ,
Here, N h , k represents the portion of vehicles registered in year h that are still in service in the target year k after applying the survival adjustment; R h denotes the number of new registrations in year h (with 2022 taken as the reference year); and   S h , k h corresponds to the survival percentage in the target year for vehicles that have been in use for k − h years.
Survival rates followed Zachariadis et al. (1995) [30] using Equation (4):
S h ,   k h   =   EXP [ ( k   +   c T ) c ] ,
In this formulation, T and c characterize the expected operational lifetime of a vehicle. For passenger vehicles, T = 32 and c = 7. For trucks, T = 25 and c = 10.

2.3.3. Vehicle Kilometers Traveled

The VKT directly influences emission calculations. In this study, the VKT values for each vehicle category were primarily sourced from the “Technical Guide for Compiling Air Pollutant Emission Inventories from On-Road Motor Vehicles” and calibrated against local data from a prior Zhengzhou study [31], as presented in Table S1. Seven vehicle categories are considered: heavy- and medium-duty trucks (H&M trucks), light-duty trucks, buses, taxis, private cars, motorcycles, and others.

2.3.4. Localized Emission Factors for Air Pollutants and CO2

Local emission factors for criteria air pollutants were derived by adjusting national baseline factors to reflect Zhengzhou-specific conditions, including meteorological parameters, vehicle fleet composition, fuel types, and emission standards (Pre-China I through China VI). The localized emission factor for each pollutant was calculated using Equation (5):
EF   p ,   i ,   j =   BEF i ,   j ,   p   ×   φ   ×   γ p ,   i ,   j   ×   μ p ,   i ,   j   ×   θ i
where EF   p ,   i ,   j is the localized emission factor for pollutant p, emission standard j, vehicle type i in Zhengzhou; BEF is the baseline emission coefficient; φ is the meteorological correction factor (temperature and humidity, as presented in Table S2); γ and μ are the average speed and deterioration correction coefficients, respectively; and θ represents other emission correction factors.
EF f = NCV   ×   FCR f   ×   ρ   ×   CC   ×   COF   ×   44 12
where   EF f denotes the CO2 emissions per 100 km for the specified vehicle. f represents the fuel type, NCV is the lower heating value of the fuel (GJ/t), FCR represents the fuel consumption (L/100 km), ρ corresponds to the fuel density (g/L), CC expresses the carbon content (tC/GJ), COF is the carbon oxidation rate (99%), and 44/12 is the molecular weight ratio of CO2 to elemental carbon.

2.4. LEAP Model Structure

The LEAP model was configured to represent Zhengzhou’s road transport sector using a hierarchical activity-based structure. The transport sector was divided into passenger transport and freight transport. Passenger transport included private cars, buses, taxis, motorcycles, and other vehicles, while freight transport included heavy- and medium-duty trucks and light-duty trucks. Each vehicle category was further classified by fuel type, including gasoline, diesel, liquefied petroleum gas, and electricity, and by emission standard from Pre-China I to China VI. The 2022 emission inventory was used as the base-year calibration dataset. The key model inputs included the vehicle stock, annual VKT, fuel consumption intensity, energy type, emission-standard distribution, localized emission factors, electricity emission factors, and policy-driven changes in vehicle structure and travel activity. The model outputs included annual energy consumption, CO2 emissions, and air pollutant emissions from 2022 to 2040 under each scenario. Model consistency was checked by comparing the calculated 2022 energy consumption and emissions with local statistical data and previous Zhengzhou emission studies where available.

2.5. Scenario Design

Two scenarios were developed for 2022–2040. The EPS represents the continuation of enacted transport, vehicle emission, energy efficiency, and electrification policies. The dual carbon scenario (DCS) represents an enhanced mitigation pathway consistent with China’s carbon-peaking and carbon-neutrality objectives. Both scenarios use the same calibrated 2022 vehicle stock, activity, energy, and emission data but differ in vehicle electrification, fuel-economy improvement, retirement of high-emitting vehicles, transport activity, freight modal shift, and electricity emission intensity. Unless otherwise specified, annual values between 2022, 2030, and 2040 were obtained through linear interpolation.
The scenario assumptions were developed primarily from Chinese national, provincial, and local policy directions, including the New Energy Vehicle Industry Development Plan (2021–2035), the Action Plan for Carbon Dioxide Peaking Before 2030, Henan Province’s carbon-peaking and transport-development policies, and local measures for public transport, vehicle retirement, logistics electrification, and freight modal shifts. International experience is used only as supplementary context. The DCS assumptions represent an ambitious analytical pathway rather than formally adopted Zhengzhou targets.
The provincial average electricity CO2 emission factor for Henan in 2022 was 0.6058 kg CO2/kWh. To represent the gradual decarbonization of the power sector, the emission factor was assumed to decline annually by 1% under the EPS and 1.5% under the DCS. The resulting electricity emission factors were 0.5590 and 0.5055 kg CO2/kWh in 2030 and 2040 under the EPS, and 0.5368 and 0.4615 kg CO2/kWh under the DCS, respectively. The 1% and 1.5% annual decline rates represent moderate and enhanced power sector decarbonization assumptions under the EPS and DCS, respectively.
Energy structure adjustment. According to China’s Action Plan for Carbon Peak Before 2030, the transport sector should accelerate vehicle electrification and reduce dependence on conventional fuels. Zhengzhou registered approximately 116,000, 124,000, and 140,000 new vehicles from 2022 to 2024, of which 31%, 26%, and 25% were new energy vehicles (NEVs), respectively. Based on these trends, NEVs are assumed to account for 40% and 70% of new vehicle registrations in 2030 and 2040 under the EPS, and 60% and 100% under the DCS. The DCS represents an enhanced electrification pathway consistent with national decarbonization goals and international experience.
Energy efficiency improvement. Following national air pollution control requirements, diesel vehicles below the China III standard and gasoline vehicles below the China I standard are progressively retired. Both scenarios apply these phase-out requirements, while the DCS assumes faster implementation and replacement with vehicles meeting stricter emission standards.
Transport structure optimization. National carbon-peaking and pollution-control policies encourage public transport development, intelligent mobility, multimodal transport, and the transfer of medium- and long-distance freight from road to rail and waterway transport. Under the EPS, road freight and passenger transport activity are assumed to decrease by 25% and 40%, respectively, by 2040. Under the DCS, total road freight and passenger vehicle kilometers traveled are assumed to decline by 40% and 60%, respectively, relative to 2022. In addition, all 6316 buses in Zhengzhou are assumed to be electrified from 2022 under the DCS, in accordance with the provincial implementation plan.

2.6. Co-Benefit Assessment Using Elasticity Coefficients

Elasticity coefficients (ELSs) are employed in this study to evaluate whether a given mitigation measure generates synergistic co-reductions in CO2 and criteria air pollutants and to quantify the relative magnitude of such co-benefits. The ELS indicates how sensitive the proportional change in CO2 emissions is to the proportional change in a specific pollutant when a particular control measure is implemented. It is defined as:
E L S C O 2 / n = φ C O 2 / φ C O 2 φ n / φ n
where φ C O 2 and φn denote the total emissions of CO2 and pollutant n , respectively, and φ C O 2 and ∆φn represent the emission reductions achieved through a specific policy measure. The ELS values are interpreted as follows:
  • ELS = 0: The measure reduces only the pollutant with no effect on CO2 emissions, indicating no synergistic effect;
  • ELS < 0: The measure reduces one type of emission while increasing the other (a trade-off relationship), indicating a negative synergistic effect;
  • 0 < ELS < 1: The measure achieves synergistic reduction, with a proportionally greater effect on the pollutant than on CO2;
  • ELS = 1: CO2 and pollutant emissions decline at the same proportional rate;
  • ELS > 1: The measure achieves synergistic reduction, with a proportionally greater effect on CO2 than on the pollutant.
When the pollutant reduction is zero while CO2 emissions decrease, the ELS is mathematically undefined and is reported as NA. When the CO2 reduction is zero while the pollutant decreases, ELS equals zero.

2.7. Charging Infrastructure Demand Assessment

The penetration rate of EVs is a calculation parameter based on the total amount of vehicles, which accurately reflects the actual popularity of electric vehicles within the entire transportation system and their long-term cumulative impact on the energy structure, grid load, and carbon emissions. The rate is a stock concept, with relatively slow changes, and better reflects the macro process and long-term achievements of energy transformation. It is the basis for evaluating the demand for charging infrastructure, grid renovation planning, and long-term environmental benefits [32]. Its calculation formula is:
μ = E V s V p
The vehicle-to-charger ratio (VCR) is a widely used indicator for evaluating the supply–demand balance of charging infrastructure:
V C R = E V s V C s
where EVs is the number of electric vehicles and VCs is the number of installed charging piles. Based on a target VCR (VCRp), the future charging infrastructure demand (VCD) can be estimated as:
V C D = E V s V C R p
This study adopts a target VCRp of 2:1, consistent with the post-2025 planning benchmarks set by China’s National Energy Administration and comparable to the targets adopted in Chongqing and Shenyang [33,34].

3. Results and Discussion

Zhengzhou’s road transportation emissions were characterized for the base year 2022, including vehicle stock, energy consumption, and emissions. Using the LEAP model, emission trends for CO2 and conventional pollutants were projected from 2022 to 2040 under existing policy and dual carbon scenarios. Additionally, charging infrastructure demand was assessed for high EV penetration.

3.1. Characteristics of Vehicle Population and Emissions in 2022

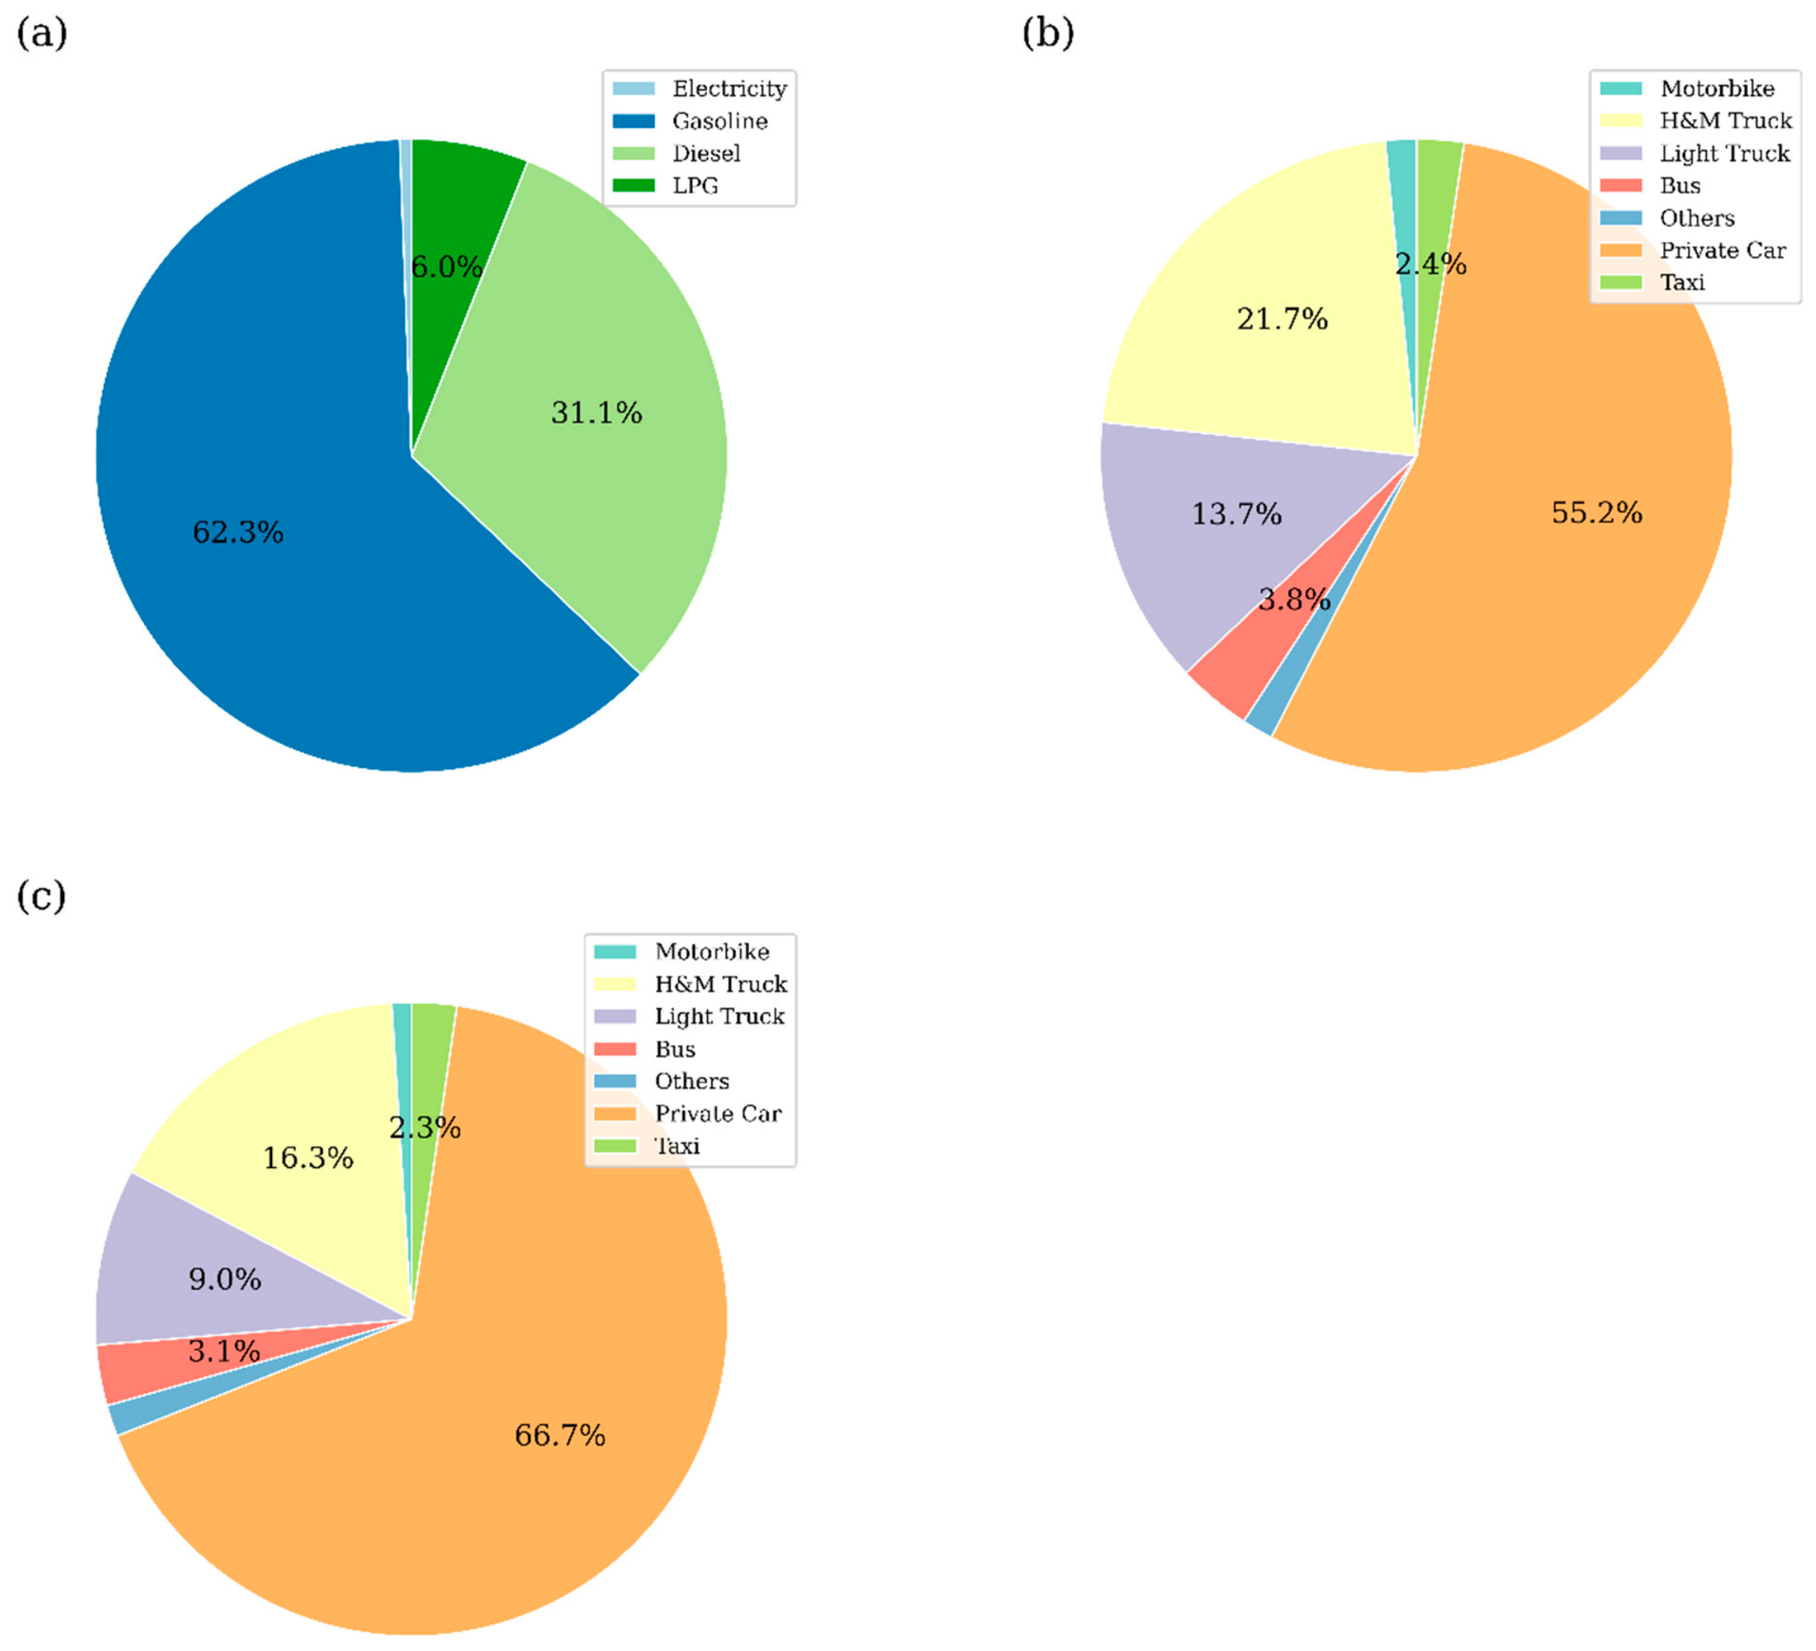
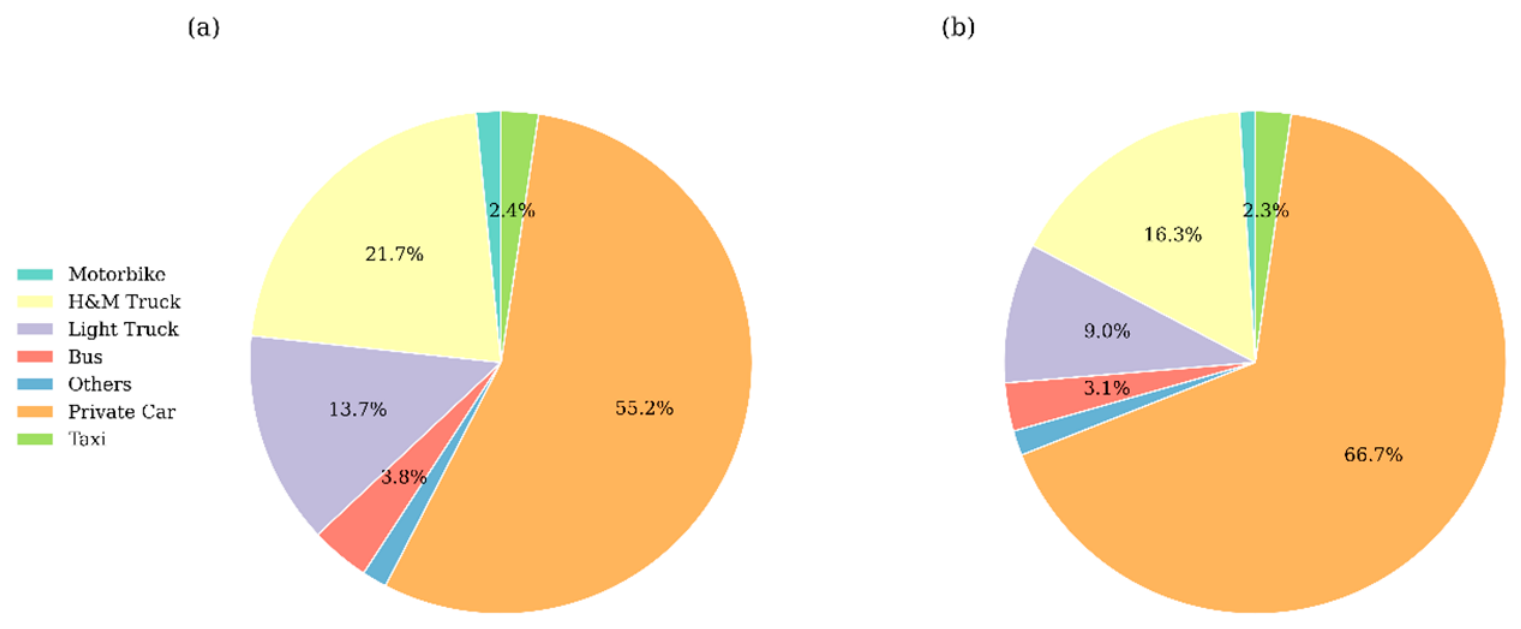
Figure 2 summarizes the vehicle fleet composition, energy consumption structure, and associated CO2 emissions of Zhengzhou’s road transport sector in 2022. The total energy consumption was 10,178 ktce, with gasoline being the dominant fuel at 62.3%, followed by diesel at 31.1%, while electricity accounted for only 0.6% (Figure 2a). Private cars were the largest energy consumers, accounting for 55.2% of total energy consumption, followed by the freight sector at 35.4%, with H&M trucks and light-duty trucks contributing 21.7% and 13.7%, respectively (Figure 2b). Total CO2 emissions amounted to 27,771 kt, of which private cars contributed 66.7%, followed by H&M trucks (16.3%) and light-duty trucks (9.0%) (Figure 2c). The contrasting source profiles of CO2 and NOx reflect fundamental differences between passenger and freight transport. Private cars dominate CO2 emissions because of their large fleet size and aggregate travel demand. Heavy- and medium-duty trucks and light-duty trucks contribute disproportionately to NOx because of their diesel dependence, higher engine loads, and higher distance-specific emission factors. A uniform vehicle-control strategy would therefore be inefficient. Passenger-car policies should prioritize travel-demand management, electrification, and electricity decarbonization, whereas freight policies should prioritize diesel truck replacement, logistics electrification, emission-standard compliance, and modal shifts from road to railway.
Figure 3a,b presents the distribution of NOx and VOC emissions by vehicle category. Heavy- and medium-duty trucks and light-duty trucks dominated NOx emissions, contributing 48.1% and 27.9%, respectively, and collectively accounting for 76.0% of the total. Private cars were the leading source of VOC emissions (56.5%), followed by motorcycles (17.1%). H&M trucks were the main contributors to SO2 (43.9%), while private cars dominated NH3 emissions (87.3%). The contributions of various vehicle types to particulate matter were relatively balanced, with H&M trucks being the largest contributors at 26%. Private cars accounted for the highest share of CO emissions at 48.4%.

3.2. Energy Consumption Under the Different Scenarios

Based on scenario design, the LEAP model predicted the energy consumption distribution in 2030 and 2040 under two scenarios, forecasted the energy consumption trends of vehicles in Zhengzhou from 2022 to 2040, and revealed the energy consumption distribution of different vehicle types.
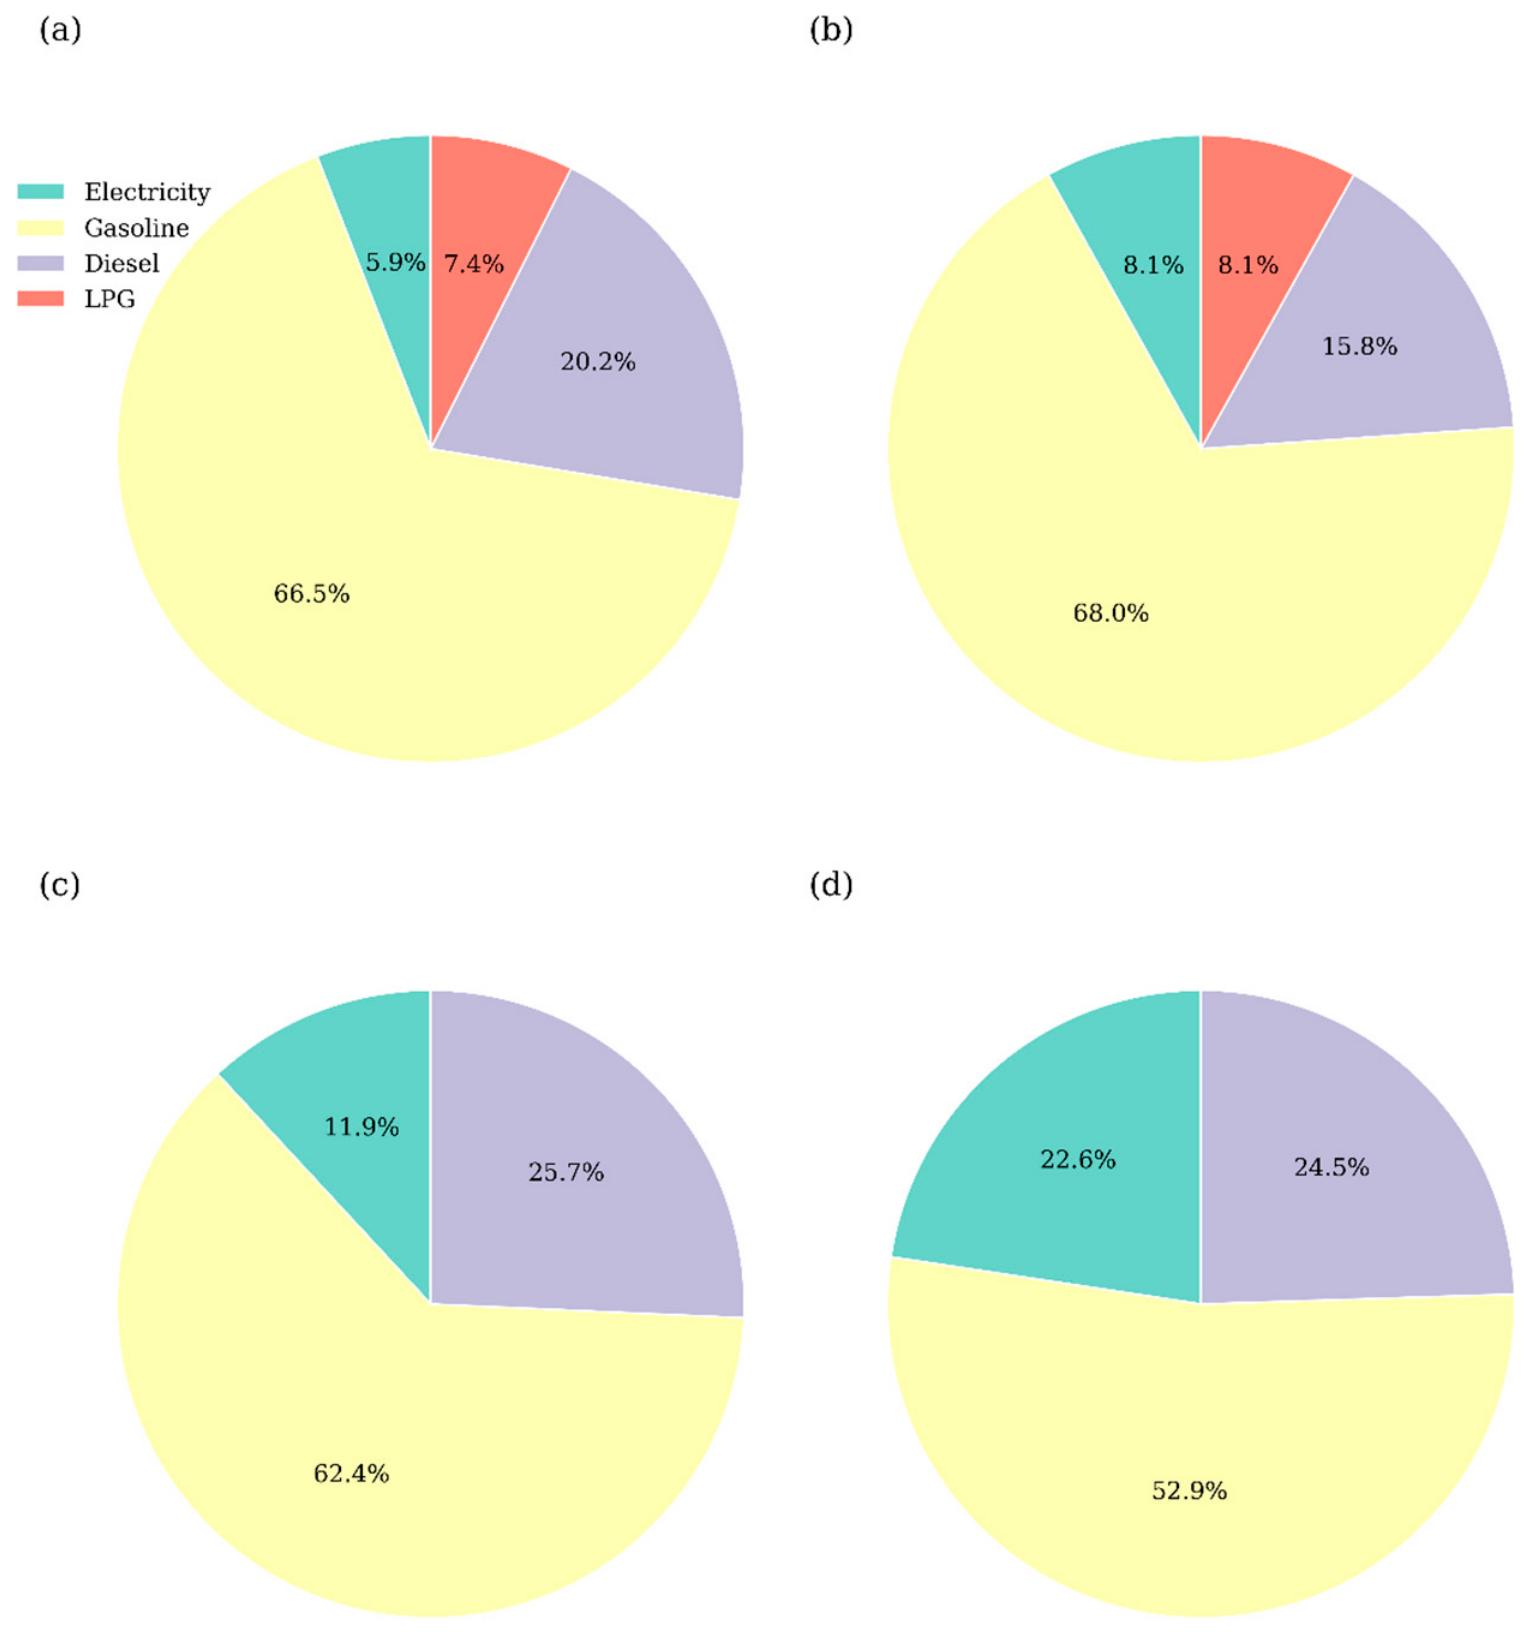
As shown in Figure 4a,b, under the existing policy scenario, gasoline and diesel consumption have always dominated, accounting for 67% and 20% in 2030, and 68% and 16% in 2040, respectively. The proportion of electricity increases slightly, from 6% in 2030 to 8% by 2040. As shown in Figure 4c,d, under the dual carbon scenario, the proportion of gasoline consumption decreases, from 62% in 2030 to 53% in 2040. The proportion of electricity consumption increases rapidly, from 12% to 23%.
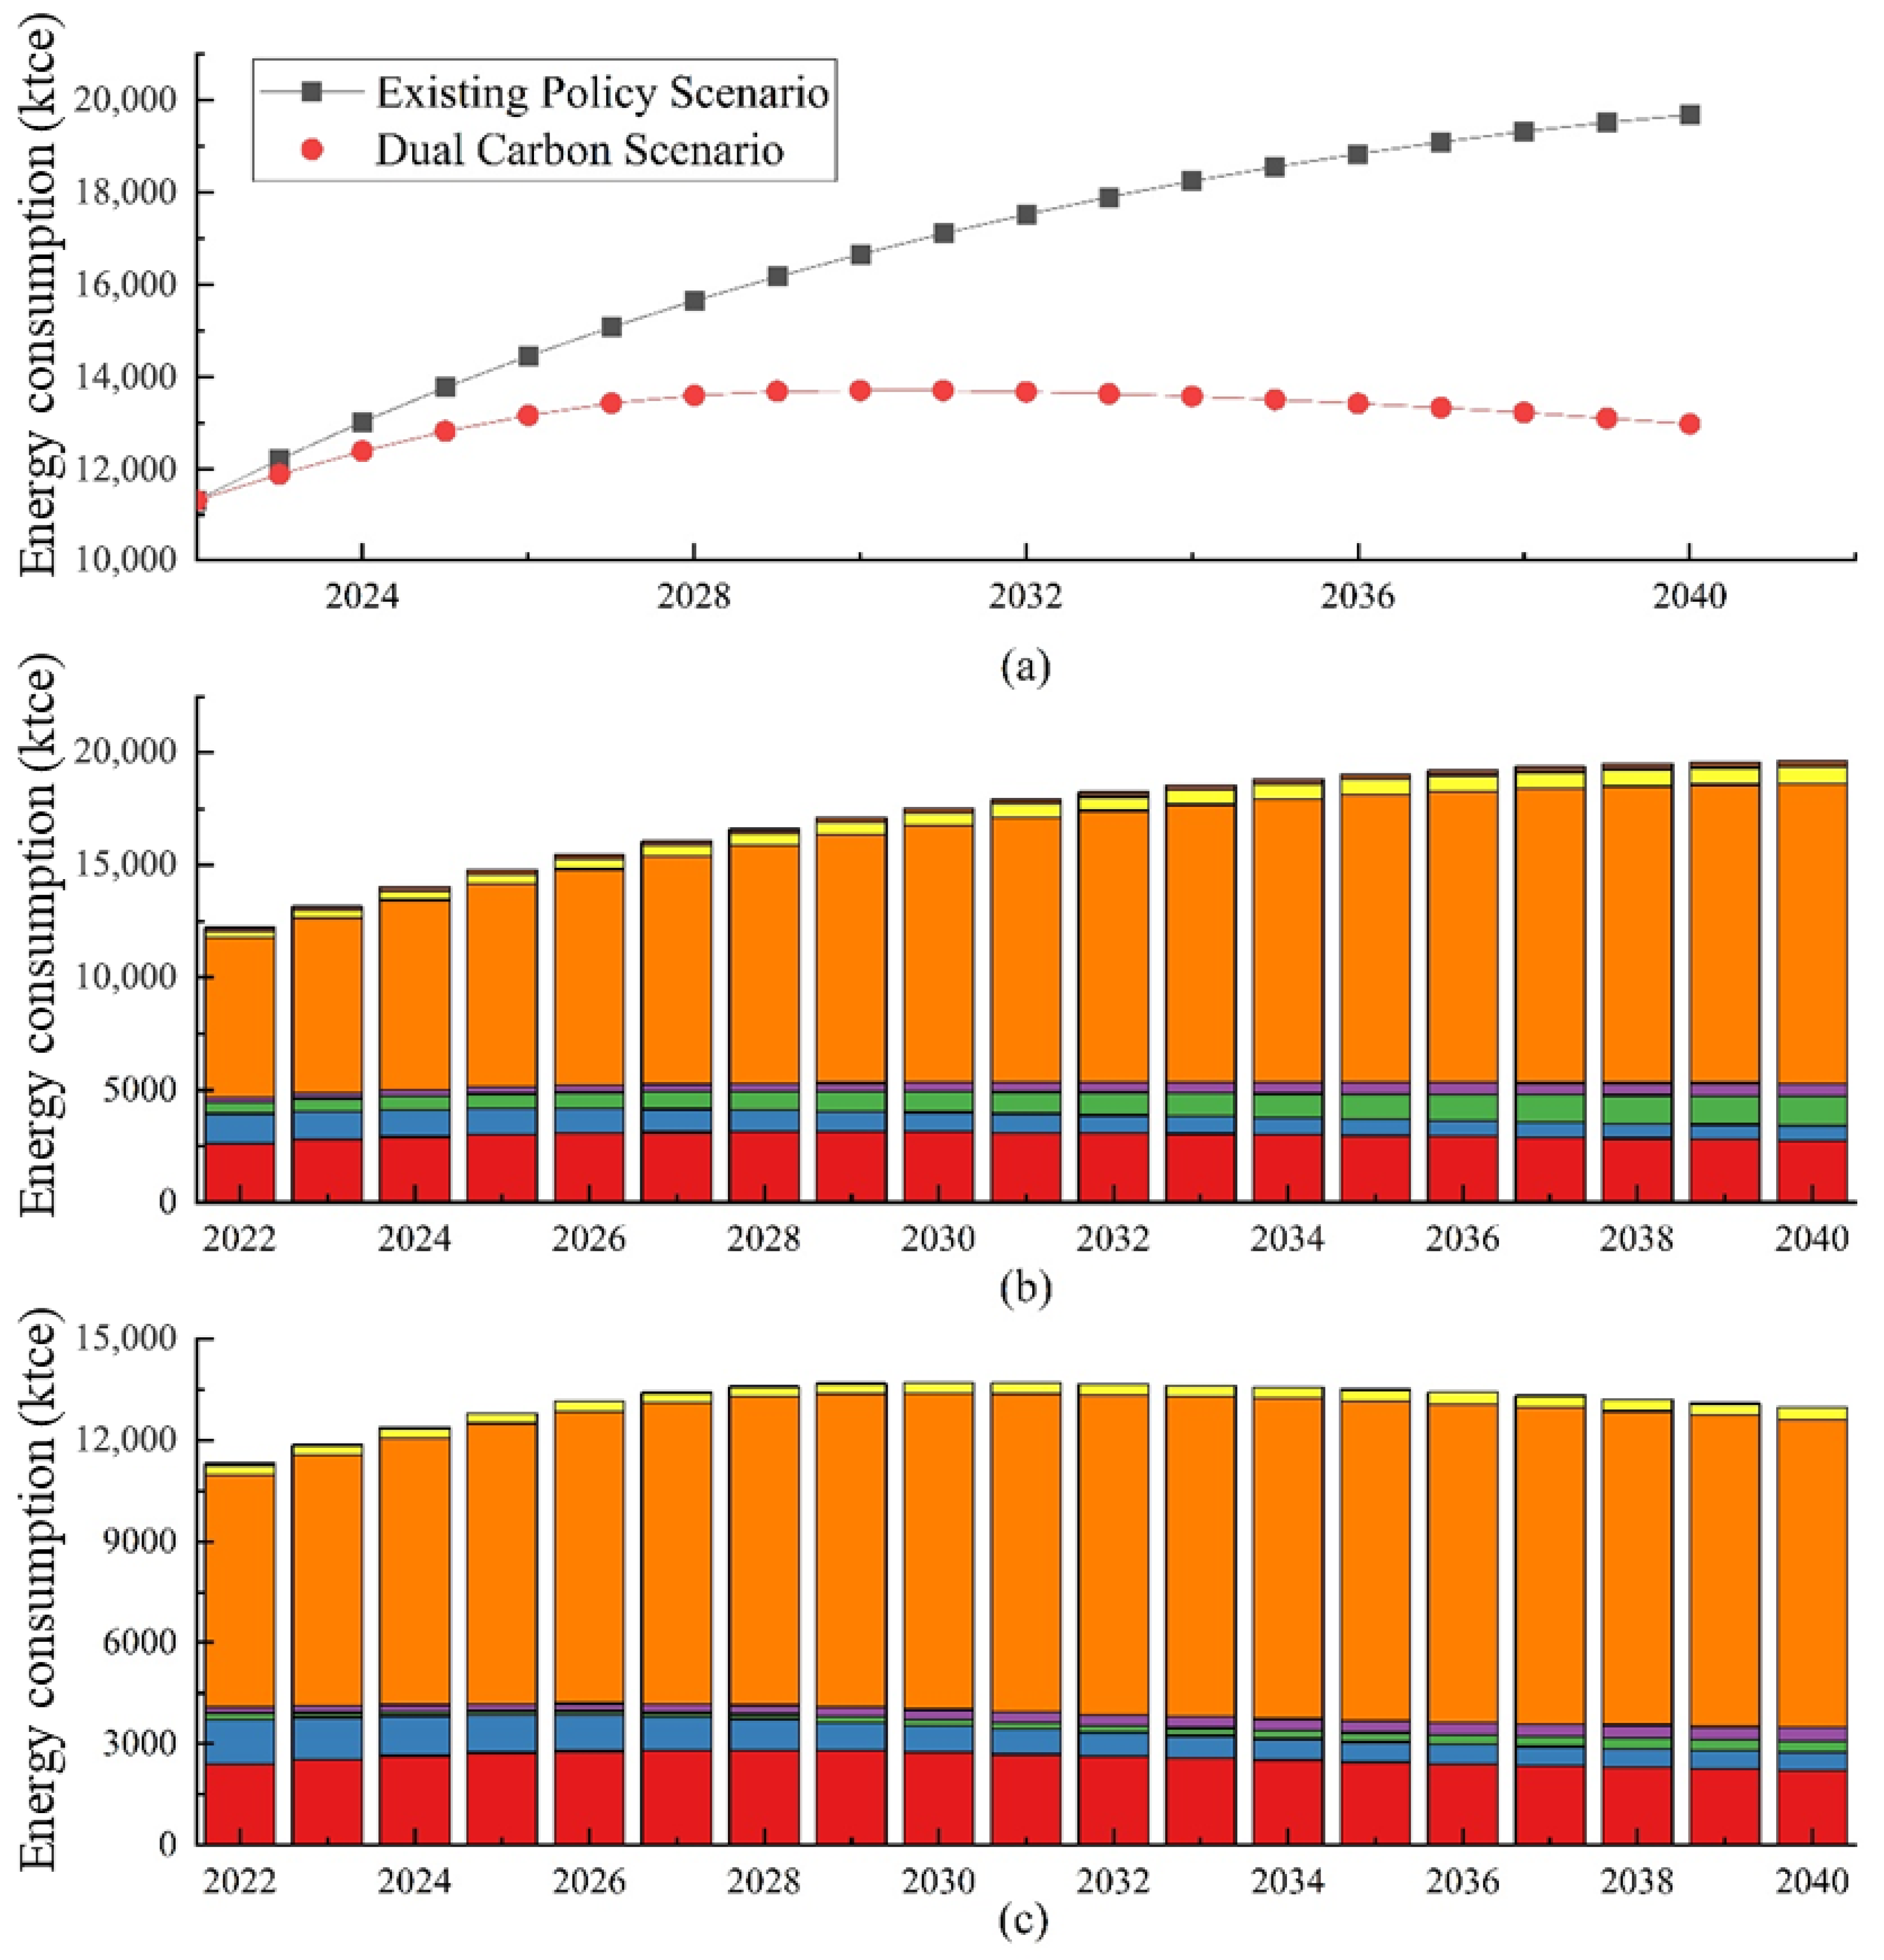
As shown in Figure 5a, under the existing policy scenario, the total energy consumption for road transportation continues to rise from 2022 to 2040, reaching 19,641 ktce in 2040; under the dual carbon scenario, energy consumption first rises and then gradually declines, peaking at 13,699 ktce in 2030, with energy consumption in 2040 being 12,971 ktce, a 34% reduction compared to the existing policy scenario. The distribution of energy consumption by vehicle type across different scenarios in 2040 is shown in Figure 5b,c. Under different scenarios, the vehicle type with the highest energy consumption proportion is always private cars. In 2040, the energy consumption of private cars is 13,323 ktce and 9138 ktce under the existing policy and dual carbon scenarios, respectively, accounting for 68% and 70% of the total energy consumption.

3.3. Total Air Pollutant Emissions from Vehicles

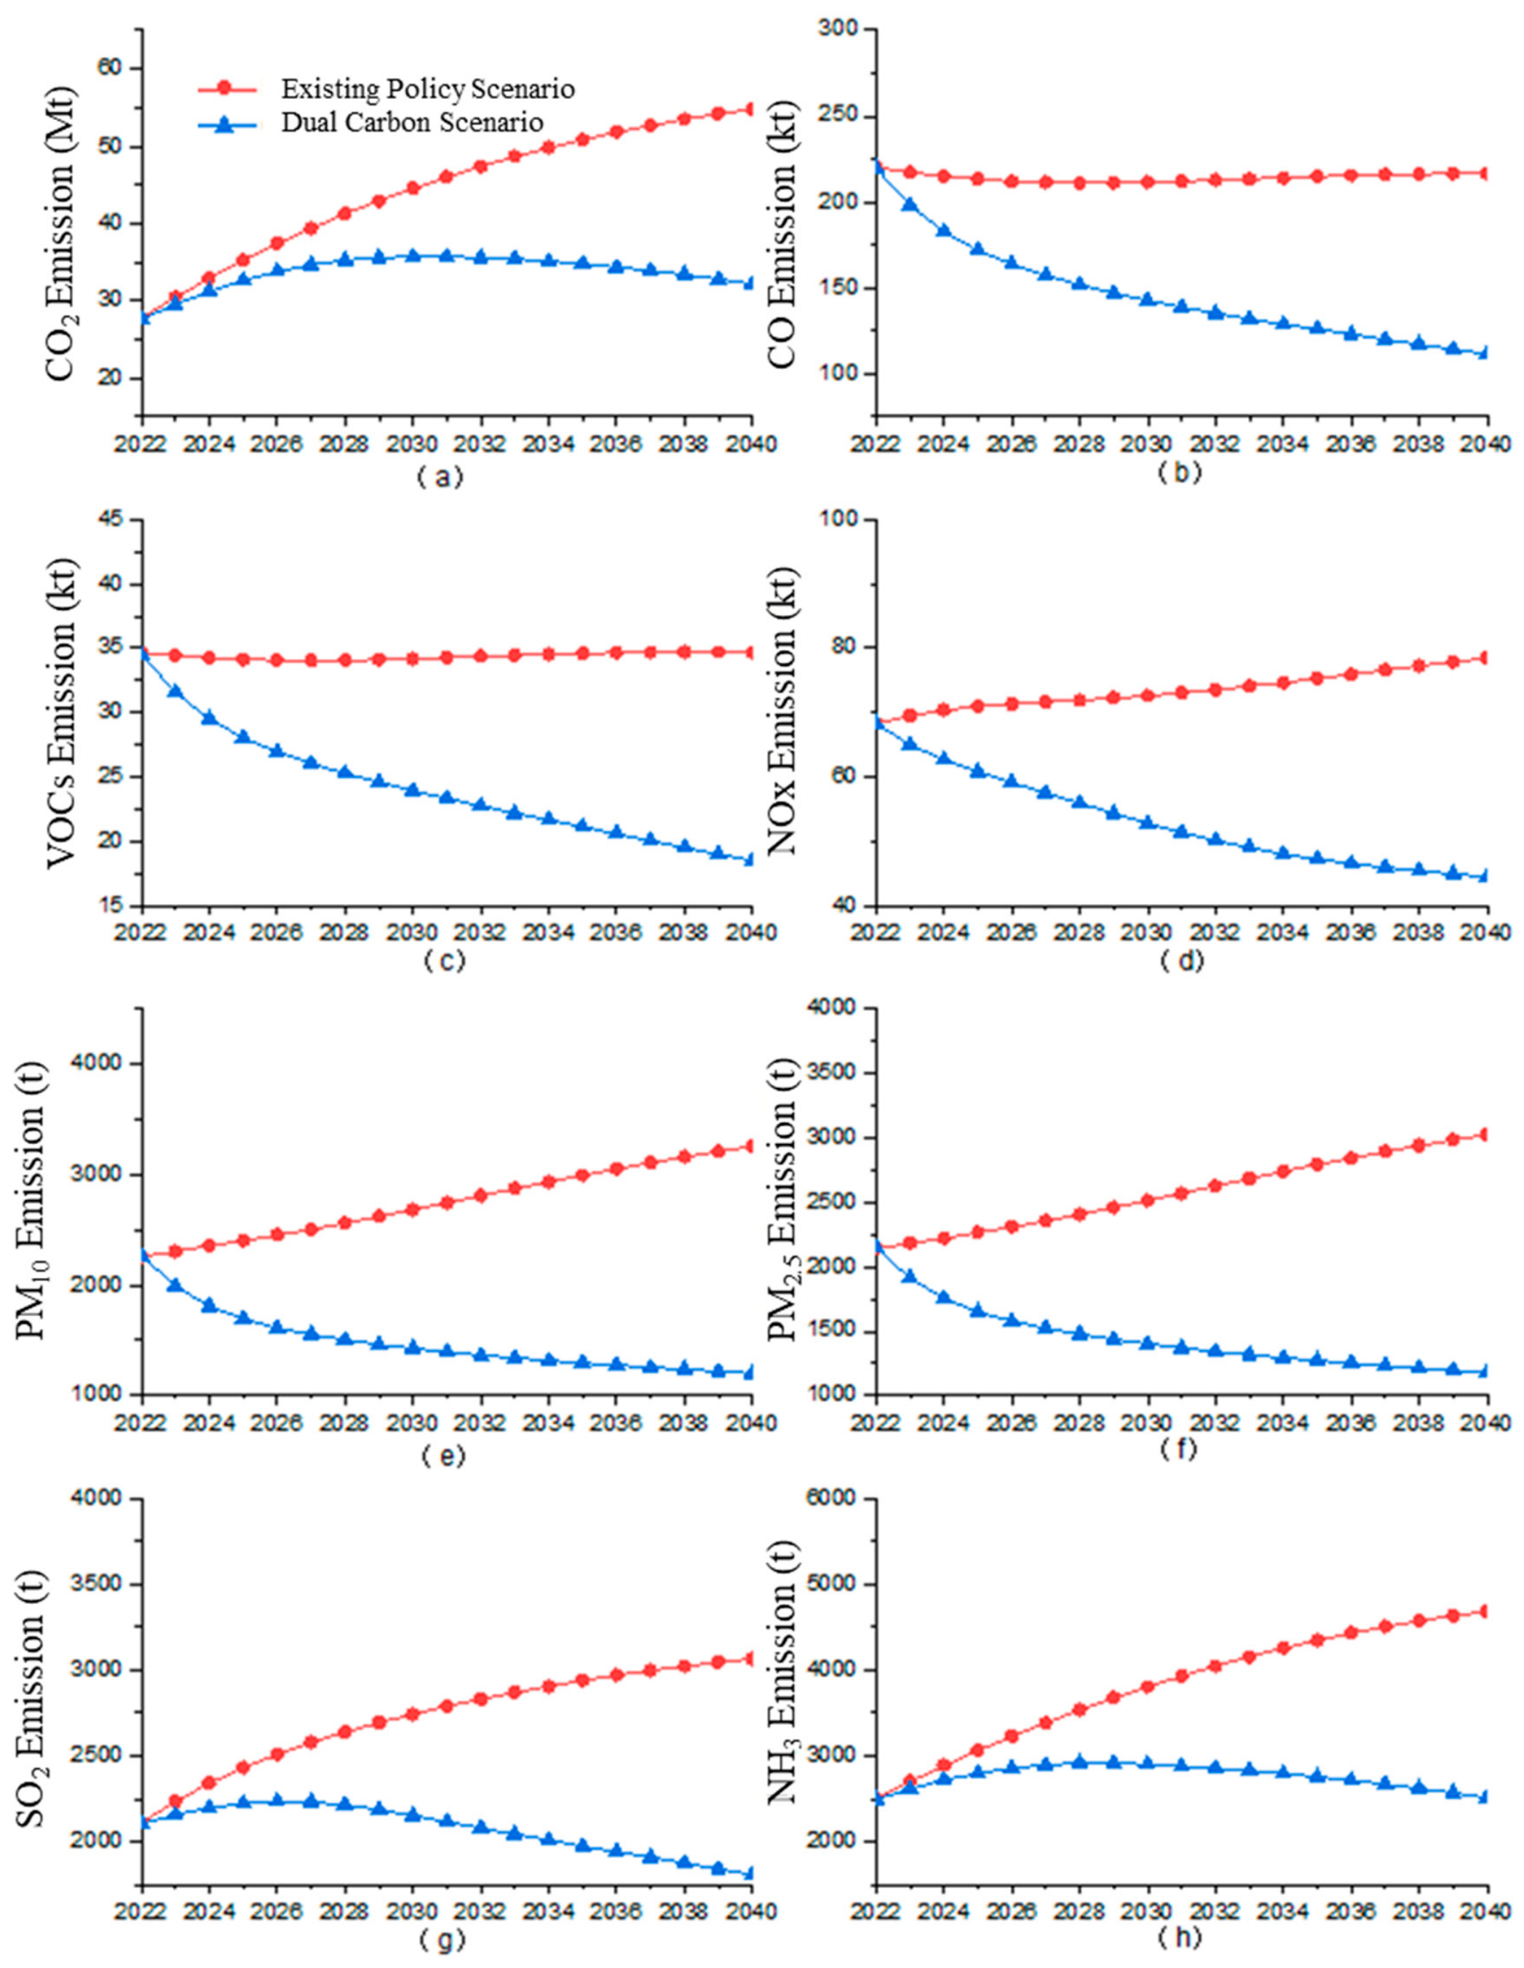
Drawing on the 2022 road transport emission inventory for Zhengzhou and incorporating the scenario settings within the LEAP framework, this study projected the evolution of CO2 and major air pollutants from 2022 to 2040, together with the changing contribution patterns of different vehicle categories. The simulated CO2 trajectories for both scenarios are presented in Figure 6a, and these patterns closely correspond to the energy consumption trends illustrated earlier in Figure 6.
Under the existing policy scenario, CO2 emissions continue to increase, reaching 45 Mt in 2030 and 55 Mt in 2040. Zhang et al. (2013) and Liu et al. (2018) and others’ studies on China’s transportation sector show that the anticipated growth rates are 6% and 4%, respectively [15,35]. The vehicle emissions in Zhengzhou have a similar growth trend, and the numerical differences may be caused by different research objects and statistical scopes. Under the dual carbon scenario, the carbon peak is achieved in 2030 with an emission of 36 Mt, and then it continues to decline, reaching 32 Mt in 2040. Compared with the existing policy scenario, CO2 emissions under the dual carbon scenario are reduced by 20% in 2030 and 42% in 2040.
As shown in Figure 6b, under the existing policy and dual carbon scenarios, CO emissions decrease from 220 kt in 2022 to 217 kt and 111 kt in 2040, respectively. Compared to the existing policy scenario, CO emissions under the dual carbon scenario are reduced by 49%. The primary reason for this continuous decline is the progressive removal of vehicles that do not meet modern emission requirements and the growing share of vehicles certified under more stringent standards. This structural shift results in a steady decrease in CO emissions beginning in the base year. Hong et al. (2016) similarly concluded in their study that the sustained decline in CO and VOC emissions from 2015 to 2020 was driven by the large-scale retirement of yellow-label passenger vehicles and their replacement with higher-standard vehicles [36]. In the dual carbon scenario, CO emissions decrease rapidly due to the promotion of cleaner vehicles and the broader rollout of green transport initiatives.
As shown in Figure 6c, the emissions of VOCs remain largely unchanged from 2022 to 2040, under the existing policy scenario. In the dual carbon scenario, the emissions of VOCs in 2030 and 2040 are reduced to 24 kt and 18 kt, respectively. Compared with the existing policy scenario, the emissions of VOCs have decreased by 32% and 45%, respectively. The continuous reduction in VOC emissions is attributed to the continuous elimination of old vehicles and the replacement with vehicles that meet higher emission standards. Therefore, VOC and CO emissions exhibit similar trends under the two scenarios, consistent with the findings of Pang et al. (2022) [37].
As shown in Figure 6d, under the existing policy scenario, the NOx emissions from vehicles in Zhengzhou continue to increase slowly, reaching 73 kt in 2030 and 78 kt in 2040. Under the dual carbon scenario, NOx emissions continue to decline, with peak emissions in 2030 and 2040 being 53 kt and 44 kt, respectively. Compared with existing policy scenario, NOx decreases by 27% and 44%, respectively. As shown in Figure 6h, the NH3 emissions in 2030 and 2040 are 3804 t and 4681 t, respectively, under the existing policy scenario. Under the dual carbon scenario, the peak emissions in 2030 and 2040 are 2900 t and 2512 t, respectively, representing a decrease of 24% and 46% compared with the existing policy scenario. NH3 emissions peak in 2029 and then decline slowly, which is due to the reduction in the activity levels of trucks and buses caused by the elimination of old vehicles, the promotion of rail transportation, and green public transportation in the emission reduction policies. Xu et al. (2021) also found that the reduction in the activity levels of large buses and trucks led to a decrease in NOx and NH3 emissions [38].
As shown in Figure 6g, under the existing policy scenario, the SO2 emissions in 2030 and 2040 are 2741 tons and 3063 t, respectively. Under the dual carbon scenario, the SO2 emissions in the peak year of 2030 and 2040 decrease to 2152 t and 1808 t, respectively, representing a reduction of 21% and 41%. Under the existing policy scenario, the SO2 emissions increase with the increase in traditional fuel vehicles. Under the dual carbon scenario, with the increase in the proportion of electric vehicles and the implementation of higher vehicle emission standards, the SO2 emissions reach their peak in 2026 and then continue to decline.
As shown in Figure 6e,f, the emission trends of PM10 and PM2.5 are similar. Under the existing policy scenarios, the emissions of PM10 and PM2.5 continue to increase, with the emissions reaching 2680 and 2568 t, respectively, in 2030, and 3254 and 3024 t, respectively, in 2040. In the dual carbon scenario, PM10 and PM2.5 in the peak year of 2030 are 1424.0 t and 1400.1 t, respectively, and 1199 t and 1176 t, respectively, in 2040. These reductions are primarily driven by the accelerated removal of high-emitting vehicles and the growing share of vehicles compliant with stricter emission standards. The projected divergence between CO2 and regulated air pollutants is consistent with the different mechanisms governing these emissions. Tighter exhaust standards and accelerated retirement directly reduce CO, VOCs, NOx, and exhaust PM emission factors, whereas CO2 remains closely linked to total energy demand, travel activity, vehicle efficiency, and electricity carbon intensity. Consequently, a city may achieve substantial reductions in regulated pollutants, while transport-related CO2 continues to grow. The Zhengzhou results further show that policy ranking depends on the emission objective. EV promotion and green public transport provide relatively large CO2 benefits, whereas old vehicle retirement, motorcycle phase-out, light-truck electrification, and emission-standard improvement provide greater proportional benefits for local air pollutants.

3.4. Vehicle Category Emission Profiles Under the Two Scenarios

Based on the paths and measures designed for each scenario, the LEAP model was employed to estimate the contributions of various vehicle categories to CO2 and key air pollutants in 2022–2040 under the EPS and DCS. The results presented in Figure 7, Figure 8, Figure 9 and Figure 10 depict how different vehicle types influence the overall emission profiles across the two scenarios. Under the existing policy scenario, CO2 emissions continue to rise throughout the projection period and do not reach a peak by 2030. In contrast, the dual carbon scenario yields a markedly different trajectory, with transport-related CO2 emissions achieving a peak in 2030 and subsequently declining at a gradual pace.
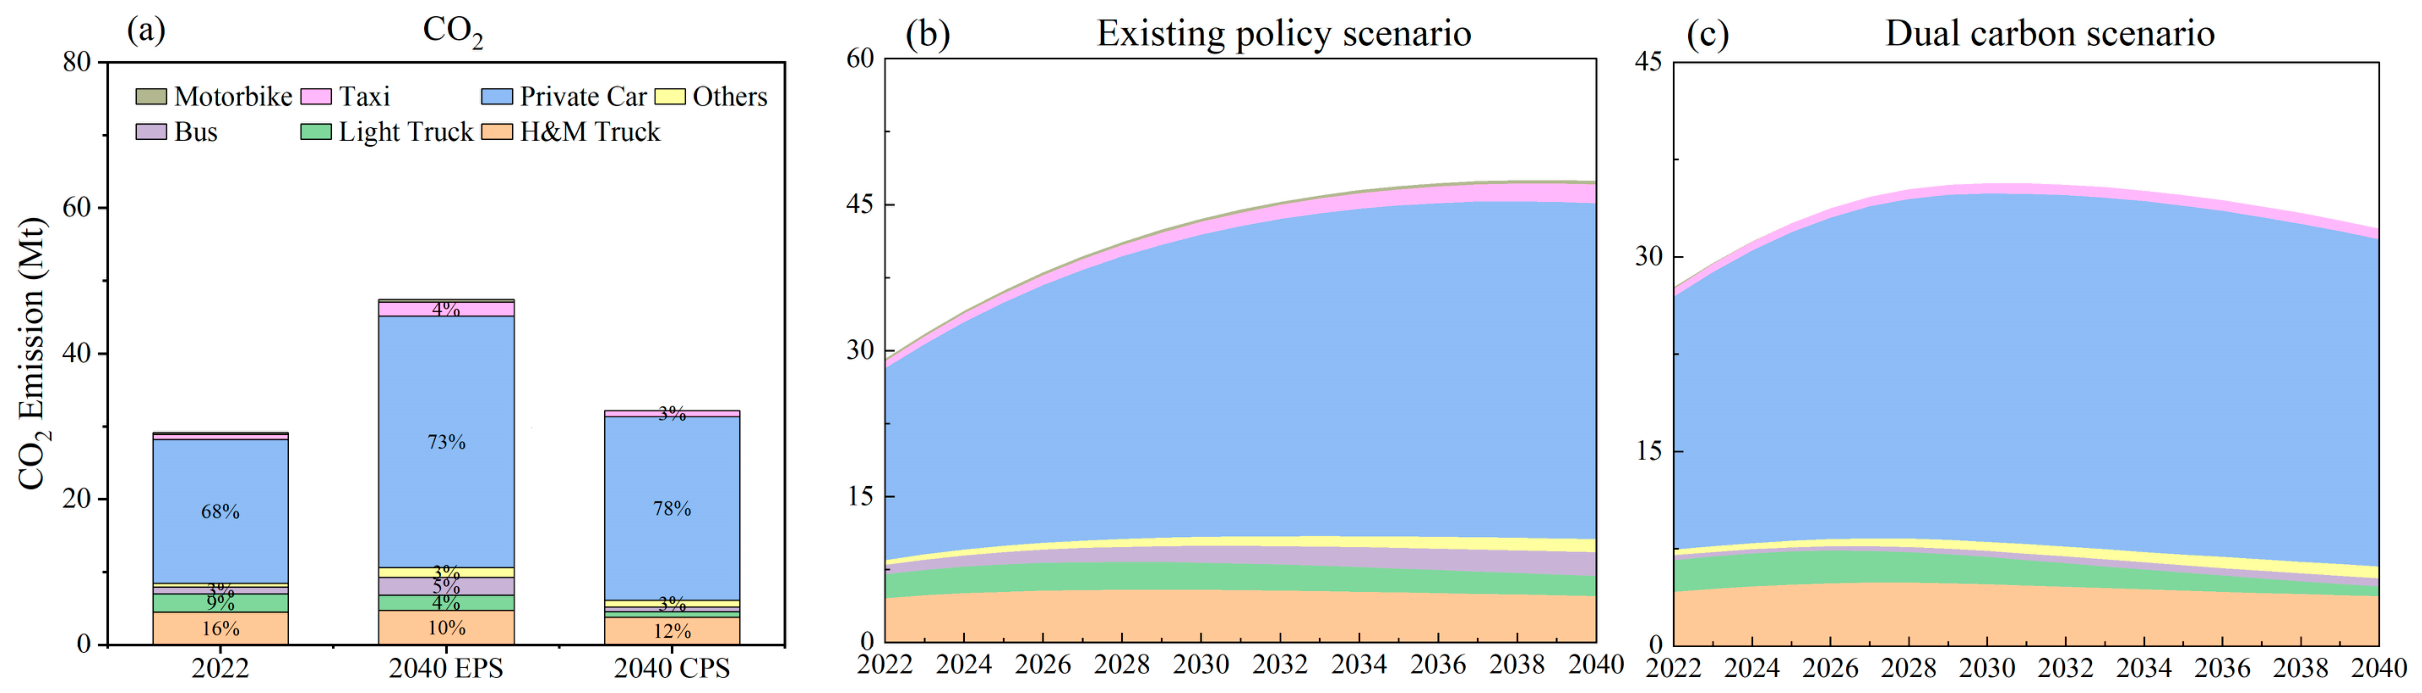
Figure 7 shows the trend and composition of CO2 emissions. Under the existing policy scenario, CO2 emissions from all passenger vehicle categories increase continuously throughout the projection period. Private cars remain the dominant source, with their share rising from 67% in 2022 to 73% in 2040. Buses and taxis see their shares increase from 3% to 5% and from 2% to 4%, respectively. In contrast, the shares of H&M trucks and light trucks decline from 16% and 9% in 2022 to 10% and 4% in 2040, respectively, reflecting the combined effects of stricter emission standards and partial electrification of the logistics sector. Under the dual carbon scenario, private cars peak in 2027 (share: 77%), H&M trucks peak in 2028 (share: 14%), and light trucks peak in 2033 (share: 7%). Pursuant to Zhengzhou’s municipal policy on motorcycle management, all motorcycles are assumed to exit the market by 2025, thereby contributing no further tailpipe emissions from that year onward. Bus emissions remain modest as all 6316 buses are converted to electric vehicles by the end of 2022 per the provincial electrification mandate.
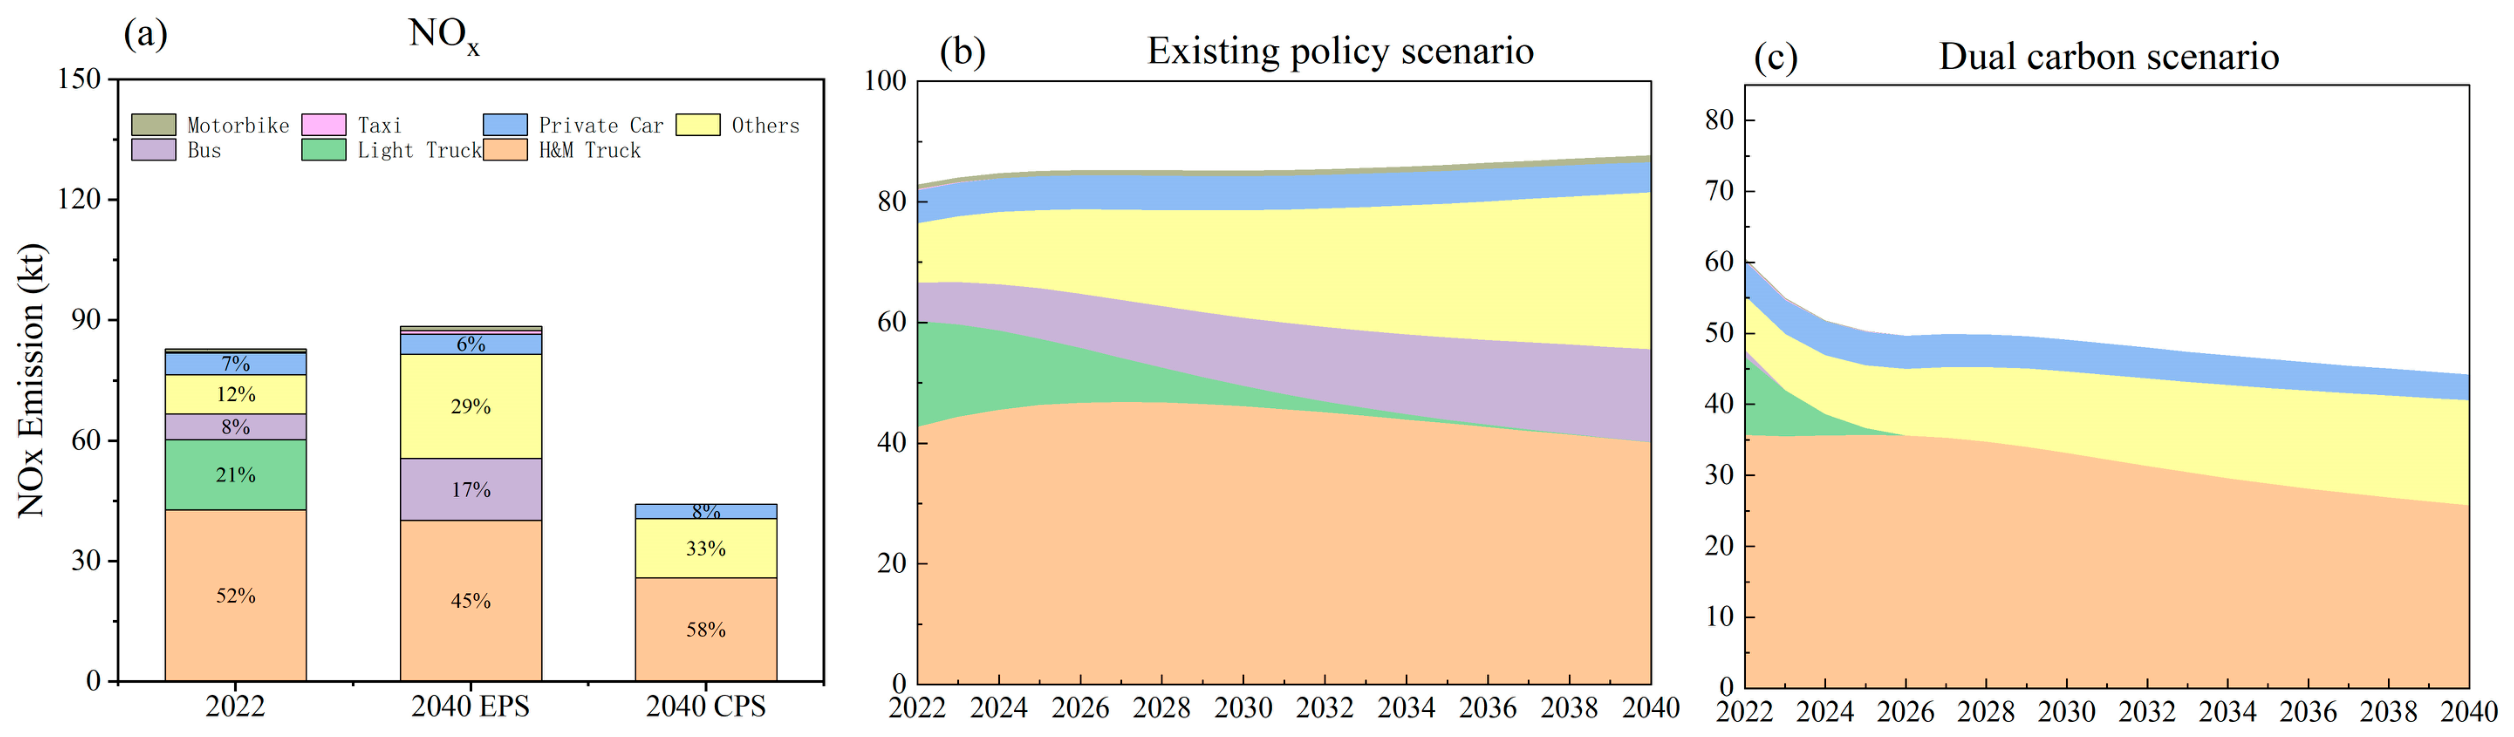
Figure 8 illustrates the evolution and sectoral distribution of NOx emissions. Under the existing policy scenario, enhancements in vehicle emission standards combined with measures such as promoting rail transportation lead NOx emissions from heavy- and medium-duty trucks to reach a peak around 2027, followed by a steady decline thereafter. The NOx emissions of private cars, affected by the improvement in vehicle emission standards and electrification, peak in 2028 and then gradually decrease. Due to the influence of urban logistics electrification, the emissions and proportions of light trucks continue to decrease. The emissions of buses and other vehicles continue to increase, with the proportions rising from 6% and 10% in 2022 to 17% and 29% in 2040. Under the dual carbon scenario, the emissions of six vehicle types, including trucks and private cars, continue to decrease, except for those of other vehicles. Due to the strengthened policy of urban logistics electrification, light fuel trucks exited the market by the end of 2025 and did not generate local emissions. Due to the strengthened policy of green public transportation, all buses were replaced with electric vehicles by the end of 2022 and did not generate local emissions.
The emission trend and composition changes in VOCs and PM2.5 are shown in Figures S1 and S2, respectively. Under the existing policy scenario, VOC emissions in Zhengzhou exhibit a slow declining trend, with private cars (59%) and motorcycles (20%) emerging as the dominant contributors by 2040, while the share of buses rises markedly from 4% in 2022 to 14%. Light-duty trucks show a continuous decline because of the widespread use of clean energy vehicles. In contrast, under the dual carbon scenario, total VOC emissions decline more substantially, with private cars (91%) and heavy-duty trucks (6%) remaining the primary sources by 2040, as motorcycles, buses, and light-duty trucks are fully electrified. The evolution of PM2.5 emissions is closely tied to the combined dynamics of vehicle electrification and emission-standard upgrades. Under the existing policy scenario, PM2.5 emissions from private vehicles peak in 2031 and subsequently decline as the fleet transitions to higher emission standards. Under the dual carbon scenario, the early exit of motorcycles, fuel buses, and light fuel trucks (all by 2026) substantially reduces PM2.5 emissions, a finding consistent with Pang et al. (2022) [37] who reported similar patterns in Lanzhou [38]. The residual PM2.5 in both scenarios is increasingly dominated by non-exhaust sources (tire wear, brake abrasion), which are not captured in this study and represent a growing area of concern as EV penetration increases—since EVs reduce exhaust PM2.5 but do not eliminate non-exhaust PM emissions [39].

3.5. Analysis of the Peak Year (2030) in Zhengzhou

Under the dual carbon scenario, CO2 emissions can peak by 2030. This section focuses on the peak year and analyzes and discusses the energy consumption and CO2 and air pollutant emission characteristics of the transportation in Zhengzhou City. It quantitatively assesses the contribution of the control paths to the reduction in CO2 emissions and evaluates the synergy of different emission reduction measures on the reduction in CO2 and air pollutants through the elasticity coefficient.
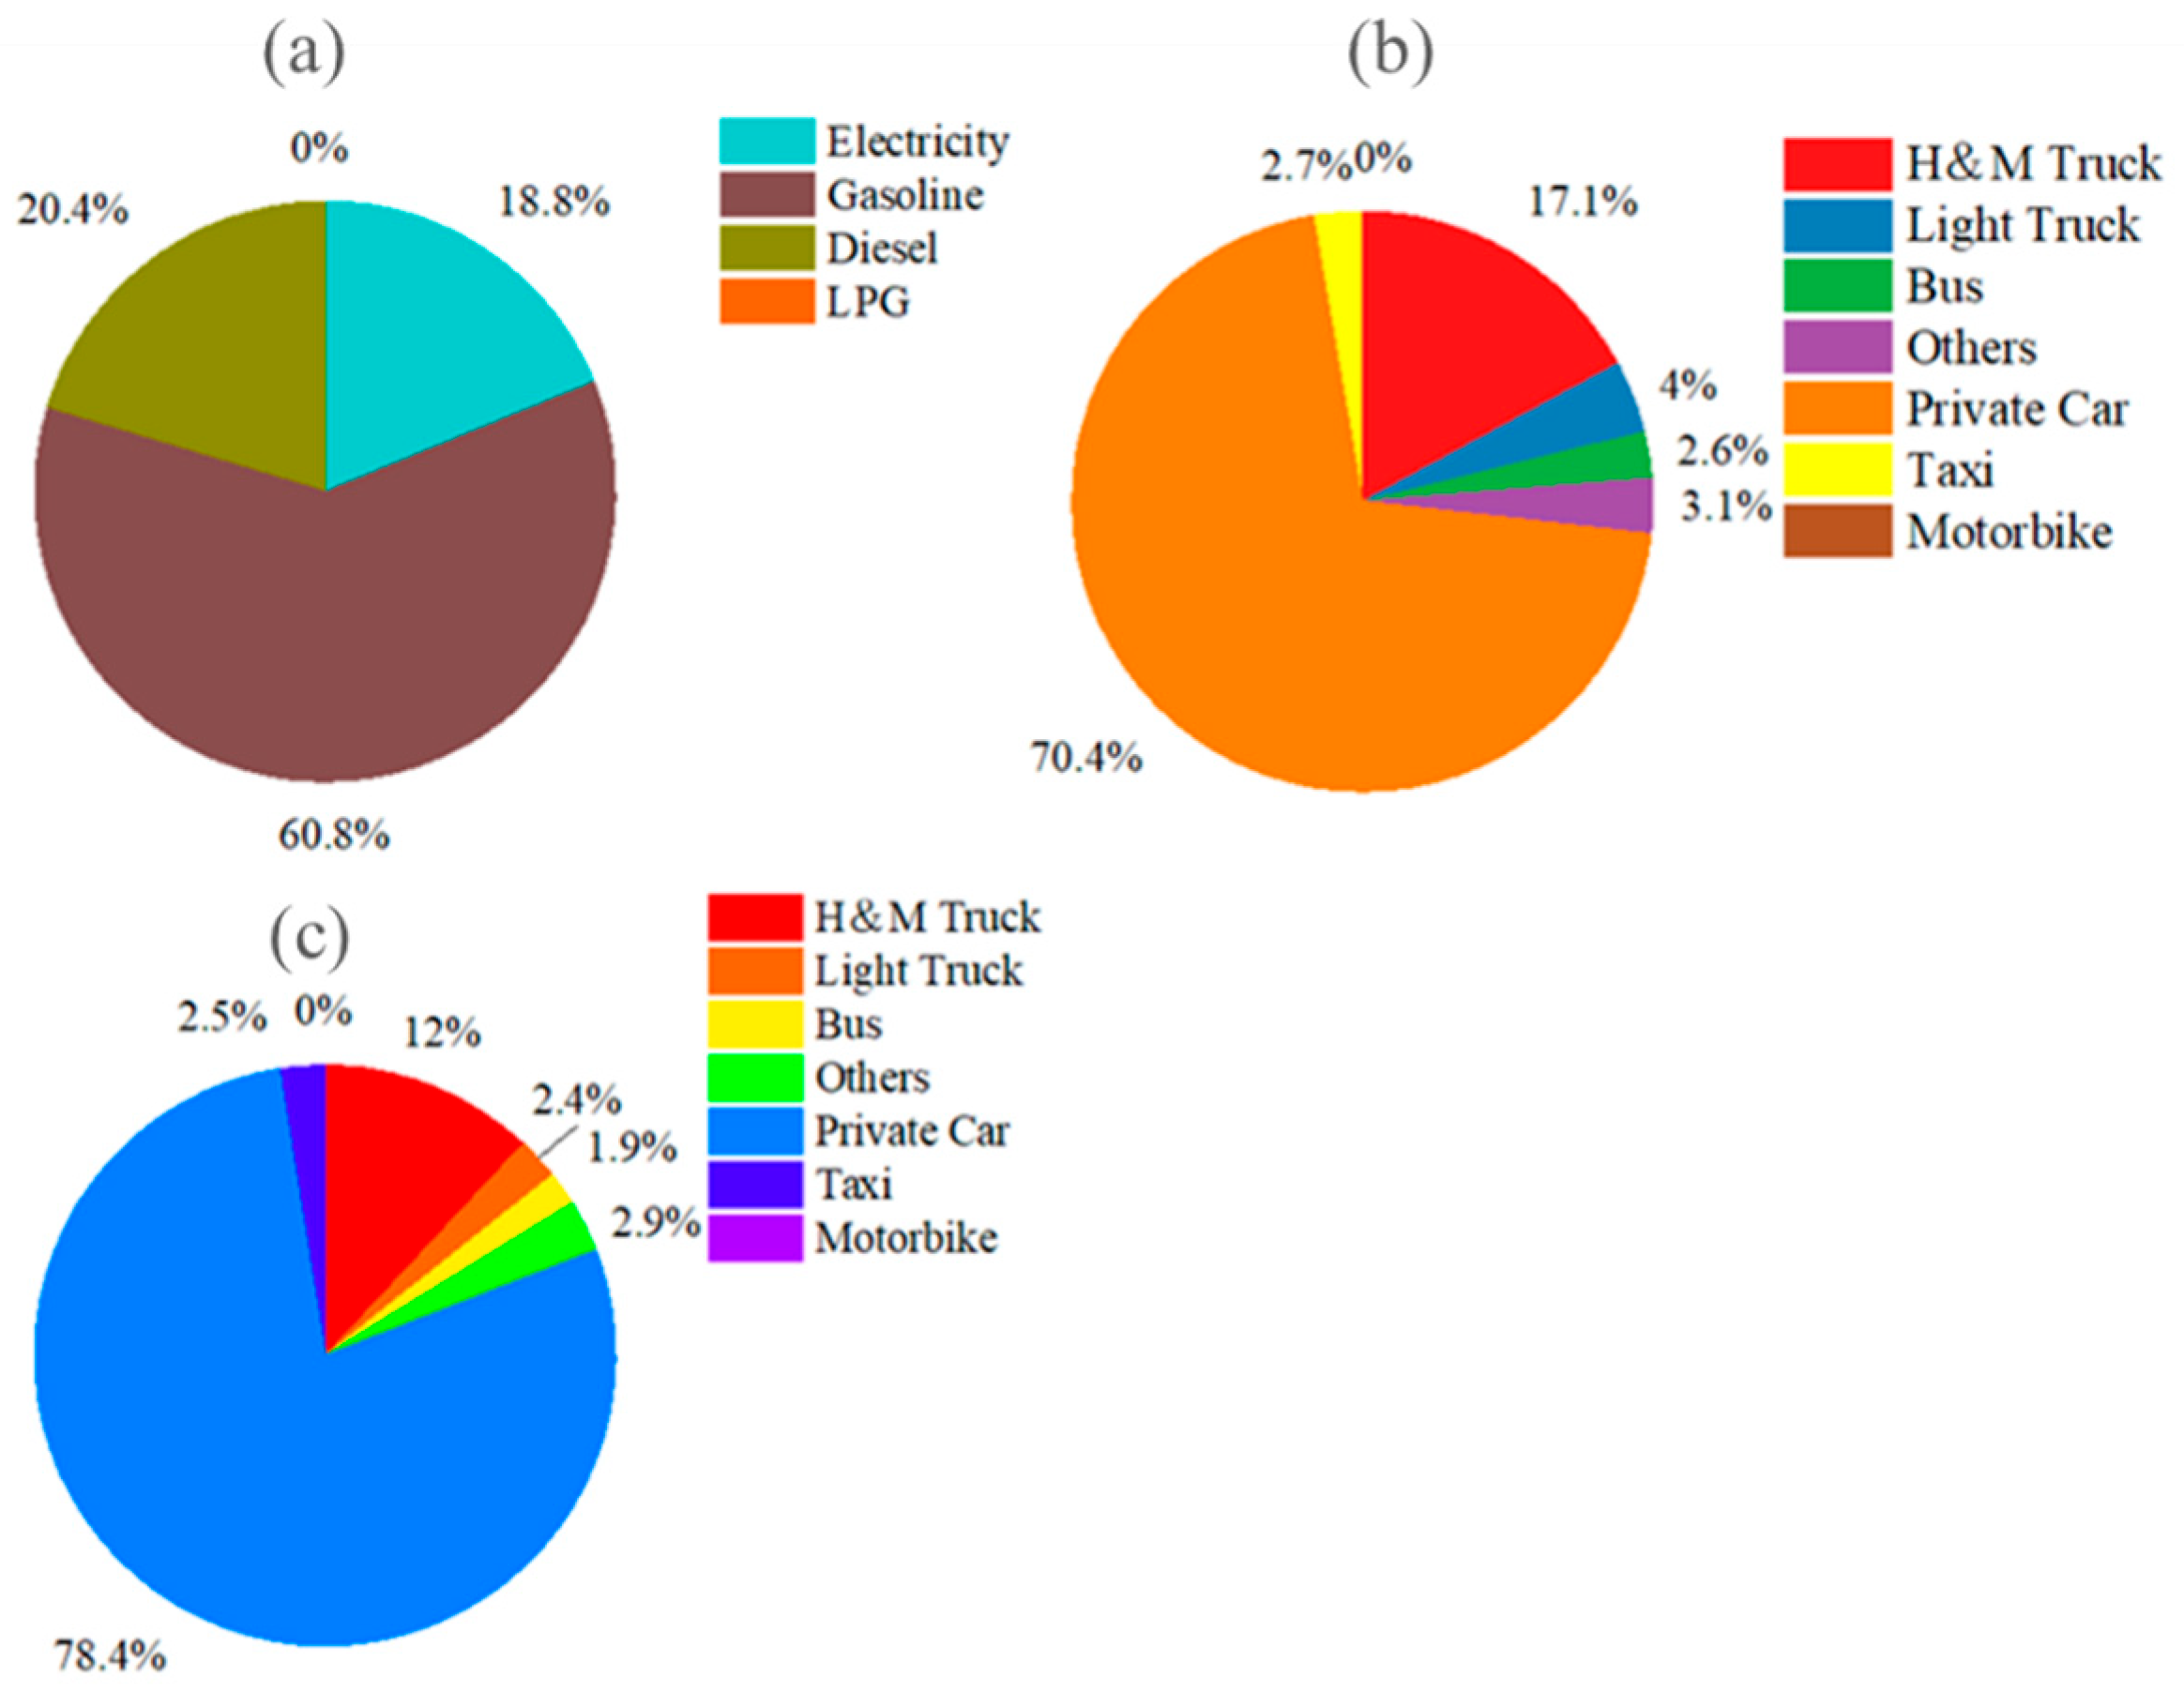
As shown in Figure 9, the total energy consumption for road transportation in Zhengzhou in 2030 is 13,699 ktce. The largest proportion is gasoline, accounting for 60.8%, followed by diesel at 20.4%. The proportion of electricity increases the fastest, rising from 0.6% in 2022 to 18.8% in 2030. Private cars make the highest contribution to energy consumption, at 70.4%, followed by the freight sector at 21.1%. The total CO2 emissions in 2030 are 36 Mt, with private cars being the main source of CO2 emissions, contributing 78.4%. In 2030, the total emissions of CO, VOCs, NOx, PM10, PM2.5, SO2 and NH3 from vehicles in Zhengzhou are 138.84 kt, 23.93 kt, 52.77 kt, 1424.74 t, 1400.1 t, 2152.16 t and 2900.77 t, respectively.
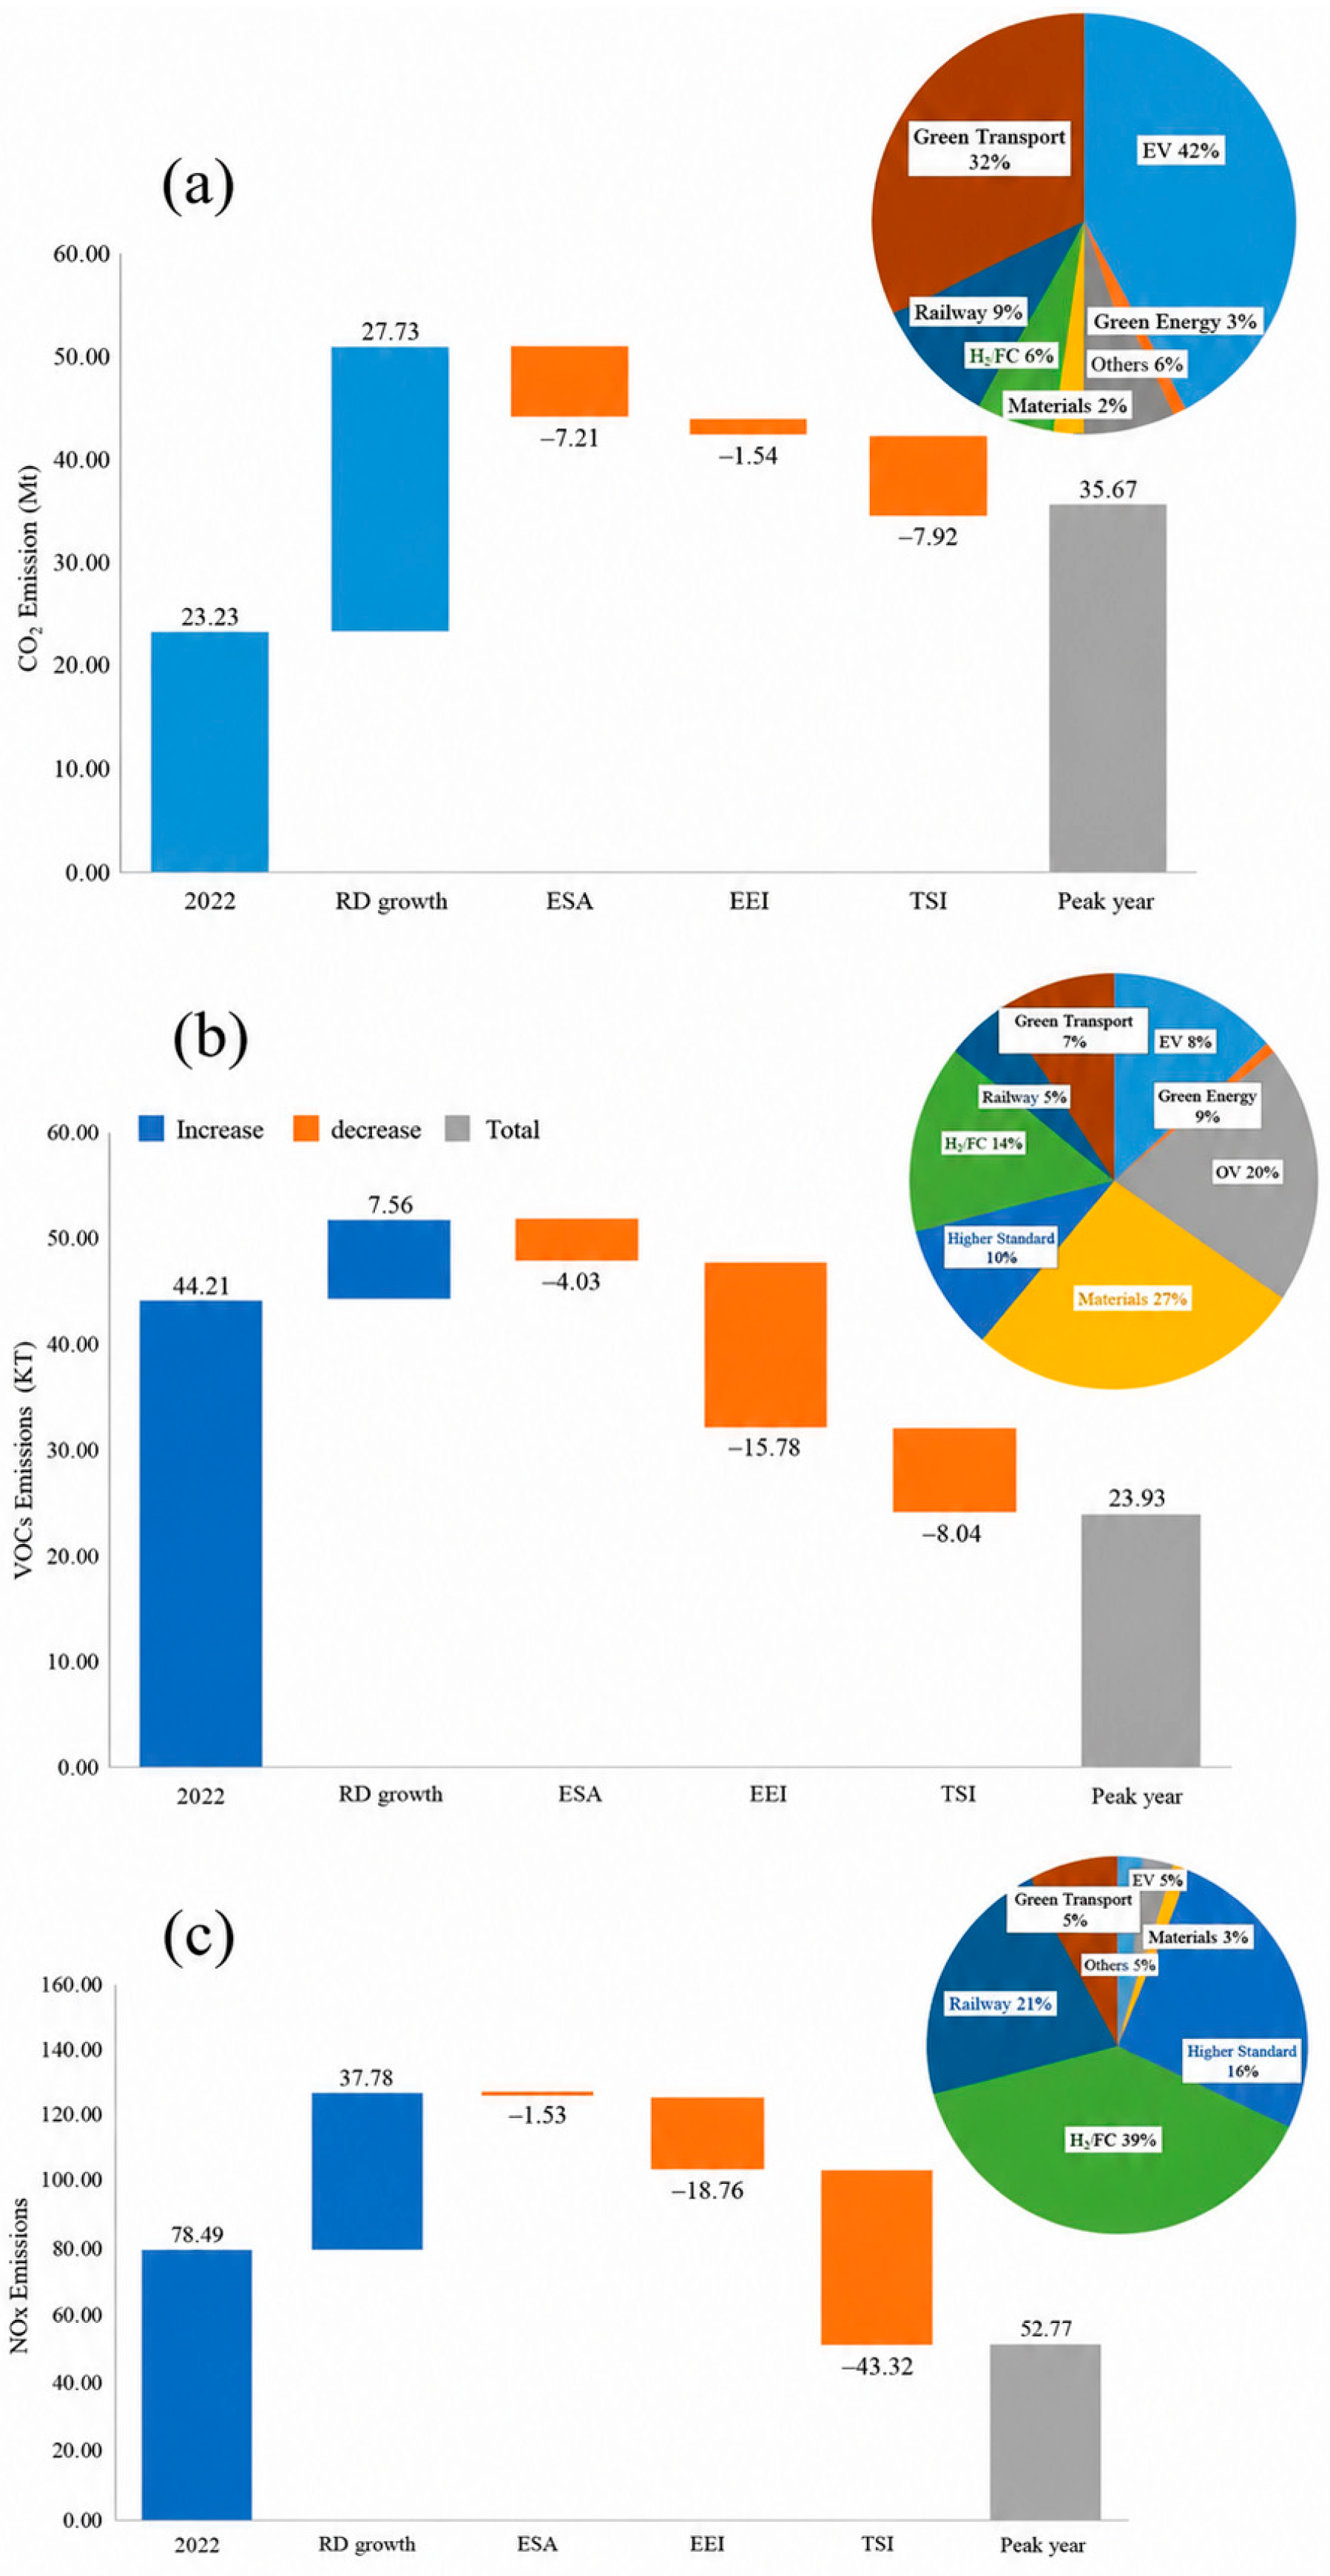
Compared with the EPS, CO2 emissions under the DCS are approximately 9 Mt lower in 2030, corresponding to a reduction of 20%. Figure 10a further decomposes the formation of the 2030 peak-year emissions by considering road transport growth and the mitigation contributions of different policy pathways. Among all mitigation measures, the policies promoting electric vehicle adoption and advancing green transportation systems provide the largest contributions to CO2 abatement in the peak year, accounting for approximately 42% and 32% of the total reduction, respectively.
At present, air pollution prevention and control require coordinated reductions in PM2.5 and O3. This necessitates coordinated reductions in NOx and VOCs. As shown in Figure 10b,c, in the dual carbon scenario, 2030 can achieve a reductions of 20 kt and 11 kt for NOx and VOCs compared to the existing policy scenario. The implementation of multiple policies has made a significant contribution to the reduction in NOx. Policies such as the elimination of motorcycles, the elimination of old vehicles, the encouragement of electric vehicles, and the electrification of urban logistics have the most significant effects, with their contribution rates to the peak-year reduction being 27%, 20%, 14%, and 14%, respectively. For the VOCs, the electrification of urban logistics, emission-standards updates, and the conversion of public transportation to railways have the largest reduction contributions, with their contribution rates to the peak-year reduction being 39%, 25%, and 21%, respectively.
The ELS analysis reveals the degree of synergy between CO2 and air pollutant reductions under each measure (Table 1). Two policies achieve only single-pollutant benefits: the clean energy grid connection policy reduces CO2 exclusively (ELS = undefined, since Δφn = 0), while emission-standard upgrades reduce only criteria pollutants (ELS = 0). All remaining policies demonstrate synergistic co-reduction effects (ELS > 0). Under the overall dual carbon scenario, the average ELS across all pollutants is 0.54, ranging from 0.44 to 0.70. The highest synergy is observed for NH3 (ELSCO2/NH3 = 0.70) and SO2 (ELSCO2/SO2 = 0.68), suggesting that CO2 reduction measures in the dual carbon scenario are particularly effective at simultaneously reducing these two pollutants.
At the individual policy level, the EV promotion policy yields the highest ELS (ELSCO2/pollutants = 1.81), indicating a proportionally greater effect on CO2 than on local air pollutants—consistent with the fact that EVs eliminate tailpipe pollutants entirely, while CO2 reductions depend on the carbon intensity of the electricity grid. In contrast, motorcycle phase-out generates a very low ELS (0.06), reflecting motorcycles’ disproportionately high contribution to VOCs and CO relative to CO2. Similarly, light truck electrification (ELS = 0.15) and old vehicle phase-out (ELS = 0.20) both preferentially reduce criteria pollutants over CO2, because stricter emission standards directly constrain exhaust pollutants but have limited impact on fuel-linked CO2 emissions. These results highlight that a portfolio of policies, combining high-ELS measures (EV promotion, green transport) for CO2 leadership with low-ELS measures (phase-outs, standard upgrades) for air quality leadership, is necessary to maximize synergistic co-benefits.
The elasticity results should not be interpreted as indicating that a larger coefficient is always preferable. A high ELS indicates that the proportional CO2 reduction is large relative to the pollutant reduction, whereas a low positive ELS may identify a measure that is particularly effective for air pollutant control. Measures with high and low ELS values are therefore complementary. Coordinated policy design should combine carbon-oriented measures, including vehicle electrification, public transport, freight modal shift, and electricity decarbonization, with pollution-oriented measures, including accelerated retirement of high-emitting vehicles and tighter emission-standard enforcement.

3.6. Analysis of the Relationship Between the Penetration Rate of EVs and Charging Infrastructure

By summarizing the historical data of vehicle population, EV penetration rate, and charging infrastructure in Zhengzhou from 2019 to 2024, combined with existing policy scenarios and dual carbon scenarios, the future demand for charging piles in Zhengzhou is predicted based on EV population data for 2030 and 2040.
Table 2 presents historical data on vehicle population, EV penetration, and charging infrastructure in Zhengzhou from 2019 to 2024. The total vehicle population grew from 4.4 million in 2019 to 5.93 million in 2024, at an average annual growth rate of 5.1%. Over the same period, the EV stock expanded dramatically from 108,000 to 520,000, raising the penetration rate from 2.5% to 9.2%. The number of charging piles increased from 12,600 in 2019 to 214,000 in 2024, while the vehicle-to-charger ratio decreased from 8.6 to 2.4. This indicates a substantial improvement in charging infrastructure availability, although the 2024 ratio remained slightly above the target value of 2:1. Under the existing policy scenario, the demand for charging piles will reach approximately 370,000 by 2030 and 1.06 million by 2040. Under the dual carbon scenario, the demand rises to approximately 610,000 by 2030 and 1.73 million by 2040 (Table 3).
By accelerating the construction of a well-distributed charging network with a car-to-pile ratio, a public charging intelligent management and control service platform that covers the entire city, features comprehensive functions, and enables “car–pile–network” interconnection will be formed to enhance the charging efficiency of new energy vehicles. Research indicates that the intelligent management and control service platform can not only reduce user charging waiting time by more than 30% but can also increase the utilization rate of power distribution equipment by 22–38%.
The estimated charging demand represents an aggregate planning requirement rather than a detailed engineering deployment plan. Increasing the number of charging piles from approximately 214,000 in 2024 to 610,000 in 2030 would require sustained infrastructure expansion and coordination with the local distribution grid. Its implementation may also be influenced by the charger type, utilization, land availability, and spatial demand distribution. Therefore, delays in charging infrastructure or grid upgrading could affect the pace of EV adoption. The DCS may also involve additional investment in vehicle replacement, charging facilities, grid reinforcement, and operation and maintenance. These economic factors are not explicitly included in the present emissions-focused scenario analysis and should be considered in future assessments of policy feasibility and cost-effectiveness.

4. Conclusions

This study developed an integrated city-level framework linking a co-source inventory of CO2 and seven air pollutants, LEAP-based scenario modeling, policy contribution analysis, elasticity-based co-benefit assessment, and charging infrastructure demand estimation. Unlike assessments that examine carbon mitigation, air pollutant control, and electric-mobility infrastructure separately, the framework evaluates these dimensions using a consistent vehicle classification and scenario structure.
In the 2022 base year, Zhengzhou’s road transport sector consumed 10,178 ktce of energy and emitted 27.8 Mt of CO2. Private cars were the dominant source of CO2, contributing 66.7%, whereas heavy- and medium-duty trucks and light-duty trucks collectively accounted for 76.0% of NOx emissions. These contrasting source profiles indicate that passenger and freight transport require differentiated control strategies.
Continuation of existing policies is insufficient to achieve a road transport CO2 peak before 2030. Under the EPS, CO2 emissions increase to 45 Mt in 2030 and 55 Mt in 2040. Under the DCS, emissions peak at approximately 36 Mt in 2030 and decline to 32 Mt by 2040, corresponding to reductions of 20% and 42% relative to the EPS. EV promotion and green transport development provide the largest contributions to peak-year CO2 mitigation, accounting for 42% and 32% of the total reduction, respectively.
The policy-specific analysis shows that no single measure simultaneously maximizes CO2 and air pollutant reductions. The elasticity results support a differentiated and staged policy portfolio. In the short term, accelerated retirement of old high-emitting vehicles, motorcycle phase-out, tighter emission-standard enforcement, and light-truck electrification should be prioritized to achieve rapid reductions in NOx, VOCs, CO, and exhaust PM. In the medium and long term, large-scale private-vehicle electrification, green public transport, freight modal shifts, and electricity-sector decarbonization should become the principal measures for constraining CO2 growth and maintaining the post-peak decline. Measures with high and low ELS values should be regarded as complementary components of an integrated portfolio rather than competing alternatives.
Charging infrastructure and power-grid capacity are enabling conditions for the mitigation pathway. Under the DCS, approximately 1.22 million EVs and 610,000 charging piles would be required by 2030 to achieve a vehicle-to-charger ratio of 2:1. Infrastructure planning should consider not only the number of chargers but also their spatial allocation, utilization, fast- and slow-charging composition, grid-connection capacity, land requirements, and investment needs. Delayed deployment could constrain EV adoption and weaken the projected emission benefits.
This study is subject to several limitations. The air pollutant inventory covers exhaust emissions and excludes upstream and non-exhaust emissions. Non-exhaust particulate emissions, including tire wear, brake wear, road-surface abrasion, and road-dust resuspension, are not included. The scenario results depend on assumptions concerning transport activity, electrification, electricity carbon intensity, technology adoption, and policy implementation and do not explicitly represent abrupt economic or supply-chain shocks. Future research should incorporate non-exhaust particulate matter, upstream air pollutants, spatially resolved charging loads, grid constraints, investment costs, and probabilistic uncertainty. Subject to these limitations, the Zhengzhou case demonstrates that coordinated vehicle, transport structure, emission control, power sector, and infrastructure policies are required to achieve urban transport carbon peaking and air pollution co-control.

Supplementary Materials

The following supporting information can be downloaded at: https://www.mdpi.com/article/10.3390/atmos17080790/s1. Table S1: Annual average vehicle kilometers travelled (VKT, in km) in Zhengzhou. Table S2 Temperature and Relative humidity in Zhengzhou in 2022, Figure S1: The composition and distribution of VOCs emissions. (a) The composition of VOCs emissions in 2022 and 2040 of the two scenarios. (b) Existing policy scenario. (c) Dual carbon scenario, Figure S2: The composition and distribution of PM2.5 emissions. (a) The composition of PM2.5 emissions in 2022 and 2040 of the two scenarios. (b) Existing policy scenario. (c) Dual carbon scenario.

Author Contributions

Conceptualization, F.Y. and Z.D.; methodology, Z.D. and F.Y.; writing—original draft preparation, Z.D.; writing—review and editing, F.Y., X.L., R.X. and S.W. All authors have read and agreed to the published version of the manuscript.

Funding

This research was funded by National Key R&D Program of China grant number [2024YFC3713700].

Institutional Review Board Statement

Not applicable.

Informed Consent Statement

Not applicable.

Data Availability Statement

The data supporting the findings of this study are available from the corresponding author upon reasonable request.

Conflicts of Interest

The authors declare no conflicts of interest.

References

  1. IPCC. Climate Change 2023: Synthesis Report; Intergovernmental Panel on Climate Change: Geneva, Switzerland, 2023. [Google Scholar] [CrossRef] [Scilit]
  2. World Health Organization (WHO). Ambient (Outdoor) Air Pollution; World Health Organization: Geneva, Switzerland, 2024; Available online: https://www.who.int/news-room/fact-sheets/detail/ambient-(outdoor)-air-quality-and-health (accessed on 10 August 2026).
  3. Lang, J.; Cheng, S.; Wei, W.; Zhou, Y.; Wei, X.; Chen, D. A study on the trends of vehicular emissions in the Beijing–Tianjin–Hebei (BTH) region, China. Atmos. Environ. 2012, 62, 605–614. [Google Scholar] [CrossRef] [Scilit]
  4. Sun, S.; Jiang, W.; Gao, W. Vehicle emission trends and spatial distribution in Shandong province, China, from 2000 to 2014. Atmos. Environ. 2016, 147, 190–199. [Google Scholar] [CrossRef] [Scilit]
  5. Rangaraju, S.; De Vroey, L.; Messagie, M.; Mertens, J.; Van Mierlo, J. Impacts of electricity mix, charging profile, and driving behavior on the emissions performance of battery electric vehicles: A Belgian case study. Appl. Energy 2015, 148, 496–504. [Google Scholar] [CrossRef] [Scilit]
  6. Bai, L.; Lu, X.; Yin, S.; Zhang, H.; Ma, S.; Wang, C.; Li, Y.; Zhang, R. A recent emission inventory of multiple air pollutant, PM2.5 chemical species and its spatial-temporal characteristics in central China. J. Clean. Prod. 2020, 269, 122114. [Google Scholar] [CrossRef] [Scilit]
  7. Shiraki, H.; Matsumoto, K.; Shigetomi, Y.; Ehara, T.; Ochi, Y.; Ogawa, Y. Factors affecting CO2 emissions from private automobiles in Japan: The impact of vehicle occupancy. Appl. Energy 2020, 259, 114196. [Google Scholar] [CrossRef] [Scilit]
  8. Zhang, J.; Su, Y.; Chen, C.; Guo, W.; Tan, Q.; Feng, M.; Song, D.; Jiang, T.; Chen, Q.; Li, Y.; et al. Chemical composition, sources and formation mechanism of urban PM2.5 in Southwest China: A case study at the beginning of 2023. Atmos. Chem. Phys. 2024, 24, 2803–2820. [Google Scholar] [CrossRef] [Scilit]
  9. Xue, R.; Wang, S.; Zhang, S.; He, S.; Liu, J.; Tanvir, A.; Zhou, B. Estimating city NOX emissions from TROPOMI high spatial resolution observations–A case study on Yangtze River Delta, China. Urban Clim. 2022, 43, 101150. [Google Scholar] [CrossRef] [Scilit]
  10. Jing, B.; Wu, L.; Mao, H.; Gong, S.; He, J.; Zou, C.; Song, G.; Li, X.; Wu, Z. Development of a vehicle emission inventory with high temporal–spatial resolution based on NRT traffic data and its impact on air pollution in Beijing-Part 1: Development and evaluation of vehicle emission inventory. Atmos. Chem. Phys. 2016, 16, 3161–3170. [Google Scholar] [CrossRef] [Scilit]
  11. Ou, X.; Zhang, X.; Chang, S. Scenario analysis on alternative fuel/vehicle for China’s future road transport: Life-cycle energy demand and GHG emissions. Energy Policy 2010, 38, 3943–3956. [Google Scholar] [CrossRef] [Scilit]
  12. Zheng, B.; Zhang, Q.; Jens, B.; Huo, H.; Guan, D.; Krzyzanowski, Z.; Peters, G.; He, K. How will greenhouse gas emissions from motor vehicles be constrained in China around 2030. Appl. Energy 2015, 156, 230–240. [Google Scholar] [CrossRef] [Scilit]
  13. Yan, X.; Crookes, R. Reduction potentials of energy demand and GHG emissions in China’s road transport sector. Energy Policy 2009, 37, 658–668. [Google Scholar] [CrossRef] [Scilit]
  14. Huang, Y.; Matsumoto, K. Drivers of the change in carbon dioxide emissions under the progress of urbanization in 30 provinces in China: A decomposition analysis. J. Clean. Prod. 2021, 322, 129000. [Google Scholar] [CrossRef] [Scilit]
  15. Liu, L.; Wang, K.; Wang, S.; Zhang, R.; Tang, X. Assessing energy consumption, CO2 and pollutant emissions and health benefits from China’s transport sector through 2050. Energy Policy 2018, 116, 382–396. [Google Scholar] [CrossRef] [Scilit]
  16. Zhang, S.; Wu, Y.; Wu, X.; Li, M.; Ge, Y.; Liang, B.; Xu, Y.; Zhou, Y.; Liu, H.; Fu, L.; et al. Historic and future trends of vehicle emissions in Beijing, 1998–2020: A policy assessment for the most stringent vehicle emission control program in China. Atmos. Environ. 2014, 89, 216–229. [Google Scholar] [CrossRef] [Scilit]
  17. Guo, X.; Fu, L.; Ji, M.; Lang, J.; Chen, D.; Cheng, S. Scenario analysis to vehicular emission reduction in Beijing-Tianjin-Hebei (BTH) region, China. Environ. Pollut. 2016, 216, 470–479. [Google Scholar] [CrossRef] [Scilit] [PubMed]
  18. Peng, B.; Du, H.; Ma, S.; Fan, Y.; David, C. Urban passenger transport energy saving and emission reduction potential: A case study for Tianjin, China. Energy Convers. Manag. 2015, 102, 4–16. [Google Scholar] [CrossRef] [Scilit]
  19. Cai, L.; Luo, J.; Wang, M.; Guo, J.; Duan, J.; Li, J.; Li, S.; Liu, L.; Ren, D. Pathways for municipalities to achieve carbon emission peak and carbon neutrality: A study based on the LEAP model. Energy 2023, 262, 125435. [Google Scholar] [CrossRef] [Scilit]
  20. Shang, H.; Sun, Y.; Huang, D.; Meng, F. Life cycle assessment of atmospheric environmental impact on the large-scale promotion of electric vehicles in China. Resour. Environ. Sustain. 2024, 15, 100148. [Google Scholar] [CrossRef] [Scilit]
  21. Xu, Z.; Chen, S.; Sang, M.; Wang, Z.; Bo, X.; You, Q. Air quality improvement through vehicle electrification in Hainan province, China. Chemosphere 2023, 316, 137814. [Google Scholar] [CrossRef] [Scilit] [PubMed]
  22. Van Vliet, O.; Brouwer, A.; Kuramochi, T.; van Den Broek, M.; Faaij, A. Energy use, cost and CO2 emissions of electric cars. J. Power Sources 2011, 196, 2298–2310. [Google Scholar] [CrossRef] [Scilit]
  23. Yu, J.; Yang, P.; Zhang, K.; Wang, F.; Miao, L. Evaluating the effect of policies and the development of charging infrastructure on electric vehicle diffusion in China. Sustainability 2018, 10, 3394. [Google Scholar] [CrossRef] [Scilit]
  24. Qiu, Y.; Wang, Y.; Iseki, H.; Shen, X.; Xing, B.; Zhang, H. Empirical grid impact of in-home electric vehicle charging differs from predictions. Resour. Energy Econ. 2022, 67, 101275. [Google Scholar] [CrossRef] [Scilit]
  25. Bautista, P.; Lemus Cárdenas, L.; Urquiza Aguiar, L.; Aguilar Igartua, M. A traffic-aware electric vehicle charging management system for smart cities. Veh. Commun. 2019, 20, 100188. [Google Scholar] [CrossRef] [Scilit]
  26. Jiang, W.; Zhen, Y. A real-time EV charging scheduling for parking lots with PV system and energy store system. IEEE Access 2019, 7, 86184–86193. [Google Scholar] [CrossRef] [Scilit]
  27. Lin, B.; Yang, M. Changes in consumer satisfaction with electric vehicle charging infrastructure: Evidence from two cross-sectional surveys in 2019 and 2023. Energy Policy 2024, 185, 113924. [Google Scholar] [CrossRef] [Scilit]
  28. Cai, J.; Zhou, Z.; Zhao, Z.; Wang, Y. Insights for sustainable urban transport via private charging pile sharing in the electric vehicle sector. Transp. Res. Rec. 2025, 2679, 1134–1169. [Google Scholar] [CrossRef] [Scilit]
  29. Hao, H.; Wang, H.; Ouyang, M. Fuel conservation and GHG emissions mitigation scenarios for China’s passenger vehicle fleet. Energy 2011, 36, 6520–6528. [Google Scholar] [CrossRef] [Scilit]
  30. Zachariadis, T.; Samaras, Z.; Zierock, K.H. Dynamic modeling of vehicle populations: An engineering approach for emissions calculations. Technol. Forecast. Soc. Change 1995, 50, 135–149. [Google Scholar] [CrossRef] [Scilit]
  31. Gu, X.; Yin, S.; Lu, X.; Zhang, H.; Wang, L.; Bai, L.; Wang, C.; Zhang, R.; Yuan, M. Recent development of a refined multiple air pollutant emission inventory of vehicles in the Central Plains of China. J. Environ. Sci. 2019, 84, 80–96. [Google Scholar] [CrossRef] [Scilit] [PubMed]
  32. Fu, Z.; Dong, P.; Li, S.; Ju, Y.; Liu, H. How blockchain renovate the electric vehicle charging services in the urban area? A case study of Shanghai, China. J. Clean. Prod. 2021, 315, 128172. [Google Scholar] [CrossRef] [Scilit]
  33. Li, S.; Yue, Q. Analysis on the energy demand, CO2 and pollutant emissions, and health benefits from urban road transport sector: A case study of Shenyang. Green Low-Carbon Econ. 2024, 2, 143–150. [Google Scholar]
  34. Shuai, C.; Zhang, X.; Ouyang, X.; Liu, K.; Yang, Y. Research on charging demands of commercial electric vehicles based on Voronoi diagram and spatial econometrics model: An empirical study in Chongqing, China. Sustain. Cities Soc. 2024, 105, 105335. [Google Scholar] [CrossRef] [Scilit]
  35. Zhang, Q.; Sun, G.; Fang, S.; Tian, W.; Li, X.; Wang, H. Air pollutant emissions from vehicles in China under various energy scenarios. Sci. Total Environ. 2013, 450–451, 250–258. [Google Scholar] [CrossRef] [Scilit] [PubMed]
  36. Hong, S.; Chung, Y.; Kim, J.; Chun, D. Analysis on the level of contribution to the national greenhouse gas reduction target in Korean transportation sector using LEAP model. Renew. Sustain. Energy Rev. 2016, 60, 549–559. [Google Scholar] [CrossRef] [Scilit]
  37. Pang, K.; Zhang, Q.; Ma, C.; Zhu, L.; Chen, H.; Kong, X.; Pan, F.; Yang, H. Forecasting of emission co-reduction of greenhouse gases and pollutants for the road transport sector in Lanzhou based on the LEAP model. Environ. Sci. 2022, 43, 3386–3395. [Google Scholar] [CrossRef] [Scilit] [PubMed]
  38. Xu, M.; Qin, Z.; Zhang, S. Carbon dioxide mitigation co-effect analysis of clean air policies: Lessons and perspectives in China’s Beijing–Tianjin–Hebei region. Environ. Res. Lett. 2021, 16, 015006. [Google Scholar] [CrossRef] [Scilit]
  39. Timmers, V.R.J.H.; Achten, P.A.J. Non-exhaust PM emissions from electric vehicles. Atmos. Environ. 2016, 134, 10–17. [Google Scholar] [CrossRef] [Scilit]
Figure 1. Location of Zhengzhou in China.
Atmosphere 17 00790 g001
Figure 2. Characteristics of the vehicle energy consumption and emissions in 2022. (a) Energy consumption by type, (b) energy consumption by vehicle, (c) CO2 emission.
Atmosphere 17 00790 g002
Figure 3. The contributions of pollutant emissions by vehicle in Zhengzhou in 2022. (a) NOx, (b) VOCs.
Atmosphere 17 00790 g003
Figure 4. Distribution of energy consumption types of vehicles in different scenarios in Zhengzhou. (a) Existing policy scenario in 2030, (b) existing policy scenario in 2040, (c) dual carbon scenario in 2030, (d) dual carbon scenario in 2040.
Atmosphere 17 00790 g004
Figure 5. Prediction of energy consumption trends and distribution of vehicles under different scenarios in Zhengzhou. (a) Energy consumption trends, (b) existing policy scenario, (c) dual carbon scenario.
Atmosphere 17 00790 g005
Figure 6. Vehicle emissions under different scenarios. (a) CO2, (b) CO, (c) VOCs, (d) NOx, (e) PM10, (f) PM2.5, (g) SO2, (h) NH3.
Atmosphere 17 00790 g006
Figure 7. The composition and distribution of CO2 emissions. (a) The composition of CO2 emissions in 2022 and 2040 of the two scenarios, (b) existing policy scenario, (c) dual carbon scenario.
Atmosphere 17 00790 g007
Figure 8. The composition and distribution of NOx emissions. (a) The composition of NOx emissions in 2022 and 2040 of the two scenarios, (b) existing policy scenario, (c) dual carbon scenario.
Atmosphere 17 00790 g008
Figure 9. The characteristics of energy consumption and emissions of vehicles in Zhengzhou in the peak year of 2030 under the dual carbon scenario. (a) Consumption characteristics of energy types, (b) distribution characteristics of energy consumption, (c) distribution characteristics of CO2 emissions.
Atmosphere 17 00790 g009
Figure 10. The reduction effects of different measures for (a) CO2, (b) NOx, and (c) VOC emissions from vehicles in Zhengzhou in 2030 under the dual carbon scenario.
Atmosphere 17 00790 g010
Table 1. Elastic coefficients (ELSs) for the carbon peak scenario.
Scenario and PolicyELSCO2/VOCsELSCO2/NOxELSCO2/NH3ELSCO2/PM2.5ELSCO2/PM10ELSCO2/COELSCO2/SO2ELSCO2/Pollutants
Carbon peak scenario0.600.540.700.460.440.540.680.54
EVP1.7411.220.540.981.071.461.071.81
REGNANANANANANANANA
OVE0.210.203.310.080.070.201.590.20
ME0.040.770.720.260.280.0400.06
IES00000000
ELT0.230.090.650.450.490.170.180.15
TR1.060.272.521.271.390.740.370.54
GPT1.912.290.811.111.031.881.461.91
NA indicates that the elasticity coefficient is undefined because the denominator is zero. EVP = EV promotion, REG = Renewable energy generation, OVE = Old vehicle elimination, ME = Motorcycle elimination, IES = Improve emission standards, ELT = Electrification of light trucks, TR = Transit rail, GPT = Green public transportation.
Table 2. Data on charging piles in Zhengzhou from 2019 to 2024 (unit: thousand).
Years201920202021202220232024
Vp440043004870522056505930
EVp110120140260380520
VCs12.620234469214
VCR8.66.16.15.85.52.4
Vp = Vehicle population, EVp = EV population, VCs = Vehicles to charge, VCR = Vehicle-to-charge ratio.
Table 3. Data on charging piles in Zhengzhou in 2030 and 2040 under the predicted scenario (unit: thousand).
YearsEP2030EP2040DC2030DC2040
Vp7570763075207290
EVp740211012203450
VCD37010556101725
VCRt2222
VCD = Vehicle-to-charge demand, VCRt = Target vehicle-to-charge ratio.
Disclaimer/Publisher’s Note: The statements, opinions and data contained in all publications are solely those of the individual author(s) and contributor(s) and not of MDPI and/or the editor(s). MDPI and/or the editor(s) disclaim responsibility for any injury to people or property resulting from any ideas, methods, instructions or products referred to in the content.