Article

Dual-Source Transport, Vertical Evolution, and Topographic Modulation of the March 2023 East Asian Dust Storm in the Context of 2000–2024 Spring Dust Variability

1
College of Atmospheric Sciences, Lanzhou University, Lanzhou 730000, China
2
Ordos Meteorological Bureau, Ordos 017000, China
3
Pishan County Meteorological Bureau, Guma, Hotan 845150, China
*
Author to whom correspondence should be addressed.
Atmosphere 2026, 17(8), 740; https://doi.org/10.3390/atmos17080740
Submission received: 29 May 2026 / Revised: 26 July 2026 / Accepted: 28 July 2026 / Published: 30 July 2026
(This article belongs to the Section Meteorology)

Abstract

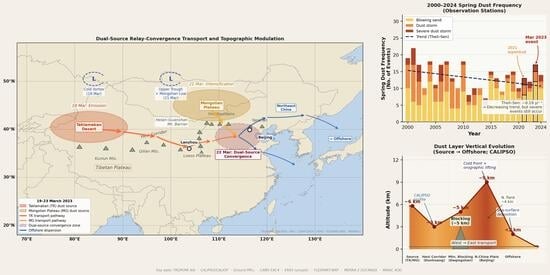
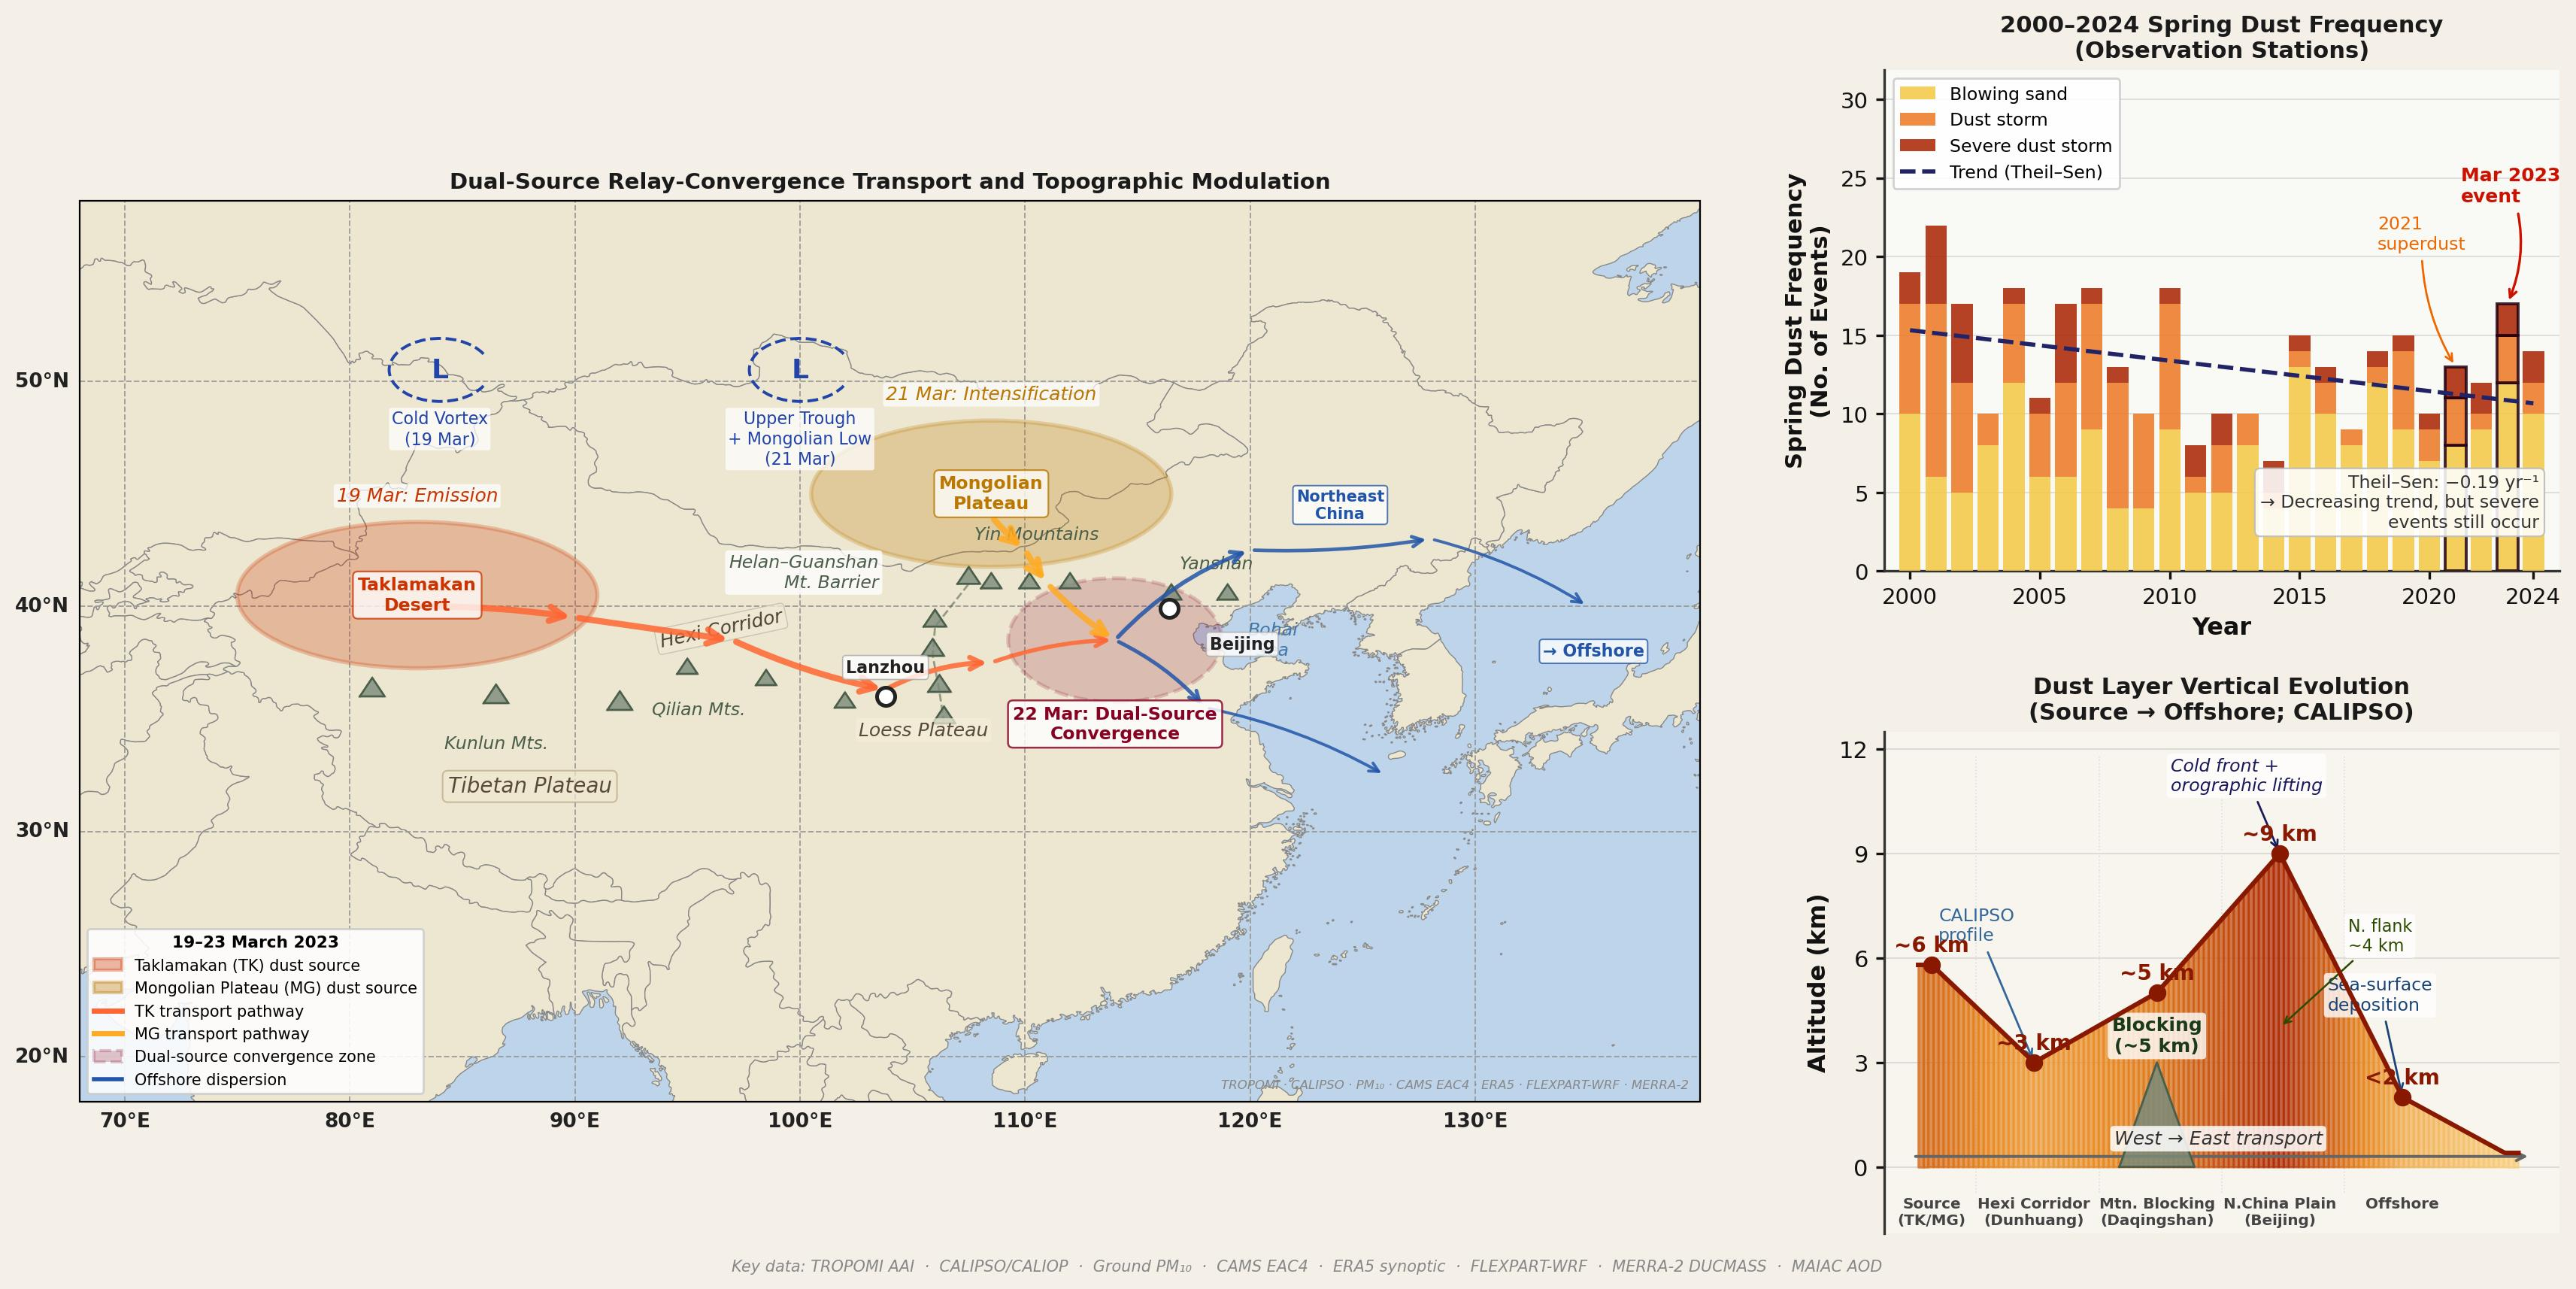
East Asian spring dust activity has generally weakened since the early 2000s (Theil-Sen trend −1.07 × 10⁻⁶ yr−1, significant over 62% of the domain), but severe events continue to occur when synoptic forcing, source-region dryness, and terrain-guided transport are favorably coupled. This study places the 19–23 March 2023 East Asian dust storm within this 2000–2024 background and provides an integrated three-dimensional analysis of its transport, vertical structure, and topographic controls. The event developed as a dual-source relay-convergence process: Taklamakan Desert dust was emitted first on 19 March and transported southeastward along the Hexi Corridor, while Mongolian Plateau dust intensified on 21 March and mainly affected North China. Independently calibrated, PM10-cross-validated FLEXPART-WRF trajectory arrays (R = 0.74–0.81) show Taklamakan contributed 100% of the calibrated near-surface dust mass at Lanzhou and Mongolian 98% at Beijing during each receptor’s event peak window. Four independent dynamical diagnostics quantify topographic control, showing the Helan Mountains attenuate westward-approaching Taklamakan dust by 23% across the range. TROPOMI AAI, CALIPSO, ground PM10, and CAMS EAC4 jointly corroborate multi-level cold-vortex/trough-frontal coupling and terrain blocking as the controlling mechanisms, demonstrating that extreme dust episodes can still occur under a weakening long-term background when dynamic lifting, dual-source activation, and topographic channeling act together.

Graphical Abstract

1. Introduction

Dust storms affect approximately 330 million people worldwide each year, and East Asia is among the regions most frequently influenced by severe dust events [1,2]. High dust concentrations reduce visibility, disrupt ground and air transportation, degrade air quality, and increase respiratory and cardiovascular health risks [2,3,4,5,6,7]. East Asian dust activity is strongly concentrated in spring (March–May, accounting for roughly 60–70% of the annual total), when thawing land surfaces, sparse vegetation, and active cold-air outbreaks favor emission from the region’s two major source regions, the Taklamakan Desert and the Gobi Desert of the Mongolian Plateau [8,9,10,11,12,13], which together contribute approximately 12% of global dust emissions, averaging roughly 600 Tg per year [6,14]. Dust from these two source regions is frequently carried eastward by the mid-latitude westerlies, Mongolian cyclones, and cold front systems [15], with impacts extending across the economy and livelihoods of East Asia and into the marine ecosystems of the North Pacific, where dust deposition has been linked to nutrient loading and harmful algal blooms [16,17,18,19]. Under favorable circulation patterns, synoptic forcing and topography can jointly cause path divergence and concentration superposition among dust from different source regions during transport, intensifying downstream impacts. Although multi-decadal records indicate an overall weakening of spring dust activity after the early 2000s, recent extreme events demonstrate that strong dust episodes can still occur when synoptic forcing, dry source regions, and terrain-guided transport act together [20].
In March 2021, a super dust storm affected East Asia under the influence of a strong Mongolian cyclone. The peak PM10 concentration in Beijing reached approximately 3600 ug m−3, about 80 times the World Health Organization 24-h guideline value [21,22], with satellite, lidar, and in-situ observations from multiple independent groups documenting the event’s evolution and particle characteristics [23,24,25]. Previous studies have shown that this event was mainly sourced from the Mongolian Plateau and Gobi Desert [26,27], with cyclone activity and a cold-air outbreak providing the primary synoptic forcing [26]. The dust plume extended eastward to coastal areas [28], forming a relatively coherent northwest-southeast transport belt [26]. In March 2023, East Asia experienced another severe dust storm driven by the combined effects of a Mongolian cyclone and a surface cold front [29]. Unlike the 2021 event, the 2023 event involved two spatially separated source regions, namely the Taklamakan Desert and the Mongolian Plateau [30]. Dust from these two sources interacted in time and space, leading to efficient eastward transport and a broad affected area. Complex terrain is a key factor that differentiates East Asian dust transport from idealized zonal transport. Mountain ranges, basins, corridors, and plains can redirect dust pathways through blocking, channeling, orographic lifting, and post-barrier dispersion [15,16,31]. In particular, the Hexi Corridor provides a preferred southeastward pathway for Taklamakan dust, whereas the Yinshan–Daqingshan–Yanshan mountain systems modulate the southeastward transport and vertical redistribution of Mongolian dust. Therefore, examining the March 2023 event from a topographic perspective helps clarify why two spatially separated sources produced different transport pathways and downstream impacts.
Dust source attribution is a key research tool for understanding dust transport processes and disentangling the relative contributions of different source regions; in this area, recent studies have progressively shifted from qualitative descriptions of source direction toward quantitative estimates of source-region contributions. Existing work has attributed the exceptional dust storm of March 2021 to its source regions [26], quantified Mongolia’s contribution to North China dust concentrations in March–April 2023 at more than 42% [32], and systematically traced the source regions of multiple severe dust events in 2023 [30]. Other studies have provided quantitative decompositions of source contributions for dust deposition on the Loess Plateau [8] and for the two 2021 super dust storms [27], and have revealed shifting source-region patterns across Central East Asia during 2000–2023 [33]. However, these results are mostly regional-scale average contributions (e.g., “Mongolia contributes 42%”), and few have quantified contribution rates down to the scale of a specific receptor city for a single event using mutually independent, cross-validated methods.
Satellite remote sensing provides an irreplaceable means of capturing the spatial extent and three-dimensional structure of dust. CALIPSO/CALIOP-based analyses have systematically characterized the vertical structure and optical properties of East Asian dust [34,35,36,37,38], the combined use of ground-based lidar networks and spaceborne lidar has revealed the vertical evolution of cross-border transport [9,10], and multi-platform satellite observations have been used to identify dust activation and its dominant transport pathways [15]. However, while satellite observations excel at capturing the spatial distribution, vertical stratification, and optical properties of dust plumes, they cannot directly yield quantitative mass-contribution rates from source regions to specific receptor cities—precisely the gap that Lagrangian modeling approaches are needed to fill.
Numerical models are essential for elucidating East Asian dust transport mechanisms, estimating source-receptor relationships, and supporting operational forecasts and early warnings [2,39,40,41]. Eulerian regional chemical transport models and global aerosol models have been widely used to simulate dust emission, vertical mixing, and deposition [2,39,42,43,44,45,46]. However, numerical diffusion and uncertainties in dust emission schemes can affect simulated concentrations and source attribution during long-range transport [41,47,48]. Lagrangian particle dispersion and trajectory simulations, including FLEXPART, provide a complementary framework: they link source and receptor regions through forward and backward simulations and are particularly well suited to tracing transport pathways over complex terrain. Such models and their backward source-receptor frameworks have been widely applied [47,48,49], used to simulate the transport of the 2021 East Asian super dust storm [41], and combined with inverse modeling to constrain its source strength [40]. However, most prior case studies have illustrated transport pathways using a single trajectory or a small number of trajectories, without systematically addressing the sensitivity of results to release-time and release-height choices or their statistical representativeness—a single trajectory can readily produce a visually appealing but distorted conclusion.
Topographic modulation of dust transport is a key factor that distinguishes East Asian dust from idealized zonal transport. Prior studies have quantified the role of “channel effects” in Asian dust transport [31], revealed the formation of a low-level barrier jet in the Hexi Corridor and its modulation by dust radiative forcing [50], and analyzed the favorable circulation patterns and transport mechanisms governing Taklamakan dust reaching the Tibetan Plateau [51]. However, existing work has largely focused on the macro-scale diversion or blocking of cross-regional dust by major topographic features such as the Tibetan Plateau, and remains largely qualitative—few studies have used multiple independent dynamical diagnostics (vertical velocity cross-sections, low-level convergence fields, upstream/downstream concentration comparisons) to quantify the distinct “barrier versus channel” physical roles played by regional-scale secondary mountain ranges such as the Helan Shan and Yinshan.
To address these four gaps, this study places the March 2023 event within the 2000–2024 spring dust background, replaces single trajectories with hourly-release trajectory arrays, and cross-validates two independent methods—forward mass-transport dispersion and backward trajectory residence time—to derive quantitative, sensitivity-tested source-contribution rates for urban receptors. It further cross-validates multi-source observations including TROPOMI AAI, CALIPSO, ground-based PM10, and CAMS EAC4, and uses multiple independent dynamical diagnostics to quantitatively characterize how the Helan Shan and Yinshan modulate dust transport pathways—together constituting an integrated, quantitative, cross-validated perspective that prior single-source, single-dataset, or single-trajectory studies have not provided.
Building on this integrated approach, the study is organized around four central questions: (1) what long-term spring dust background preceded the event, established by tracking 2000–2024 spring-mean MERRA-2 DUCMASS trends alongside supporting remote-sensing, meteorological, and land-surface variables; (2) how did Taklamakan and Mongolian dust plumes evolve horizontally and vertically, as captured by TROPOMI AAI and CALIPSO and cross-checked against CAMS EAC4; (3) how did topography modulate source-dependent pathways, diagnosed through ERA5-derived vertical velocity, low-level convergence, terrain cross-sections, and upstream-downstream PM10 contrasts; and (4) what source-receptor evidence—from hourly-release FLEXPART-WRF trajectory arrays cross-validated against PM10 through mass calibration, residence time, and independent trajectory statistics—supports the Lanzhou-Taklamakan and Beijing-Mongolian relationships?

2. Materials and Methods

This study integrates satellite remote sensing observations, reanalysis data, ground-based air quality observations, synoptic charts, and a Lagrangian particle dispersion model to analyze the three-dimensional structure and transport mechanisms of the severe East Asian dust event from 19 to 23 March 2023. A long-term diagnostic module is further used to place the event within the 2000–2024 spring dust background. Throughout this study, “dust loading” refers specifically to the column-integrated dust mass (MERRA-2 DUCMASS) used in the long-term 2000–2024 analysis; “dust concentration” refers to a mass concentration at a specific level, either the ground-based PM10 observations or the near-surface FLEXPART-WRF output used in the event-scale analysis; and “dust activity” is used as a general, non-quantitative term for the overall occurrence and intensity of dust emission and transport processes.

2.1. Study Area

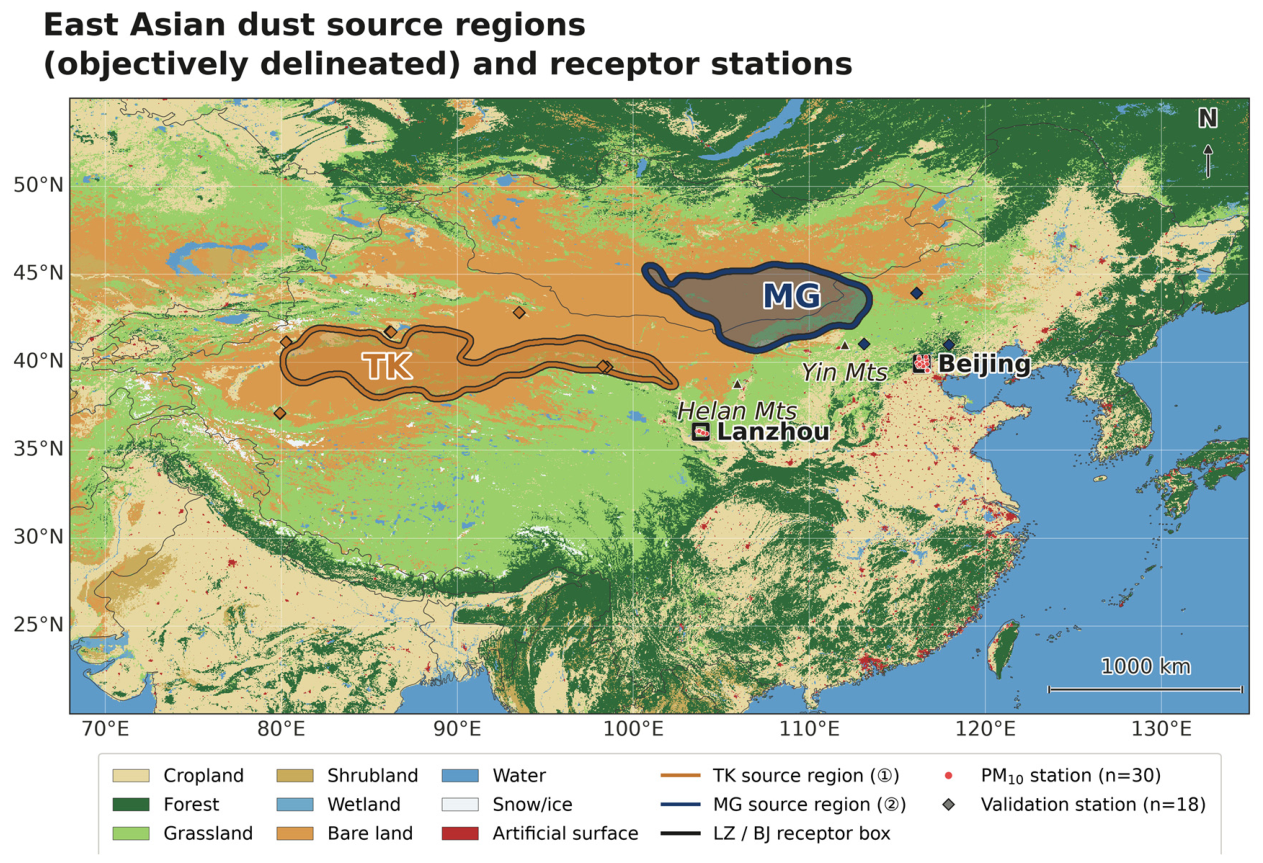
The study area is located in East Asia and includes mainly China, Japan, South Korea, North Korea, and Mongolia, with a geographical extent of approximately 70–140° E and 15–55° N. Because dust emission is strongly influenced by surface characteristics, this study focuses on the northern part of East Asia where vegetation is sparse and deserts, bare land, and grasslands are widespread. The Taklamakan Desert (TK) and the Mongolian Plateau (MG) were selected as the two primary dust source regions, and Lanzhou (LZ) and Beijing (BJ) were selected as representative downstream receptor areas (Figure 1).

2.2. Event-Scale Remote Sensing, Air Quality, and Meteorological Data

The horizontal distribution of dust was analyzed using the light absorbing aerosol index (AAI) derived from TROPOspheric Monitoring Instrument (TROPOMI) observations under the EU Copernicus program. The daily averaged AAI product, with a spatial resolution of approximately 0.25° × 0.25°, was used to identify absorbing dust plumes and examine their transport pathways. AAI values greater than 0.5 were used as an event-scale dust indication threshold, within the range (0.5–0.7) used for dust identification in other regional AAI-based studies [52]; this threshold was tested for sensitivity over the range 0.3–0.7, and the resulting daily dust-affected-area time series were highly correlated across this range (Pearson r = 0.73–0.96), with the date of maximum dust extent varying by at most one day, indicating the event-scale results are not sensitive to the specific threshold value within this range (Supplementary Figure S2). Because AAI is not a direct mass concentration, it was interpreted together with PM10, CALIPSO, CAMS EAC4, and FLEXPART-WRF results.
Ground PM10 observations were obtained from the official air quality monitoring network of the Ministry of Ecology and Environment of China and were used to evaluate near-surface dust impacts and downstream concentration gradients. The diagnosis of meteorological conditions was based on ERA5 reanalysis data from the European Centre for Medium-Range Weather Forecasts (ECMWF), including geopotential height, temperature, humidity, and wind fields at the 500 hPa and 700 hPa levels. Sea-level pressure charts were used to diagnose surface frontal systems and cyclone evolution.
Vertical structure analysis employed Level 2 CALIPSO/CALIOP products, including 532 nm backscatter coefficient, color ratio (1064 nm/532 nm), 532 nm depolarization ratio, and the vertical feature mask (VFM) [38,53]. CALIPSO overpasses during 19–23 March 2023 were screened, with emphasis on profiles that intersected the active dust plume or its downstream transport corridor.

2.3. CAMS EAC4 and FLEXPART-WRF Simulations

The Copernicus Atmosphere Monitoring Service (CAMS) global reanalysis (EAC4) product was used as an independent dust-field consistency check. CAMS EAC4 has a horizontal resolution of 0.4° × 0.4°, 137 vertical layers, and hourly temporal resolution. Dust mixing ratios from the three dust size bins (aermr04, aermr05, and aermr06) were summed and converted to mass concentration using air density, providing a reanalysis-based field for comparing surface and vertical dust structures.
The meteorological fields driving FLEXPART-WRF were produced by an ERA5-nudged WRF simulation with a nested configuration (outer domain 27 km, inner domain 9 km, 35 vertical levels, one-way nesting with no feedback between the two domains); FLEXPART-WRF was driven only by the 27 km outer-domain fields, while the 9 km inner-domain fields were used separately for the terrain diagnostics in Section 3.5. The driving WRF simulation used the WSM6 microphysics scheme, the Yonsei University (YSU) planetary boundary layer scheme with the revised MM5 Monin-Obukhov surface layer scheme, the Noah land-surface model, the Kain-Fritsch cumulus scheme (outer 27 km domain only; convection was treated explicitly on the convection-permitting 9 km inner domain), and the CAM longwave/shortwave radiation scheme, forced at the lateral boundaries by ERA5 (6-hourly) with grid analysis nudging and no additional data assimilation.
FLEXPART-WRF was used to conduct forward dispersion simulations from the two source regions and backward source-tracing simulations from the receptor regions, with particle concentration fields output hourly (3600 s output and averaging interval, 900 s sampling interval) on a 0.25° × 0.25° grid at five vertical levels (0–100, 100–500, 500–1000, 1000–2000, and 2000–5000 m AGL). The production forward configuration comprised 2517 release blocks (TK1: 656; TK2: 740; MG: 1121) totalling 644,199 particles; backward releases used 45 hourly blocks from Lanzhou and 21 from Beijing, each releasing 10,000 particles. Dust was treated as a chemically inert tracer species: no radioactive decay was applied, and Henry’s-law dissolution was not applicable to this particulate species. Particle diameter was set to 1.3 μm (log-normal size distribution, sigma = 2.0) and density to 2600 kg/m3. Below-cloud wet scavenging used coefficients A = 5.0 × 10⁻⁶ and B = 0.80; dry deposition was computed internally from these particle properties via FLEXPART-WRF’s standard particle resistance scheme, driven by WRF-derived friction velocity and atmospheric stability, rather than a prescribed fixed deposition velocity. Subgrid terrain effects were disabled at the particle-transport level (LSUBGRID = 0), because vertical transport is already resolved by the 27 km wind field and boundary-layer scheme; boundary-layer turbulence was represented using FLEXPART-WRF’s standard turbulence parameterization (TURB_OPTION = 1), with WRF-derived land use (LU_OPTION = 1) and snapshot (instantaneous) driving winds (WIND_OPTION = 0). Source regions for TK and MG were delineated objectively from Himawari-9 dust-detection frequency during the event, rather than prescribed as manual boxes: the 90% cumulative-emission-frequency contour was Gaussian-smoothed (50 km) and filtered by connected-component area (retaining components >5000 km2), yielding two natural source regions (TK: 80.1–102.4 E, 37.9–41.9 N, 548 erodible grid cells; MG: 100.7–113.4 E, 40.7–45.5 N, 408 cells). Within TK, an along-basin width discontinuity at 90 E was used to separate the Tarim Basin sub-source (TK1) from the Hexi Corridor sub-source (TK2). Release timing followed an hourly, per-grid-cell emission schedule over an extended emission window with region-spread release points, identified from hourly Himawari-9 split-window brightness-temperature dust detection combined with a WRF 10 m wind-speed threshold (>8 m/s; the resulting emission timing was robust to this threshold in sensitivity tests spanning 6–10 m/s) and a bare-land, low-slope (<20 m/km) surface mask. Particle release heights for each release block were set directly from the Himawari-9 brightness-temperature-retrieved dust-top height for the corresponding source region and time (release layer: 0 m to the retrieved height; e.g., for MG the retrieved height has a median of 1909 m, interquartile range 1684–2075 m, across 147,895 pixels), rather than a fixed near-surface release; this retrieval was independently cross-validated against the CALIOP-observed dust-layer top height (median 1780 m, interquartile range 774–2293 m, across 283 layers), with a median difference of about 7%.
FLEXPART-WRF was used to conduct forward dispersion simulations from the two source regions and backward source-tracing simulations from the receptor regions. The forward simulations were used to reconstruct source-dependent pathway evolution and to derive quantitative source contributions (Section 3.3), and the backward simulations were used to independently confirm the dominant source-receptor linkages. Particle concentration fields were output hourly (3600 s output and averaging interval, 900 s sampling interval) on a 0.25 × 0.25 degree grid at five vertical levels (0–100, 100–500, 500–1000, 1000–2000, and 2000–5000 m AGL) for comparison with satellite and ground-based observations. The meteorological fields driving FLEXPART-WRF were produced using ERA5-nudged WRF (grid analysis nudging) with a nested configuration (outer domain 27 km, inner domain 9 km); FLEXPART-WRF was driven only by the 27 km outer-domain fields, while the 9 km inner-domain fields were used separately for the terrain diagnostics in Section 3.5. The driving WRF simulation (35 vertical levels, one-way nesting with no feedback between the two domains) used the WSM6 microphysics scheme, the Yonsei University (YSU) planetary boundary layer scheme with the revised MM5 Monin-Obukhov surface layer scheme, the Noah land-surface model, the Kain-Fritsch cumulus scheme (outer 27 km domain only; convection treated explicitly on the convection-permitting 9 km inner domain), and the CAM longwave/shortwave radiation scheme, forced at the lateral boundaries by ERA5 (6-hourly) with grid analysis nudging and no additional data assimilation. Subgrid terrain effects were disabled at the particle-transport level (LSUBGRID = 0) because vertical transport is already resolved by the 27 km wind field and boundary-layer scheme; PBL turbulence was represented using FLEXPART-WRF’s standard turbulence parameterization (TURB_OPTION = 1) with WRF-derived land use (LU_OPTION = 1) and snapshot (instantaneous) driving winds (WIND_OPTION = 0).
Source regions for TK and MG were delineated objectively from Himawari-9 dust-detection frequency during the event, rather than prescribed as manual boxes: the 90% cumulative-emission-frequency contour was Gaussian-smoothed (50 km) and filtered by connected-component area (retaining components >5000 km2), yielding two natural source regions (TK: 80.1–102.4 E, 37.9–41.9 N, 548 erodible grid cells; MG: 100.7–113.4 E, 40.7–45.5 N, 408 cells). Within TK, an along-basin width discontinuity at 90 E was used to separate the Tarim Basin sub-source (TK1) from the Hexi Corridor sub-source (TK2). Release timing followed an hourly, per-grid-cell emission schedule over an extended emission window with region-spread release points, identified from hourly Himawari-9 split-window brightness-temperature dust detection combined with a WRF 10 m wind-speed threshold (>8 m/s; the resulting emission timing was robust to this threshold in sensitivity tests spanning 6–10 m/s) and a bare-land, low-slope (<20 m/km) surface mask. The production forward configuration comprised 2517 release blocks (TK1: 656; TK2: 740; MG: 1121) totalling 644,199 particles.
Particle release height for each block was set directly from the Himawari-9 brightness-temperature-retrieved dust-top height for that source region and time (release layer 0 m to the retrieved height; e.g., for MG, median retrieved height 1909 m, interquartile range 1684–2075 m across n = 147,895 pixels), rather than a fixed near-surface release; this retrieval was independently cross-validated against the CALIOP-observed dust-layer-top height (median 1780 m, interquartile range 774–2293 m across n = 283 layers), giving a median difference of about 7%. Particles were assigned a diameter of 1.3 μm (log-normal size distribution, sigma = 2.0) and a density of 2600 kg/m3. Wet scavenging used below-cloud coefficients A = 5.0 × 10⁻⁶ and B = 0.80; dry deposition velocity, radioactive decay, and Henry’s law dissolution were not applied to the dust species (appropriate for the sub-2-day transport timescales considered here).
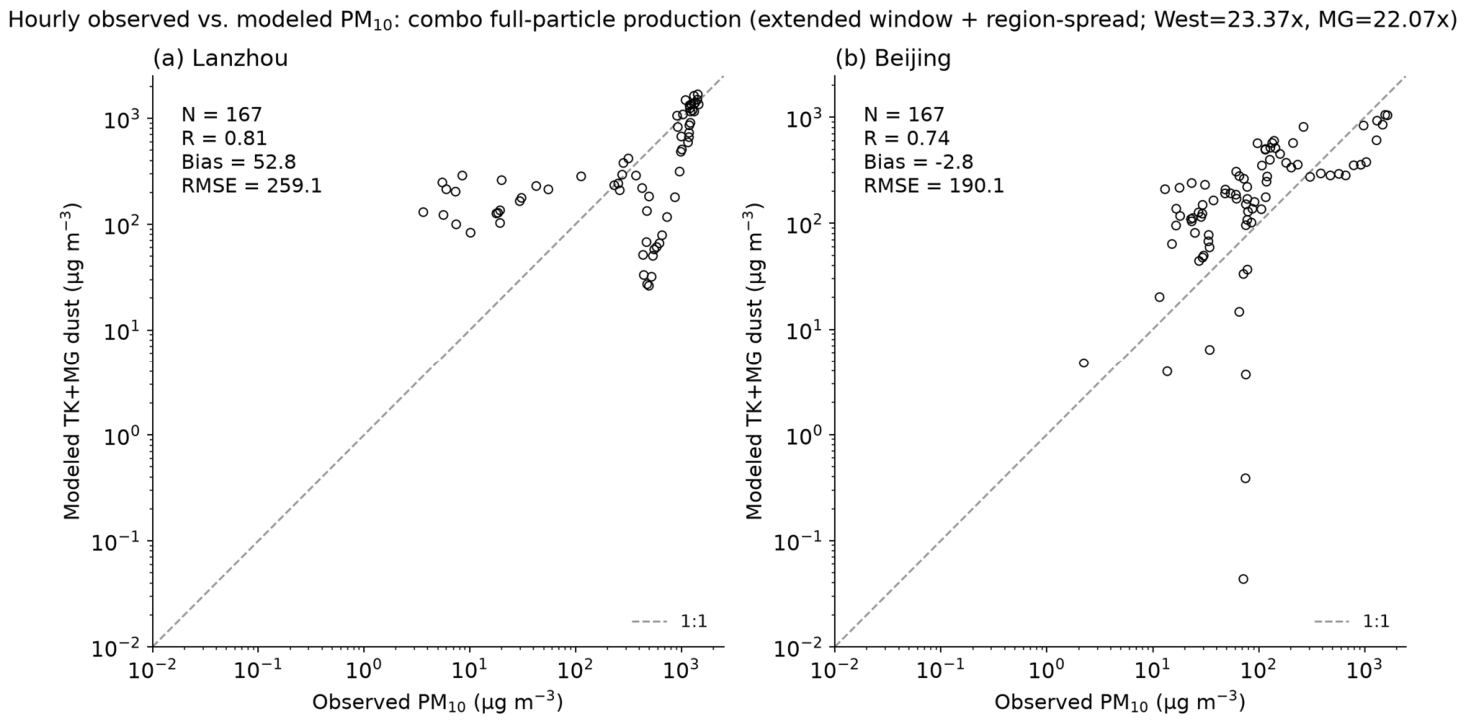
Mass-calibration coefficients linking simulated particle mass to observed PM10 were derived by an L2 (ordinary least-squares) fit: for each pathway, the coefficient minimizing the sum of squared differences between the calibrated simulated series and observed PM10 at that pathway’s dominant receptor was solved directly (coefficient = sum(raw × obs)/sum(raw2)), using the full-particle production configuration described above. This gave calibration coefficients of 23.37× for the west (TK) pathway (fit at Lanzhou) and 22.07× for MG (fit at Beijing). Applied jointly to both receptors, this configuration reproduces the observed event-integrated PM10 mass closely at Beijing (mass ratio 0.98) and to within a factor of 1.2 at Lanzhou (mass ratio 1.22), with Pearson correlations of R = 0.81 (Lanzhou) and R = 0.74 (Beijing) against observed PM10 (Section 3.3.4).

2.4. Long-Term Spring Dust Variability Analysis

To strengthen the event-scale interpretation, spring (March–May) dust activity from 2000 to 2024 was represented using MERRA-2 dust column mass concentration (DUCMASS) as the primary dust-loading variable (Table 1). Multi-Angle Implementation of Atmospheric Correction (MAIAC) aerosol optical depth (AOD) was used as an independent aerosol-consistency check rather than as a dust-only index because AOD can include mixed anthropogenic and natural aerosols. Meteorological and land-surface drivers for this long-term climatological analysis included 850 hPa wind speed (distinct from the 500/700 hPa levels used for event-scale synoptic diagnosis in Section 3.2), 10 m wind speed, precipitation, surface temperature, 0–10 cm soil moisture, surface evaporation, and the normalized difference vegetation index (NDVI). All variables were clipped to the East Asian study domain and aggregated to spring means on a common analysis grid. Missing and abnormal values were excluded from pixel-wise statistics and domain averages.
For each year i, the spring dust index DI_i was defined as the March–May mean of daily DUCMASS. To evaluate index stability, an additional standardized composite test index was constructed from DUCMASS and MAIAC AOD; the consistency between this composite index and the primary DUCMASS-based index DI_i was then assessed using their regional interannual Pearson correlation coefficient (referred to below as the consistency test). Pixel-wise trends were estimated using the Theil-Sen slope, and statistical significance was evaluated using the Mann-Kendall test. Pearson and partial correlations (Pearson correlations recomputed after statistically removing the linear effect of the other covarying drivers) were used to distinguish direct bivariate relationships from relationships that persisted after controlling for covarying factors. A random forest classifier [54] (an ensemble of decorrelated decision trees; variable importance assessed via permutation, i.e., the drop in classification skill when a variable’s values are randomly shuffled) was also used as a diagnostic tool for identifying high-dust conditions, with the 75th percentile of DUCMASS during the training period as the high-dust threshold. The model was trained on 2000–2019 and evaluated on 2020–2024 to reduce skill inflation caused by random temporal mixing.

3. Results

3.1. Long-Term Spring Dust Background and Event Rationale

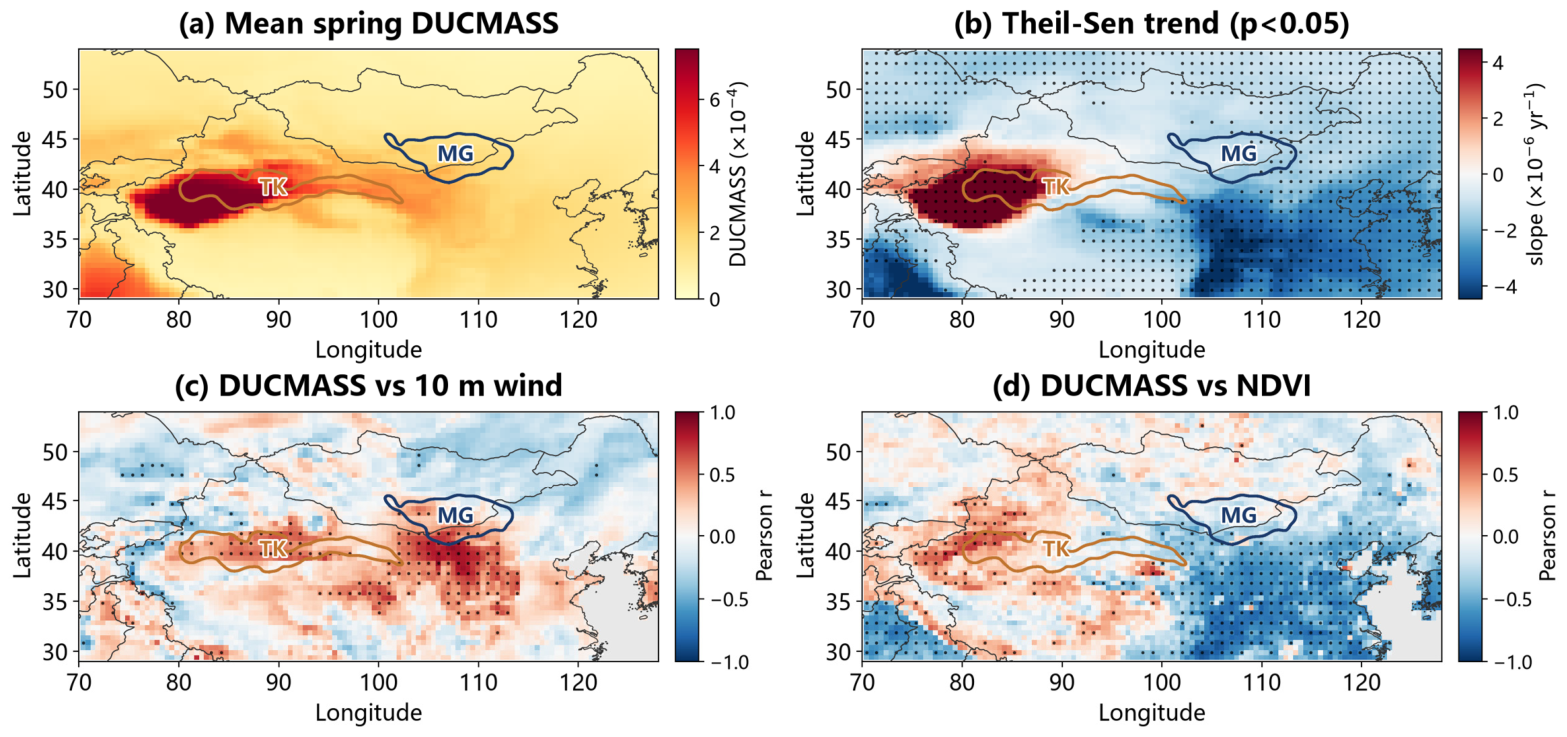
The long-term analysis indicates that the March 2023 event occurred within an East Asian spring dust regime that has generally weakened since 2000. Using DUCMASS as the primary dust-loading index, the domain-mean Theil-Sen trend was −1.07 × 10⁻⁶ yr−1 and the median trend was −1.06 × 10⁻⁶ yr−1; approximately 61.87% of valid pixels showed a significant monotonic trend according to the Mann-Kendall test. This broad decline is consistent with an increase in NDVI and changes in wind and land-surface moisture conditions, but it does not preclude episodic extremes when strong synoptic forcing is superimposed on active source regions (Figure 2; Table 2).
The consistency test between the DUCMASS-based dust index and the DUCMASS-MAIAC AOD composite index produced a regional interannual correlation coefficient of 0.79, black dots indicate p < 0.05. This supports the use of DUCMASS as the primary dust-loading index while treating AOD as an independent aerosol consistency check. Partial-correlation diagnostics show that MAIAC AOD remains positively related to DUCMASS, while NDVI and surface evaporation show negative relationships with DUCMASS, supporting the interpretation that both aerosol transport/mixing and land-surface stability affect dust variability. Random forest diagnostics further identify surface temperature, NDVI, and 850 hPa wind speed as important variables for high-dust conditions, suggesting that strong events are jointly controlled by thermal, land-surface, and dynamic factors (Table 3).

3.2. Meteorological Conditions Supporting Dual-Source Synergy

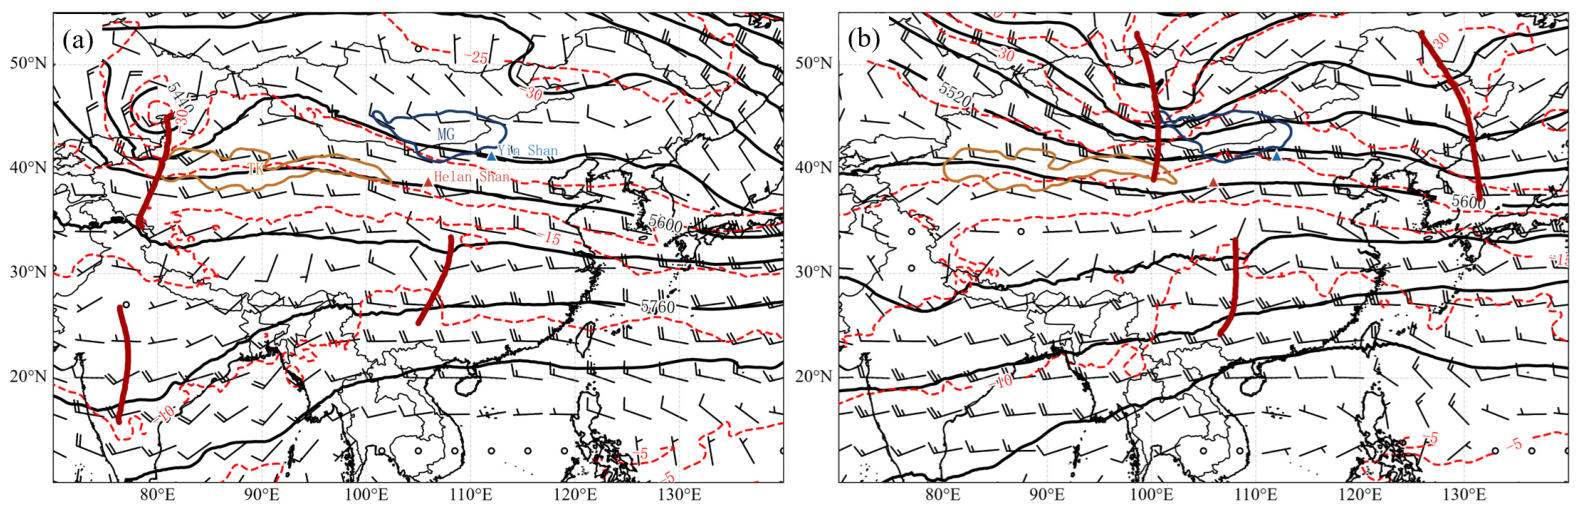
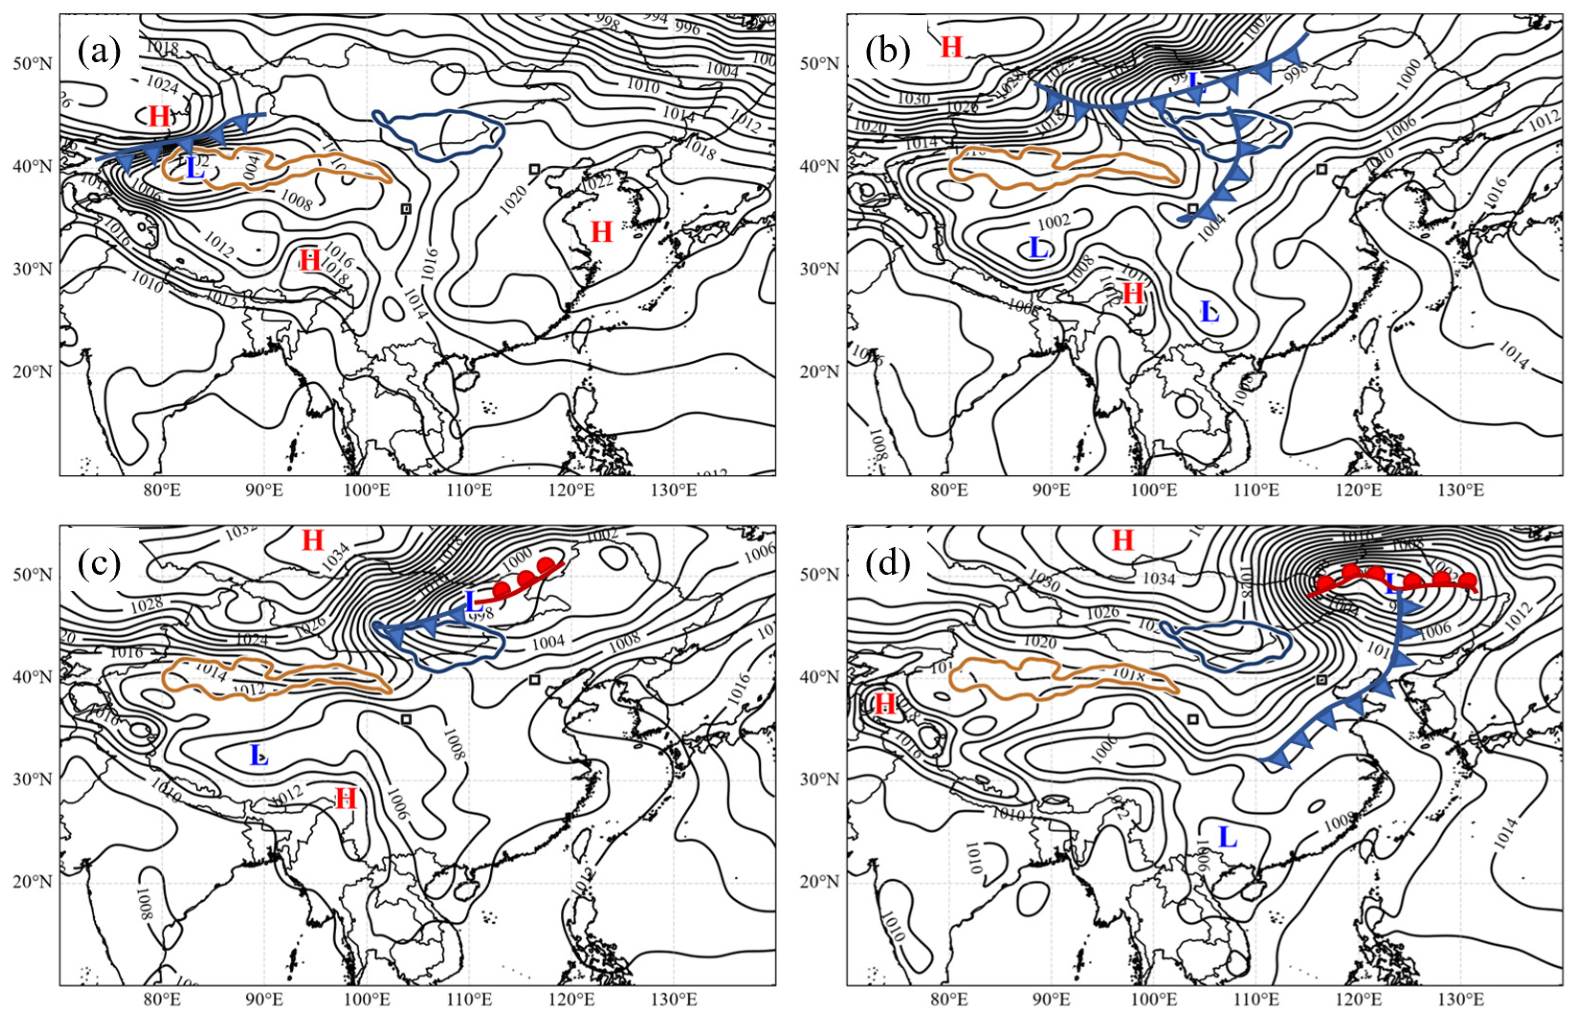
On 19 March 2023, the 500 hPa circulation field showed a pronounced cold vortex north of the Taklamakan Desert (TK), with marked cold advection in the trough region (Figure 3a). This configuration favored the maintenance and development of the cold vortex, providing sustained dynamical lifting and a favorable background circulation for downstream transport. At 700 hPa, a cyclonic circulation appeared on the east side of the 500 hPa cold vortex, indicating a deep baroclinic system that tilted westward (upstream) with height. The cyclonic circulation over TK, together with strong pre-trough ascent and a pronounced wind-speed gradient, jointly lofted surface dust above the boundary layer. The synoptic evolution exhibited a clear source-dependent temporal sequence: on this day, the corresponding low-tropospheric cyclonic circulation and frontal pressure gradient likewise favored the lofting of TK dust (Figure 4a). On 21 March, the 500 hPa circulation field showed a deep upper-level trough over Mongolia, accompanied by strong cold-air activity behind the trough. At 700 hPa, the corresponding region was characterized by a developing low-pressure system and a pronounced wind-speed maximum: ERA5 reanalysis shows 700 hPa wind speeds locally exceeding 30 m/s (>60 km/h) over southern Mongolia and the adjacent Gobi on 21 March 2023, well above the underlying 850 hPa (~20–25 m/s) and 925 hPa (~13–17 m/s) wind speeds at the same time and location. Through boundary-layer turbulent mixing, this enhanced 700 hPa flow strengthened near-surface wind speed and triggered dust emission over Mongolia, providing a second dust plume from this later-activated source region (Figure 3b). At 00:00 UTC on 22 March, the surface chart showed a distinct frontal cyclone over Northeast China, its cold front oriented northeast-southwest and extending southwestward toward Shaanxi, closely matching the outer boundary of dust distribution over North China (Figure 4c,d), by which time the Mongolian plume had converged with the earlier Taklamakan plume there.
At 00:00 UTC on 19 March, the near-surface weather chart showed TK under the control of a low-pressure system, with a cold high-pressure system to its north; the pressure gradient between the two systems was strong. A cold front lay ahead of the low-pressure system, aligned along the southern flank of the high-pressure system; over the following hours, as the high-pressure system developed and expanded southeastward, the front itself also advanced southeastward—a distinct process from the easterly flow along the southern flank of the high itself. Near-surface wind speeds increased markedly before and after frontal passage, and the combined effects of cold-air intrusion and frontal lifting provided the direct trigger for surface dust emission and initial transport. By 12:00 UTC on 20 March, the cold front had moved eastward to near Lanzhou, consistent with the arrival of dust in the Lanzhou area (Figure 4a,b). At 00:00 UTC on 21 March, a warm front appeared to the north of the cyclone. At 00:00 UTC on 22 March, the cold front advanced strongly southeastward and formed an occluded front. Mongolian dust was likewise dispersed onto the North China Plain as the front advanced.

3.3. Horizontal Distribution and FLEXPART Source-Receptor Evidence

3.3.1. Horizontal Distribution from TROPOMI AAI

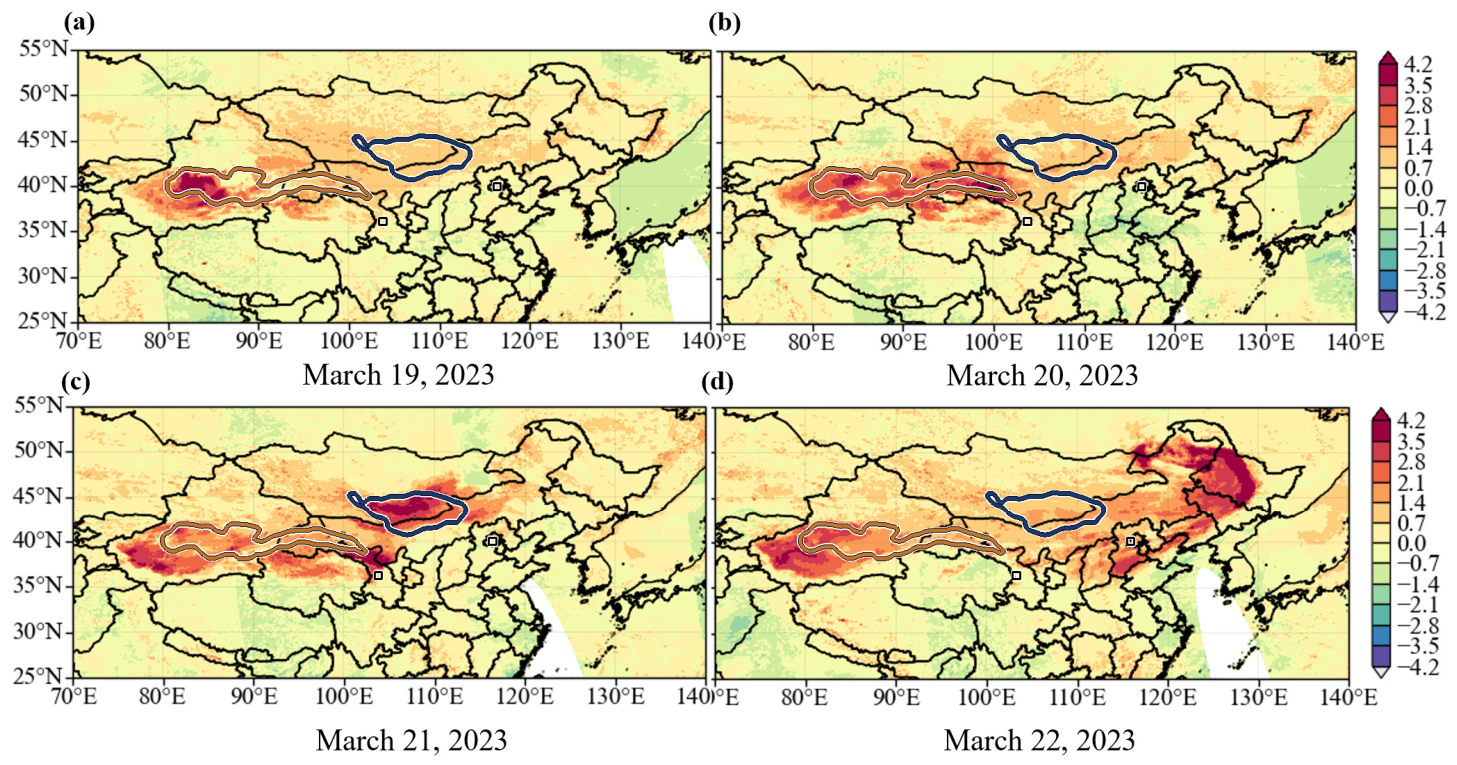
The severe East Asian dust event from 19 to 23 March 2023 was not driven by a single source. Instead, two major source regions—TK in southern Xinjiang and MG, particularly southern Mongolia and the adjacent Gobi—produced a relay-convergence pattern in both time and space, forming a typical dual-source convergence event. On 19 March, high AAI values first appeared over the Taklamakan Desert, with local maxima exceeding 2.5, marking the initial activation of the TK source. During 20–21 March, the TK plume was guided by northwesterly flow and expanded southeastward along the Hexi Corridor, with elevated AAI values extending across central Gansu, eastern Qinghai, and the Alxa region; around Lanzhou, AAI values reached approximately 1.8–2.2 on 21 March, consistent with the marked deterioration of local air quality. Meanwhile, a second high-AAI region developed over southern Mongolia on 21 March, with local values exceeding 2.0. On 22 March, the two plumes converged over North China under mid- to upper-level northwesterly airflow, where AAI values exceeded 3.0, before the dust body propagated eastward toward Northeast China and downstream coastal regions (Figure 5).
The AAI distribution also shows clear topographic modulation. Dust from TK, while being transported eastward toward the Loess Plateau, was affected by the blocking and guiding effects of the Guanshan, Longshan, Liupan, and Helan Mountains. In contrast, dust from MG, while moving southeastward, was forced to undergo vertical uplift and pathway adjustment due to the Yinshan, Daqingshan, and Yanshan mountain ranges, before continuing toward the North China Plain and Northeast China (Figure 5).

3.3.2. Backward Source-Tracing Evidence

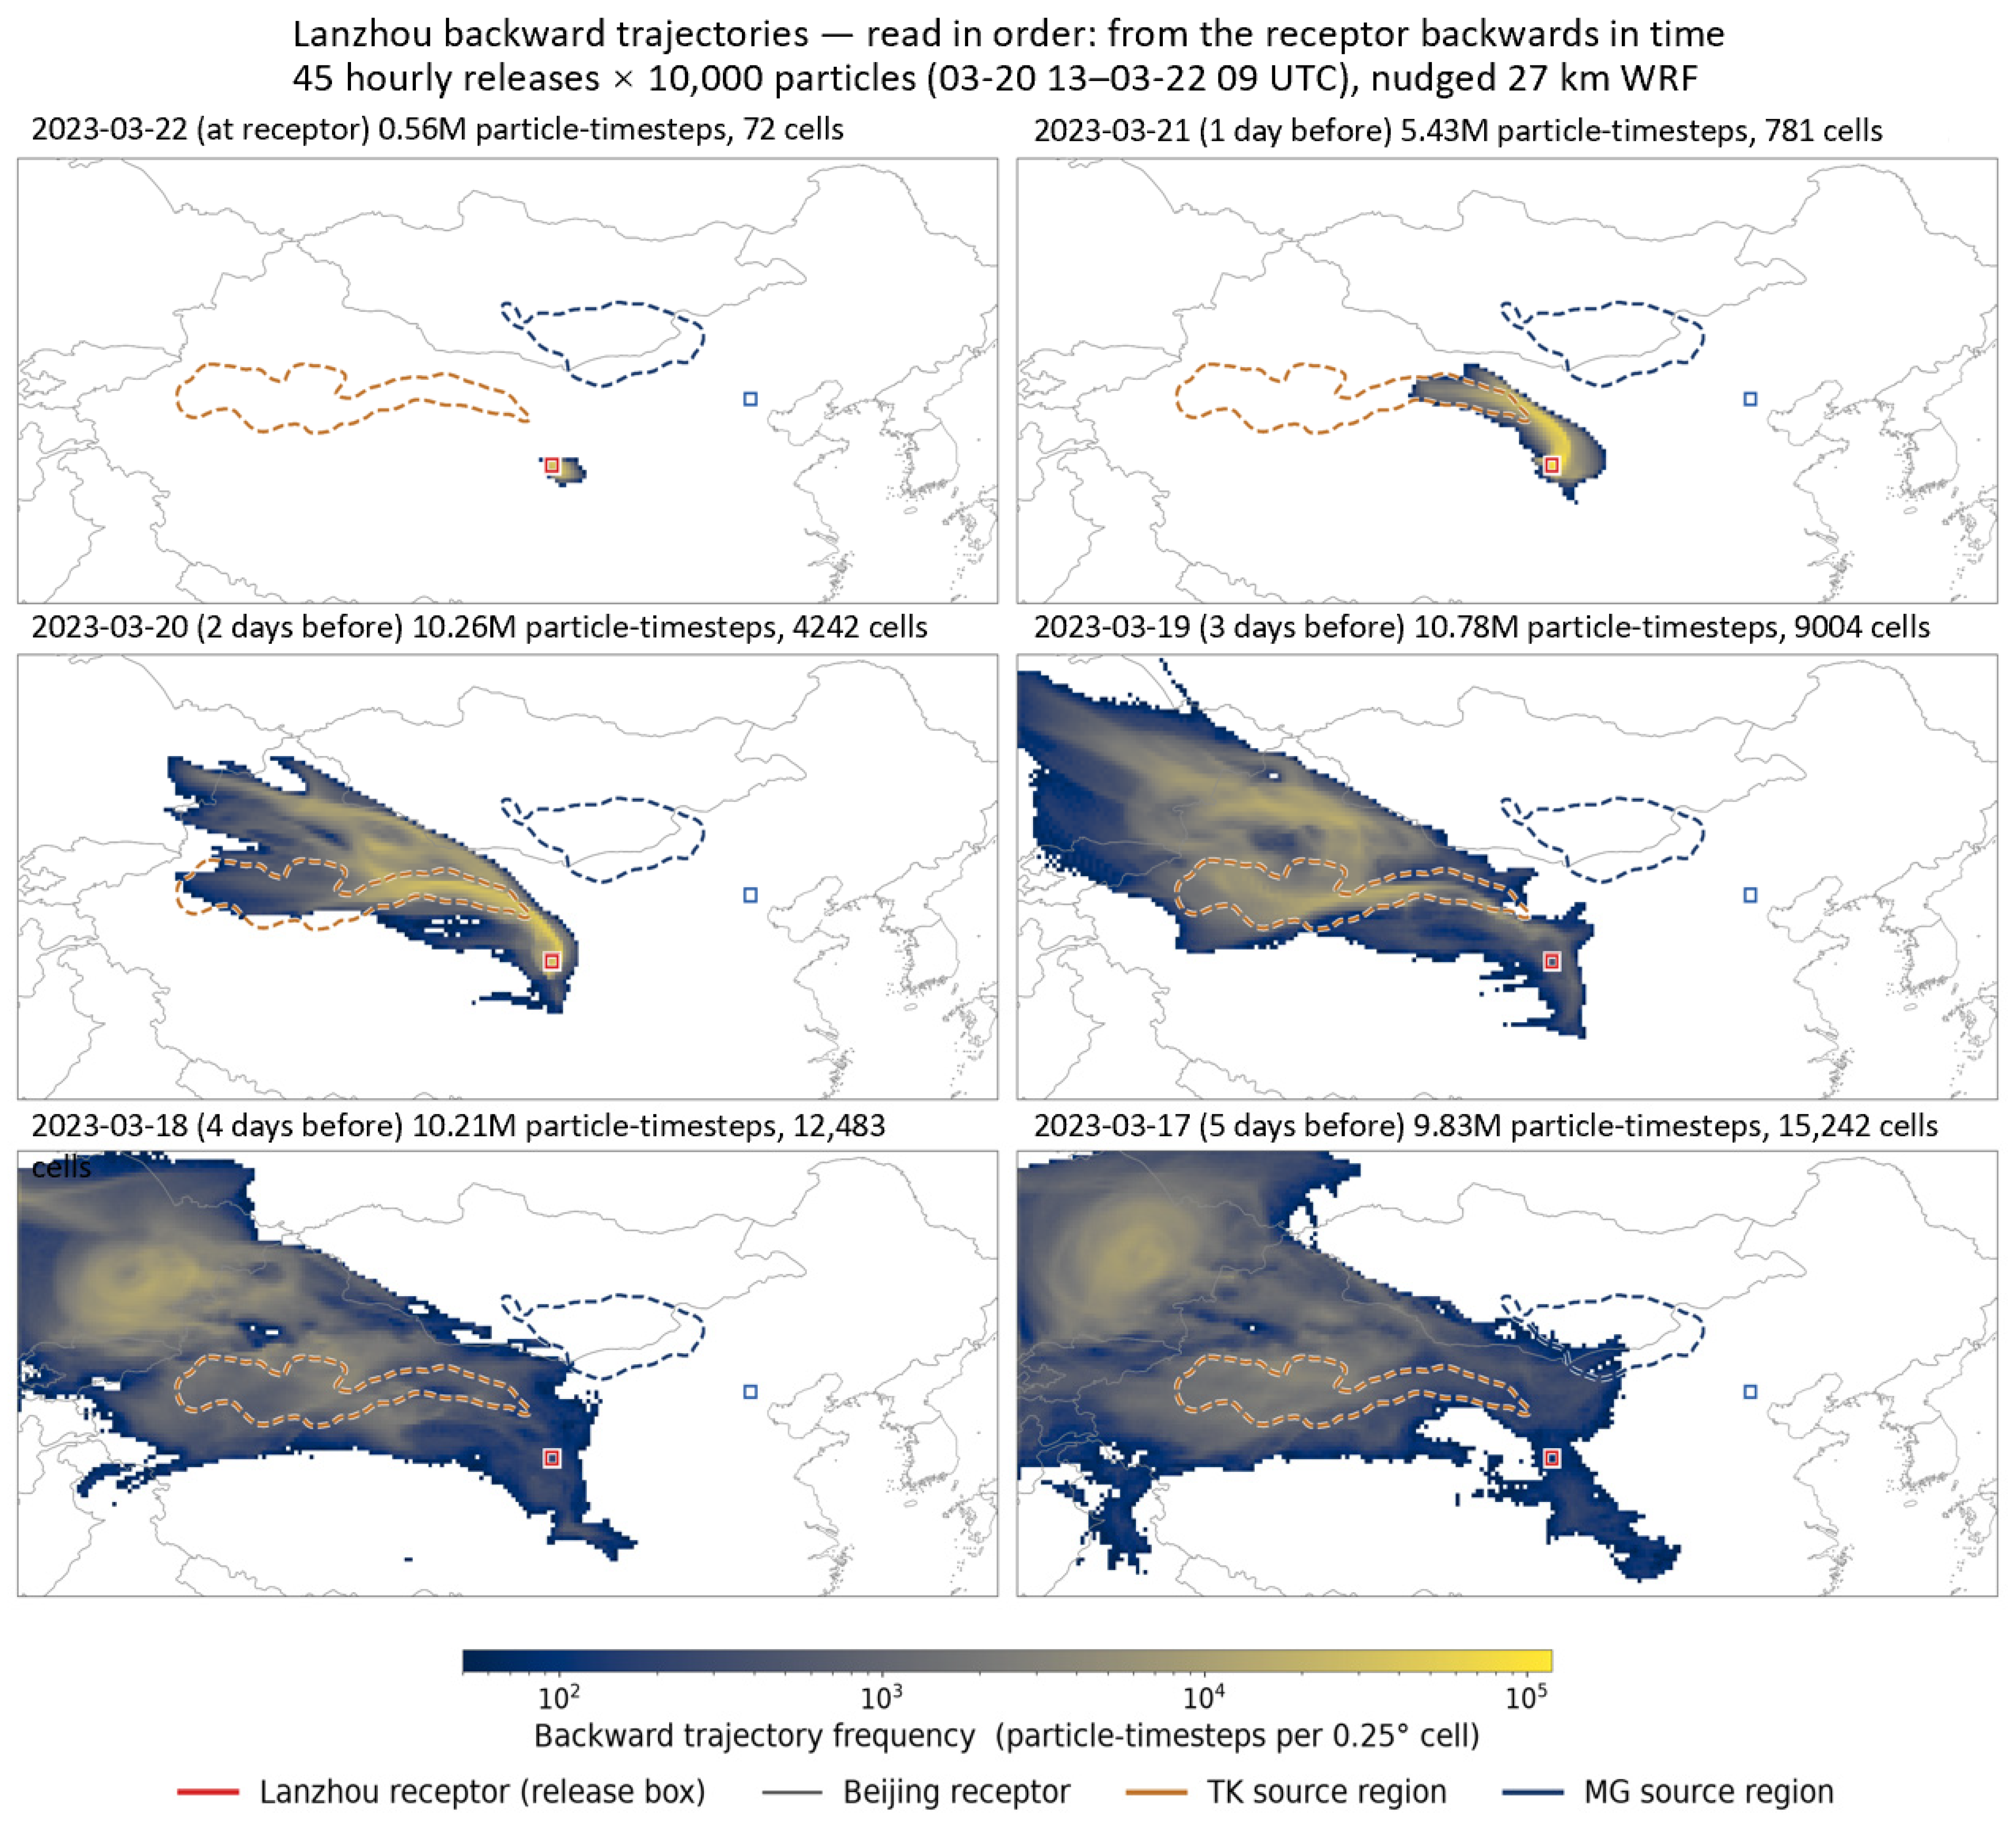
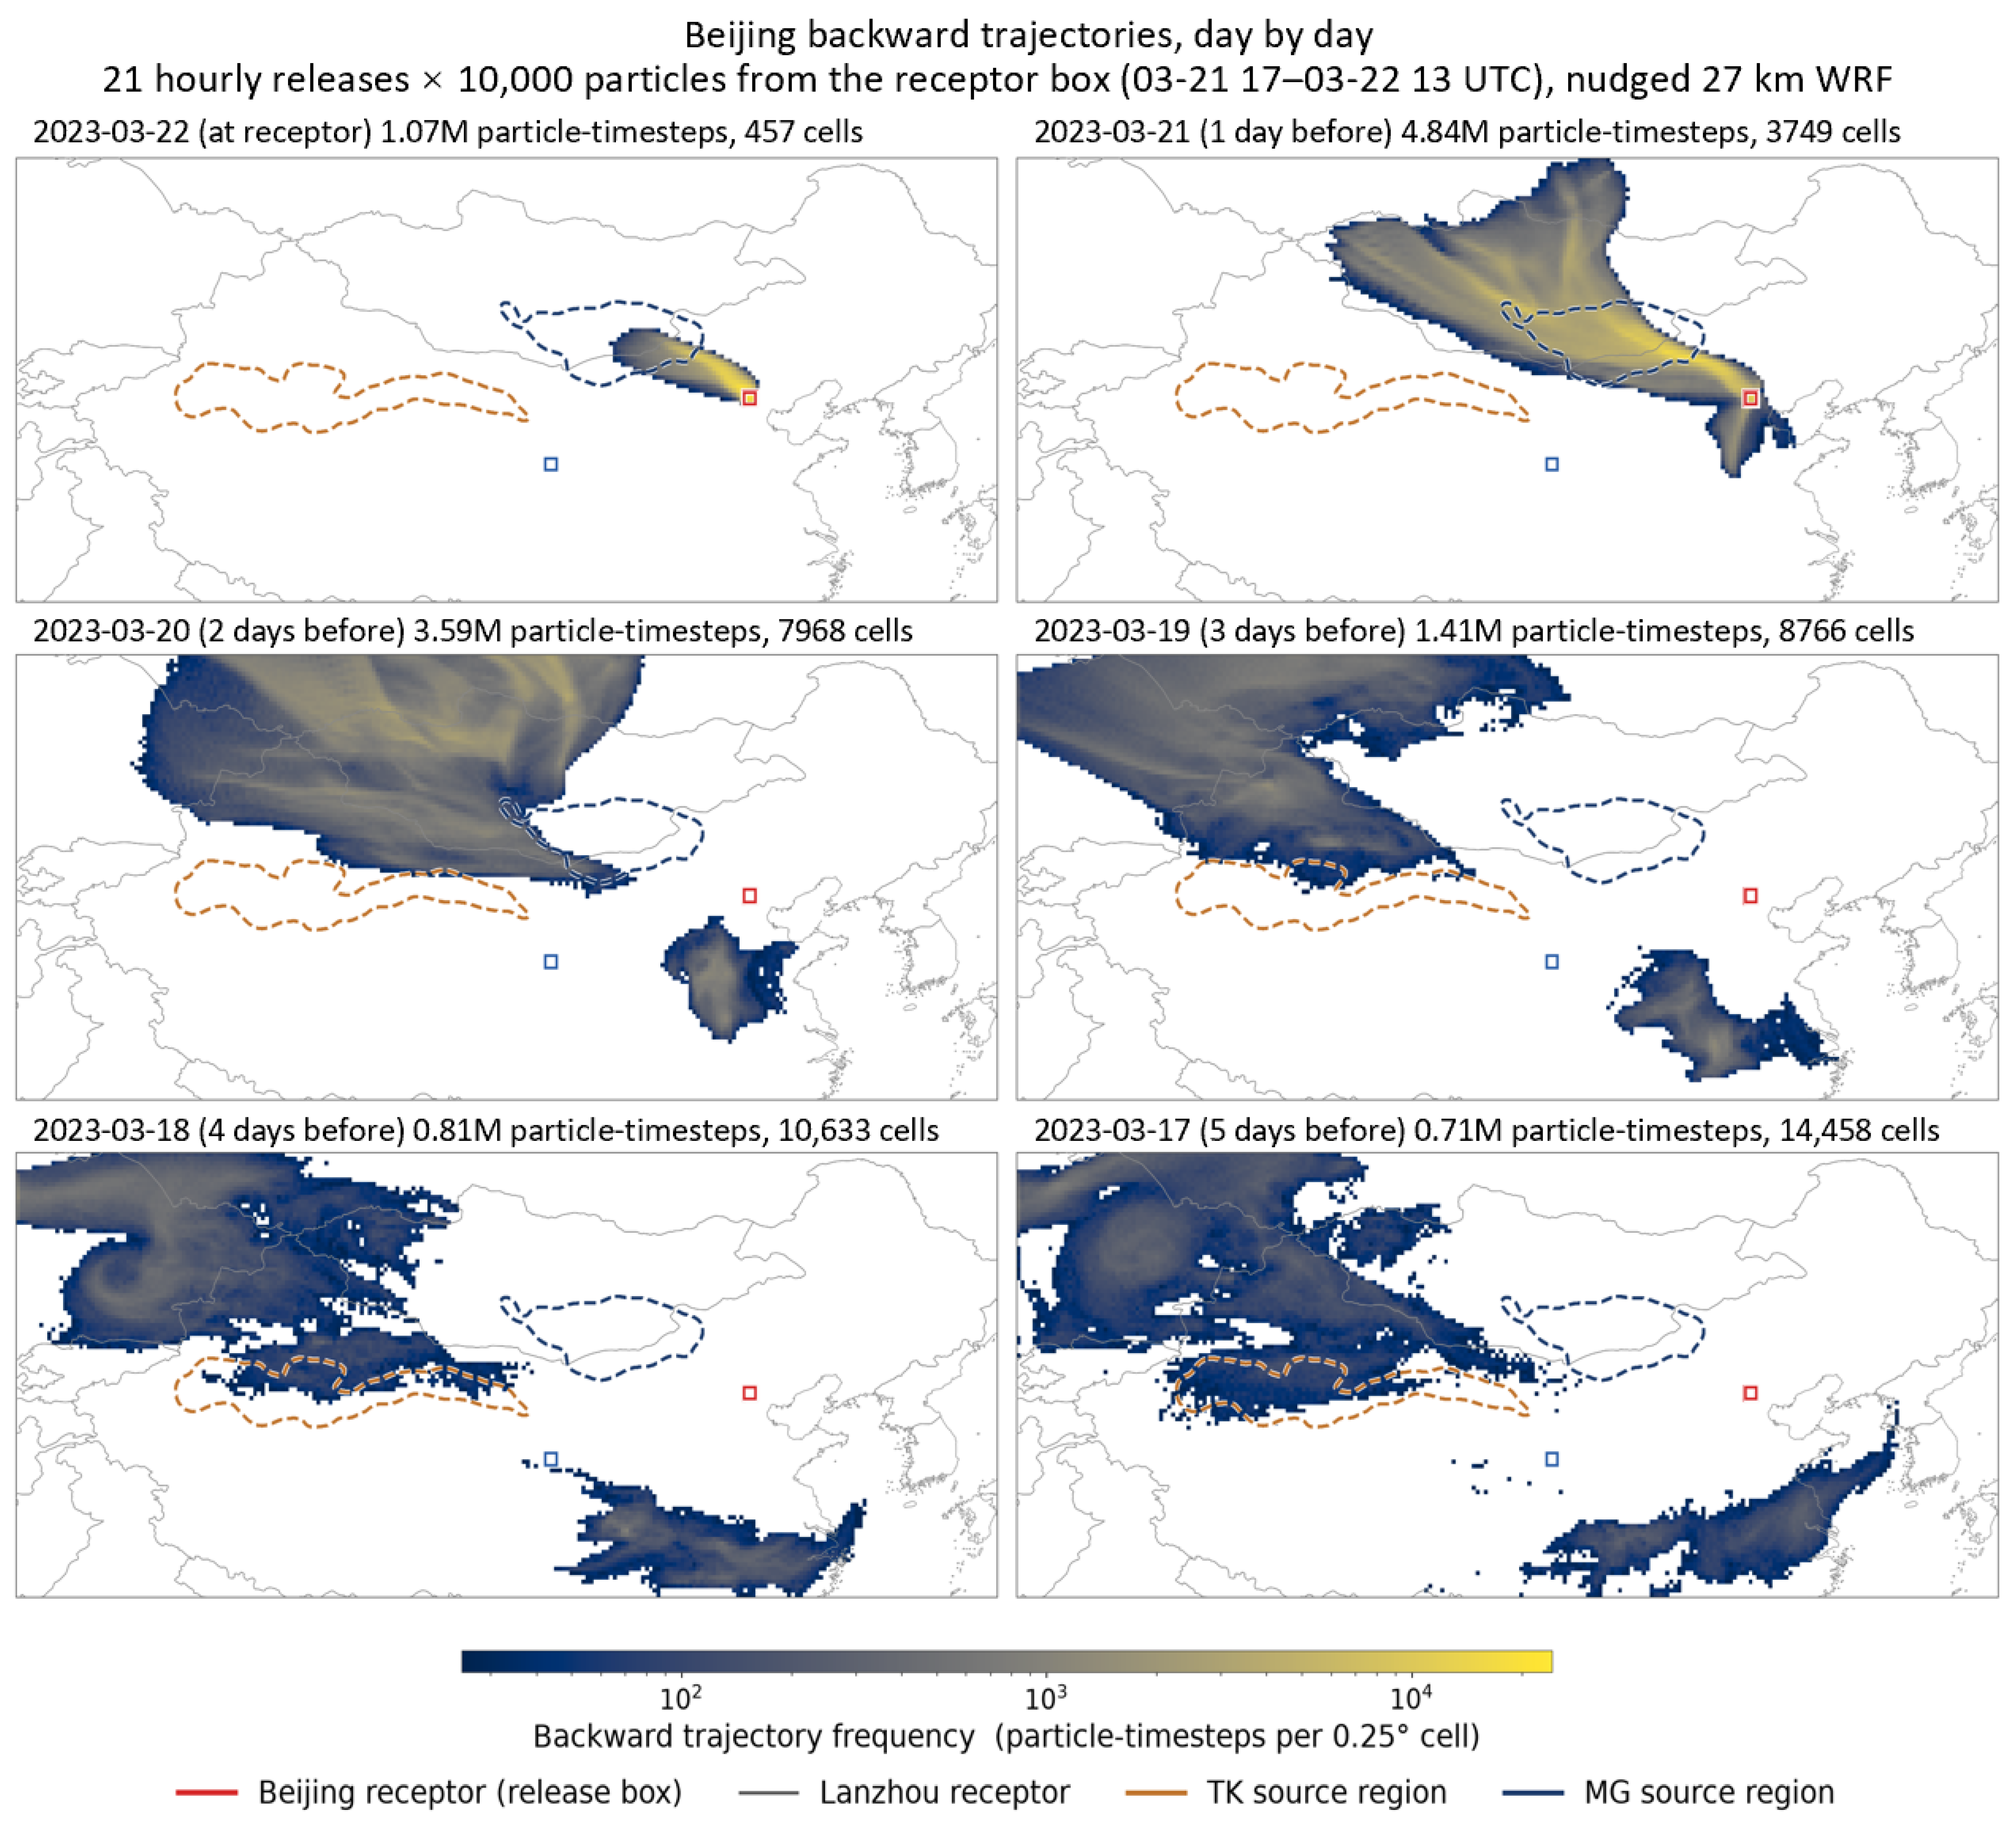
Receptor-centered backward dispersion frequency fields, computed from hourly-release backward trajectory arrays at each receptor (Figure 6 and Figure 7), show distinct source-receptor relationships for Lanzhou and Beijing. Lanzhou backward-run dispersion frequency, by day before arrival, traces a clear upstream pathway along the Hexi Corridor. Within Day 0–1, the high-frequency footprint remains concentrated close to the Lanzhou receptor, extending only a short distance northwestward into the corridor. By Day 1–2, the footprint has extended further along the Hexi Corridor and begins to overlap the eastern margin of the TK source region, consistent with the 1–2 day TK-to-Lanzhou transport time identified in the forward simulations. By Day 2–3, the high-frequency footprint is anchored over the TK source region itself, confirming TK as the dominant contributor to the Lanzhou dust episode; this dominance is sustained over a continuous 34-h window spanning the event peak (Section 3.3.4).
Beijing backward-run dispersion frequency, by day before arrival, shows a comparably systematic but faster upstream evolution than that for Lanzhou. Within Day 0–1, the high-frequency footprint remains concentrated close to the Beijing receptor and immediate North China. By Day 1–2, the footprint has already extended back into the MG source region in southern Mongolia, consistent with the rapid MG-to-Beijing transport identified in the forward dispersion fields. By Day 2–3, the footprint remains anchored over the MG source region, confirming that Beijing and North China were mainly influenced by MG dust during the peak stage; this dominance is sustained over a continuous 44-h window (Section 3.3.4). These two independent, receptor-centered views are mutually consistent with the forward dispersion frequency fields below.

3.3.3. FLEXPART-WRF Forward Dispersion

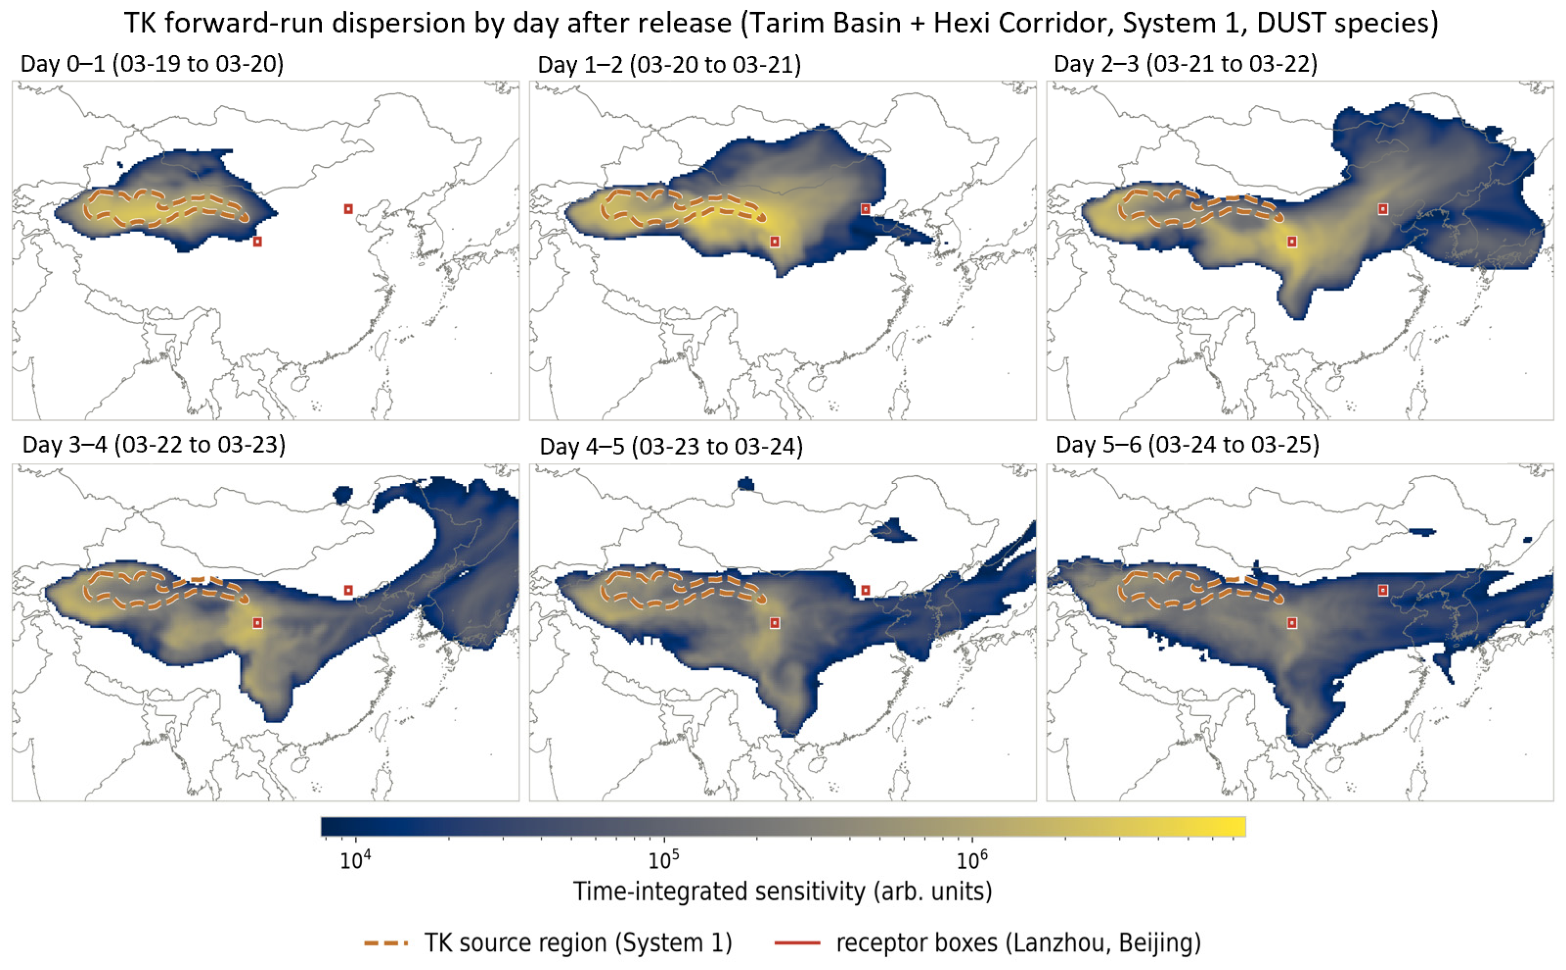
FLEXPART-WRF forward simulations support the dual-source transport interpretation. Under topographic steering and the influence of the cold vortex–trough system, TK dust was transported southeastward along the southern margins of the Tianshan Mountains and the Hexi Corridor (Figure 8); MG dust began to expand southeastward on 20 March, passing over Lanzhou and affecting most of North and Central China, and by 22 March had extended to East and South China, while the high-concentration zones remained located in North China throughout.
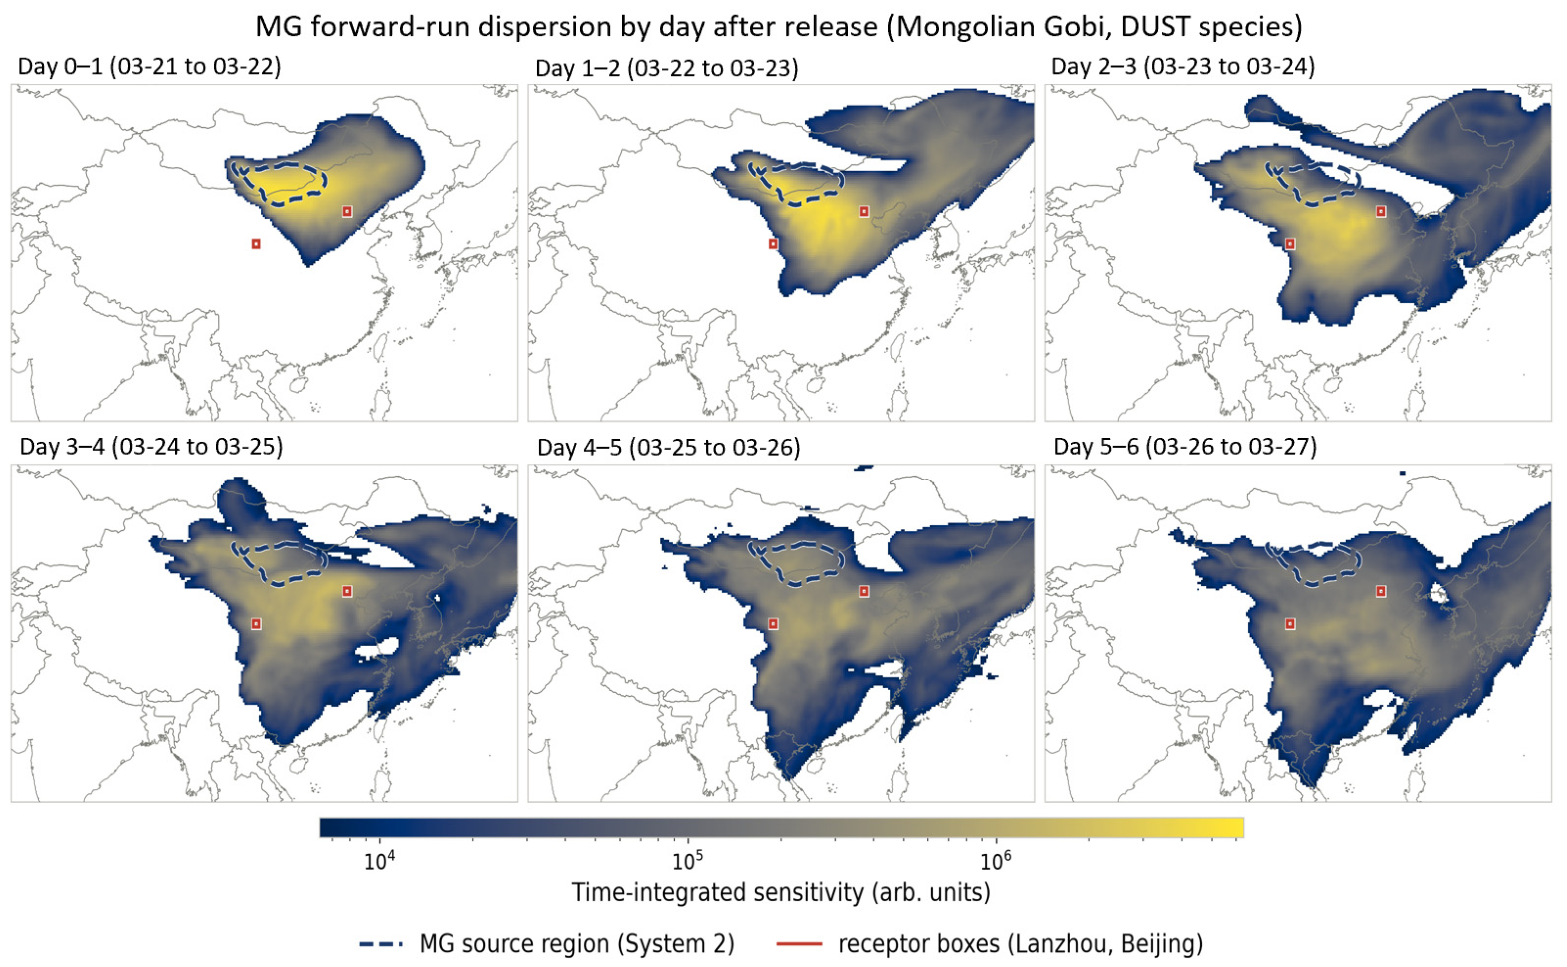
MG forward-run dispersion frequency, by day after release, shows a comparably systematic but faster evolution. Within Day 0–1, the plume remains concentrated close to the MG source region, elongating southeastward with a sharply defined leading edge. By Day 1–2, the high-sensitivity footprint has already expanded to envelop the Beijing receptor area and cover most of North China. By Day 2–3, the plume continues to broaden northeastward, extending toward the Korean Peninsula and the Sea of Japan while remaining anchored over North China. From Day 3–4 through Day 5–6, with emission from the source region having ended, the footprint continues to spread and diffuse across most of eastern China, and sensitivity over the source region itself declines steadily as no further particles are released there (Figure 9).
Forward dispersion frequency fields, computed from hourly-release trajectory arrays spanning the emission period (Figure 8 and Figure 9), further reveal source-dependent pathway differences. The TK plume’s high-frequency footprint progresses southeastward along the Hexi Corridor within 1–2 days, envelops Lanzhou, and reaches North China and the Bohai/Yellow Sea region by day 3–4. The MG plume’s high-frequency footprint envelops Beijing within 1 day and continues toward the Korean peninsula and Japan by day 2–3, while remaining outside the Lanzhou area throughout, consistent with MG’s negligible contribution there. Compared with TK dust, MG dust reached its receptor faster and produced a broader downstream footprint. Compared with TK dust, MG dust reached its receptor faster and produced a broader downstream footprint. These backward- and forward-trajectory source-receptor relationships are summarized in Table 4.

3.3.4. Quantitative Source Contribution and Model-Observation Comparison

These statistics indicate that the calibrated trajectory-array approach captures the temporal evolution of the dust episode with moderate-to-strong skill at both receptors, despite being calibrated independently to distinct source pathways. The contrasting bias signs—a positive mean bias at Lanzhou versus a near-zero mean bias at Beijing—suggest that the single least-squares calibration coefficient behaves differently depending on the shape of the local PM10 time series, consistent with the broader, more sustained Lanzhou episode versus the narrower Beijing spike discussed below. The larger absolute RMSE at Lanzhou, despite its higher correlation, likely reflects the larger dynamic range of the Lanzhou PM10 signal rather than a genuinely weaker fit, since RMSE scales with the magnitude of the underlying variability while R captures relative timing skill. Applying the production configuration (Section 2.3) to the full 19–25 March period, the calibrated forward simulations quantitatively reproduce the timing and, to first order, the magnitude of the observed PM10 evolution at each receptor (Figure 10). Hourly comparison against observed PM10 gives a Pearson correlation of R = 0.81 at Lanzhou and R = 0.74 at Beijing (N = 167 h each; mean bias +52.8 and −2.8 micrograms per cubic meter, RMSE 259.1 and 190.1 micrograms per cubic meter). These statistics indicate that the calibrated trajectory-array approach captures the temporal evolution of the dust episode with moderate-to-strong skill at both receptors, despite being calibrated independently to distinct source pathways. The contrasting bias signs—a positive mean bias at Lanzhou versus a near-zero mean bias at Beijing—suggest that the single least-squares calibration coefficient behaves differently depending on the shape of each receptor’s local time series. The larger absolute RMSE at Lanzhou, despite its higher correlation, likely reflects the larger dynamic range of the Lanzhou PM10 signal rather than a genuinely weaker fit, since RMSE scales with the magnitude of the underlying variability while R captures relative timing skill.
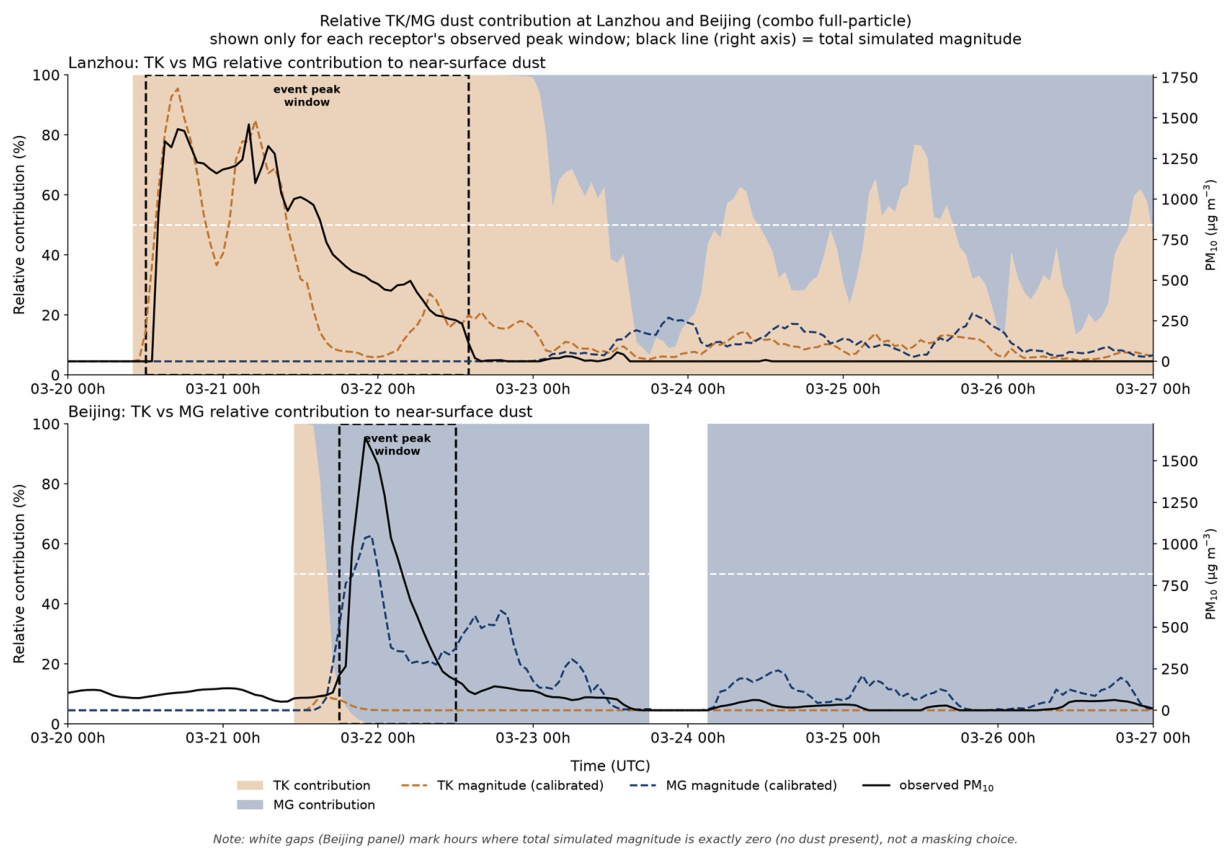
The event-integrated mass ratio is close to unity at both receptors (1.22 at Lanzhou, 0.98 at Beijing), and the coefficient of determination against the 1:1 line (R2 = 1 − SSres/SStot) is 0.64 at Lanzhou and 0.54 at Beijing. The instantaneous peak is matched closely at Lanzhou (peak ratio 1.15), with the simulated series closely tracking the observed peak shape, including good correspondence for all four distinct pulses identified during the dust-affected period, but underestimated at Beijing (peak ratio 0.64); because the calibration coefficients (23.37× for TK, 22.07× for MG; Section 2.3) were derived by least-squares fitting of the full hourly series rather than by matching the single peak value, the fit favors overall mass and timing agreement over exact reproduction of the single highest hour. This underestimation may also partly reflect the limited spatial extent of the release configuration and general simulation uncertainty, rather than the calibration trade-off alone; nonetheless, the calibrated series still captures the overall source attribution for Beijing well. Figure 11 places the calibrated TK and MG magnitude curves on the same time axis as observed PM10 over each receptor’s peak window; the TK/MG relative-contribution split (shaded areas) tracks the two receptors’ known dominant pathways throughout, confirming that the source attribution—TK dominant at Lanzhou, MG dominant at Beijing—is not affected by this peak-vs-mass calibration trade-off. Together, the two panels of Figure 11 provide a clear visual demonstration of how each source region differentially influences its associated receptor, offering an intuitive, at-a-glance summary of the dual-source relay-convergence pattern established throughout this study.
Figure 11 quantifies this source split. Integrated over each receptor’s observed peak window, TK accounts for effectively all of the calibrated near-surface dust mass at Lanzhou (100%, versus 0% for MG) and MG accounts for the large majority at Beijing (98.4%, versus 1.6% for TK), consistent with the dominant pathways identified from the backward and forward trajectory analyses above. Integrated over the full 19–25 March event period instead, the corresponding shares are 80.7% TK/19.3% MG at Lanzhou and 1.9% TK/98.1% MG at Beijing; the larger MG share at Lanzhou in this longer window reflects a lower-magnitude, MG-dominated tail after 22 March (Figure 11) once the TK-driven event peak has passed, rather than any MG contribution during the dust episode itself.

3.4. Vertical Structure and Spatiotemporal Evolution from CALIPSO

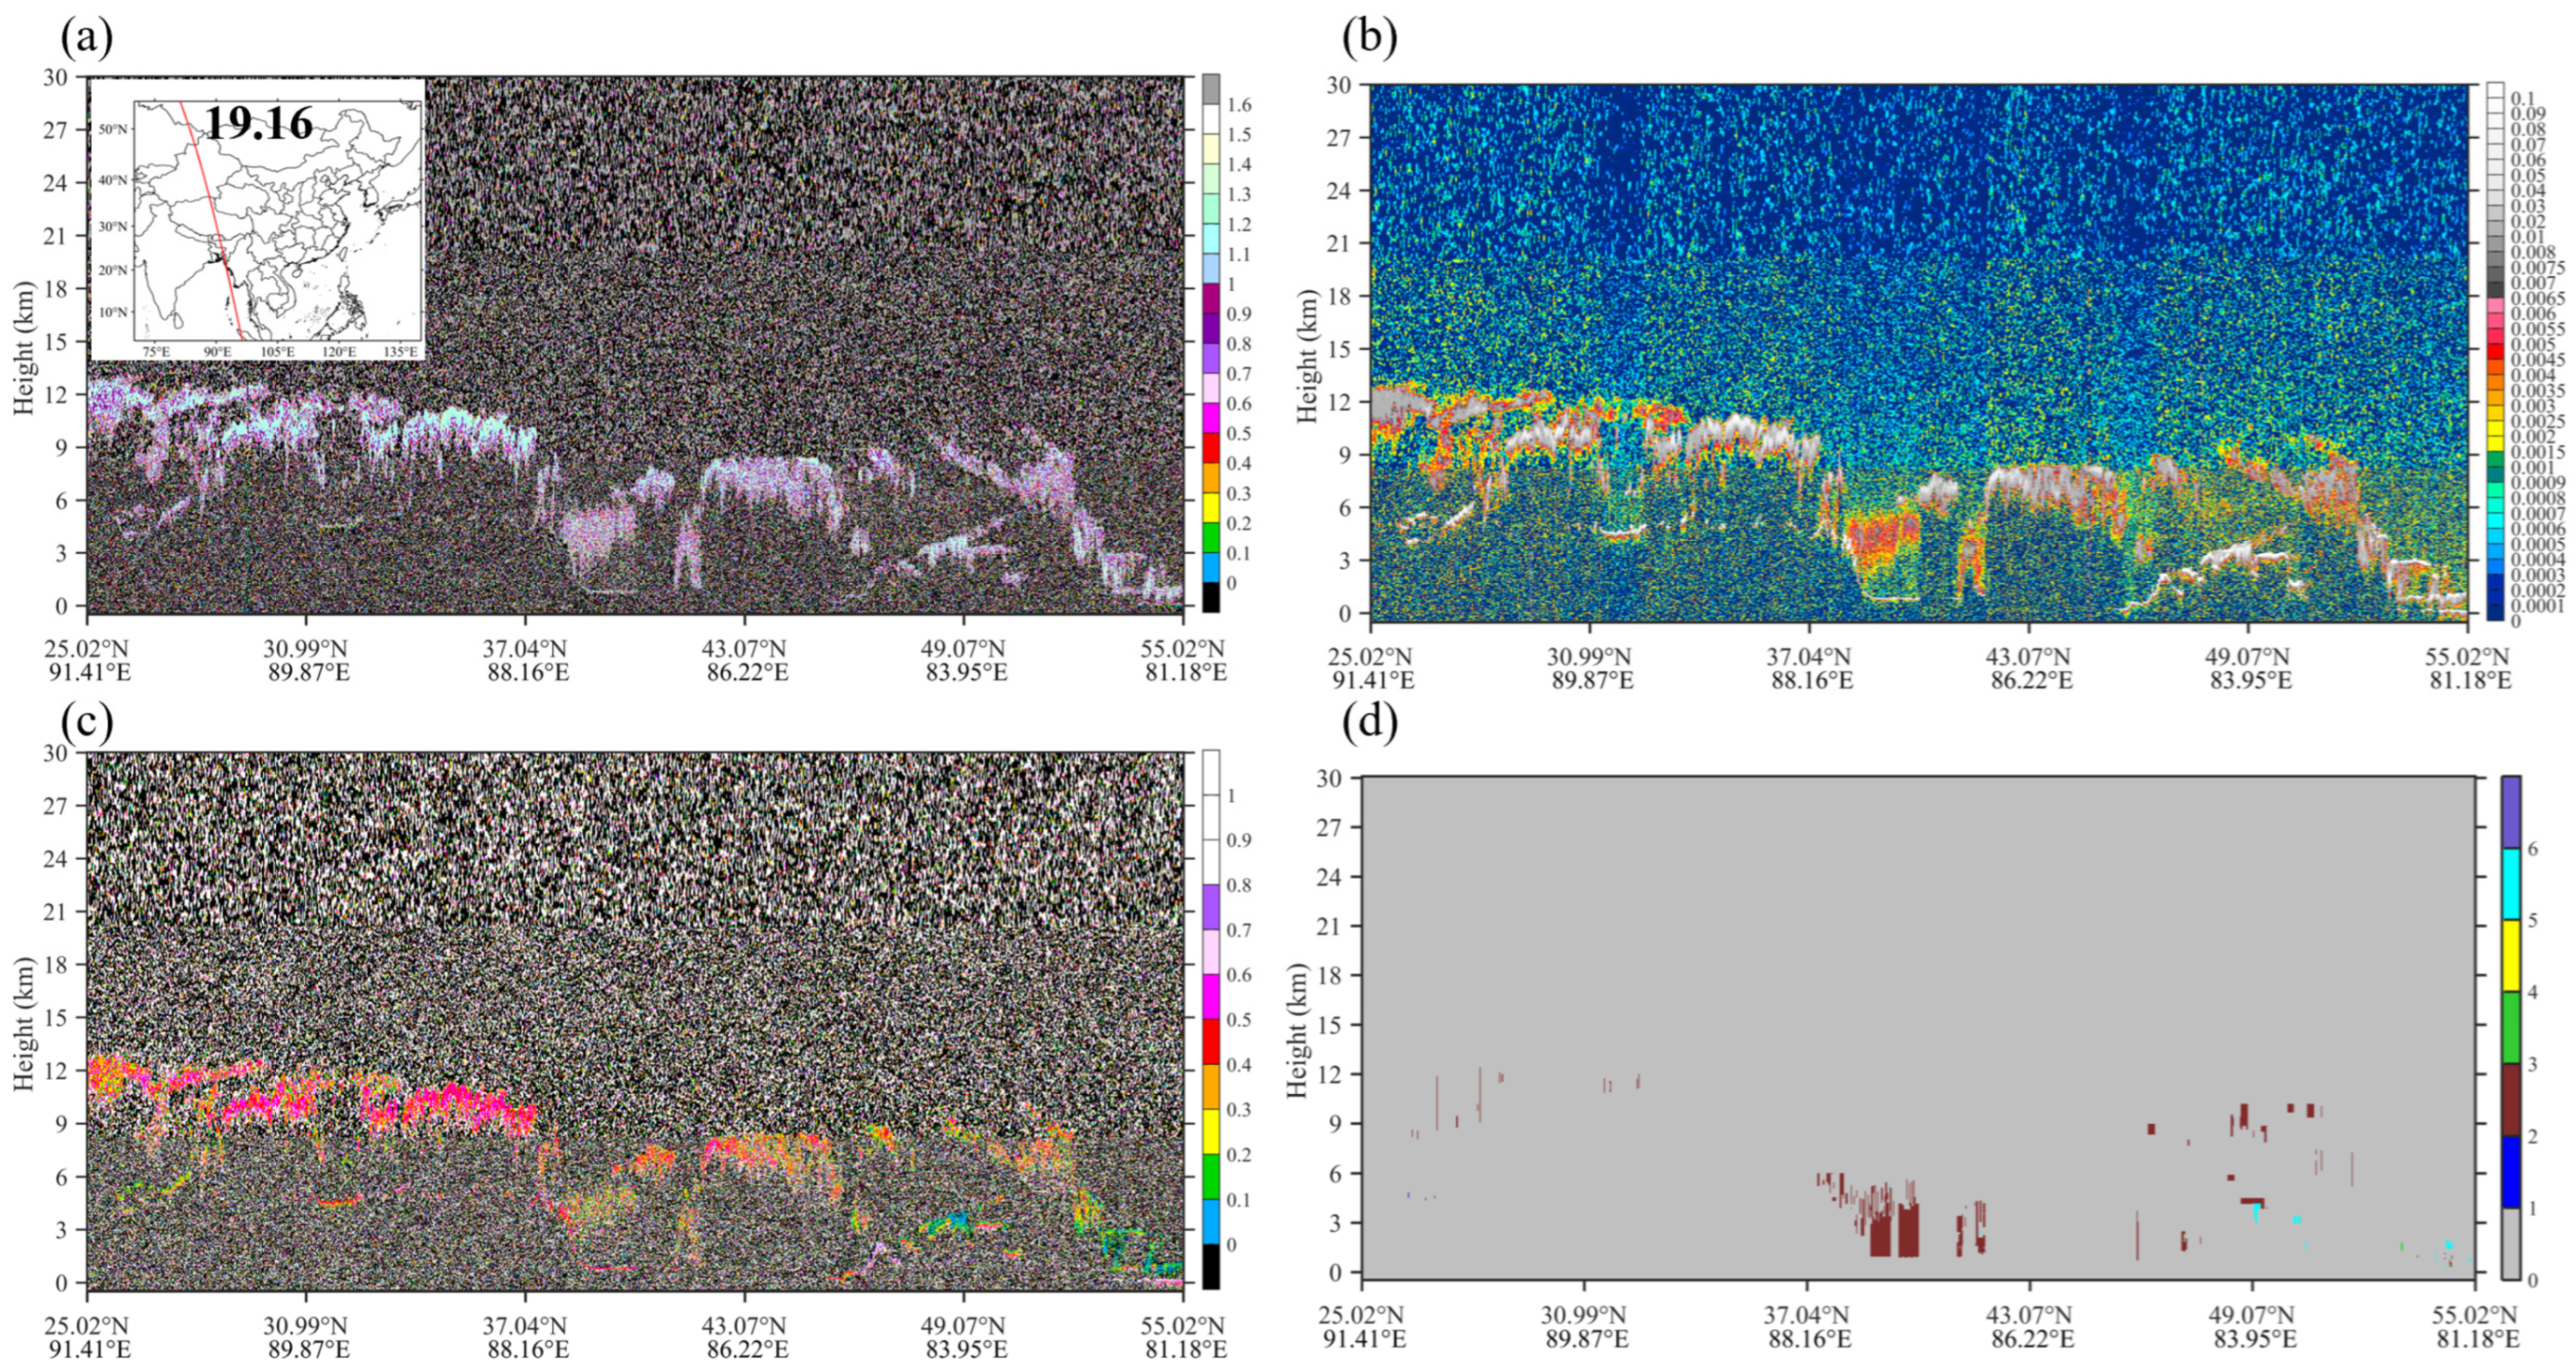
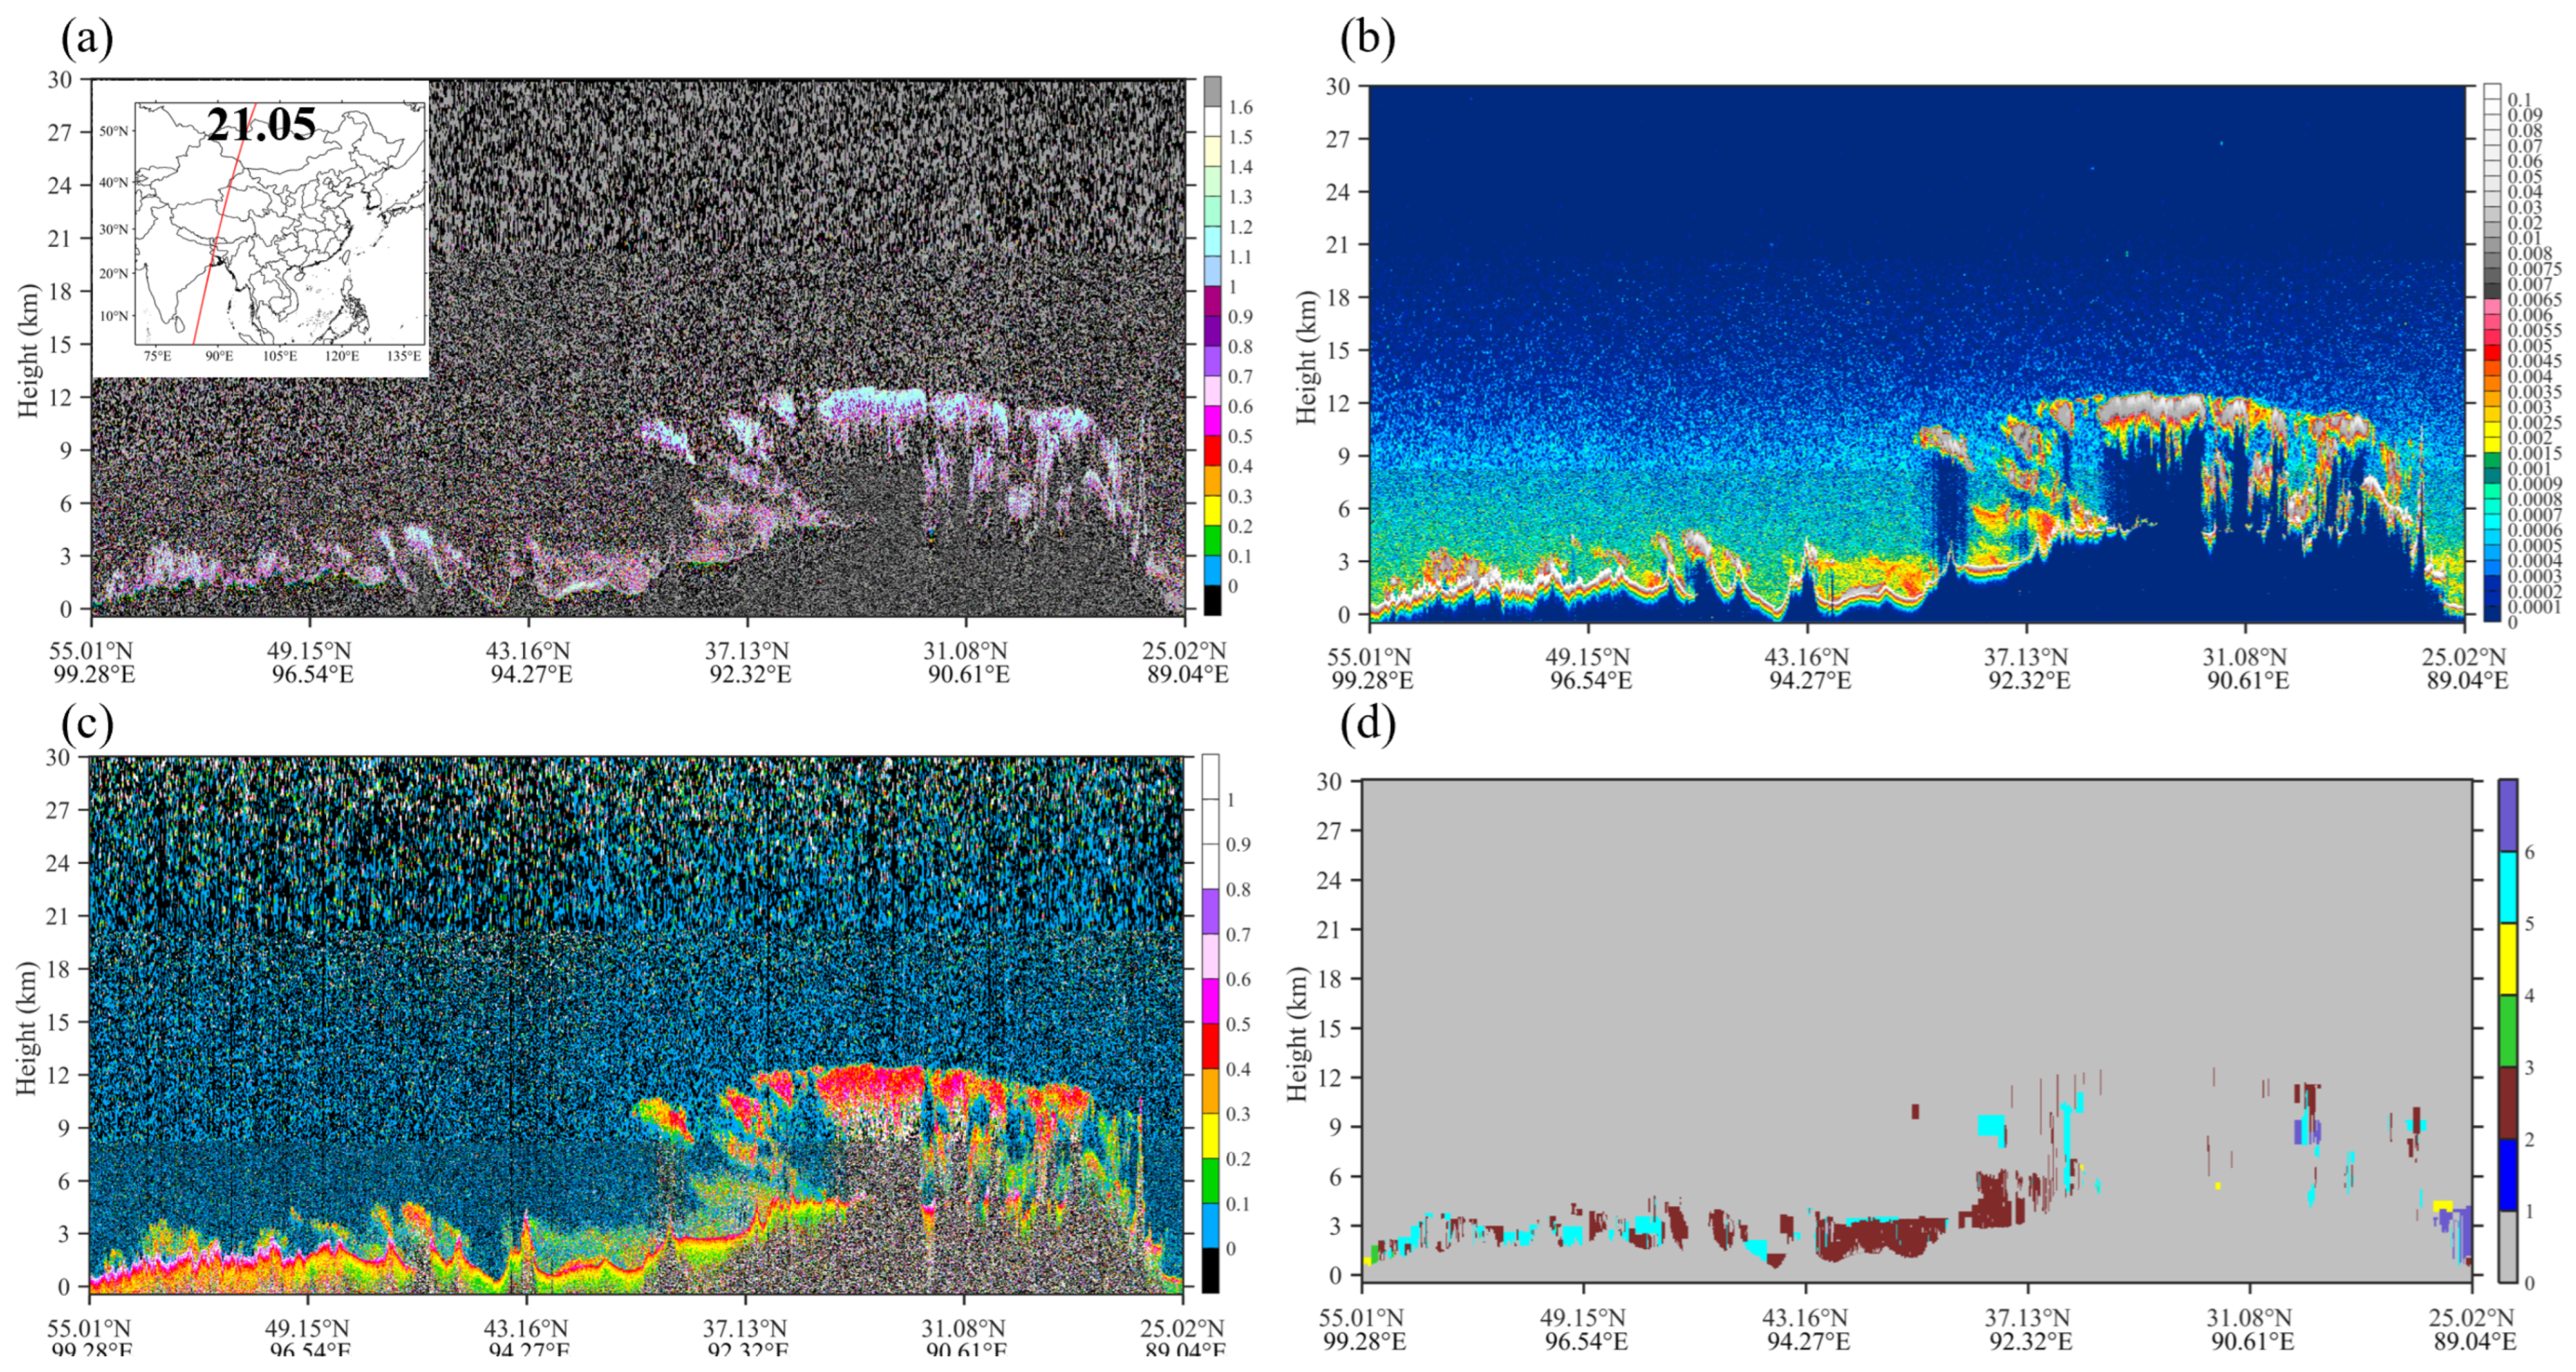
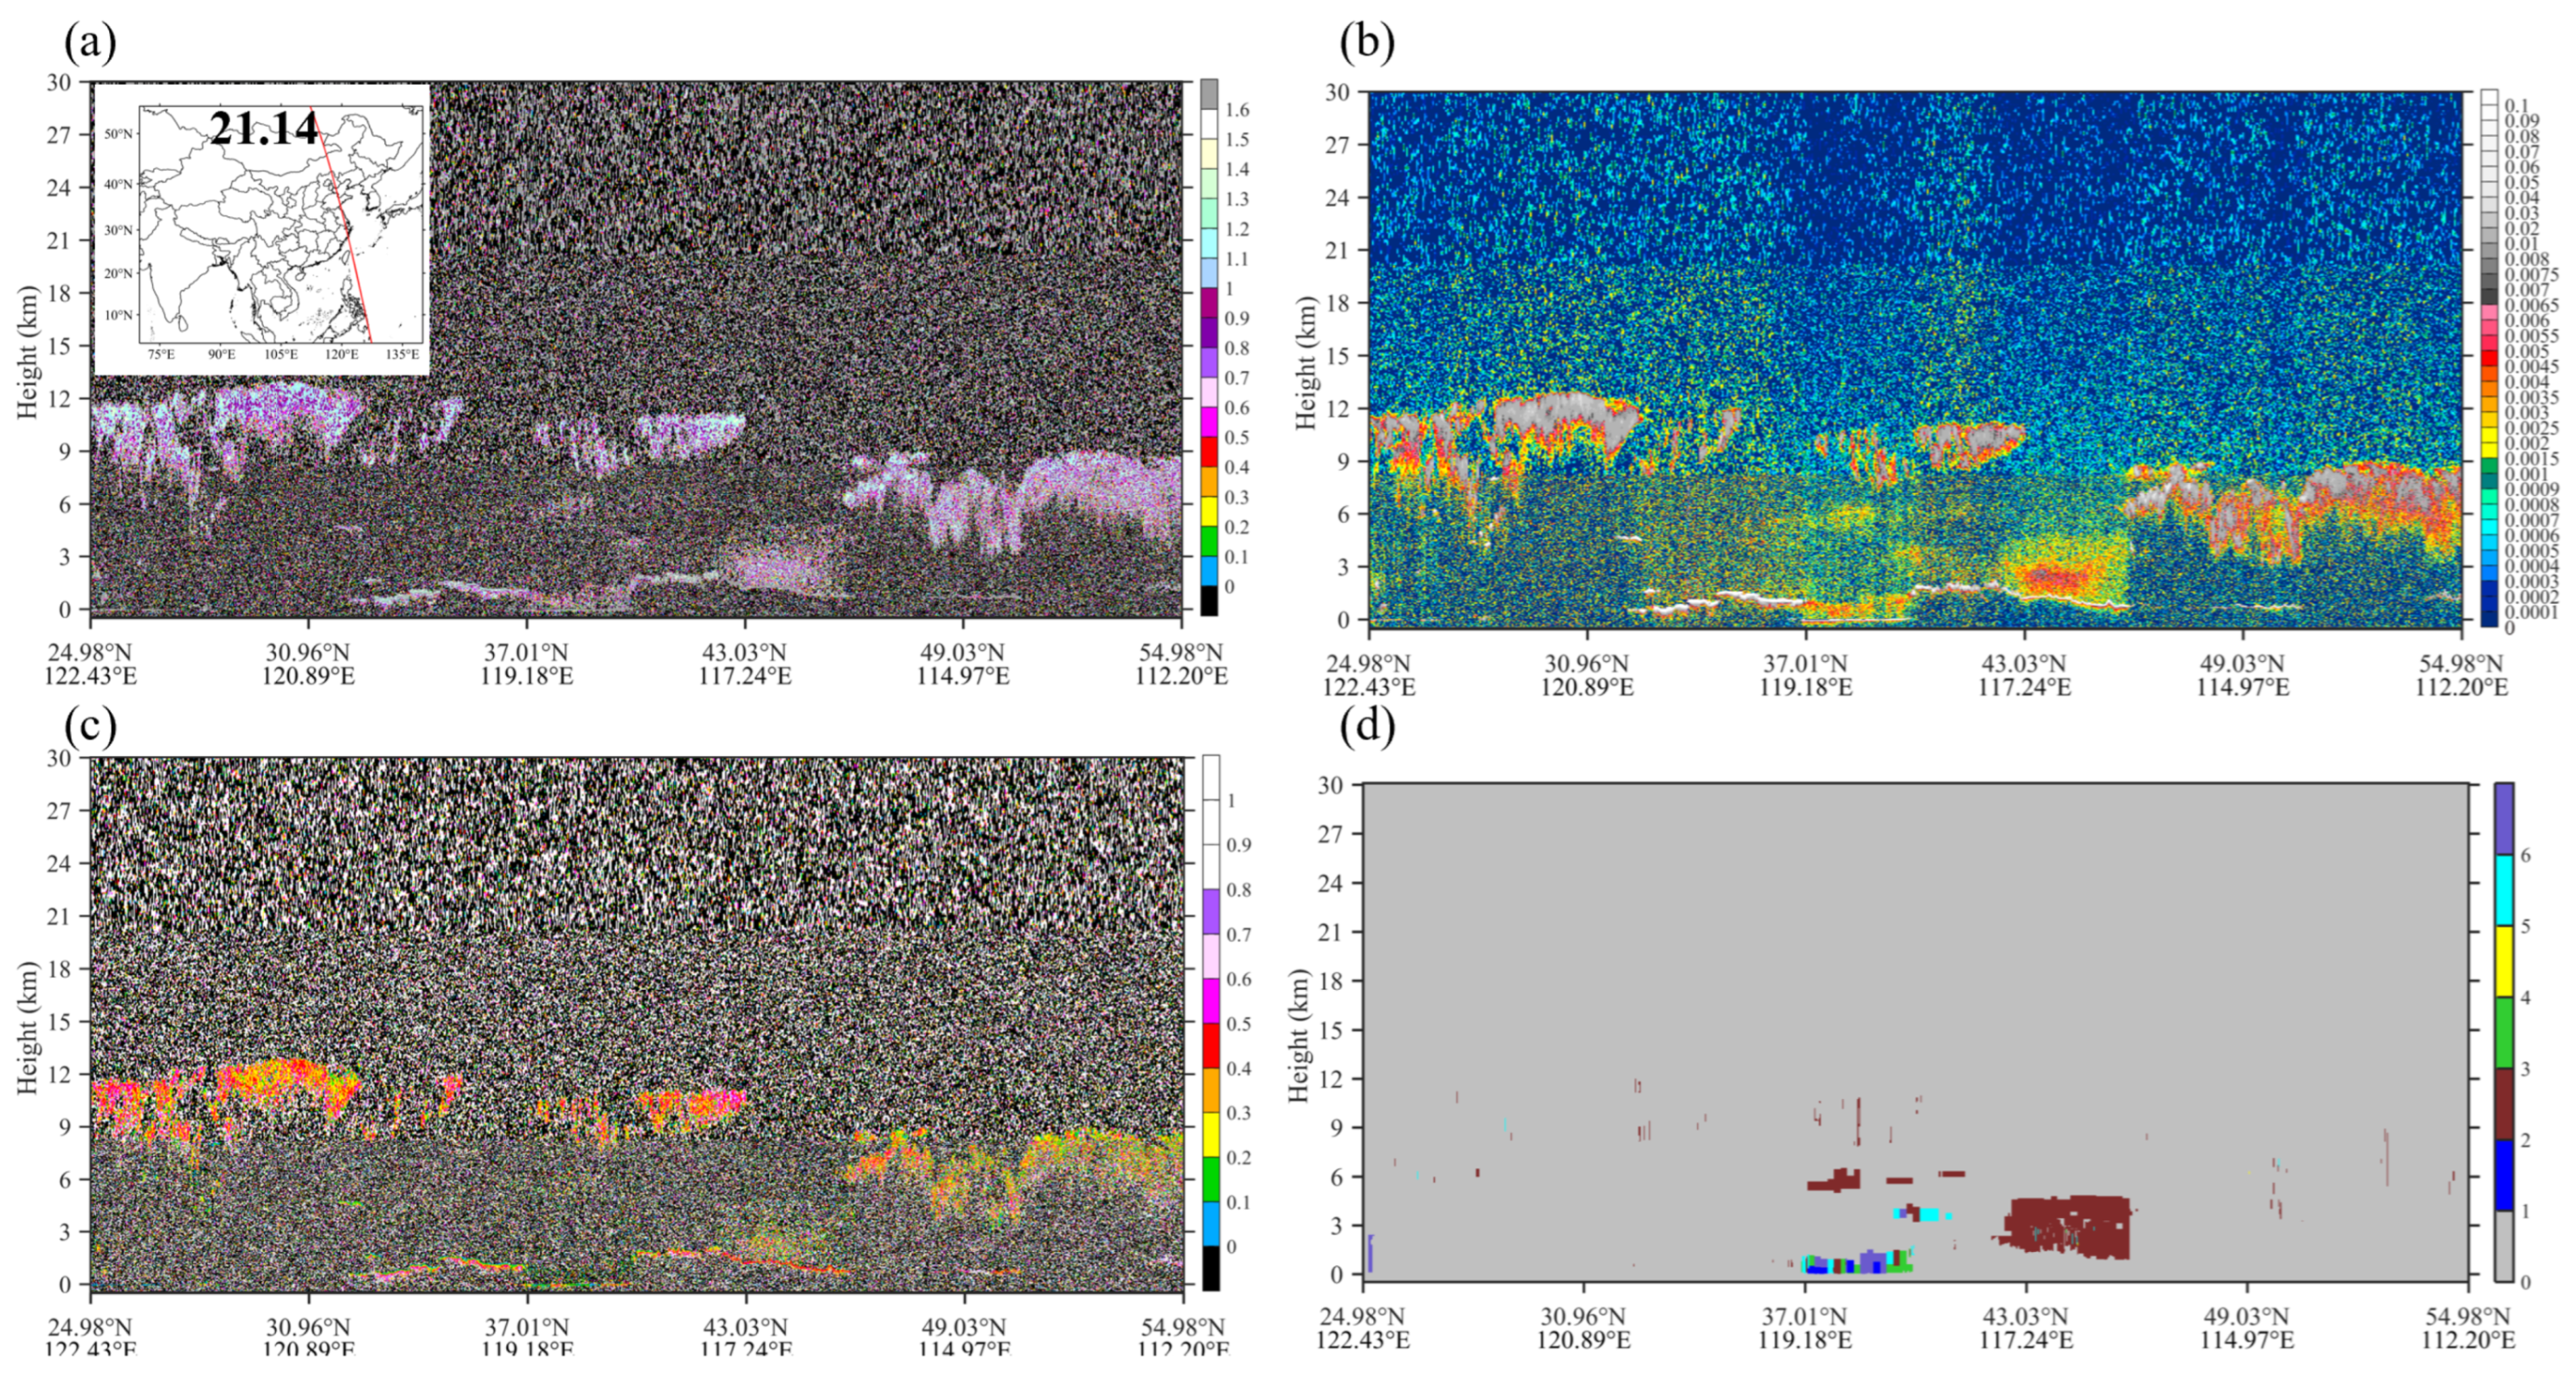
Because CALIPSO/CALIOP is a narrow-swath (~70 m), twice-daily polar-orbiting instrument, the profiles shown here are temporal snapshots along specific orbital overpasses rather than a continuous depiction of the plume’s three-dimensional evolution, and should be interpreted as consistency checks at selected times rather than a continuous time series. At 16:00 on 19 March, dust was mainly concentrated over TK, with high 532 nm backscatter coefficients, large depolarization ratios, and VFM dominated by pure dust. The vertical extent was primarily from the surface to within 6 km, indicating that dust in the initial emission stage was largely confined to the boundary layer and lower troposphere. At 05:00 on 21 March, dust was transported to the vicinity of Dunhuang in the Hexi Corridor. The backscatter coefficient remained high, but the height decreased to approximately 3 km; part of this apparent decrease reflects the diurnal contraction of the atmospheric boundary layer between the two overpass times, since the well-developed daytime boundary layer at 16:00 allowed dust to reach ~6 km whereas the shallow nocturnal boundary layer at 05:00 corresponds to a lower dust-layer top, rather than deposition or compression of the layer alone (Figure 12 and Figure 13).
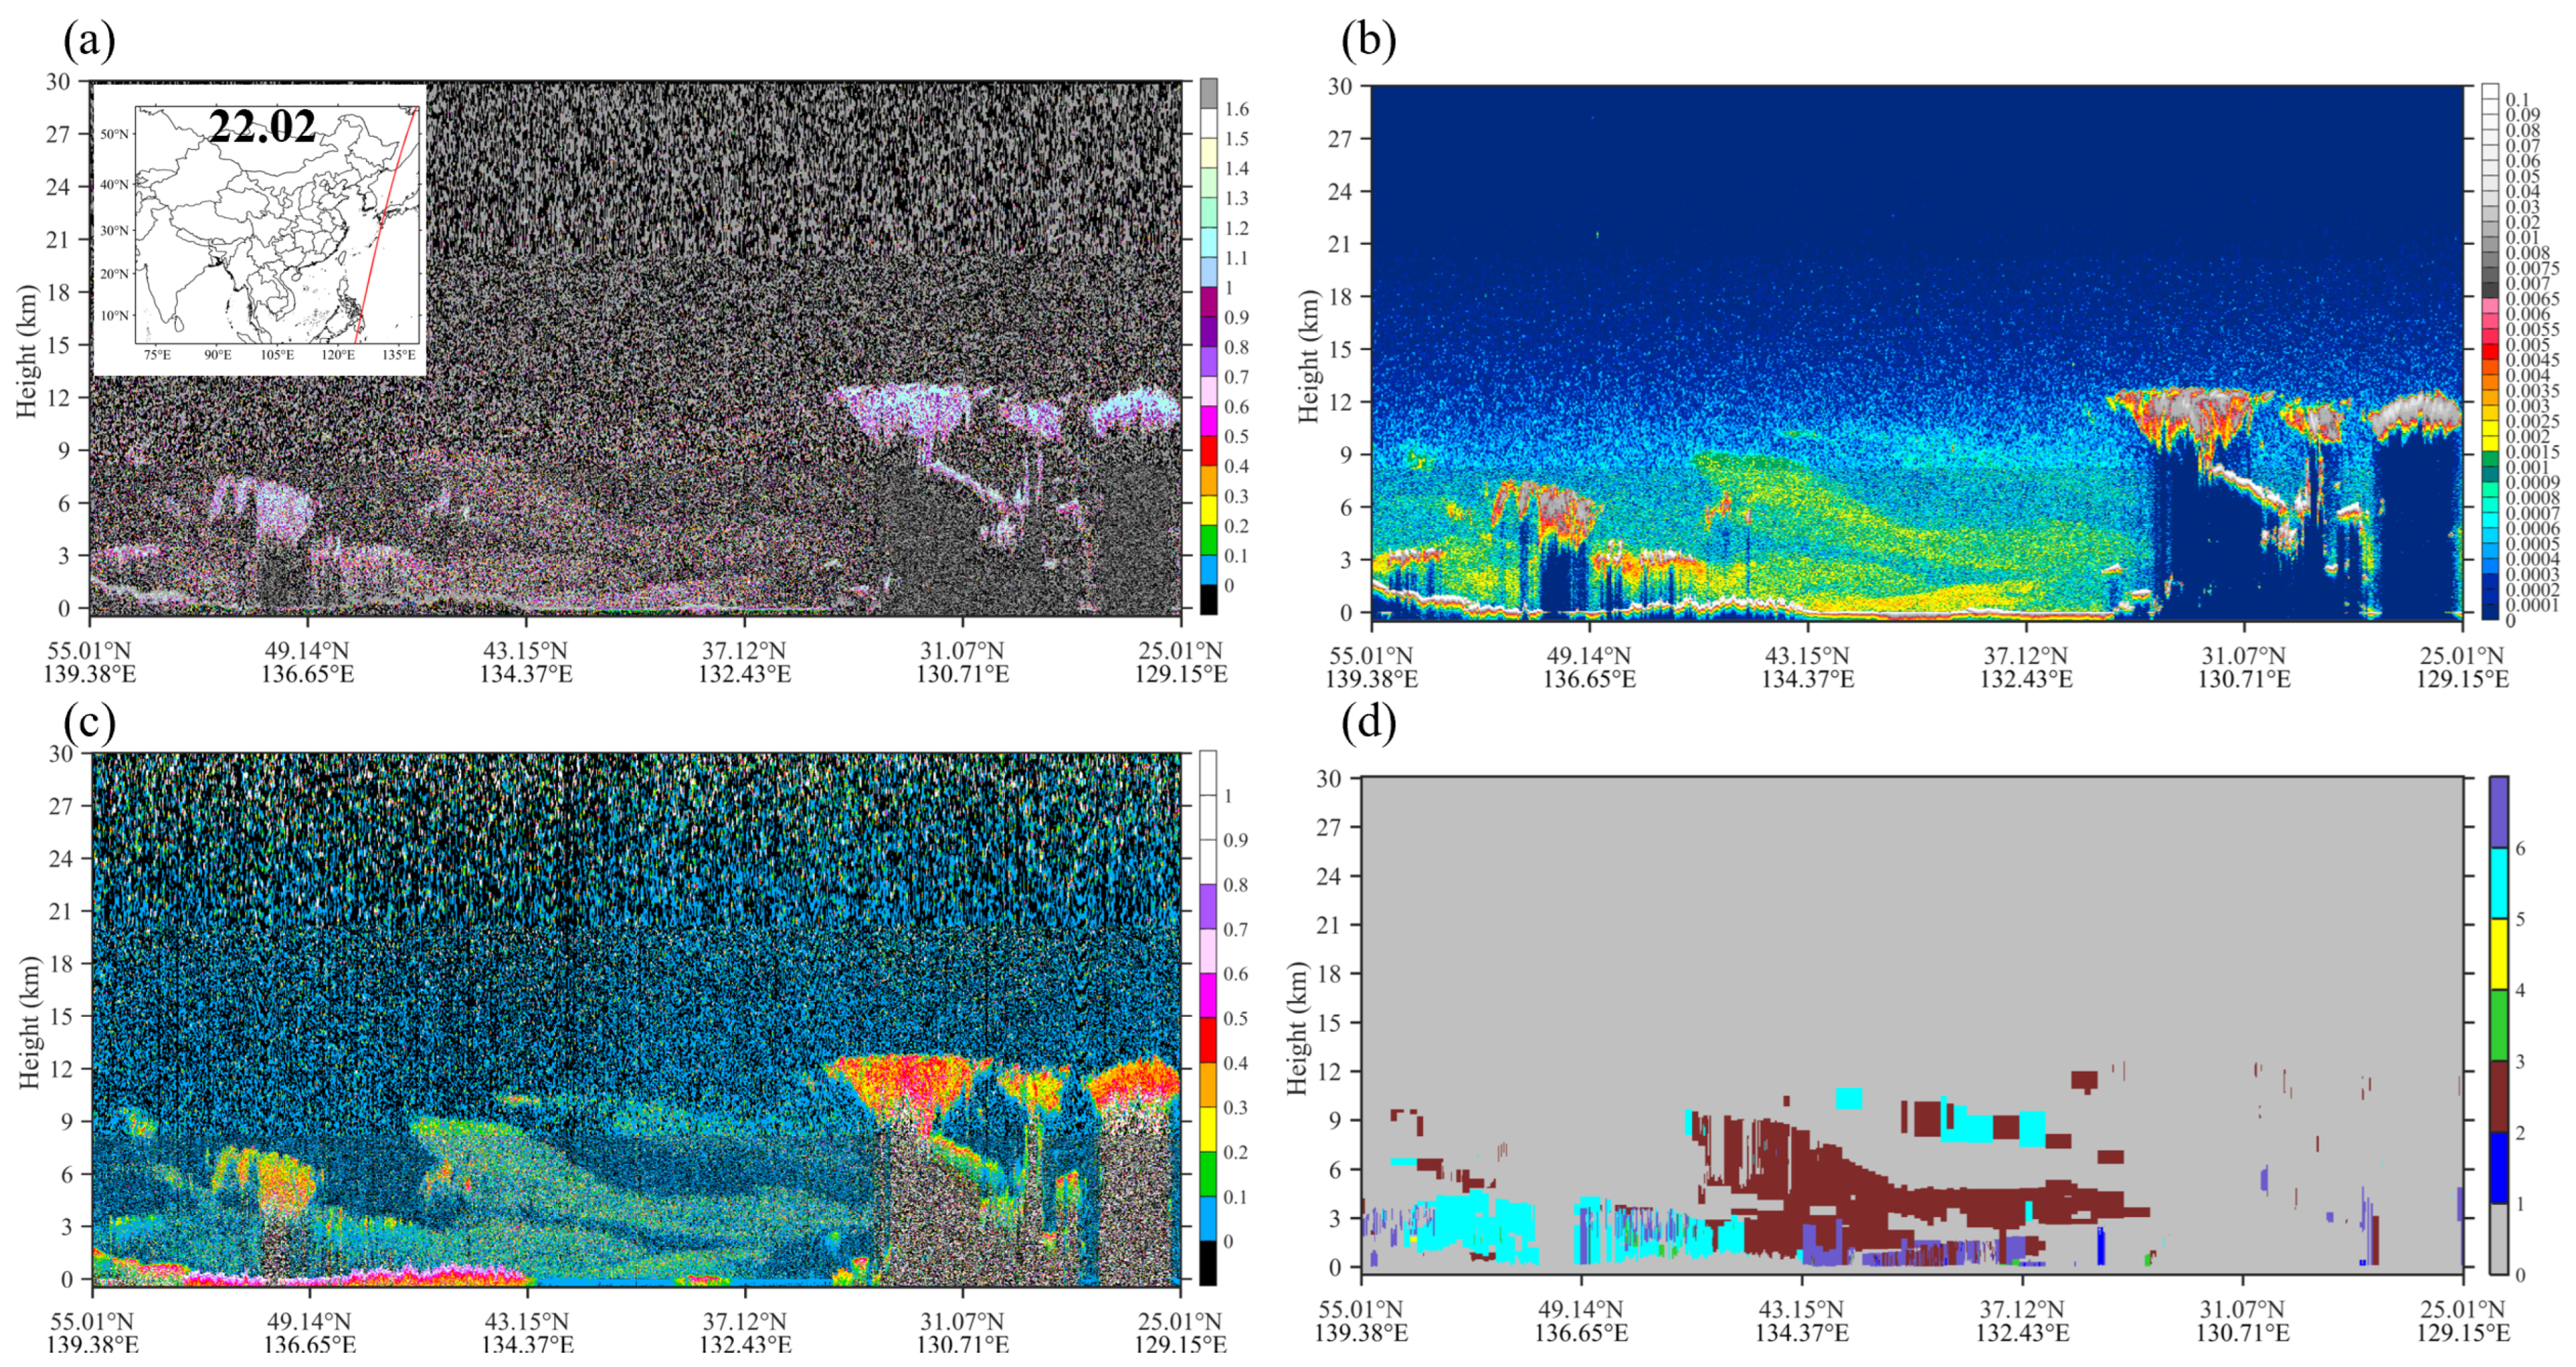
At 14:00 on 21 March, intense dust accumulation appeared near the border between Inner and Outer Mongolia, associated with piling-up caused by the blocking effect of the Daqingshan Mountains. Backscatter coefficients, depolarization ratios, and color ratios all increased, forming a thick pure-dust layer extending from near the surface to approximately 5 km. At 02:00 on 22 March, distinct high backscatter regions appeared over Beijing and Northeast China. In the southern region, dust was lifted to approximately 9 km by the combined effects of frontal lifting and topographic forcing, while in the northern region it remained at around 4 km. VFM showed polluted dust in some areas, indicating mixing with local pollutants during long-range transport (Figure 14 and Figure 15).
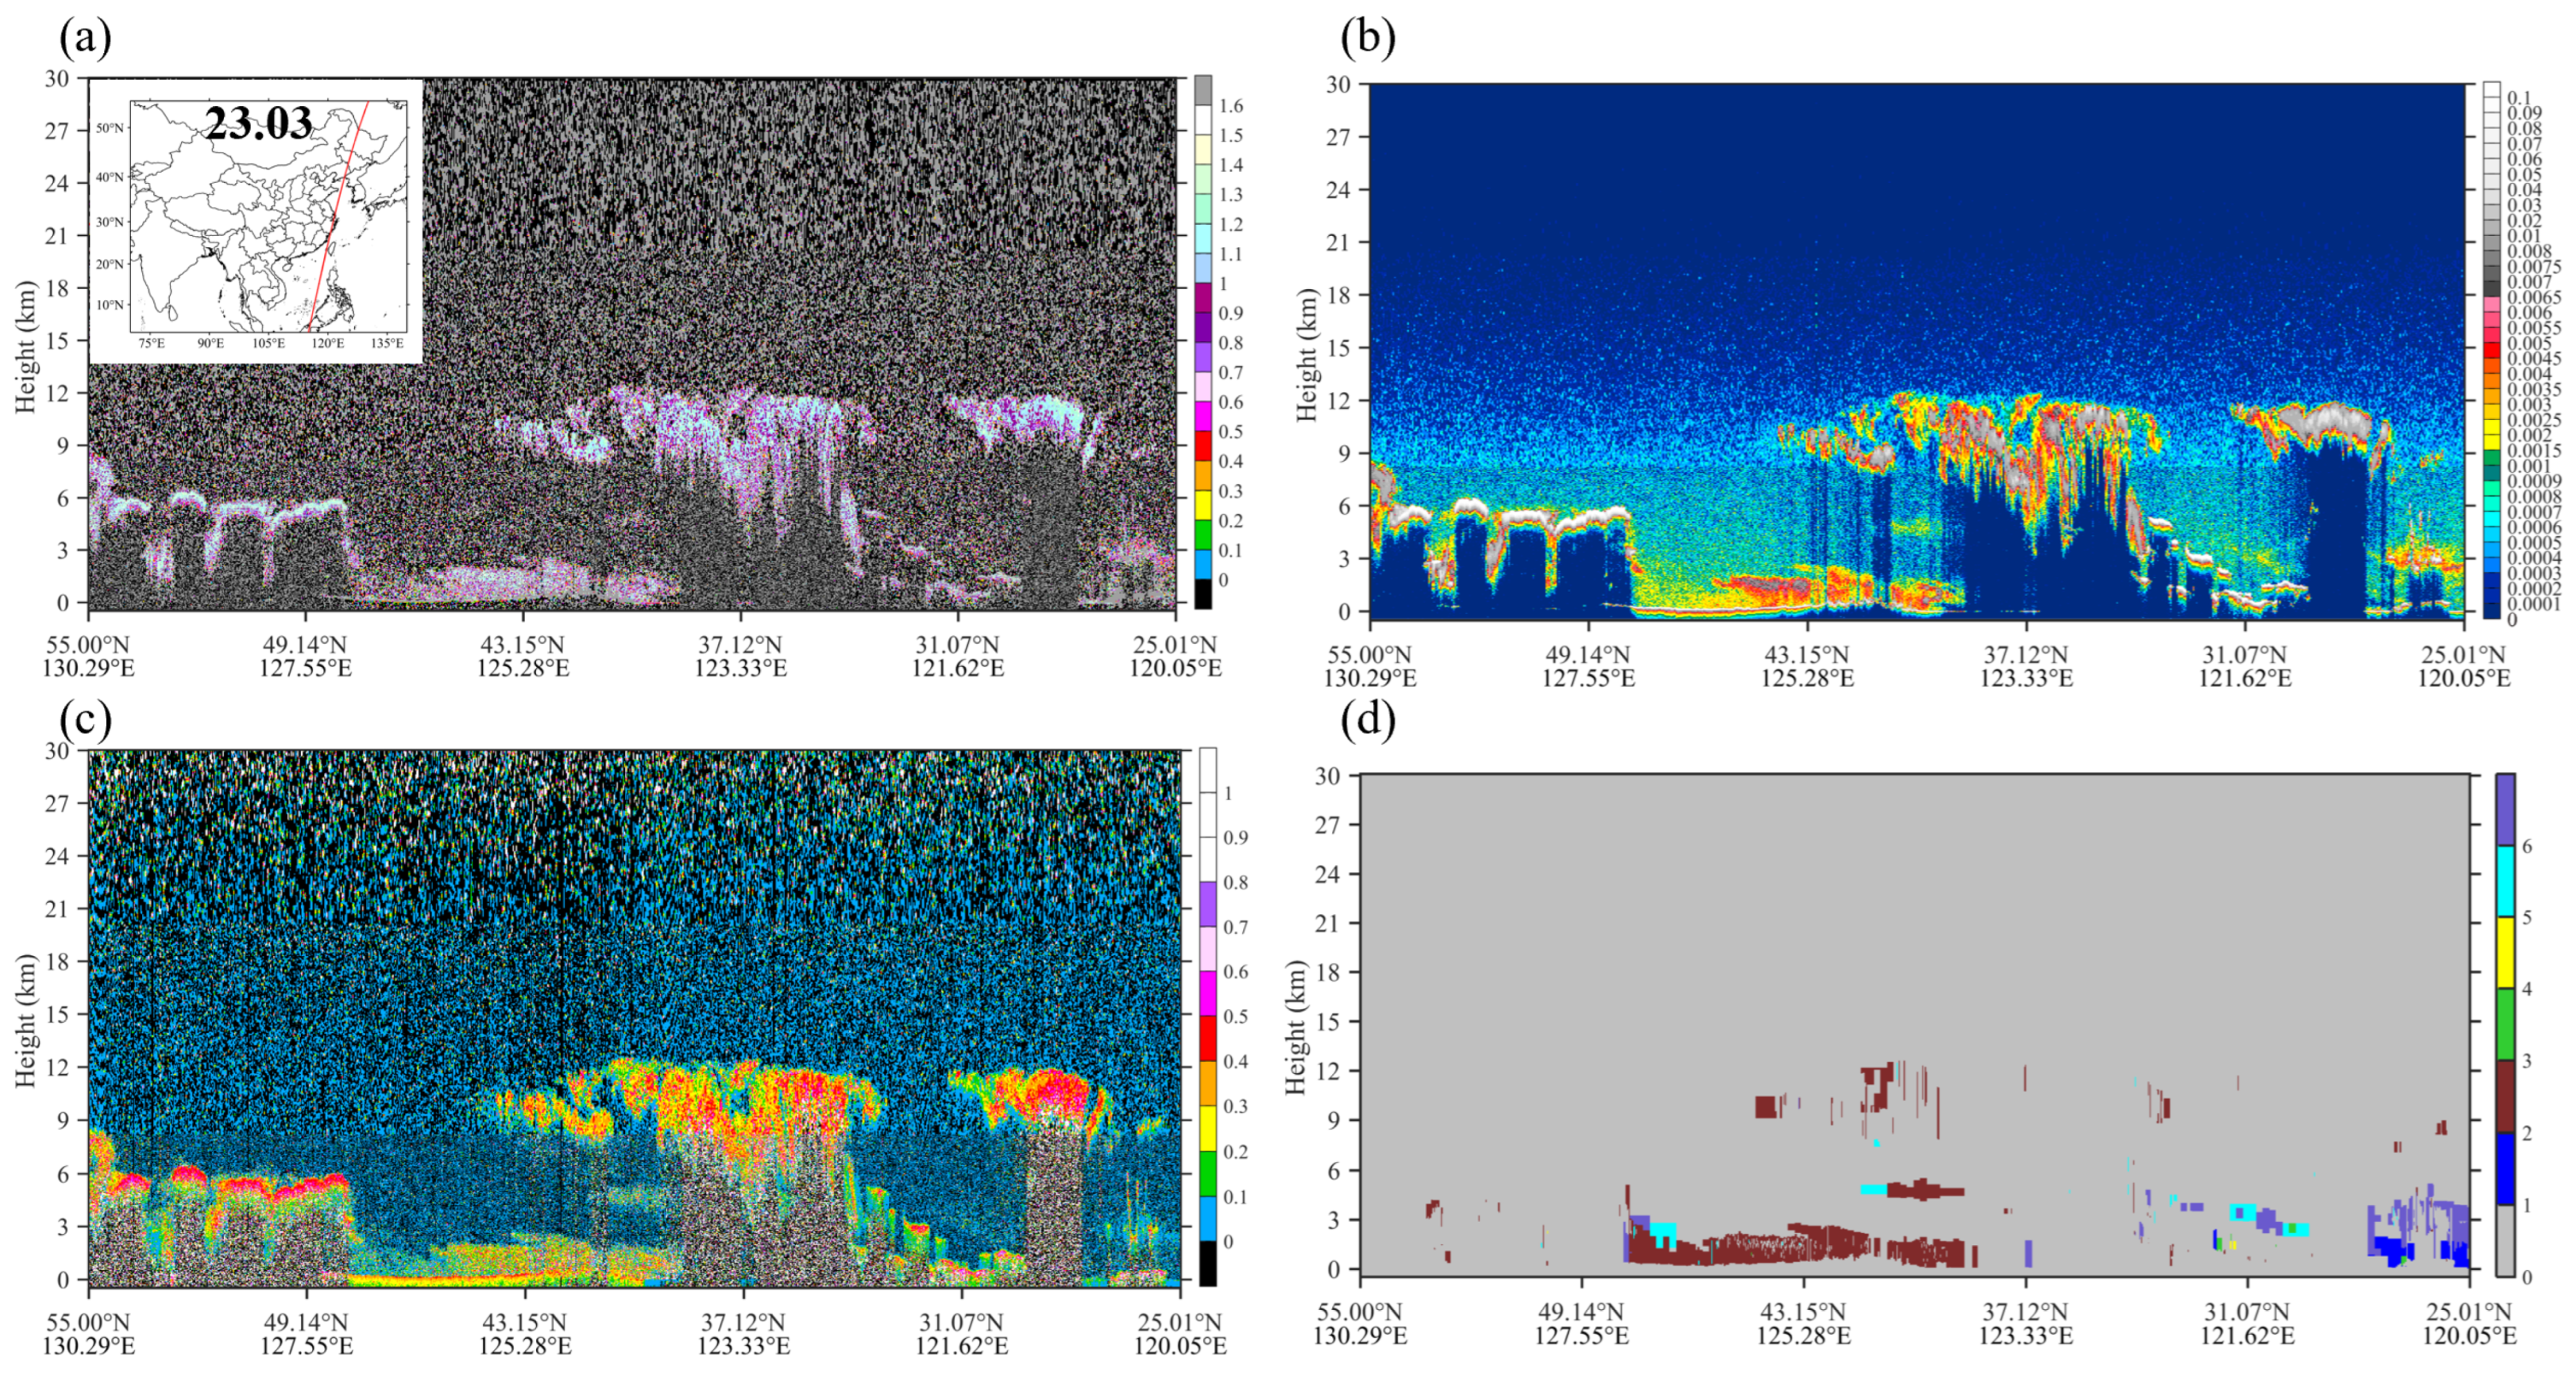
At 03:00 on 23 March, the main dust body moved over the ocean, with sharply decreased backscatter coefficients and a dust-layer height rapidly dropping to below 2 km. This indicates rapid deposition after the plume moved out to sea, likely associated with sea-surface friction and wet deposition. The vertical evolution process—initial height below 6 km, lifting to approximately 9 km in the southern region, maintenance near 4 km in the northern region, and rapid deposition below 2 km after moving offshore—reveals pronounced latitude dependence and stage-specific differences (Figure 16).

3.5. Topographic Regulation of Dust Transport Pathways

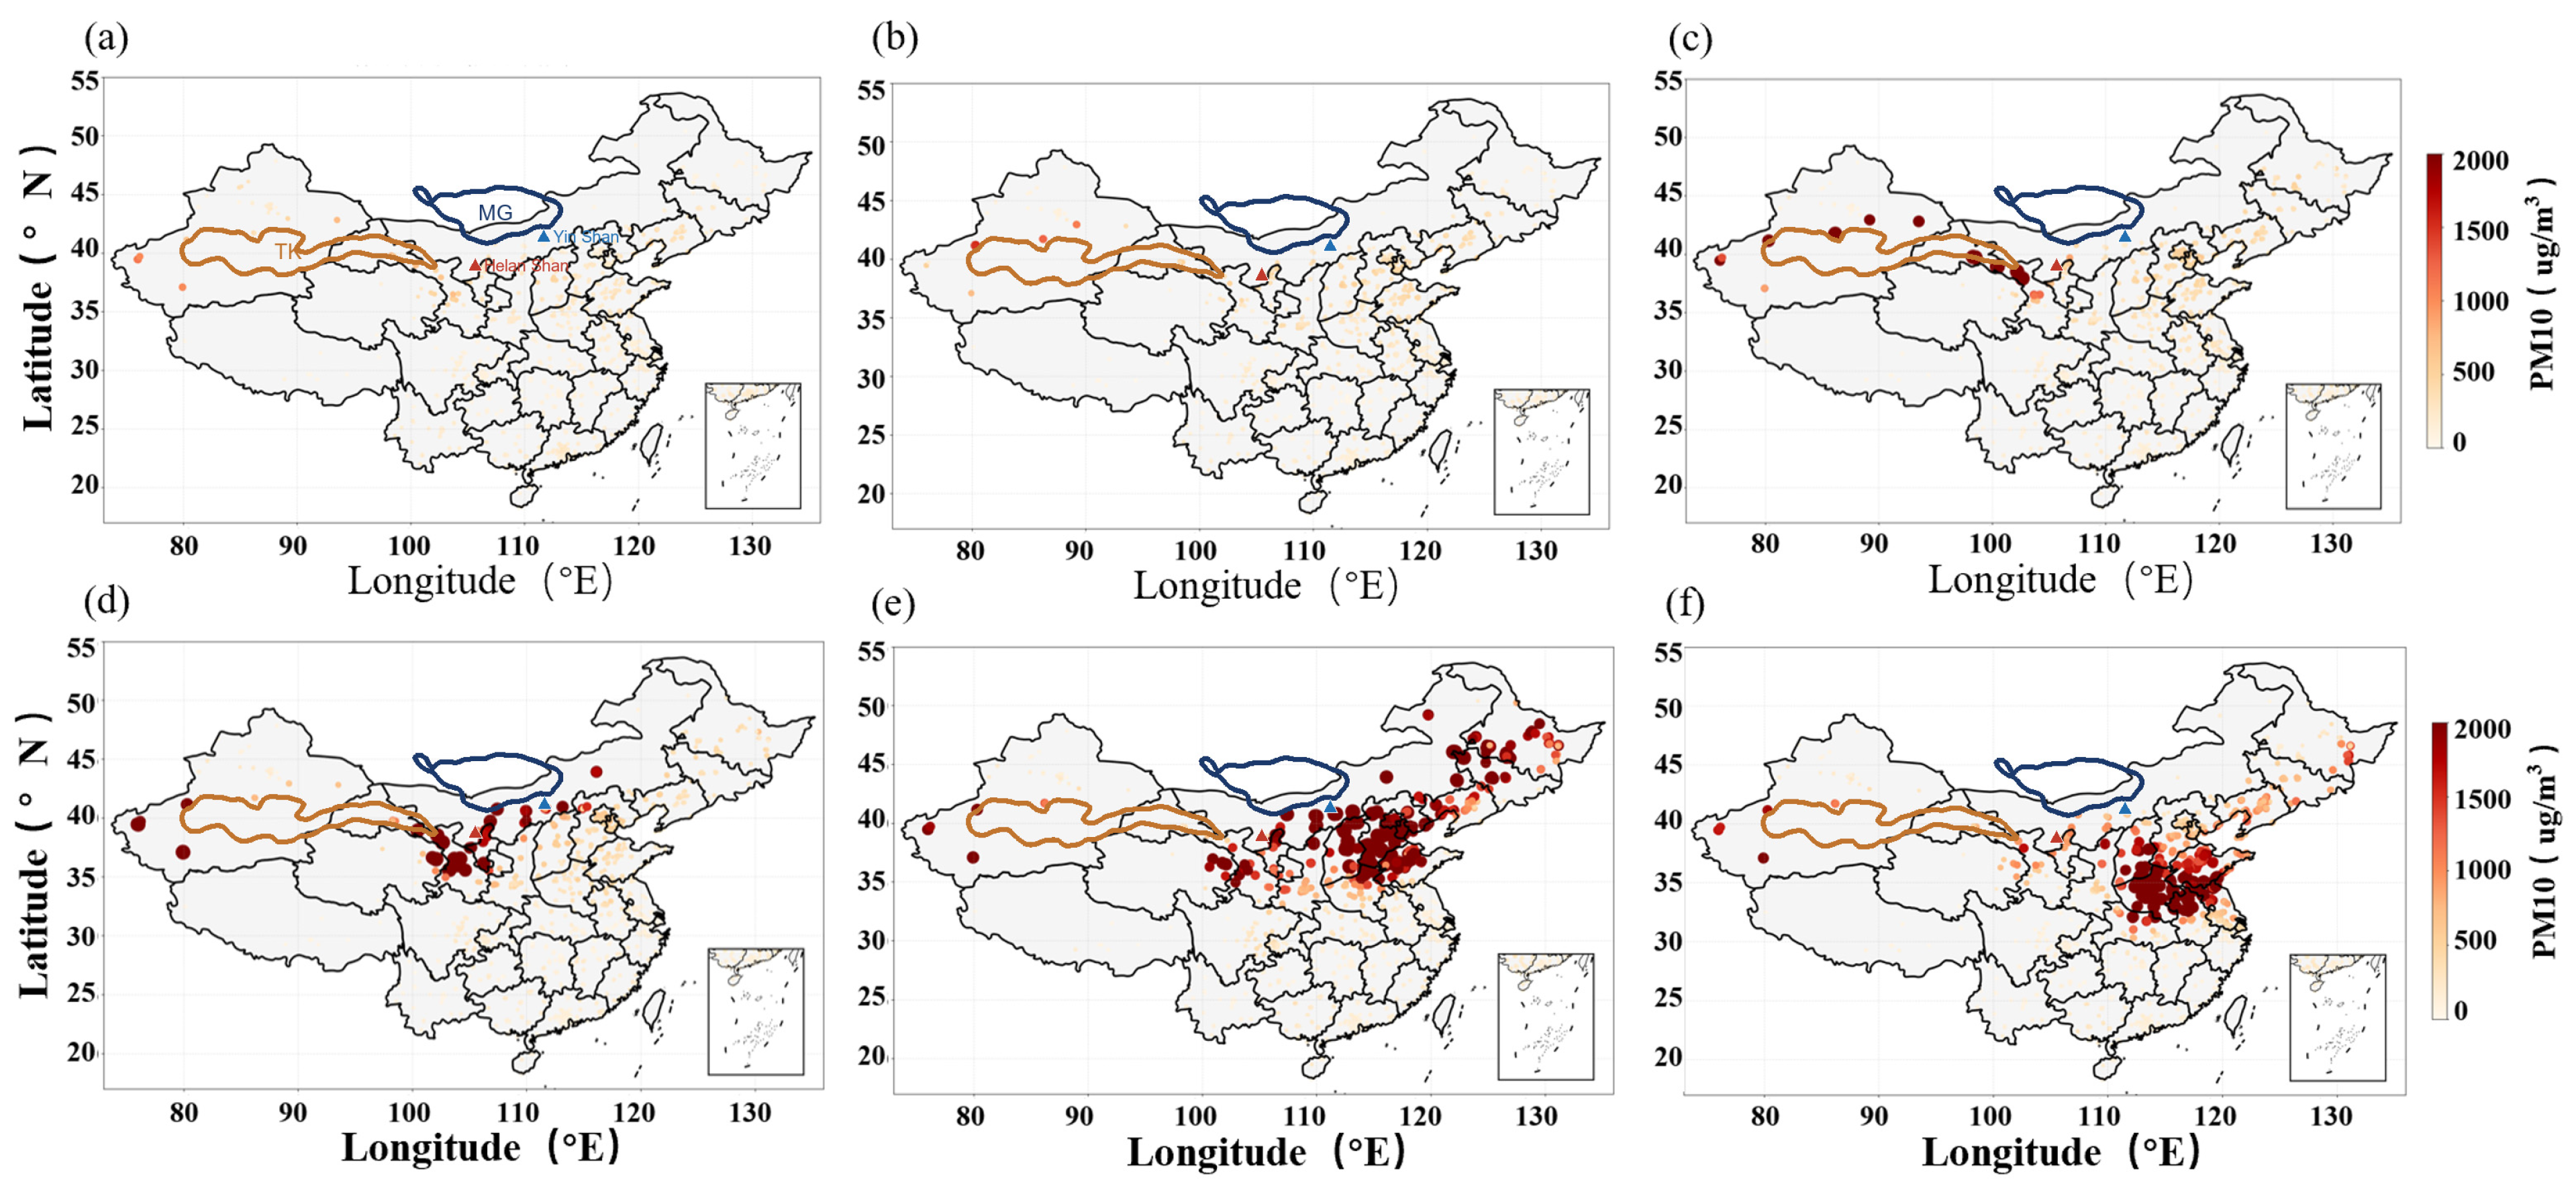
Topographic blocking was a key factor regulating the horizontal distribution and intensity of this dust event and exerted differentiated impacts on TK and MG dust pathways. PM10 observations across China show that elevated values exceeding 1500 ug m−3 began to appear over and around the TK margin and the western Hexi Corridor during 19–20 March, with local peaks exceeding 2000 ug m−3. On 21 March, TK dust expanded southeastward along the Hexi Corridor, but strong accumulation occurred on the western side of the Longshan, Guanshan, Liupan, and Helan Mountains. In contrast, concentrations decreased on the eastern side of these mountain ranges, consistent with a west-to-east decrease in PM10 across the range (Figure 17).
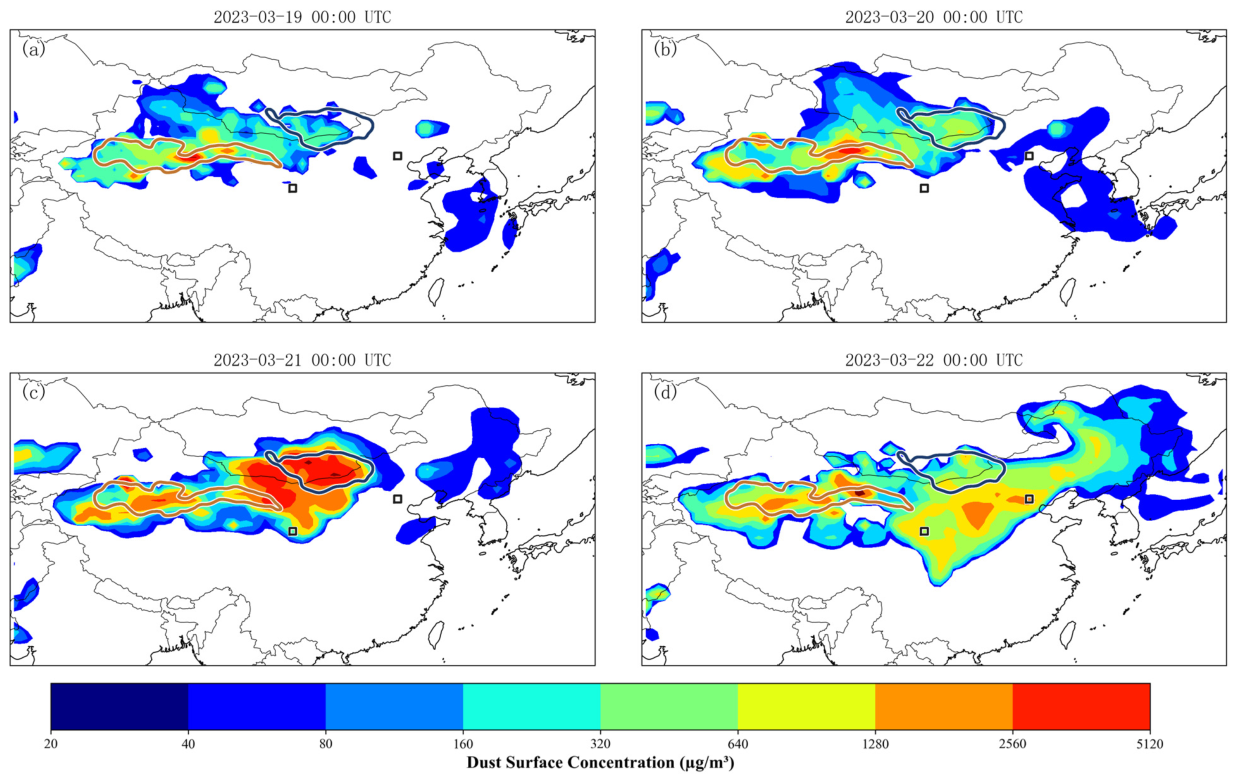
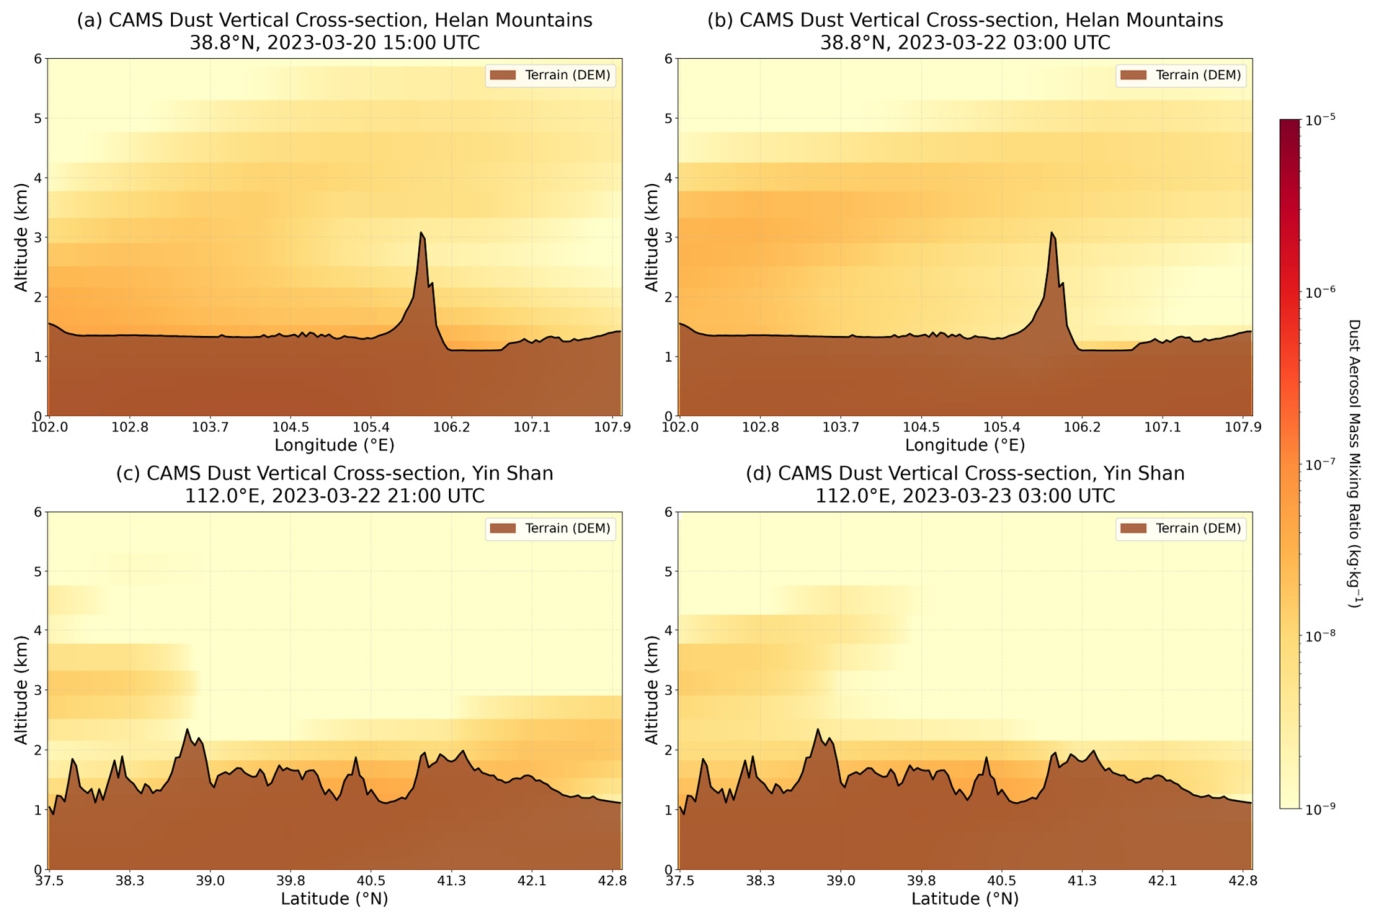
CAMS EAC4 surface dust concentrations provide an independent reanalysis-based consistency check for the topographic regulation mechanism. From 19 to 20 March, simulated high-concentration areas were mainly confined to the northwestern TK source region and the Hexi Corridor. On 21 March, TK dust formed a channel effect along the Hexi Corridor, but its concentration decreased rapidly after being blocked in the Helan-Longshan mountain area. By 22 March, the main high-value center shifted to North China and Northeast China, consistent with the southeastward transport of MG dust and the convergence of the two plumes (Figure 18).
Vertical cross-sections across the Helan and Yinshan Mountains further show blocking and orographic lifting. The Helan Mountains blocked the eastward-transported TK plume, causing windward-side accumulation and partial lofting over the terrain. The Yinshan Mountains and adjacent ranges exerted weaker but still important lifting effects on MG dust, allowing part of the plume to disperse at elevated levels over North China. These terrain effects explain why TK dust was strongly channeled and weakened downstream, whereas MG dust more directly affected the North China Plain (Figure 19).
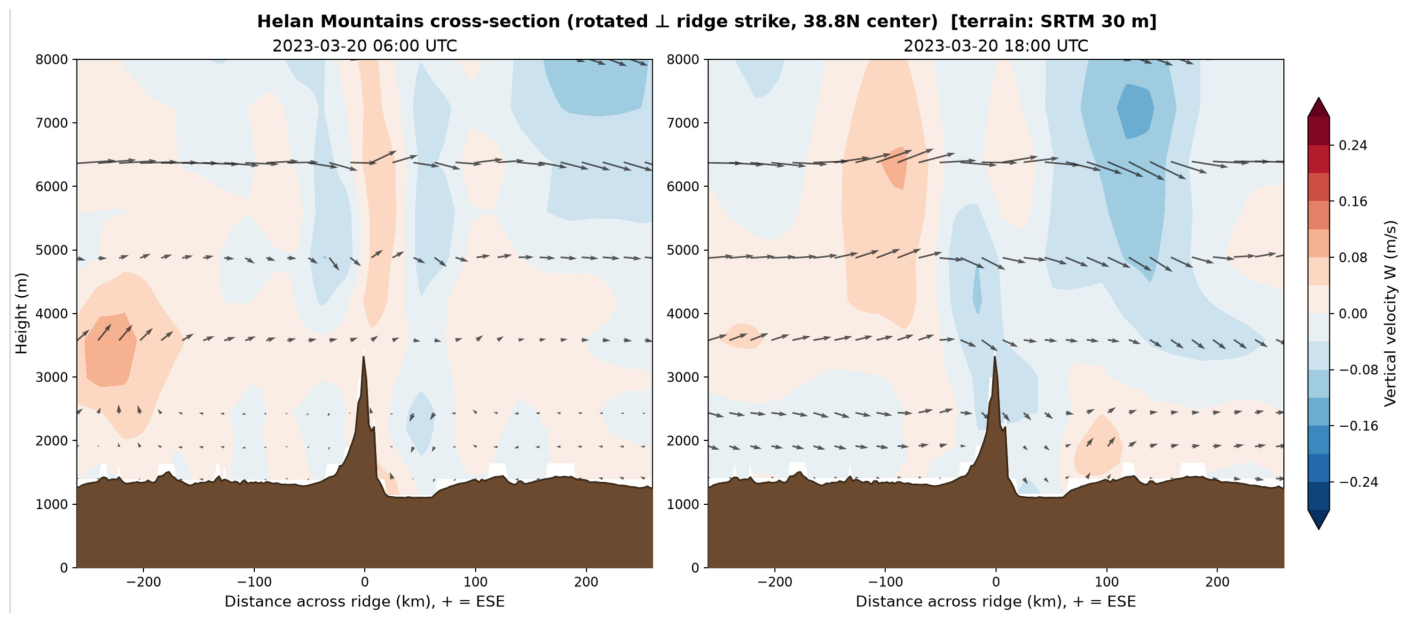
To move beyond the qualitative barrier/channel interpretation above, three additional quantitative diagnostics were computed for the Hexi Corridor-Helan Mountains pathway (Figure 20, Figure 21 and Figure 22). ERA5-derived vertical velocity along a transect rotated perpendicular to the true Helan Mountains ridge strike (verified against SRTM 30 m topography) shows a persistent updraft/downdraft couplet straddling the ridge crest at two times 12 h apart (Figure 20), a terrain-forced, mountain-wave-like signature rather than a one-off transient.
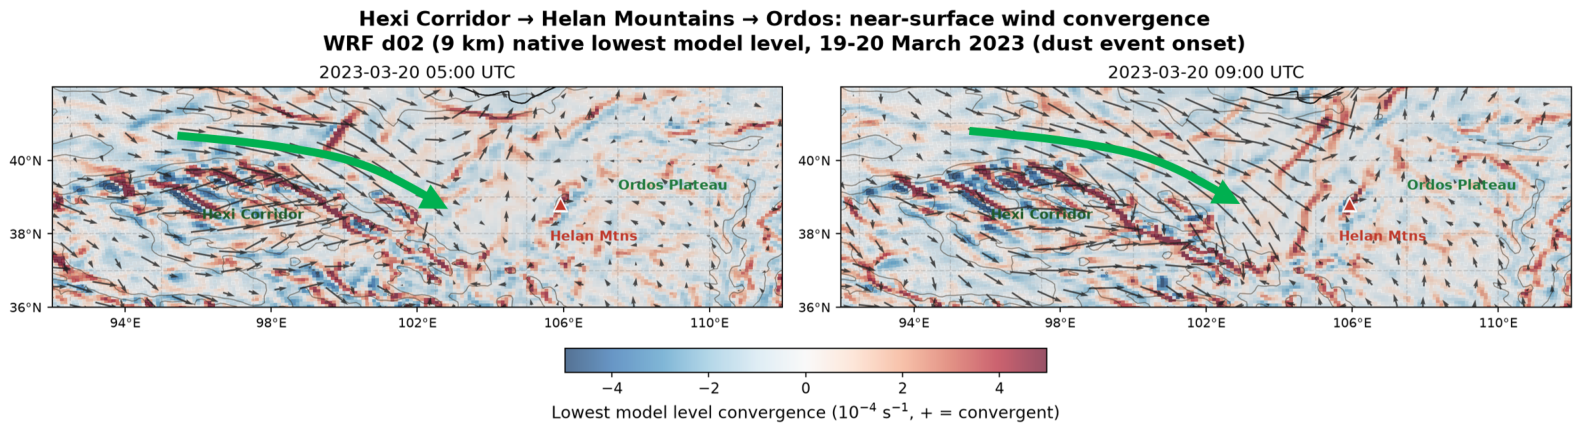
Low-level wind convergence (WRF d02, native lowest model level), computed continuously along the Hexi Corridor-Helan Mountains-Ordos axis for 19–20 March, shows a convergence band spatially locked to the corridor’s terrain axis and strengthening through the period (Figure 21), indicating the terrain is organizing the low-level convergent flow.
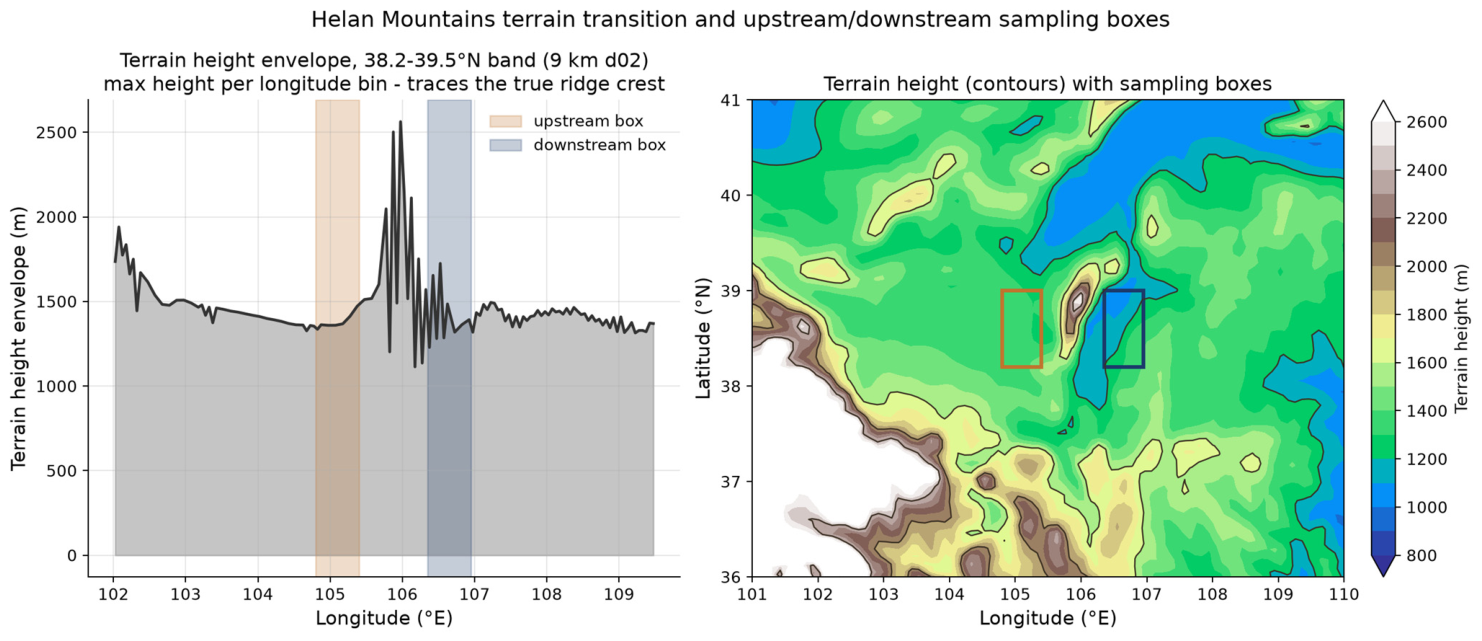
Finally, area-averaged (not point) upstream/downstream boxes positioned from the actual topographic ridge crest (Figure 22) give a downstream/upstream ratio of 0.77 for the event-integrated total dust column concentration across the range (a 23% decrease) and 0.81 for the instantaneous peak (a 19% decrease), confirming the Helan Mountains act as a real barrier that attenuates westward-approaching TK dust rather than merely redirecting it.

4. Discussion

4.1. Added Value of the Long-Term Context

The long-term 2000–2024 analysis improves the scientific framing of the 2023 event by showing that it occurred against a generally weakening spring dust background. The DUCMASS trend and significant-pixel statistics indicate that the decline is spatially broad rather than being caused by isolated pixels. However, the 2023 event demonstrates that a declining mean state does not eliminate the possibility of severe dust episodes. Extreme events can still occur when synoptic forcing, source-region activation, and terrain-guided pathways are simultaneously favorable. The March 2023 event also differs mechanistically from the widely studied March 2021 super dust storm. The 2021 event was mainly characterized by a Mongolian-source-dominated northwest–southeast transport belt, whereas the 2023 event involved earlier Taklamakan emission followed by later Mongolian activation. This temporal offset produced a relay-convergence process, in which the TK plume was first guided along the Hexi Corridor and the MG plume subsequently expanded southeastward into North China. The comparison emphasizes that severe East Asian dust episodes cannot be interpreted only by event intensity; their source timing, pathway geometry, vertical redistribution, and terrain interaction are equally important for downstream impacts.
The partial-correlation and random forest diagnostics further suggest that East Asian spring dust variability is controlled by multiple factors rather than by a single driver. NDVI and surface evaporation show negative relationships with DUCMASS after controlling for other variables (domain-mean partial correlation), consistent with the expectation that greater vegetation cover suppresses dust emission; this is not contradicted by the strong positive raw (unpartialled) correlation visible over the hyper-arid Taklamakan core in Figure 2d, where NDVI is close to zero and essentially non-varying, so any residual raw correlation there reflects a shared response to large-scale circulation (e.g., years with more meridional flow bringing both moisture to desert margins and more dust transport aloft) rather than vegetation itself promoting dust emission; the domain-mean partial correlation controls for these shared drivers and is the more physically informative statistic for the vegetation-dust relationship. Surface temperature and wind-related variables remain important for high-dust identification. These results support the interpretation that strong events are generated by the coupling of dynamic forcing, thermal conditions, and land-surface stability.

4.2. Mechanistic Implications for Dual-Source Transport

The March 2023 event differed from the more coherent single-source-dominated 2021 event because it involved sequential source activation and spatial convergence. TK dust was emitted first and transported along the Hexi Corridor, whereas MG dust intensified later and moved southeastward toward North China. The two plumes converged on 22 March under the guidance of mid- to upper-level northwesterly flow, producing enhanced dust loading over North China. This relay-convergence behavior is important for dust forecasting because source regions cannot be evaluated independently during such events; both timing and pathway interaction determine the downstream impact.
Topography acted as both a channel and a barrier. For TK dust, the Hexi Corridor provided an efficient transport pathway, but the Helan, Longshan, Guanshan, and Liupan mountain systems strongly limited direct penetration into the North China Plain. For MG dust, the Yinshan, Daqingshan, and Yanshan ranges promoted vertical lifting and pathway deflection but did not prevent broad southeastward transport. This source-dependent terrain effect helps explain the observed differences between Lanzhou and Beijing impacts.

4.3. Remote-Sensing and Modeling Consistency

The use of multiple observational and reanalysis datasets reduces reliance on any single product. TROPOMI AAI captures the horizontal evolution of absorbing dust plumes, CALIPSO provides vertical snapshots of layer height and aerosol type, PM10 observations document near-surface impacts, CAMS EAC4 provides independent dust fields, and FLEXPART-WRF reconstructs source-dependent pathways. The agreement among these datasets supports the robustness of the main interpretation, although each dataset has specific limitations. AAI is sensitive to absorbing aerosols and elevated layers but is not a direct mass concentration; CALIPSO has limited orbital sampling; CAMS EAC4 is a reanalysis product rather than an independent observation; and FLEXPART-WRF depends on the accuracy of meteorological forcing and release assumptions.

4.4. Uncertainties and Remaining Limitations

Several uncertainties should be considered when interpreting the results. First, although the hourly-release FLEXPART-WRF forward simulations now provide quantitative, mass-calibrated source contributions at each receptor (Section 3.3.4), these are calibrated rather than independently validated absolute emission-based estimates: the least-squares coefficients needed to match observed PM10 (23.37× for TK, 22.07× for MG) substantially exceed a near-source, ground-truth-anchored baseline, indicating that the uncalibrated simulated dust mass itself underestimates near-surface concentrations, most plausibly reflecting known emission-flux and boundary-layer limitations of 27 km-resolution regional dust modeling rather than errors in the relative source apportionment. Source attribution is therefore best interpreted as a mass-calibrated, sensitivity-tested apportionment between pathways rather than an independently validated, uncalibrated emission budget. Second, because these coefficients were fitted to the full hourly series rather than to the single peak value, the instantaneous peak is matched closely at Lanzhou (peak ratio 1.15) but underestimated at Beijing (peak ratio 0.64); this reflects a trade-off between peak fidelity and overall mass/timing agreement that is inherent to a single calibration coefficient, and may also partly reflect the limited spatial extent of the release configuration and general simulation uncertainty. Third, AAI-based dust identification can be affected by aerosol height, surface reflectance, cloud contamination, and absorbing non-dust aerosols. Fourth, CALIPSO profiles are vertically detailed but spatially sparse and cannot continuously capture the full three-dimensional evolution. Fifth, CAMS EAC4 dust fields provide useful independent consistency checks but may smooth local concentration maxima. Sixth, FLEXPART-WRF has no independent terrain representation and relies entirely on WRF’s own terrain-following wind field, and the WRF simulation itself uses grid nudging toward ERA5 rather than assimilating local observations, which may limit the sharpness of frontal and jet-related features. Seventh, this analysis focuses on the Taklamakan and Mongolian Gobi as the two dominant source regions for this event; contributions from other, comparatively minor source regions were not separately quantified. Eighth, Himawari-9’s geostationary viewing geometry (~140.7° E) produces a large, oblique viewing angle over the far-western Taklamakan source region, which can degrade the accuracy of brightness-temperature-based dust-top height retrievals relative to source regions closer to the sub-satellite point. Ninth, the particle-release configuration, while objectively derived from Himawari-9 detection frequency, still leaves room for optimization; complementary Fengyun geostationary observations, which view the Taklamakan region at a less oblique angle, and a peak-detection-based release strategy targeting emission-peak timing rather than frequency-based thresholds alone, could improve future implementations. Tenth, dry and wet deposition were parameterized using FLEXPART-WRF’s standard particle-property-based scheme; because deposition effects accumulate over transport distance and duration, further refinement of the deposition parameterization would likely be particularly valuable for longer-range, multi-day transport applications. Finally, the long-term background analysis is designed to frame the event and identify large-scale variability rather than to replace a dedicated process-based dust emission sensitivity experiment.

5. Conclusions

This study integrated a 2000–2024 spring dust background with a detailed multi-source analysis of the 19–23 March 2023 East Asian dust storm. The long-term DUCMASS diagnostics indicate a broad weakening of East Asian spring dust loading since 2000, with a mean Theil-Sen trend of −1.07 × 10⁻⁶ yr−1 and significant pixels covering 61.87% of the domain. The 2023 event therefore represents a severe episode superimposed on a declining long-term background.
The event developed through a dual-source relay-convergence process. TK dust was emitted first on 19 March and transported southeastward along the Hexi Corridor, whereas MG dust intensified on 21 March and mainly affected North China. Hourly-release forward FLEXPART-WRF trajectory arrays, cross-validated against observed PM10 at both receptors (R = 0.81 at Lanzhou, R = 0.74 at Beijing; event-integrated mass ratio 1.22 and 0.98 respectively), together with TROPOMI AAI, PM10 observations, and CAMS EAC4 dust fields, consistently confirm TK as the dominant contributor at Lanzhou (100% of the calibrated near-surface dust mass during the event peak window; 80.7% over the full 19–25 March period) and MG as the dominant contributor at Beijing (98.4% and 98.1%, respectively).
CALIPSO profiles reveal a complex vertical evolution. Dust was initially concentrated below approximately 6 km near the source region, was lifted to approximately 9 km in the southern part of the plume during long-range transport, remained near 4 km in northern areas, and then descended below 2 km after moving offshore. These changes reflect the combined effects of frontal lifting, orographic forcing, deposition, and downstream mixing.
Topographic blocking strongly regulated the horizontal distribution, transport pathways, and concentration intensity of the dust event. Vertical-velocity, low-level convergence, and upstream/downstream concentration diagnostics on the 9 km domain confirm that the Helan-Longshan mountain system acts as a real barrier that attenuates westward-approaching TK dust (23% decrease in event-integrated total dust column concentration across the range, per Section 3.5), whereas the Yinshan-Daqingshan-Yanshan system primarily channels and lifts MG dust rather than blocking it, allowing broader southeastward transport toward North China. The findings highlight the need to consider long-term variability, dual-source timing, vertical structure, and topographic modulation together when forecasting severe East Asian dust events.
These findings are also subject to several methodological uncertainties and limitations, discussed in detail in Section 4.4; none of them affect the qualitative dual-source, terrain-modulated transport pathway identified in this study, but they should be kept in mind when interpreting the quantitative magnitudes reported here.

Supplementary Materials

The following supporting information can be downloaded at: https://www.mdpi.com/article/10.3390/atmos17080740/s1, Table S1. WRF and FLEXPART-WRF model configuration; Table S2. CALIPSO overpasses intersecting the study domain during the 19–23 March 2023 event; Figure S1. MG source release-height cross-check; Figure S2. AAI detection-threshold sensitivity; Figure S3. CALIOP versus FLEXPART dust vertical structure—time-matched, exploratory comparison; Figure S4. Sensitivity of the calibrated PM10 time series to four independent release configurations; Figure S5. Coefficient of determination (R2) across the four release configurations tested in Figure S4; Figure S6. Station-level model-observation correlation for high-impact monitoring stations; Figure S7. Terrain channeling signature along the Hexi Corridor.

Author Contributions

Conceptualization, Y.R.; methodology, Y.R.; software, Y.R.; validation, G.S.; formal analysis, Y.R., J.H., H.D. and R.L.; investigation, J.H., X.L. and R.C.; resources, X.L.; data curation, H.D. and R.L.; writing—original draft preparation, Y.R.; writing—review and editing, J.H., X.L., G.S. and R.C.; visualization, J.H., H.D. and R.L.; supervision, Y.R.; project administration, Y.R. All authors have read and agreed to the published version of the manuscript.

Funding

This research received no external funding.

Data Availability Statement

Publicly available datasets were analyzed in this study. MERRA-2 DUCMASS was obtained from the NASA Goddard Earth Sciences Data and Information Services Center (GES DISC, https://disc.gsfc.nasa.gov). MAIAC AOD was obtained from the NASA Level-1 and Atmosphere Archive and Distribution System Distributed Active Archive Center (LAADS DAAC, https://ladsweb.modaps.eosdis.nasa.gov). ERA5 reanalysis fields (850 hPa and 10 m wind speed, surface temperature, precipitation, soil moisture) were obtained from the Copernicus Climate Data Store (https://cds.climate.copernicus.eu). NDVI was obtained from the NASA Land Processes Distributed Active Archive Center (LP DAAC, https://lpdaac.usgs.gov). TROPOMI AAI was obtained from the Copernicus Data Space Ecosystem (https://dataspace.copernicus.eu). CALIPSO/CALIOP data were obtained from the NASA Atmospheric Science Data Center (ASDC, https://asdc.larc.nasa.gov). Ground-based PM10 observations were obtained from the China National Environmental Monitoring Centre (https://www.cnemc.cn). CAMS EAC4 reanalysis was obtained from the Copernicus Atmosphere Data Store (https://ads.atmosphere.copernicus.eu). Processed data and model outputs can be made available from the corresponding author upon reasonable request.

Acknowledgments

The authors acknowledge the providers of TROPOMI (Copernicus Data Space Ecosystem), CALIPSO (NASA Atmospheric Science Data Center), ERA5 (Copernicus Climate Data Store), CAMS EAC4 (Copernicus Atmosphere Data Store), MERRA-2 (NASA GES DISC), MAIAC AOD and NDVI (NASA LAADS DAAC and LP DAAC), Himawari-9 (Japan Meteorological Agency), SRTM topography (NASA/USGS), ESA CCI/C3S land cover data, and ground-based PM10 observations (China National Environmental Monitoring Centre) used in this study.

Conflicts of Interest

The authors declare no conflicts of interest.

References

  1. Huang, J.; Minnis, P.; Yan, H.; Yi, Y.; Chen, B.; Zhang, L.; Ayers, J.K. Dust aerosol effect on semi-arid climate over Northwest China detected from A-Train satellite measurements. Atmos. Chem. Phys. 2010, 10, 6863–6872. [Google Scholar] [CrossRef]
  2. Shao, Y.; Dong, C.H. A review on East Asian dust storm climate, modelling and monitoring. Glob. Planet. Change 2006, 52, 1–22. [Google Scholar] [CrossRef]
  3. Hashizume, M.; Kim, Y.; Ng, C.F.S.; Chung, Y.; Madaniyazi, L.; Bell, M.L.; Guo, Y.L.; Kan, H.; Honda, Y.; Yi, S.-M.; et al. Health Effects of Asian Dust: A Systematic Review and Meta-Analysis. Environ. Health Perspect. 2020, 128, 066001. [Google Scholar] [CrossRef] [PubMed]
  4. Meng, Z.; Lu, B. Dust events as a risk factor for daily hospitalization for respiratory and cardiovascular diseases in Minqin, China. Atmos. Environ. 2007, 41, 7048–7058. [Google Scholar] [CrossRef]
  5. Sadeghimoghaddam, A.; Khankeh, H.; Norozi, M.; Fateh, S.; Farrokhi, M. Investigating the effects of dust storms on morbidity and mortality due to cardiovascular and respiratory diseases: A systematic review. J. Educ. Health Promot. 2021, 10, 191. [Google Scholar] [CrossRef] [PubMed]
  6. Wang, S.; Yu, Y.; Zhang, X.-X.; Lu, H.; Zhang, X.-Y.; Xu, Z. Weakened dust activity over China and Mongolia from 2001 to 2020 associated with climate change and land-use management. Environ. Res. Lett. 2021, 16, 124056. [Google Scholar] [CrossRef]
  7. Zhang, C.; Yan, M.; Du, H.; Ban, J.; Chen, C.; Liu, Y.; Li, T. Mortality risks from a spectrum of causes associated with sand and dust storms in China. Nat. Commun. 2023, 14, 6867. [Google Scholar] [CrossRef] [PubMed]
  8. Haugvaldstad, O.W.; Tang, H.; Kaakinen, A.; Bohm, K.; Groot Zwaaftink, C.D.; Grythe, H.; Stevens, T.; Zhang, Z.; Stordal, F. Spatial Source Contribution and Interannual Variation in Deposition of Dust Aerosols Over the Chinese Loess Plateau. J. Geophys. Res. Atmos. 2024, 129, e2023JD040470. [Google Scholar] [CrossRef]
  9. Zhang, Z.; Kuang, Z.; Yu, C.; Wu, D.; Shi, Q.; Zhang, S.; Wang, Z.; Liu, D. Trans-Boundary Dust Transport of Dust Storms in Northern China: A Study Utilizing Ground-Based Lidar Network and CALIPSO Satellite. Remote Sens. 2024, 16, 1196. [Google Scholar] [CrossRef]
  10. Bao, T.; Xi, G.; Hao, Y.; Chang, I.-S.; Wu, J.; Xue, Z.; Jin, E.; Zhang, W.; Bao, Y. The Transport Path and Vertical Structure of Dust Storms in East Asia and the Impacts on Cities in Northern China. Remote Sens. 2023, 15, 3183. [Google Scholar] [CrossRef]
  11. Gong, S.L.; Zhang, X.Y.; Zhao, T.L.; McKendry, I.G.; Jaffe, D.A.; Lu, N.M. Characterization of soil dust aerosol in China and its transport and distribution during 2001 ACE-Asia: 2. Model simulation and validation. J. Geophys. Res. Atmos. 2003, 108, 4262. [Google Scholar] [CrossRef]
  12. Han, J.; Dai, H.; Gu, Z. Sandstorms and desertification in Mongolia, an example of future climate events: A review. Environ. Chem. Lett. 2021, 19, 4063–4073. [Google Scholar] [CrossRef] [PubMed]
  13. Zhang, Y.; Wang, J.; Ochir, A.; Chonokhuu, S.; Togtokh, C. Dynamic evolution of spring sand and dust storms and cross-border response in Mongolian plateau from 2000 to 2021. Int. J. Digit. Earth 2023, 16, 2341–2355. [Google Scholar] [CrossRef]
  14. Mu, F.; Fiedler, S. How much do atmospheric depressions and Mongolian cyclones contribute to spring dust activities in East Asia? npj Clim. Atmos. Sci. 2025, 8, 51. [Google Scholar] [CrossRef]
  15. Tao, M.; Chen, L.; Wang, J.; Wang, L.; Wang, W.; Lin, C.; Gui, L.; Wang, L.; Yu, C.; Wang, Y. Characterization of dust activation and their prevailing transport over East Asia based on multi-satellite observations. Atmos. Res. 2022, 265, 105886. [Google Scholar] [CrossRef]
  16. Guo, J.; Lou, M.; Miao, Y.; Wang, Y.; Zeng, Z.; Liu, H.; He, J.; Xu, H.; Wang, F.; Min, M.; et al. Trans-Pacific transport of dust aerosols from East Asia: Insights gained from multiple observations and modeling. Environ. Pollut. 2017, 230, 1030–1039. [Google Scholar] [CrossRef] [PubMed]
  17. Tan, S.-C.; Li, J.; Che, H.; Chen, B.; Wang, H. Transport of East Asian dust storms to the marginal seas of China and the southern North Pacific in spring 2010. Atmos. Environ. 2016, 148, 316–328. [Google Scholar] [CrossRef]
  18. Tian, R.; Lin, Q.; Li, D.; Zhang, W.; Zhao, X. Atmospheric transport of nutrients during a harmful algal bloom event. Reg. Stud. Mar. Sci. 2020, 34, 101007. [Google Scholar] [CrossRef]
  19. Zhao, T.L.; Gong, S.L.; Zhang, X.Y.; Blanchet, J.-P.; McKendry, I.G.; Zhou, Z.J. A Simulated Climatology of Asian Dust Aerosol and Its Trans-Pacific Transport. Part I: Mean Climate and Validation. J. Clim. 2006, 19, 88–103. [Google Scholar] [CrossRef]
  20. Wang, S.; Yang, X.-Y.; Luo, C. The 2025 Extreme Dust Events in China: Evidence, Attribution, and Implications for Regional Air Quality Assessment. Atmosphere 2026, 17, 213. [Google Scholar] [CrossRef]
  21. Gui, K.; Yao, W.; Che, H.; An, L.; Zheng, Y.; Li, L.; Zhao, H.; Zhang, L.; Zhong, J.; Wang, Y.; et al. Record-breaking dust loading during two mega dust storm events over northern China in March 2021: Aerosol optical and radiative properties and meteorological drivers. Atmos. Chem. Phys. 2022, 22, 7905–7932. [Google Scholar] [CrossRef]
  22. Yin, Z.; Wan, Y.; Zhang, Y.; Wang, H. Why super sandstorm 2021 in North China? Natl. Sci. Rev. 2021, 9, nwab165. [Google Scholar] [CrossRef] [PubMed]
  23. He, Y.; Yi, F.; Yin, Z.; Liu, F.; Yi, Y.; Zhou, J. Mega Asian dust event over China on 27–31 March 2021 observed with space-borne instruments and ground-based polarization lidar. Atmos. Environ. 2022, 285, 119238. [Google Scholar] [CrossRef]
  24. Tian, Y.; Pan, X.; Jing, Y.; Zhang, Y.; Yao, W.; Liu, H.; Lei, S.; Wang, Z. East Asia dust storms in spring 2021: Transport mechanisms and impacts on China. Atmos. Res. 2023, 290, 106773. [Google Scholar] [CrossRef]
  25. Zhang, R.; Wang, M.; Zhang, X.; Zhu, G. Analysis on the chemical and physical properties of particles in a dust storm in spring in Beijing. Powder Technol. 2003, 137, 77–82. [Google Scholar] [CrossRef]
  26. Hu, Z.; Ma, Y.; Jin, Q.; Idrissa, N.F.; Huang, J.; Dong, W. Attribution of the March 2021 exceptional dust storm in North China. Bull. Am. Meteorol. Soc. 2023, 104, E749–E755. [Google Scholar] [CrossRef]
  27. Kang, H.; Zhu, B.; de Leeuw, G.; van der A, R.J.; Lu, W.; Shen, X.; Guo, Z. Source contributions to two super dust storms over Northern China in March 2021 and the impact of soil moisture. Sci. Total Environ. 2024, 950, 175289. [Google Scholar] [CrossRef] [PubMed]
  28. Filonchyk, M. Characteristics of the severe March 2021 Gobi Desert dust storm and its impact on air pollution in China. Chemosphere 2021, 287, 132219. [Google Scholar] [CrossRef] [PubMed]
  29. Liang, S.; Wang, B.; Zhang, Y.; Yang, J.; Haugvaldstad, O.W.; Tang, H. Gobi-sourced dust and dust–climate feedbacks in the March 2023 East Asian storm. Atmos. Res. 2026, 334, 108735. [Google Scholar] [CrossRef]
  30. Chen, Y.; Chen, S.; Bi, H.; Zhou, J.; Zhang, Y. Where is the Dust Source of 2023 Several Severe Dust Events in China? Bull. Am. Meteorol. Soc. 2024, 105, E2085–E2096. [Google Scholar] [CrossRef]
  31. Lin, C.-Y.; Sheng, Y.-F.; Chen, W.-N.; Wang, Z.; Kuo, C.-H.; Chen, W.-C.; Yang, T. The impact of channel effect on Asian dust transport dynamics: A case in southeastern Asia. Atmos. Chem. Phys. 2012, 12, 271–285. [Google Scholar] [CrossRef]
  32. Chen, S.; Zhao, D.; Huang, J.; He, J.; Chen, Y.; Chen, J.; Bi, H.; Lou, G.; Du, S.; Zhang, Y.; et al. Mongolia Contributed More than 42% of the Dust Concentrations in Northern China in March and April 2023. Adv. Atmos. Sci. 2023, 40, 1549–1557. [Google Scholar] [CrossRef]
  33. Xing, Y.; Liu, B.; Wagner, L.E.; Qu, J. Source shifting and contributions to Central East Asia dust events during 2000–2023. Sci. China Earth Sci. 2025, 68, 3804–3816. [Google Scholar] [CrossRef]
  34. Hara, Y.; Yumimoto, K.; Uno, I.; Shimizu, A.; Sugimoto, N.; Liu, Z.; Winker, D.M. Asian dust outflow in the PBL and free atmosphere retrieved by NASA CALIPSO and an assimilated dust transport model. Atmos. Chem. Phys. 2009, 9, 1227–1239. [Google Scholar] [CrossRef]
  35. Xu, X.; Yang, Y.; Xiong, Z.; Gong, J.; Luo, T. Three-Dimensional Distribution and Transport Features of Dust and Polluted Dust over China and Surrounding Areas from CALIPSO. Remote Sens. 2023, 15, 5734. [Google Scholar] [CrossRef]
  36. Liu, D.; Zhao, T.; Boiyo, R.; Chen, S.; Lu, Z.; Wu, Y.; Zhao, Y. Vertical Structures of Dust Aerosols over East Asia Based on CALIPSO Retrievals. Remote Sens. 2019, 11, 701. [Google Scholar] [CrossRef]
  37. Gong, X.; Xiu, D.; Sun, X.; Zhang, R.; Mao, J.; Zhao, H.; Rao, Z. Dust Aerosol Classification in Northwest China Using CALIPSO Data and an Enhanced 1D U-Net Network. Atmosphere 2025, 16, 812. [Google Scholar] [CrossRef]
  38. Huang, J.; Minnis, P.; Chen, B.; Huang, Z.; Liu, Z.; Zhao, Q.; Yi, Y.; Ayers, J.K. Long-range transport and vertical structure of Asian dust from CALIPSO and surface measurements during PACDEX. J. Geophys. Res. Atmos. 2008, 113, D23212. [Google Scholar] [CrossRef]
  39. Gong, S.L.; Zhang, X.Y. CUACE/Dust–An integrated system of observation and modeling systems for operational dust forecasting in Asia. Atmos. Chem. Phys. 2008, 8, 2333–2340. [Google Scholar] [CrossRef]
  40. Jin, J.; Pang, M.; Segers, A.; Han, W.; Fang, L.; Li, B.; Feng, H.; Lin, H.X.; Liao, H. Inverse modeling of the 2021 spring super dust storms in East Asia. Atmos. Chem. Phys. 2022, 22, 6393–6410. [Google Scholar] [CrossRef]
  41. Tang, H.; Haugvaldstad, O.W.; Stordal, F.; Bi, J.; Groot Zwaaftink, C.D.; Grythe, H.; Wang, B.; Rao, Z.; Zhang, Z.; Berntsen, T.; et al. Modelling the 2021 East Asia super dust storm using FLEXPART and FLEXDUST and its comparison with reanalyses and observations. Front. Environ. Sci. 2023, 10, 1013875. [Google Scholar] [CrossRef]
  42. Hsu, S.-C.; Liu, S.C.; Arimoto, R.; Liu, T.-H.; Huang, Y.-T.; Tsai, F.; Lin, F.-J.; Kao, S.-J. Dust deposition to the East China Sea and its biogeochemical implications. J. Geophys. Res. Atmos. 2009, 114, D15304. [Google Scholar] [CrossRef]
  43. Jeong, J.I.; Park, R.J. Efficacy of dust aerosol forecasts for East Asia using the adjoint of GEOS-Chem with ground-based observations. Environ. Pollut. 2018, 234, 885–893. [Google Scholar] [CrossRef] [PubMed]
  44. Wu, Y.; Wen, B.; Li, S.; Guo, Y. Sand and dust storms in Asia: A call for global cooperation on climate change. Lancet Planet. Health 2021, 5, e329–e330. [Google Scholar] [CrossRef] [PubMed]
  45. Xie, X.; Liu, X.; Che, H.; Xie, X.; Wang, H.; Li, J.; Shi, Z.; Liu, Y. Modeling East Asian Dust and Its Radiative Feedbacks in CAM4-BAM. J. Geophys. Res. Atmos. 2018, 123, 1079–1096. [Google Scholar] [CrossRef]
  46. Xue, Y.-B.; Zhang, X.-X.; Lei, J.-Q.; Li, S.-Y.; Liu, L.-Y.; Wang, Z.-F.; Tian, W.-J.; Tang, X.; Chen, X.-S. East Asian dust storm in March 2021: Perspective views from ground observation, satellite measurement and numerical simulation. Atmos. Environ. 2025, 350, 121152. [Google Scholar] [CrossRef]
  47. Pisso, I.; Sollum, E.; Grythe, H.; Kristiansen, N.I.; Cassiani, M.; Eckhardt, S.; Arnold, D.; Morton, D.; Thompson, R.L.; Groot Zwaaftink, C.D.; et al. The Lagrangian particle dispersion model FLEXPART version 10.4. Geosci. Model Dev. 2019, 12, 4955–4997. [Google Scholar] [CrossRef]
  48. Stohl, A.; Forster, C.; Frank, A.; Seibert, P.; Wotawa, G. Technical note: The Lagrangian particle dispersion model FLEXPART version 6.2. Atmos. Chem. Phys. 2005, 5, 2461–2474. [Google Scholar] [CrossRef]
  49. Seibert, P.; Frank, A. Source-receptor matrix calculation with a Lagrangian particle dispersion model in backward mode. Atmos. Chem. Phys. 2004, 4, 51–63. [Google Scholar] [CrossRef]
  50. Chen, S.-H.; McDowell, B.; Huang, C.-C.; Nathan, T.R. Formation of a low-level barrier jet and its modulation by dust radiative forcing over the Hexi Corridor in Central China on March 17, 2010. Q. J. R. Meteorol. Soc. 2021, 147, 1873–1891. [Google Scholar] [CrossRef]
  51. Zhang, X.; Wang, T.; Wang, S.; Jiao, Y.; Tang, J.; Li, J.; Yang, F.; Amonov, M.O.; Abdullaev, S.F. Conducive circulation patterns and transport mechanisms for spring dust from Taklimakan Desert to the Tibetan Plateau. Environ. Int. 2025, 197, 109356. [Google Scholar] [CrossRef] [PubMed]
  52. Rezaei, M.; Farajzadeh, M.; Mielonen, T.; Ghavidel, Y. Analysis of spatio-temporal dust aerosol frequency over Iran based on satellite data. Atmos. Pollut. Res. 2019, 10, 508–519. [Google Scholar] [CrossRef]
  53. Zhen, Y.; Yang, X.; Tang, H.; Shi, H.; Liu, Z. CALIPSO-based aerosol extinction profile estimation from MODIS and MERRA-2 data using a hybrid model of Transformer and CNN. Sci. Total Environ. 2024, 954, 176423. [Google Scholar] [CrossRef] [PubMed]
  54. Breiman, L. Random Forests. Mach. Learn. 2001, 45, 5–32. [Google Scholar] [CrossRef]
Figure 1. Land cover distribution over East Asia (ESA CCI/C3S, 300 m, 2020) with the two objectively delineated dust source regions (TK and MG, from Himawari-derived emission frequency; see Section 2.3) and the receptor and validation stations used in this study: 30 ground PM10 receptor stations at Lanzhou (n = 8) and Beijing (n = 22, black boxes), and 18 source-region validation stations (diamonds, colored by region). Helan Mountains and Yin Mountains are marked as reference ranges for the terrain diagnostics in Section 3.5.
Atmosphere 17 00740 g001
Figure 2. Long-term spring dust background over East Asia during 2000–2024. (a) Mean spring DUCMASS; (b) Theil-Sen trend with Mann-Kendall significant pixels (black dots indicate p < 0.05); (c) correlation between DUCMASS and 10 m wind speed; (d) correlation between DUCMASS and NDVI.
Atmosphere 17 00740 g002
Figure 3. 500 hPa geopotential height (black contours), temperature (red dashed contours, labeled in degrees C), and wind barbs (full barb = 4 m/s) at 00:00 UTC on 19 and 21 March 2023. (a) 19 March; (b) 21 March. Thick red lines mark trough axes; orange and dark-blue outlines mark the TK and MG source regions, respectively; black boxes mark the Lanzhou (LZ) and Beijing (BJ) receptor areas.
Atmosphere 17 00740 g003
Figure 4. Sea-level pressure field distribution (ERA5, hPa; contour interval 2 hPa) from 19 to 22 March 2023, with high—(H) and low—(L) pressure centers marked. (a) 00:00 UTC on 19 March; (b) 12:00 UTC on 20 March; (c) 00:00 UTC on 21 March; (d) 00:00 UTC on 22 March. Orange and dark-blue outlines mark the TK and MG source regions, respectively; black boxes mark the Lanzhou (LZ) and Beijing (BJ) receptor areas.
Atmosphere 17 00740 g004
Figure 5. Horizontal distribution of daily mean TROPOMI AAI from 19 to 22 March 2023. (a) 19 March; (b) 20 March; (c) 21 March; (d) 22 March.
Atmosphere 17 00740 g005
Figure 6. Backward trajectory frequency for the Lanzhou receptor, by day before arrival. Time-integrated particle-density field from an hourly-release backward trajectory array launched from the Lanzhou receptor box. Orange and dark-blue outlines mark the TK and MG source regions, respectively.
Atmosphere 17 00740 g006
Figure 7. Backward trajectory frequency for the Beijing receptor, by day before arrival. Same method as Figure 6, for the Beijing receptor. Orange and dark-blue outlines mark the TK and MG source regions, respectively.
Atmosphere 17 00740 g007
Figure 8. Forward dispersion frequency from the Taklamakan Desert (TK) source, by day after release. Each panel is the time-integrated particle-density field for one day after release (number of trajectory-hours per spatial cell, log scale), computed from an hourly-release trajectory array spanning the emission period. The dashed orange outline marks the objectively delineated TK source region; small red boxes mark the Lanzhou and Beijing receptor areas.
Atmosphere 17 00740 g008
Figure 9. Forward dispersion frequency from the Mongolian Plateau (MG) source, by day after release. Same method as Figure 8, for the MG source region (dashed dark-blue outline).
Atmosphere 17 00740 g009
Figure 10. Hourly observed vs. modeled PM10 (log-log) for the combo full-particle production configuration (extended window + region-spread; TK = 23.37×, MG = 22.07×), with modeled values summed as TK + MG dust at each receptor and the dashed line indicating the 1:1 relationship: (a) Lanzhou; (b) Beijing.
Atmosphere 17 00740 g010
Figure 11. Calibrated TK vs. MG relative contribution to near-surface dust at Lanzhou and Beijing (combo full-particle production configuration), shown over each receptor’s observed peak window, with observed PM10 (solid black, right axis) and the calibrated TK/MG magnitude curves (dashed) overlaid. Integrated over each receptor’s peak window, TK/MG contribute 100%/0% of the calibrated near-surface dust mass at Lanzhou and 1.6%/98.4% at Beijing.
Atmosphere 17 00740 g011
Figure 12. CALIPSO vertical profiles at 16:00 on 19 March 2023: (a) trajectory and 532 nm backscatter coefficient; (b) color ratio; (c) depolarization ratio; (d) vertical feature mask (0 = not detected, 1 = clean marine, 2 = dust, 3 = polluted continental, 4 = clean continental, 5 = polluted dust, 6 = smoke).
Atmosphere 17 00740 g012
Figure 13. CALIPSO vertical profiles at 05:00 on 21 March 2023: (a) trajectory and 532 nm backscatter coefficient; (b) color ratio; (c) depolarization ratio; (d) vertical feature mask (0 = not detected, 1 = clean marine, 2 = dust, 3 = polluted continental, 4 = clean continental, 5 = polluted dust, 6 = smoke).
Atmosphere 17 00740 g013
Figure 14. CALIPSO vertical profiles at 14:00 on 21 March 2023: (a) trajectory and 532 nm backscatter coefficient; (b) color ratio; (c) depolarization ratio; (d) vertical feature mask (0 = not detected, 1 = clean marine, 2 = dust, 3 = polluted continental, 4 = clean continental, 5 = polluted dust, 6 = smoke).
Atmosphere 17 00740 g014
Figure 15. CALIPSO vertical profiles at 02:00 on 22 March 2023: (a) trajectory and 532 nm backscatter coefficient; (b) color ratio; (c) depolarization ratio; (d) vertical feature mask (0 = not detected, 1 = clean marine, 2 = dust, 3 = polluted continental, 4 = clean continental, 5 = polluted dust, 6 = smoke).
Atmosphere 17 00740 g015
Figure 16. CALIPSO vertical profiles at 03:00 on 23 March 2023: (a) trajectory and 532 nm backscatter coefficient; (b) color ratio; (c) depolarization ratio; (d) vertical feature mask (0 = not detected, 1 = clean marine, 2 = dust, 3 = polluted continental, 4 = clean continental, 5 = polluted dust, 6 = smoke).
Atmosphere 17 00740 g016
Figure 17. Spatial distribution of PM10 concentrations across China from 19 to 24 March 2023: (a) 19 March; (b) 20 March; (c) 21 March; (d) 22 March; (e) 23 March; (f) 24 March. Orange and dark-blue outlines mark the TK and MG source regions, respectively; black boxes mark the Lanzhou (LZ) and Beijing (BJ) receptor areas.
Atmosphere 17 00740 g017
Figure 18. CAMS EAC4-simulated surface dust concentrations from 19 to 22 March 2023. (a) 19 March; (b) 20 March; (c) 21 March; (d) 22 March. Orange and dark-blue outlines mark the TK and MG source regions, respectively; black boxes mark the Lanzhou (LZ) and Beijing (BJ) receptor areas.
Atmosphere 17 00740 g018
Figure 19. CAMS dust aerosol vertical cross-sections. (a) 15:00 on 20 March 2023, Helan Mountains; (b) 03:00 on 22 March 2023, Helan Mountains; (c) 21:00 on 22 March 2023, Yinshan Mountains; (d) 03:00 on 23 March 2023, Yinshan Mountains.
Atmosphere 17 00740 g019
Figure 20. ERA5-derived vertical velocity (w) cross-section across the Helan Mountains, rotated to run perpendicular to the true ridge strike (strike = N14 deg E, verified against SRTM 30 m topography), at 06:00 and 18:00 UTC on 20 March 2023.
Atmosphere 17 00740 g020
Figure 21. Low-level (native lowest model level, WRF d02, 9 km) wind convergence along the Hexi Corridor-Helan Mountains-Ordos axis, 19–20 March 2023 (dust event onset).
Atmosphere 17 00740 g021
Figure 22. Helan Mountains terrain cross-section (left) and terrain height map (right) showing the upstream/downstream sampling boxes positioned from the actual 9 km topography.
Atmosphere 17 00740 g022
Table 1. Datasets and variables used in the long-term and event-scale analyses.
CategoryVariable(s)Temporal ScalePurposeData Source/Access
Dust loadingMERRA-2 DUCMASSDaily; spring means, 2000–2024Primary spring dust index and trend analysisNASA GES DISC
Aerosol consistencyMAIAC AODDaily; spring means, 2000–2024Independent aerosol-product consistency checkNASA LAADS DAAC (MAIAC)
Dynamic forcing850 hPa wind speed; 10 m wind speedDaily; spring meansEmission and transport conditionsCopernicus CDS (ERA5)
Thermal/moisture forcingSurface temperature; precipitationDaily; spring meansThermal and wet-removal conditionsCopernicus CDS (ERA5)
Land-surface stabilityNDVI; 0–10 cm soil moisture; surface evaporationMonthly/daily; spring meansVegetation and surface-stability controlsNASA LP DAAC (NDVI); Copernicus CDS (ERA5)
Event-scale observationsTROPOMI AAI; CALIPSO; PM10; CAMS EAC419–23 March 2023Horizontal, vertical, and surface consistency checksCopernicus Data Space (TROPOMI); NASA ASDC (CALIPSO); CNEMC (PM10); Copernicus ADS (CAMS EAC4)
Table 2. Long-term Theil-Sen trends and Mann-Kendall significant-pixel percentages for the main variables.
VariableMean Theil-Sen TrendMedian TrendSignificant Pixels (%)
DUCMASS−1.07 × 10⁻⁶−1.06 × 10−661.87
850 hPa wind speed−0.006−0.00414.00
10 m wind speed−0.003−0.0019.45
Precipitation−8.08 × 10⁻⁶−1.87 × 10−68.27
Surface temperature0.0450.04523.22
Soil moisture−0.0087.61 × 10−416.10
Surface evaporation0.0850.07917.85
MAIAC AOD−0.209−0.54837.38
NDVI0.0020.00135.21
Table 3. Partial-correlation statistics and random forest permutation importance for high-dust identification.
FactorMean Partial Correlation
with DUCMASS
Median Partial
Correlation
Significant Pixels (%)RF Permutation
Importance
850 hPa wind speed0.0350.04811.650.041
10 m wind speed6.07 × 10−4−0.01011.660.012
Precipitation0.0580.05211.100.028
Surface temperature0.1170.13015.050.205
Soil moisture0.0130.0239.670.023
Surface evaporation−0.086−0.09512.090.007
MAIAC AOD0.2050.22516.030.021
NDVI−0.116−0.13015.670.052
Table 4. Event-scale source-receptor evidence derived from FLEXPART-WRF trajectories and multi-source observations.
Receptor/RegionPeak PeriodDominant Source EvidenceInterpretation
Lanzhou21–22 MarchBackward trajectories extend northwestward along the Hexi Corridor and reach TK marginsTK dust was the main contributor to the Lanzhou episode
North China/Beijing22–23 MarchBackward trajectories curve through Inner Mongolia and southern MongoliaMG dust dominated the Beijing and North China impact
North China convergence zone22 MarchAAI, PM10, CAMS, and FLEXPART fields overlap after sequential source activationTK and MG plumes converged and enhanced regional dust loading
Disclaimer/Publisher’s Note: The statements, opinions and data contained in all publications are solely those of the individual author(s) and contributor(s) and not of MDPI and/or the editor(s). MDPI and/or the editor(s) disclaim responsibility for any injury to people or property resulting from any ideas, methods, instructions or products referred to in the content.