Article

A New Time-Based Real Driving Emission (RDE) Evaluation Method for Heavy-Duty Vehicles Focused on NOx Emissions Using Remote Monitoring Data


1
China Automotive Technology and Research Center Co., Ltd., Tianjin 300300, China
2
Key Laboratory for Vehicle Emission Control and Simulation of Ministry of Ecology and Environment, Chinese Research Academy of Environmental Sciences, Beijing 100012, China
*
Authors to whom correspondence should be addressed.
Atmosphere 2026, 17(5), 487; https://doi.org/10.3390/atmos17050487
Submission received: 17 March 2026 / Revised: 6 May 2026 / Accepted: 8 May 2026 / Published: 11 May 2026
(This article belongs to the Special Issue Traffic Related Emission (3rd Edition))

Abstract

The real driving emission (RDE) test is going to be a necessary and effective evaluation method in the next-stage heavy-duty vehicle (HDV) emission standards, the rulemaking of which is under way worldwide (e.g., EPA 2027, Euro 7 and China 7). In this work, a time-based method (TBM) was proposed for future HDV RDE calculation. In TBM, cold-start and hot-run emissions are evaluated separately with moving average windows, yet no type-approval test results are needed so that it can also be used as a remote monitoring algorithm. This study analyzes the emissions of NOx. The value of 0.1 times maximum engine power is utilized to determine the cold-start window, while a 2-bin window structure is adopted for hot-run analysis. In order to further illustrate and validate this method, 16,629.4 h of remote monitoring data with a sampling rate of 1 Hz from 36 China 6 HDVs and 4 different months were analyzed for driving and NOx emission characteristics with TBM. The average duration of the 21,466 trips analyzed in this work was found to be 0.68 h, and the average ratio of trip work to WHTC (world harmonized transient driving cycle) work was around 1.38, indicating that lower duration and work requirements are needed in future RDE test. Moreover, the average cold-start length was approximately 912.4 s (15.2 min), and long cold starts could be found in cases with low ambient temperatures, low driving speeds and frequent stops. As for hot-run analysis, the proportion of Bin 1 (low-load windows) and Bin 2 (high-load windows) is directly related to the driving scenarios. The calculation results of TBM are comparable to the 2-bin method in EPA 2027. In addition, the optimization of NOx emissions under cold start and idle conditions are challenging for future HDV updates.

1. Introduction

In 2025, the production and sales volumes of commercial vehicles in China reached 4.261 million and 4.296 million units respectively [1]. Heavy-duty vehicles (HDV) are facing unique challenges on the path to electrification such as range anxiety for long-haul transportation and longer time to recharge. In 2025, the electrification penetration rate of heavy-duty vehicles in China reached 24%, and that in Europe was about 3.8%. It is estimated that conventional diesel vehicles and hybrid vehicles will still account for more than 50% of HDV new registrations in Europe by 2040 [2]. Therefore, the emission control of HDV remains one of the key tasks of environment management and governance worldwide.
The real driving emission (RDE) test has been proved to be an effective way to evaluate the behavior of a vehicle with real weathers, traffic conditions, road gradients and driving styles compared to tests conducted in the laboratory. The RDE test is normally conducted with the portable emissions measurement system (PEMS) [3,4]. Both the Europe Union and the U.S. Environmental Protection Agency (EPA) have updated their RDE test method and limits in their next-stage HDV emission standards, that is Euro 7 [5] and EPA 2027 [6], respectively. The moving average window (MAW) [7,8] method is commonly utilized to calculate the RDE emission results. The principle of MAW is as follows: the emissions are calculated for sub-sets (known as ‘windows’) of the complete data set. Then the moving average calculations are conducted with a time increment corresponding to the data sampling frequency, which is 1 Hz normally. The MAW method can be categorized into different types based on how the windows are determined, such as the work-based method (WBM), the CO2 mass-based method (CBM), the fuel-based method (FBM) and the binning method.
WBM [9] is being utilized in HDV Euro 6 [10] and HDV China 6 [11]. In WBM, the accumulated engine work measured in each window equals to the engine work for the world harmonized transient driving cycle (WWHTC) [12,13,14]. Mendoza-Villafuerte et al. [15] studied the NOx, NH3, N2O and PN from a Euro 6 HDV and found that up to 85% of the NOx emission measured during the tests were not taken into consideration due to the data exclusion set in Euro 6. Liu et al. [16] compared the HDV PEMS test results with different payloads and two different driving conditions. It was found that increasing the vehicle speed during PEMS tests was beneficial to maintain the SCR temperature.
CBM has been adopted in HDV Euro 6 [10], light-duty vehicle (LDV) Euro 6 [17] and LDV China 6 [18]. For HDV, the measured accumulated CO2 mass in each window equals to the CO2 mass determined for the WHTC, while for LDV, the CO2 mass in each window is equal to half of the CO2 mass over the worldwide harmonized light vehicle test procedure (WLTP) cycle [19]. Valverde et al. [20] derived emission factors from 13 Euro 6b LDVs and found that emissions at cold-start and low-speed phases (urban) tended to be higher for all pollutants. Lee et al. [21] analyzed LDV RDE tests conducted in different seasons and phases. It was concluded that in spring, autumn and summer, the NOx emissions were much higher in the urban phase than in other phases.
A FBM was proposed by Zhang et al. [22] to avoid the trouble caused by the usage of extra parameters in WBM and CBM such as the engine reference torque, the engine work or CO2 mass over a specific duty cycle, which are normally not easy to acquire during the conformity test. In FBM, the accumulated fuel-consumption in each window is a nominal value calculated using their newly proposed algorithm. However, the algorithm requires other parameters like duty cycle fuel consumption, vehicle weight and a so-called ‘WHTC characteristic ratio’. Moreover, the algorithm was designed for the adapted world transient vehicle cycle (C-WTVC), which is composed of three sub-cycles with specific weighting coefficients. This means that the FBM demonstrates more prominent adaptability and application value in emission calculation scenarios under standardized operating conditions.
The binning method is adopted in American standards. A three-bin method (3BM) [23] was proposed by California Air Resources Board (CARB) in its latest HDV emission standard [24]. Based on 3BM, EPA adopted a two-bin method (2BM) in the its HDV emission standard for model year 2027 and later [6]. In both 3BM and 2BM, the window time length is fixed at 300 s. It is claimed that short windows are more sensitive to measurement variability, while long windows in WBM, CBM and FBM make it difficult to distinguish between duty cycles [6]. All the windows are categorized into one of 3 or 2 bins in 3BM or 2BM, respectively, based on the window’s normalized CO2 emission mass. In 3BM, the bins are named as the idle bin, the low-load bin, and the medium-to-high load bin. On the other hand, in 2BM, the idle bin is called ‘Bin 1’ while the low-load bin and the medium-to-high bin are merged into ‘Bin 2’. Furthermore, to calculate the normalized CO2 emission mass of each window, type-approval results like the engine’s federal test procedure (FTP) CO2 family certification level (FCL) value are still needed.
Other requirements that need to be borne in mind when developing the RDE test procedure include the cold-start evaluation, the low-load evaluation, the operation route, the altitude (h), the ambient pressure (Pamb), the ambient temperature (Tamb), the payload and the test duration, etc. The comparison of HDV RDE test requirements between Euro 6, China 6, the CARB standard and EPA 2027 is shown in Table 1. It can be seen that the development trend of HDV RDE test is to include the cold-start and low-load evaluation as well as to remove the route and payload restrictions. Although the window average power (Pave) threshold has been reduced from 10% to 6% of the maximum engine power (Pmax) in Euro 7 [5], low-load conditions and payload less than 10% are not evaluated in both WBM and CBM.
The HDV China 7 rulemaking was launched in 2021 and the update of RDE test requirement has been studied since then. Based on the analysis above, the China 7 RDE program objectives are as follows:
  • Remove the route and payload restrictions;
  • Include the cold-start and low-load emission evaluation;
  • Update the hot-run emission calculation method so that it can also be utilized as the remote monitoring algorithm [25];
  • Avoid using type-approval results such as the engine work, the fuel consumption or the CO2 emission mass, which are typically not easy to acquire during the conformity test in China.
Thus, inspired by 3BM and 2BM, a time-based method (TBM) was proposed in the program to meet the above objects. In addition, remote monitoring technology was adopted in China 6 [11] to acquire HDV in-service operating and emission data over the entire useful life by 1 Hz wirelessly. In this work, the TBM is introduced and compared with 2BM in terms of cold-start and hot-run analysis based on trip characteristics using remote monitoring data.

2. Materials and Methods

2.1. Calculation Method

In the TBM, the test data are divided into two parts: the cold start phase and the hot run phase. Given the significant differences in emission characteristics between these two operating stages, this study subjected to separate quantitative evaluation to fully capture the real-world emission performance of heavy-duty vehicles.

2.1.1. Cold Start Emission Calculation

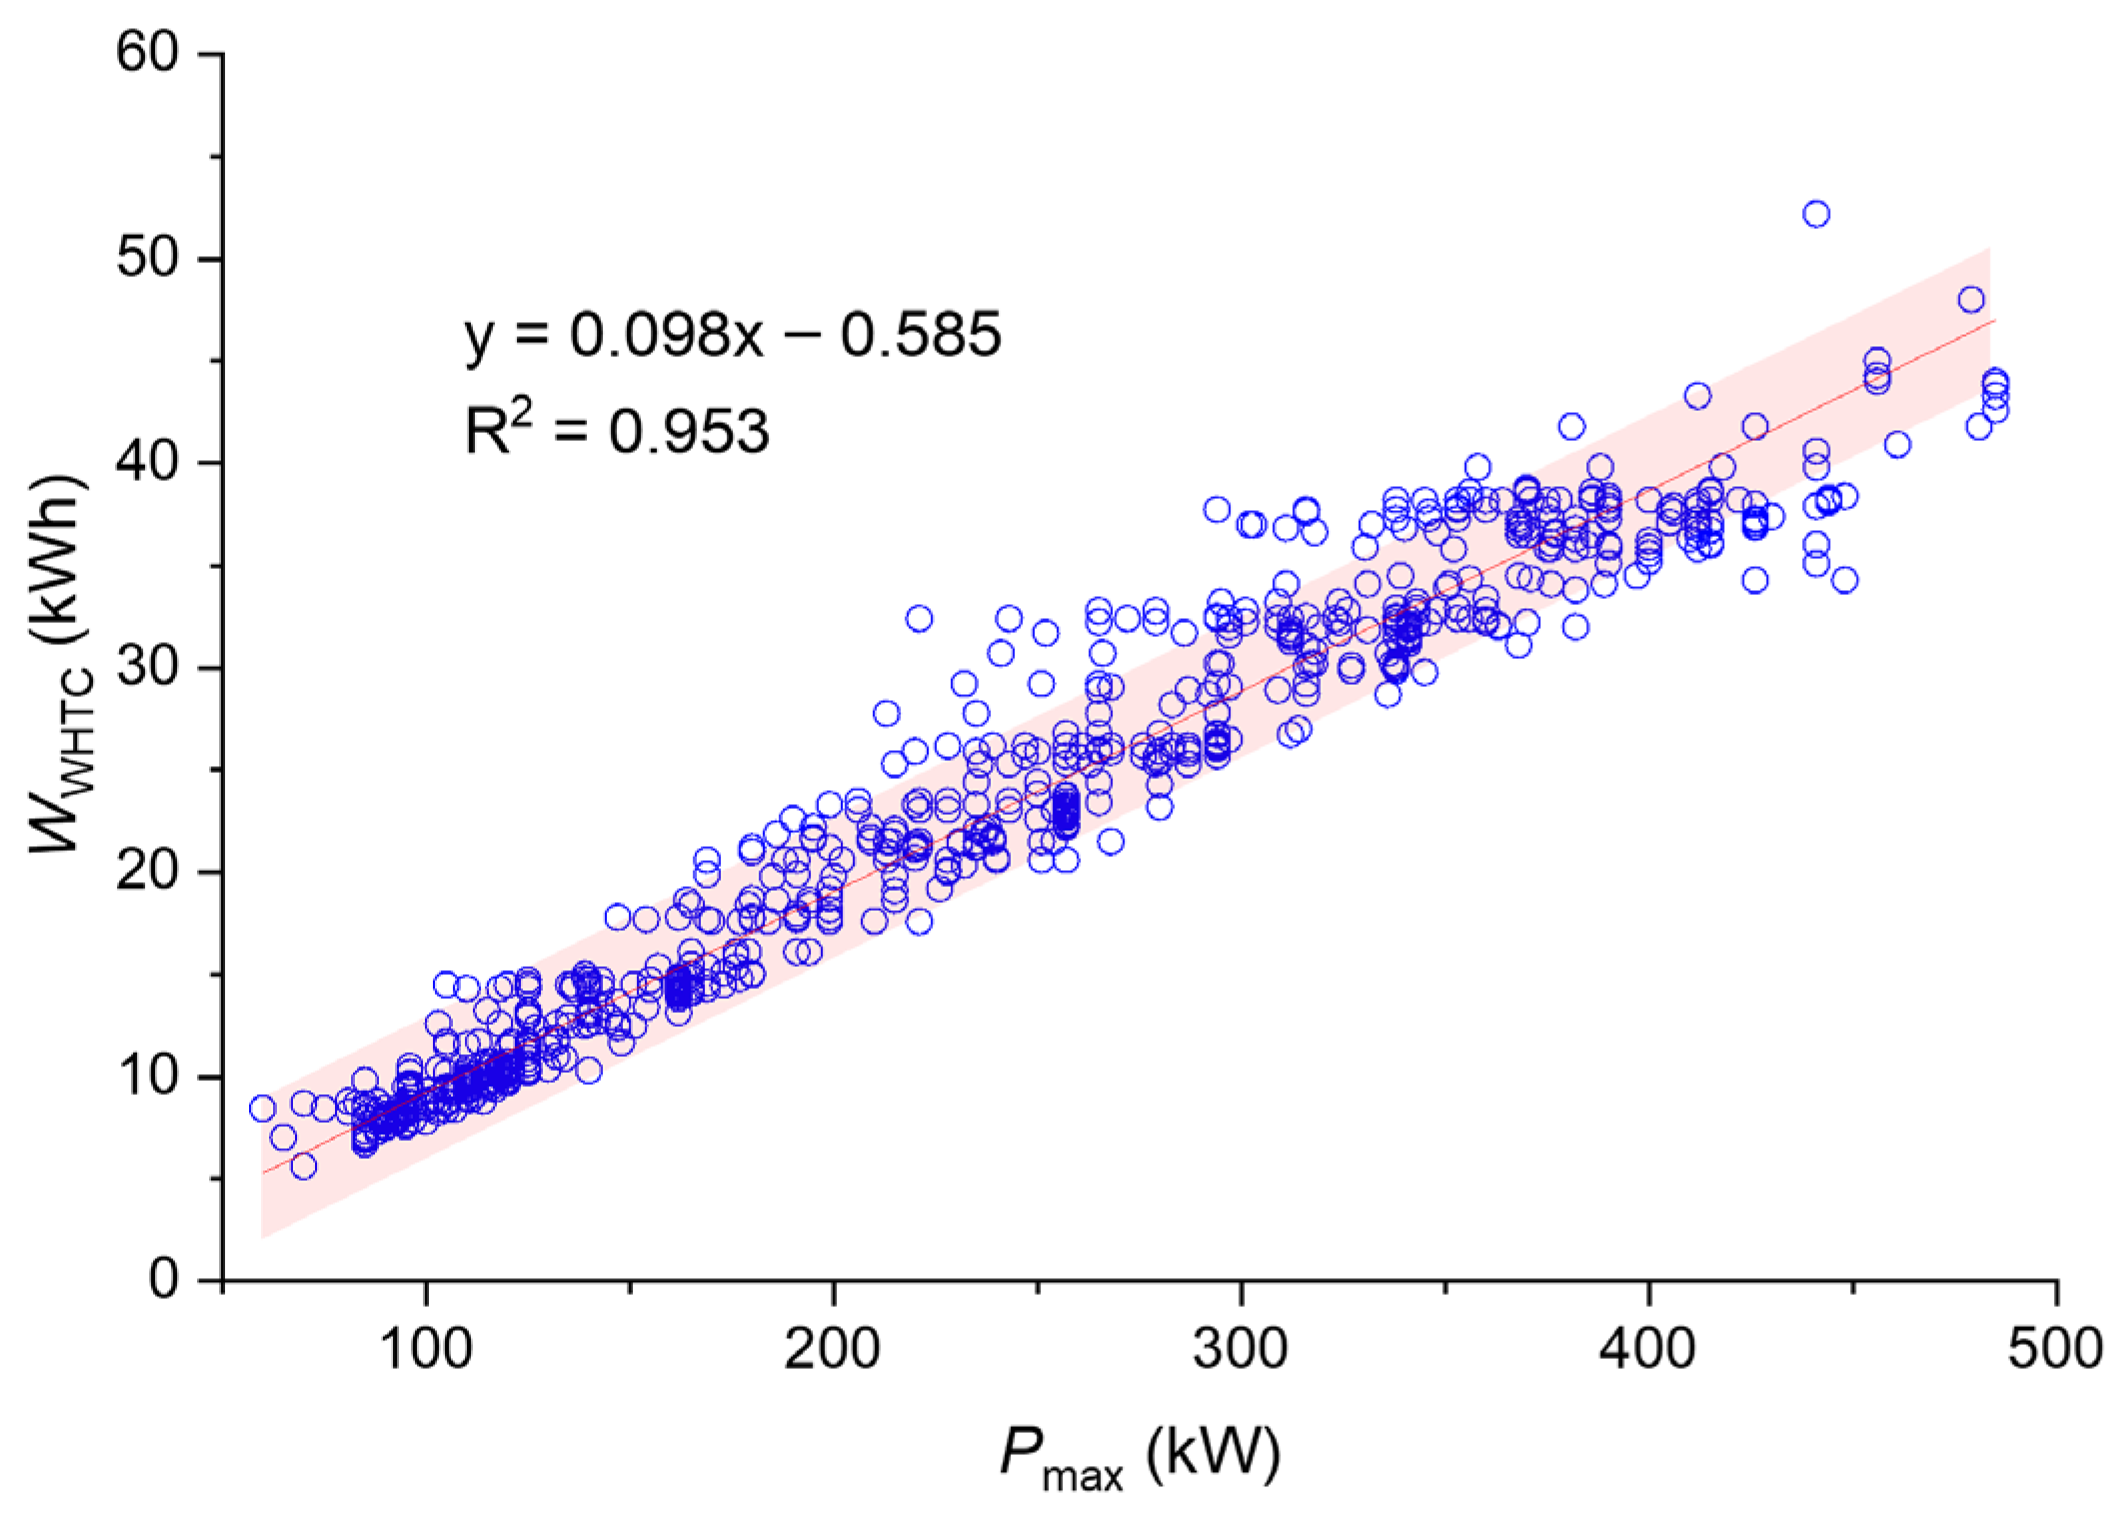
The RDE test should begin with a cold start (for example, Tcoolant ≤ 30 °C or Tamb + 2 °C). The goal of this part is to evaluate the cold-start emission performance in a comparable process as the cold-start WHTC test, which is to be reserved in China 7, so that the emission limits can be comparable. To achieve this goal, normally the cold start window is conventionally defined as defined as the first window whose accumulated engine work equals to WWHTC. However, since type-approval results are unavailable for application and as noted previously, the value of 0.1 × Pmax is utilized to determine the cold-start window’s engine work instead of WWHTC. The coefficient of 0.1 is adopted because the fitted slope between WHTC work and maximum engine power (Pmax) is 0.098, which is approximately equal to 0.1. This selection is justified by fitting WWHTC and Pmax of 46,576 engine models in China, it was found that WWHTC is basically the same value as 0.1 × Pmax (as shown in Figure 1) and Pmax is easy to find on the engine nameplate. Note that the numerical value of 0.1 × Pmax is used as the engine work for the cold-start window (Wcold), which has been verified to be equivalent to the WHTC work in value.
After determining the cold-start window, the cold-start emission quantities are calculated using the following equation:
e x , c o l d = t = 1 t c o l d ( m x , t × t ) t = 1 t c o l d ( P t × t ) × 3600
where: e x , c o l d is the cold-start emission quantity (g/kWh) of a pollution where subscript ‘x’ refers to the pollution (HC, CO, NOx, PM, etc.), t is the second indexing variable, t c o l d is the cold-start duration (s), t is equal to the data sampling rate (1 s), m x , t is the mass emission rate of pollution x (g/s), P t is the net engine power (kW) calculated by the following equations:
P t = π × T n e t , t × n t 30000
T n e t , t = { T r e f × ( T a c t , t T f r i , t ) ÷ 100 , T a c t , t T f r i , t 0 , T a c t , t T f r i , t
where: T n e t is the engine net torque (Nm), n t is the engine speed (r/min), T r e f is the engine reference torque (Nm), T a c t is the engine actual torque (%), T f r i is the engine friction torque (%).

2.1.2. Hot Run Emission Calculation

As mentioned above, the China 7 standard will lift nearly all constraints on test routes and payloads. Therefore, the binning method is a more appropriate approach for hot-run emission evaluation. The procedure to perform the TBM hot-run evaluation are as follows:
Step 1: determination of the averaging window. In TBM, the window is fixed at 300 s, which is also utilized in 3BM and 2BM.
Step 2: calculate the window average power using the following equation for each window:
P a v e = t = 1 t w i n ( P t × t ) t w i n
where: P a v e is the window average power (kW), t w i n is the window length (300 s).
Step 3: window binning. Categorize each window into one of the two bins: Bin 1 ( P a v e ≤ 0.06 × P m a x ) or Bin 2 ( P a v e > 0.06 × P m a x ). Note that unlike 3BM or 2BM, the window is categorized based on P a v e rather than the normalized CO2 emission mass so that the CO2 FCL value is no longer needed in TBM.
Step 4: calculation of emission quantities. The emission quantity for Bin 1 is the mass emission rate (g/h) calculated by the following equation:
e x , B i n 1 = i = 1 n B i n 1 t = 1 t w i n ( m x , t × t ) n B i n 1 × t w i n
where: n B i n 1 is the number of windows in Bin 1.
The emission quantity for Bin 2 is the specific emission mass (g/kWh) for a given pollutant calculated by the following equation:
e x , B i n 2 = i = 1 n B i n 2 t = 1 t w i n ( m x , t × t ) i = 1 n B i n 2 t = 1 t w i n ( P t × t )
where: n B i n 2 is the number of windows in Bin 2.

2.1.3. NOx Emission Calculation

In this study, the raw NOx data collected by the remote monitoring terminal are concentration values (ppm), which need to be converted into NOx mass emission rates (g/s) for emission calculation. The calculation steps are as follows:
m N O x , t = u N O x × c N O x , t × q m e w , t × 10 3
where: m N O x , t is the emission rate of NOx (g/s), u N O x is the ratio of exhaust component density to exhaust gas density, c N O x , t is the instantaneous NOx concentration at time t (ppm), q m e w , t is the instantaneous exhaust mass flow rate at time t (kg/s).
The instantaneous exhaust mass flow rate is obtained by summing the intake air mass flow rate and the fuel mass flow rate, as shown in the following formula:
q m e w , t = q m a w , t + q m f , t
where:   q m e w , t is the instantaneous exhaust mass flow rate at time t (kg/s), q m a w , t is the instantaneous intake air mass flow rate at time t (kg/s), q m f , t is the instantaneous fuel mass flow rate at time t (kg/s).

2.1.4. CO2 Emission Calculation

The vehicle remote monitoring terminal acquires operational parameters including NOx concentration, instantaneous fuel consumption, intake air flow, rotational speed and torque. Without equipped CO2 sensors, direct measured CO2 emission rate are unavailable. To support working condition division for the 2BM and subsequent methodological comparison, referring to the fuel emission accounting specifications specified in GB 30510-2024 [26] and the mass balance principle of fuel combustion, the CO2 mass emission rate is indirectly calculated based on field-collected instantaneous fuel consumption data. The relevant calculation formula is presented below:
m C O 2 , t = F f u e l , t × K C O 2 3600
where: m C O 2 , t is the emission rate of CO2 (g/s), F f u e l , t is the instantaneous fuel consumption collected by the remote monitoring system (L/h), K C O 2 is the carbon emission conversion coefficient for fuel, adopting the general fixed value specified in national standards.

2.2. Data Source

In this work, remote monitoring data are utilized for analysis. The vehicle operating data are collected from 36 China 6 HDVs of 8 different vehicle models covering a wide range of gross vehicle weights (GVW). The vehicle specifications are shown in Table 2. The total data length is about 16,629.4 h with a sampling rate of 1 Hz. For each vehicle, the operating data are from 4 separated months (January, April, July, and October) of one same year representing different seasons. These four months were selected as they represent the first month of each quarter in Beijing, presenting significant differences in ambient temperature [27]. Ambient temperature is a key meteorological factor affecting the cold-start characteristics and NOx emissions of heavy-duty vehicles. Conducting emission tests under different seasonal temperature conditions is of great significance for evaluating real-road emission levels [28]. The driving route and payload are based on the vehicle’s daily usage scenarios. At present, NOx sensors are the only emission sensors that are widely installed on HDVs [29]; therefore, only NOx emissions are collected in the remote monitoring requirements and calculated in this work.
The data analysis procedure is as follows:
Step 1: delete invalid data when the engine is shut down ( n t = 0 ).
Step 2: trip characteristics analysis. In this work, a trip is defined as the continuous operating process between an engine start-up and the following engine shutdown. The interval between two trips should be over 30 s, otherwise the interval is thought to be caused by data transmission loss or temporary engine shutdown and these two trips are merged into one. Only trips longer than 5 min are considered in this work.
Step 3: cold-start analysis. As in Euro 6 [10] and China 6 [11], the cold start is defined as the first part of a trip with the coolant temperature rising from below 30 °C to reach 70 °C for the first time. If the initial coolant temperature of a trip exceeds 30 °C, this trip is excluded from the cold start characteristics analysis. For trips that meet the screening criteria, this study extracts the key performance indicators of the cold-start phase and conducts statistical analysis on these indicators to characterize the emission behaviors during the cold-start phase.
Step 4: hot-run analysis. In this part, the hot-run calculation results of TBM are evaluated for each trip and compared with 2BM.

3. Results and Discussion

3.1. Trip Characteristics

In this section, a quantitative analysis is performed on multiple key operational parameters for each individual driving trip, including core indicators such as trip duration, work, and speed distribution characteristics.
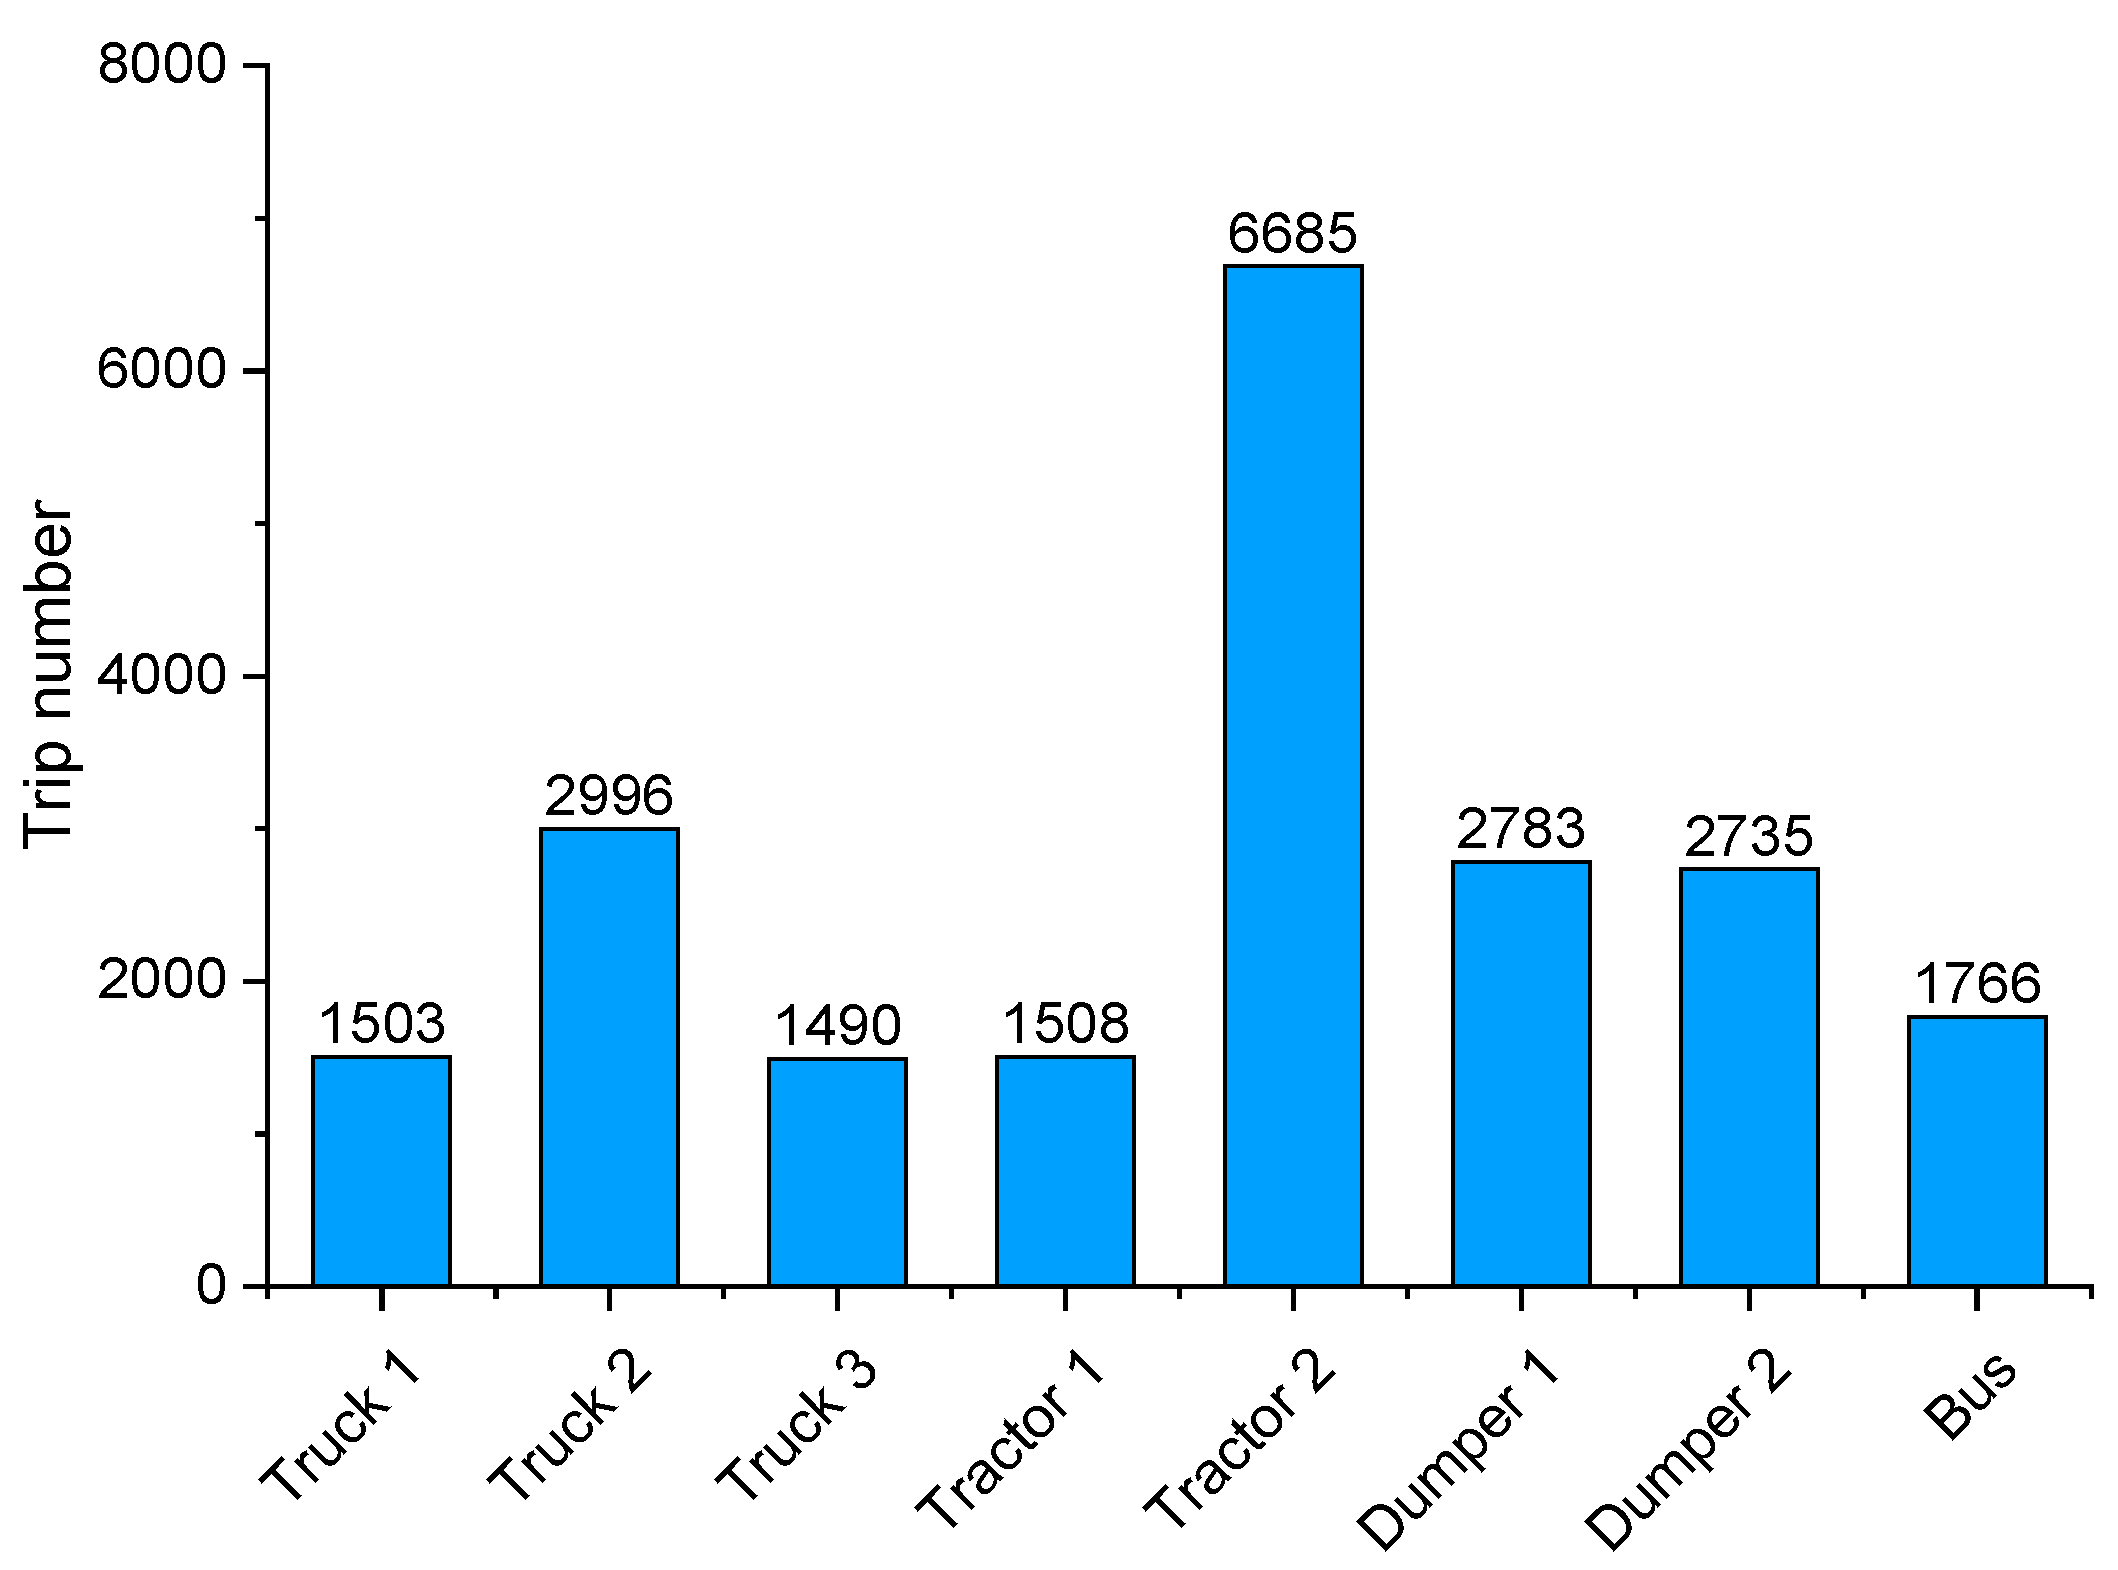
In this study, the trip is defined based on whether the engine is running so that temporary vehicle stops can be included. The total trip number analyzed in this work is 21,466, with the total trip number for each vehicle model presented in Figure 2. The number of trips for Truck 1, Truck 3 and Tractor 1 is about 1500. Since the data length of Tractor 2 is the longest (see Table 2), the trip number of Tractor 2 is found to be 6685. Afterall, the trip numbers of all vehicle models are large enough to represent their daily operation conditions.
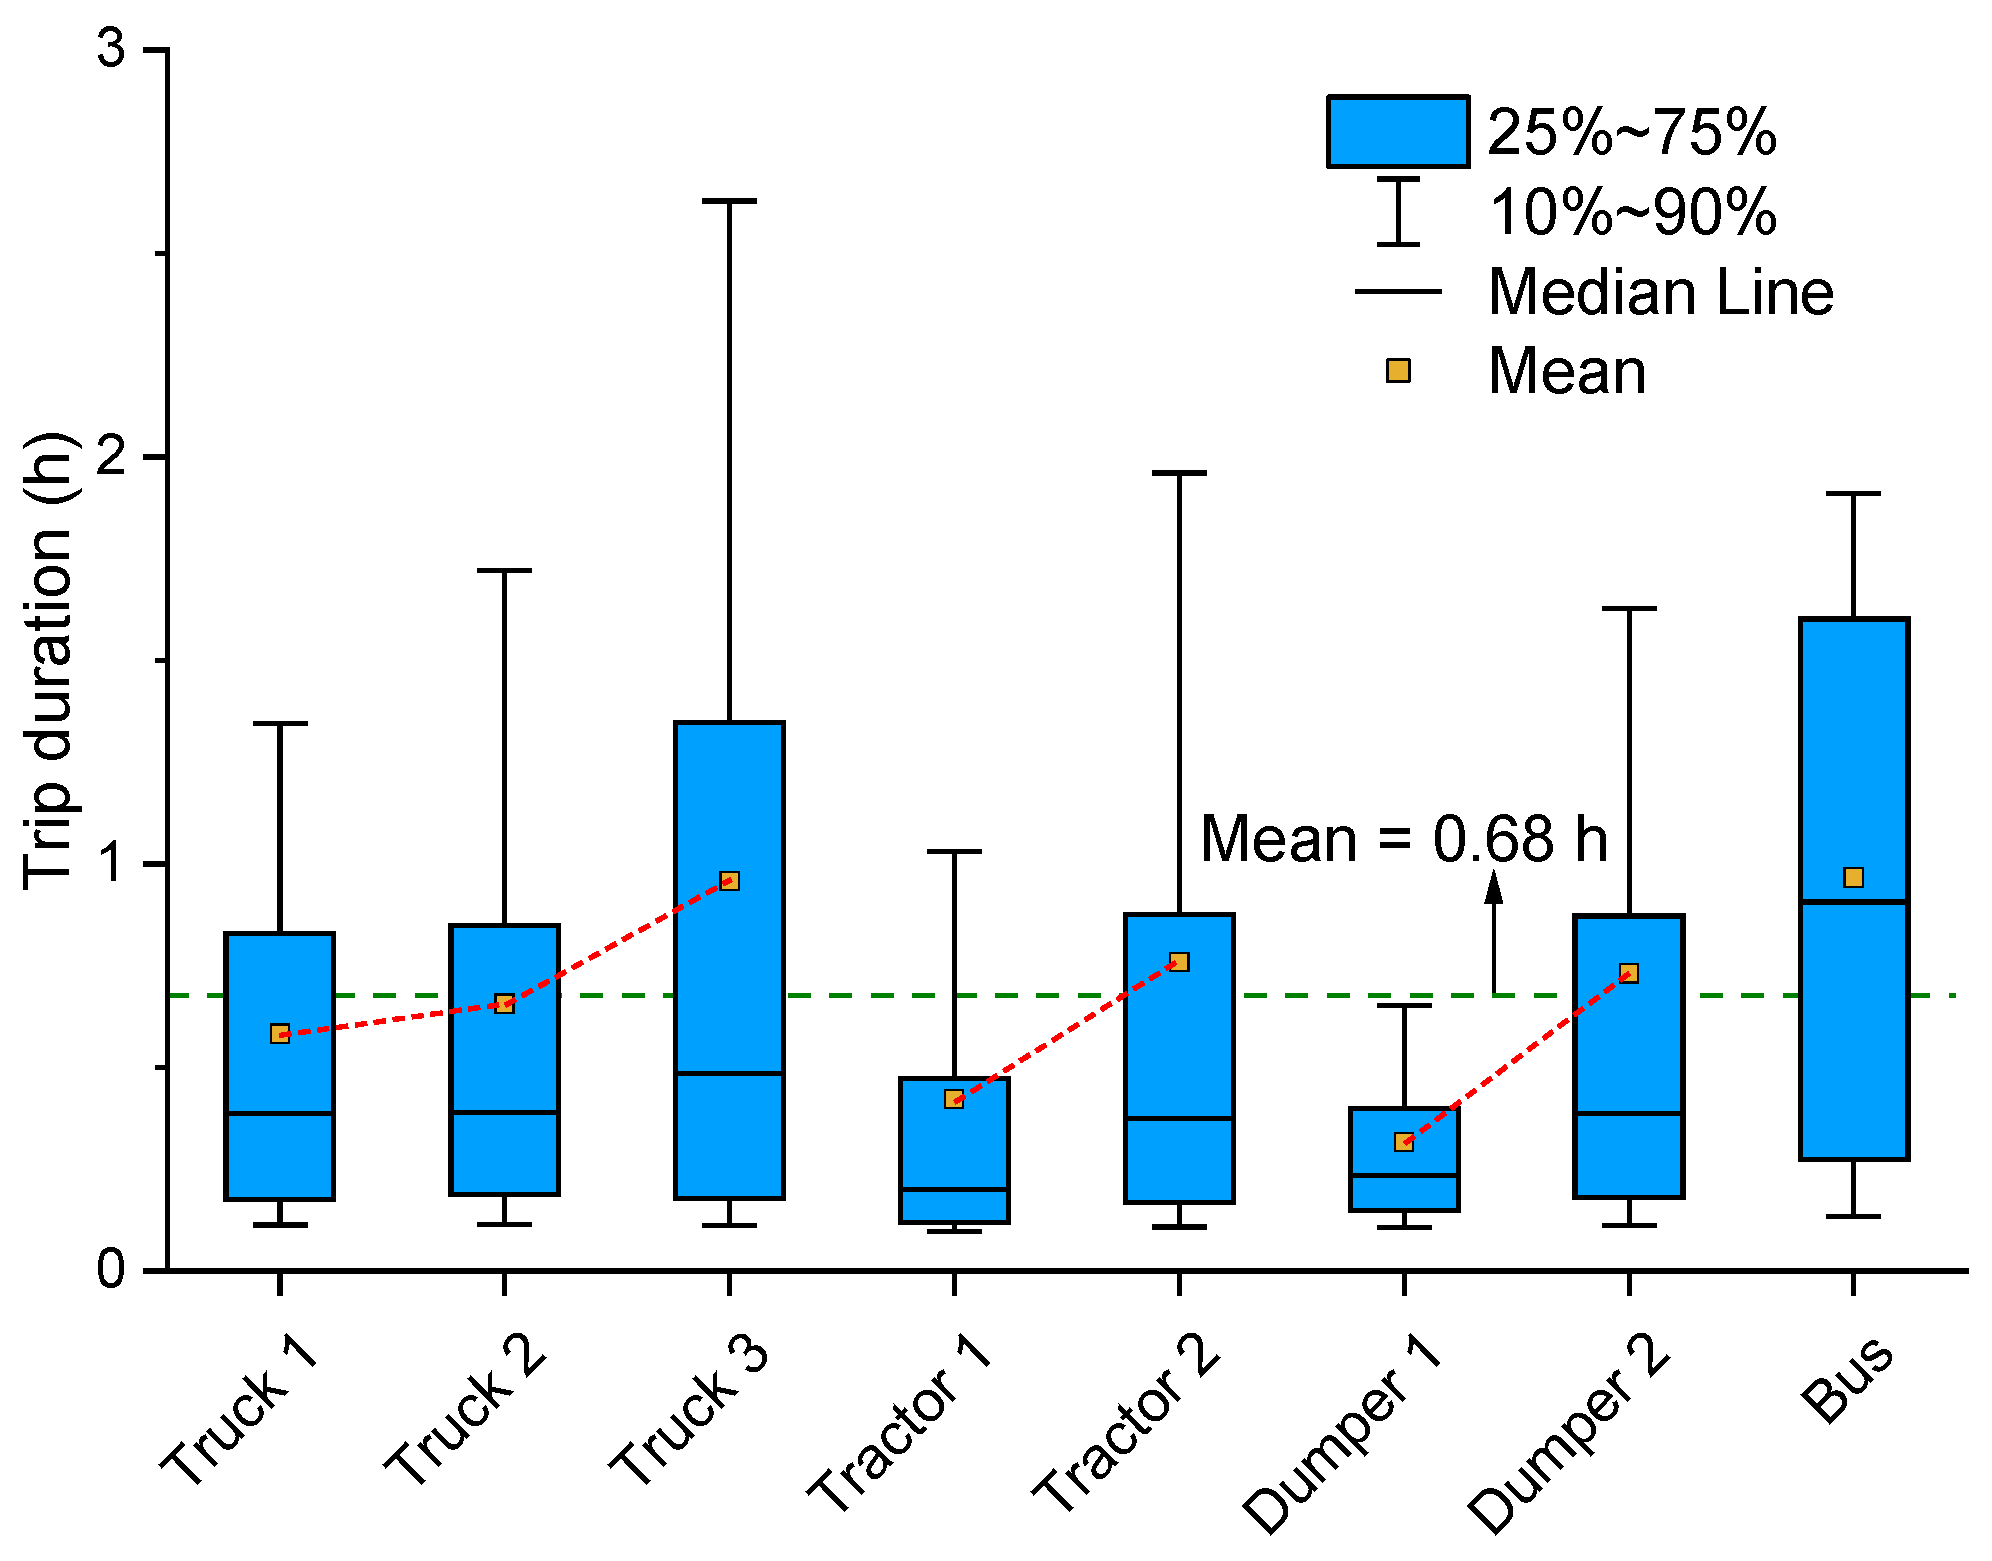
The statistical analysis results of driving trip durations for each vehicle models are presented in Figure 3. As illustrated, most trip durations of these vehicle models fall within the range of 0~3 h. The average trip duration of all 36 vehicles is approximately 0.68 h. Furthermore, for a specific vehicle model, the average trip duration seems to increase as gross vehicle weights grows indicating that gross vehicle weights is related to the vehicle’s working scenario. Vehicles with lower gross vehicle weights are normally utilized in urban area for short hauling, while generally speaking, long haulers are HDVs with higher gross vehicle weights.
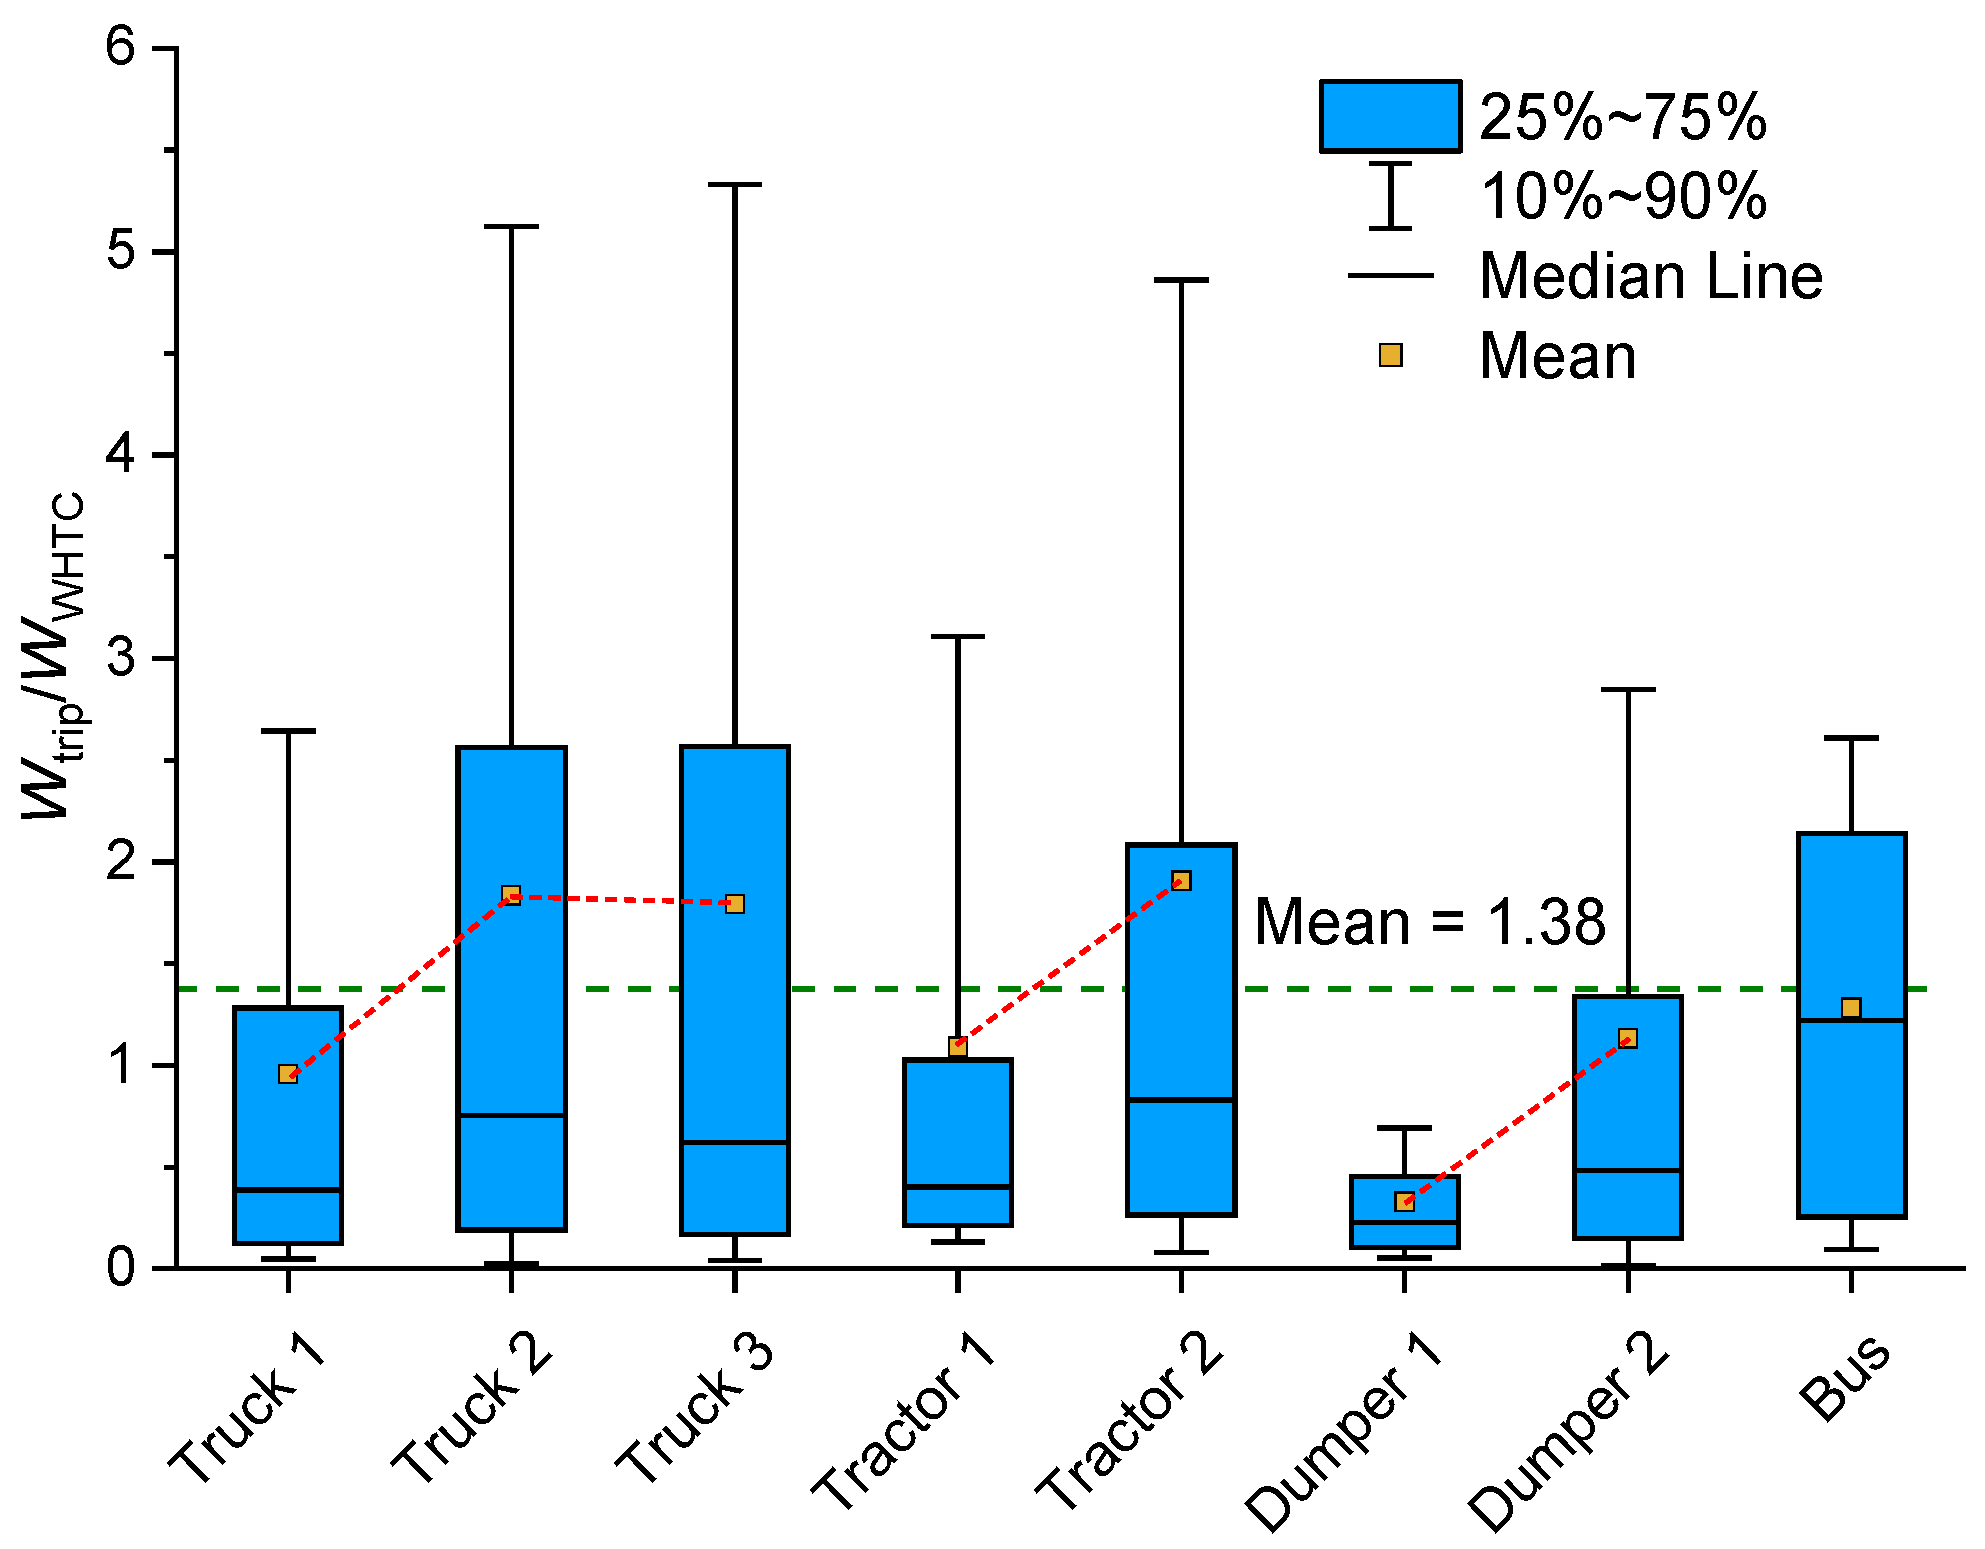
The ratios of the work performed during each trip to the work performed during the WHTC (hereafter as ‘Wtrip/WWHTC’), is presented in Figure 4. In both Euro 6 [10] and China 6 [11], the duration of RDE tests shall be sufficient to complete between 4 and 7 times WWHTC. However, the actual Wtrip/WWHTC ranges from 0 to 6 with an average value of 1.38. Therefore, lower test duration limits are being considered during the rulemaking of China 7 aiming to minimize the time and cost associated with RDE test implementation when conducting RDE tests. In addition, just like the trip duration, Wtrip/WWHTC exhibits a positive correlation as gross vehicle weights grows.
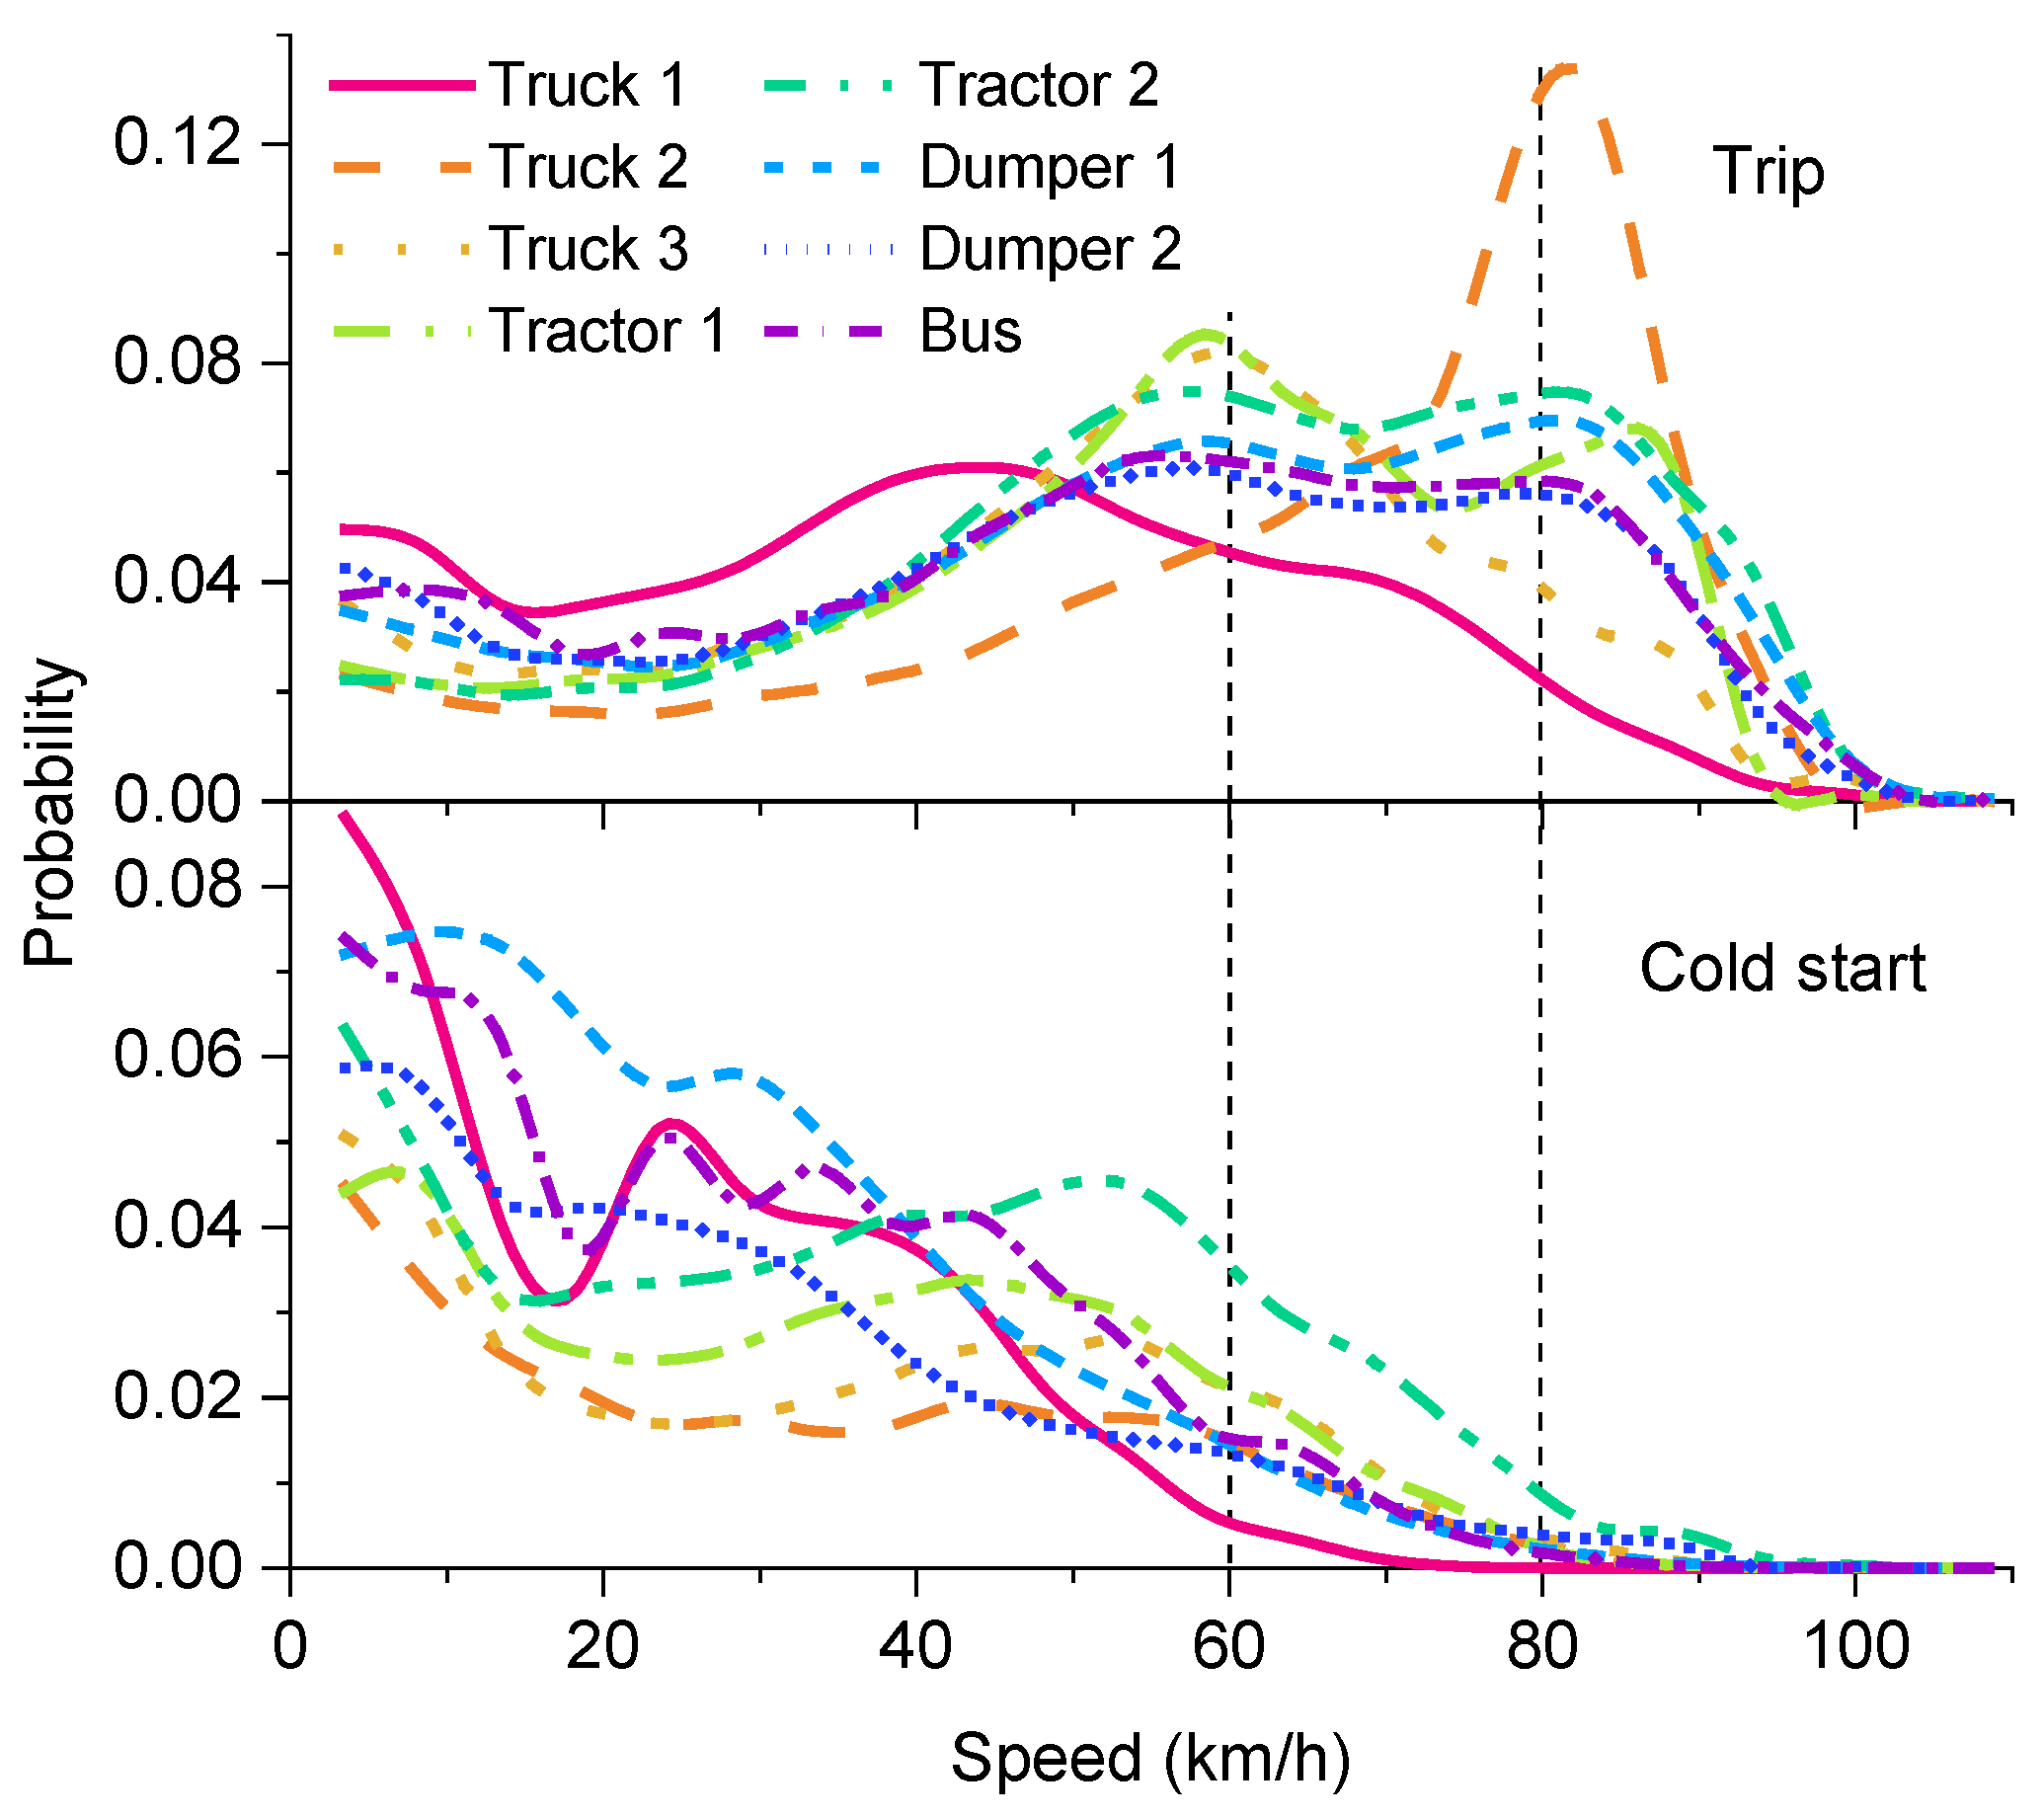
Figure 5 illustrates the speed distribution profiles of driving trips and cold-start across each vehicle model. In China, the speed limits for urban, rural and motorway roads are normally 60 km/h, 80 km/h and 100 km/h for HDV, respectively. It is inferred that Truck 1 and Truck 3 mainly work in the urban area since their typical operating speeds are about 45 km/h and 60 km/h, respectively. In contrast, the remaining vehicle models are engaged in intercity transportation tasks, operating not only in urban areas but also on motorways; this is reflected by an additional speed peak observed at speeds exceeding 80 km/h in their distribution profiles. As for cold starts, the vehicle speeds are commonly less than 60 km/h. Therefore, vehicles tend to operate in low loads during cold starts, which leads to low efficiency of the exhaust aftertreatment system in converting pollutants into harmless substances, resulting in significant emission concerns.

3.2. Cold Start Performance and Emission Characteristics

In this section, the cold-start characteristics of HDVs are elaborated, aiming to lay a theoretical and data foundation for defining the cold-start window in the TBM emission evaluation method and realizing comparable assessment of cold-start emissions aligned with the China 7 standard.
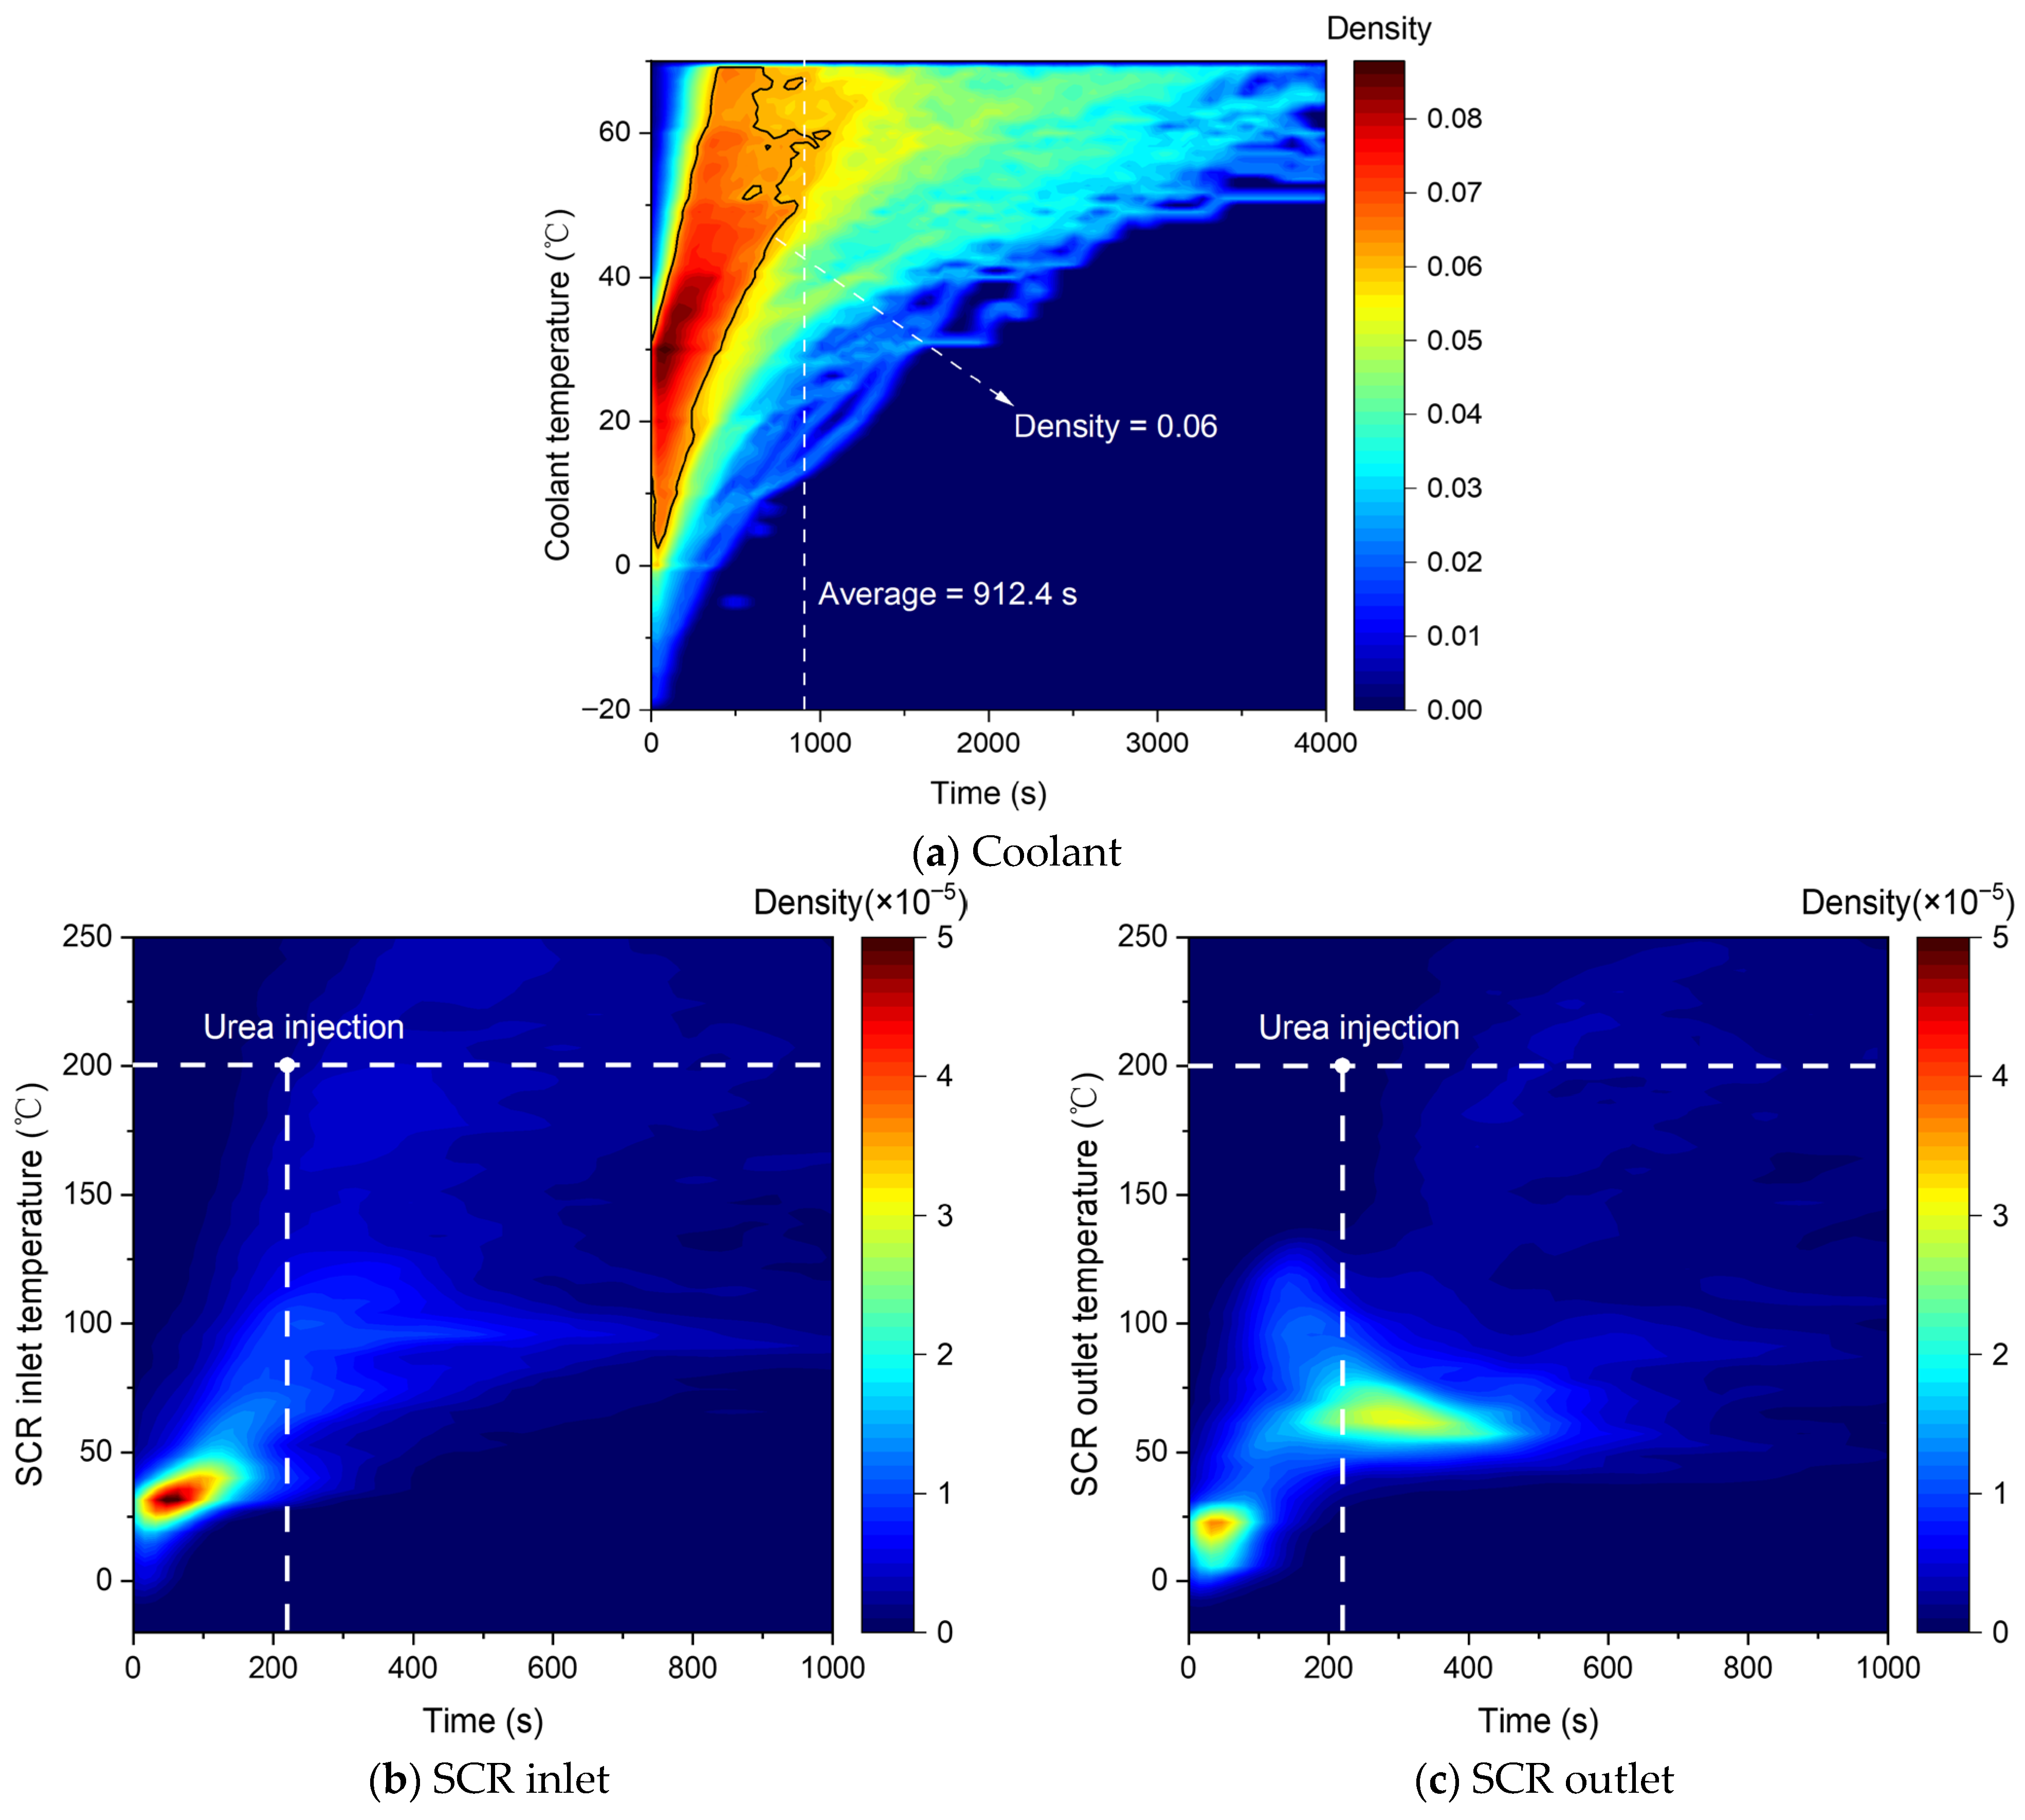
The temperature distributions of the engine coolant and of the inlet and outlet of the selective catalytic reduction (SCR) system are illustrated in Figure 6. By integrating the temperature time curves of all cold-start phases and performing kernel density analysis based on these curves, the corresponding kernel density distribution profiles are obtained in this study. From Figure 6a, it can be seen that most coolant warm-up processes are finished in 1200 s (20 min). The average duration of all cold starts is approximately 912.4 s (15.2 min). In some cases, especially with low ambient temperatures, low driving speeds and frequent stops, the cold start could last more than 3600 s (1 h) and the coolant temperature is still less than 70 °C. Note that the contour line where the density equals to 0.06 is selected to represent the distribution for later comparison. As for the aftertreatment system, from Figure 6b,c, it is clearly shown that the SCR inlet temperature tends to be higher than the outlet temperature. On one hand, the SCR system needs to absorb energy from the exhaust gas to heat up. On the other hand, the reduction reaction in SCR is endothermic. It is illustrated that it takes as rapid as about 200 s for the SCR inlet temperature to reach 200 °C and start the urea injection.
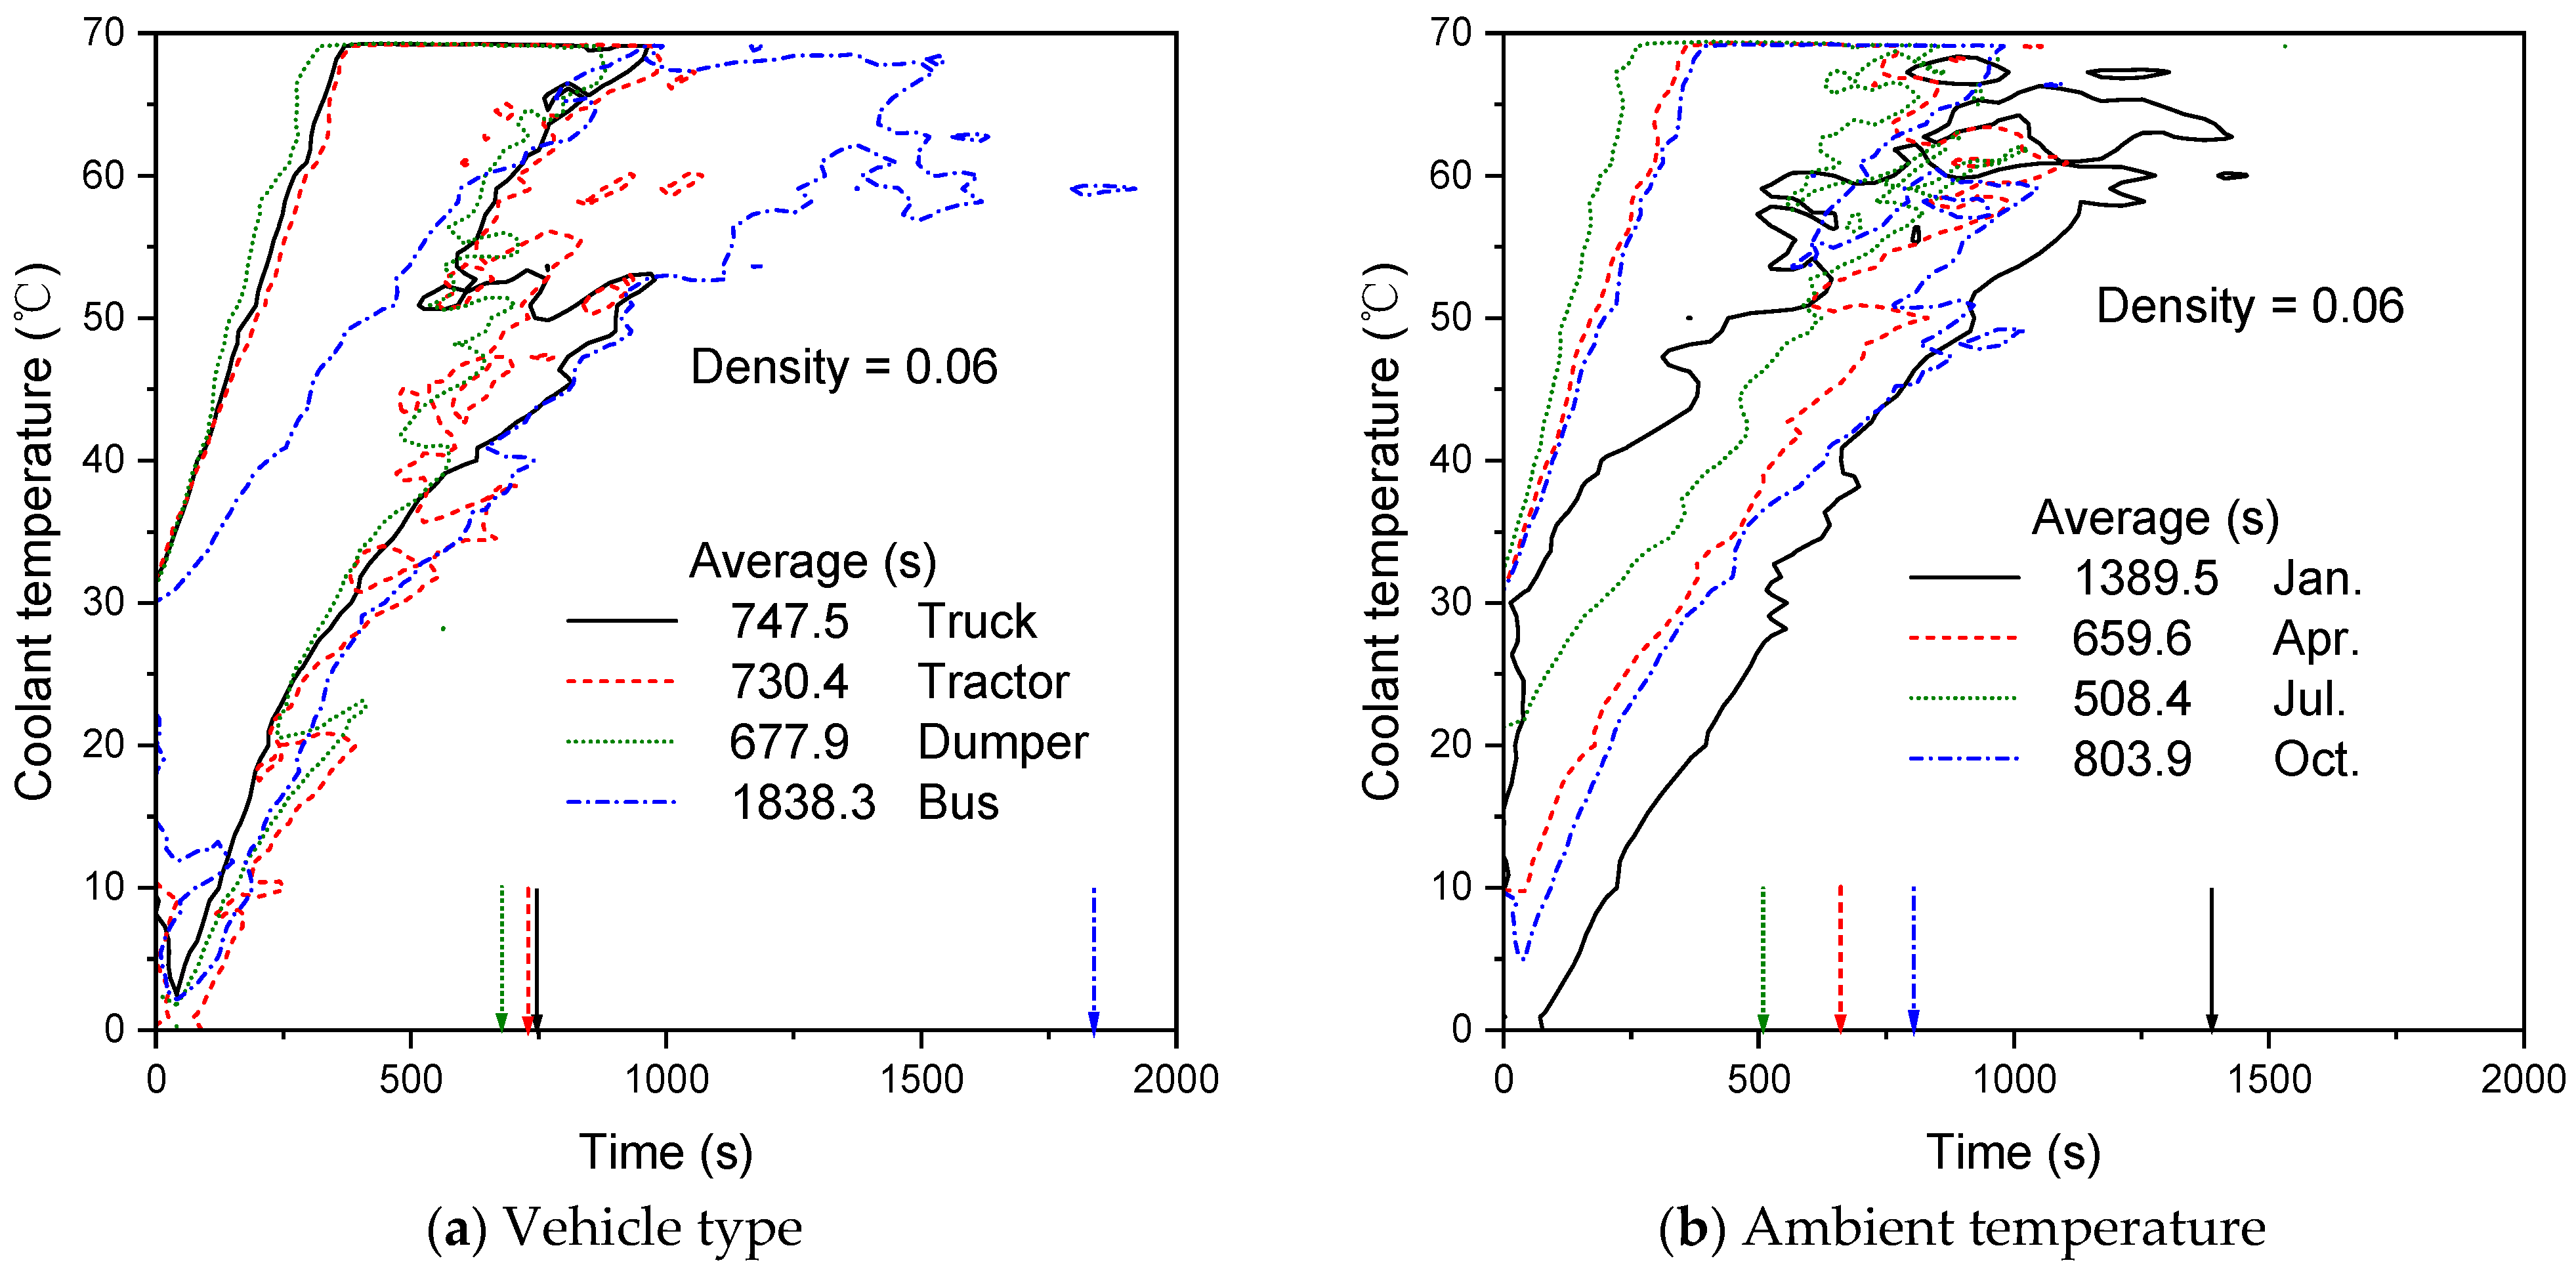
The coolant temperature distribution profiles (density = 0.06) across different vehicle types (truck, tractor, dumper, and bus) and months (January, April, July, and October) are presented in Figure 7. As shown in Figure 7a, the coolant temperature of dumpers is rising the fastest with an average cold-start length of about 677.9 s due to the fact that dumpers are always operating at high loads. In contrast, the cold-start coolant temperature distribution of trucks and tractors is close, while buses tend to have longer cold-start duration (1838.3 s) since the bus vacancy rate is relatively high in China resulting in low engine loads. Moreover, as expected, as the ambient temperature increased from January to July (Figure 7b), the initial coolant temperature rises obviously, and the average cold-start duration decreases from 1389.5 s to 508.4 s.
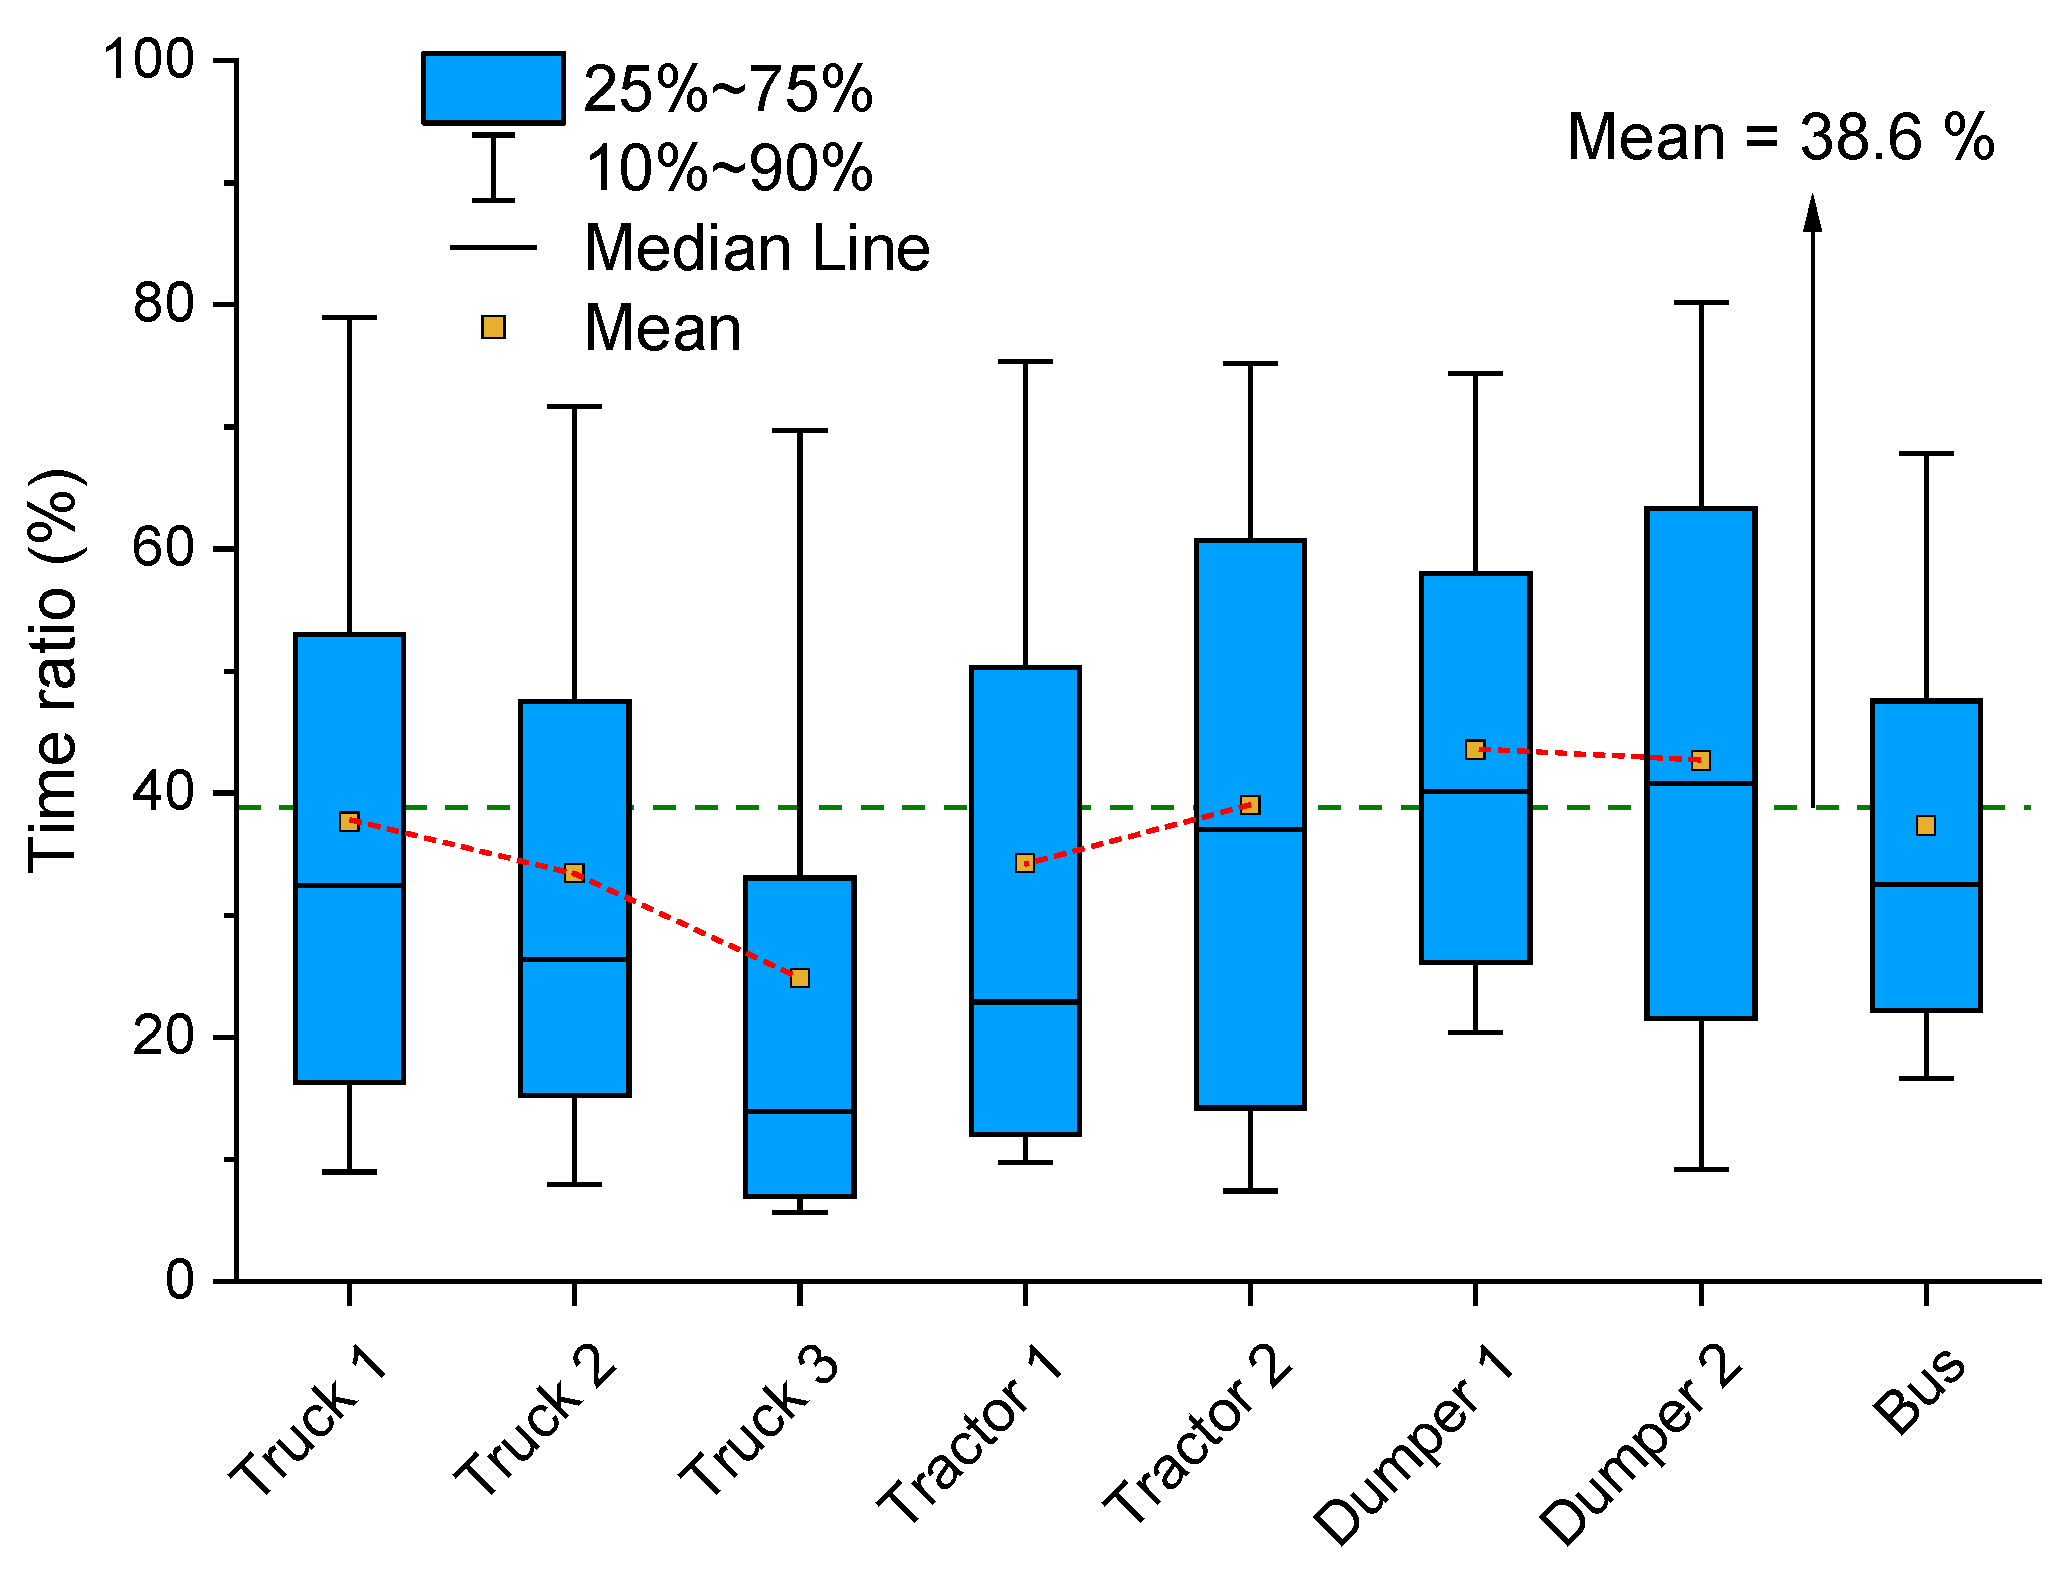
Figure 8 shows the time ratio of the cold start to the trip for each vehicle model. Since the cold-start duration (see Figure 6a) and the trip duration (see Figure 3) of real driving conditions fluctuate within a wide range, the cold-start time ratio of each vehicle model is scattered in the range of about 10~80% with an average value of 38.6%. For trucks, the average cold-start time ratio decreases as the gross vehicle weights increases.
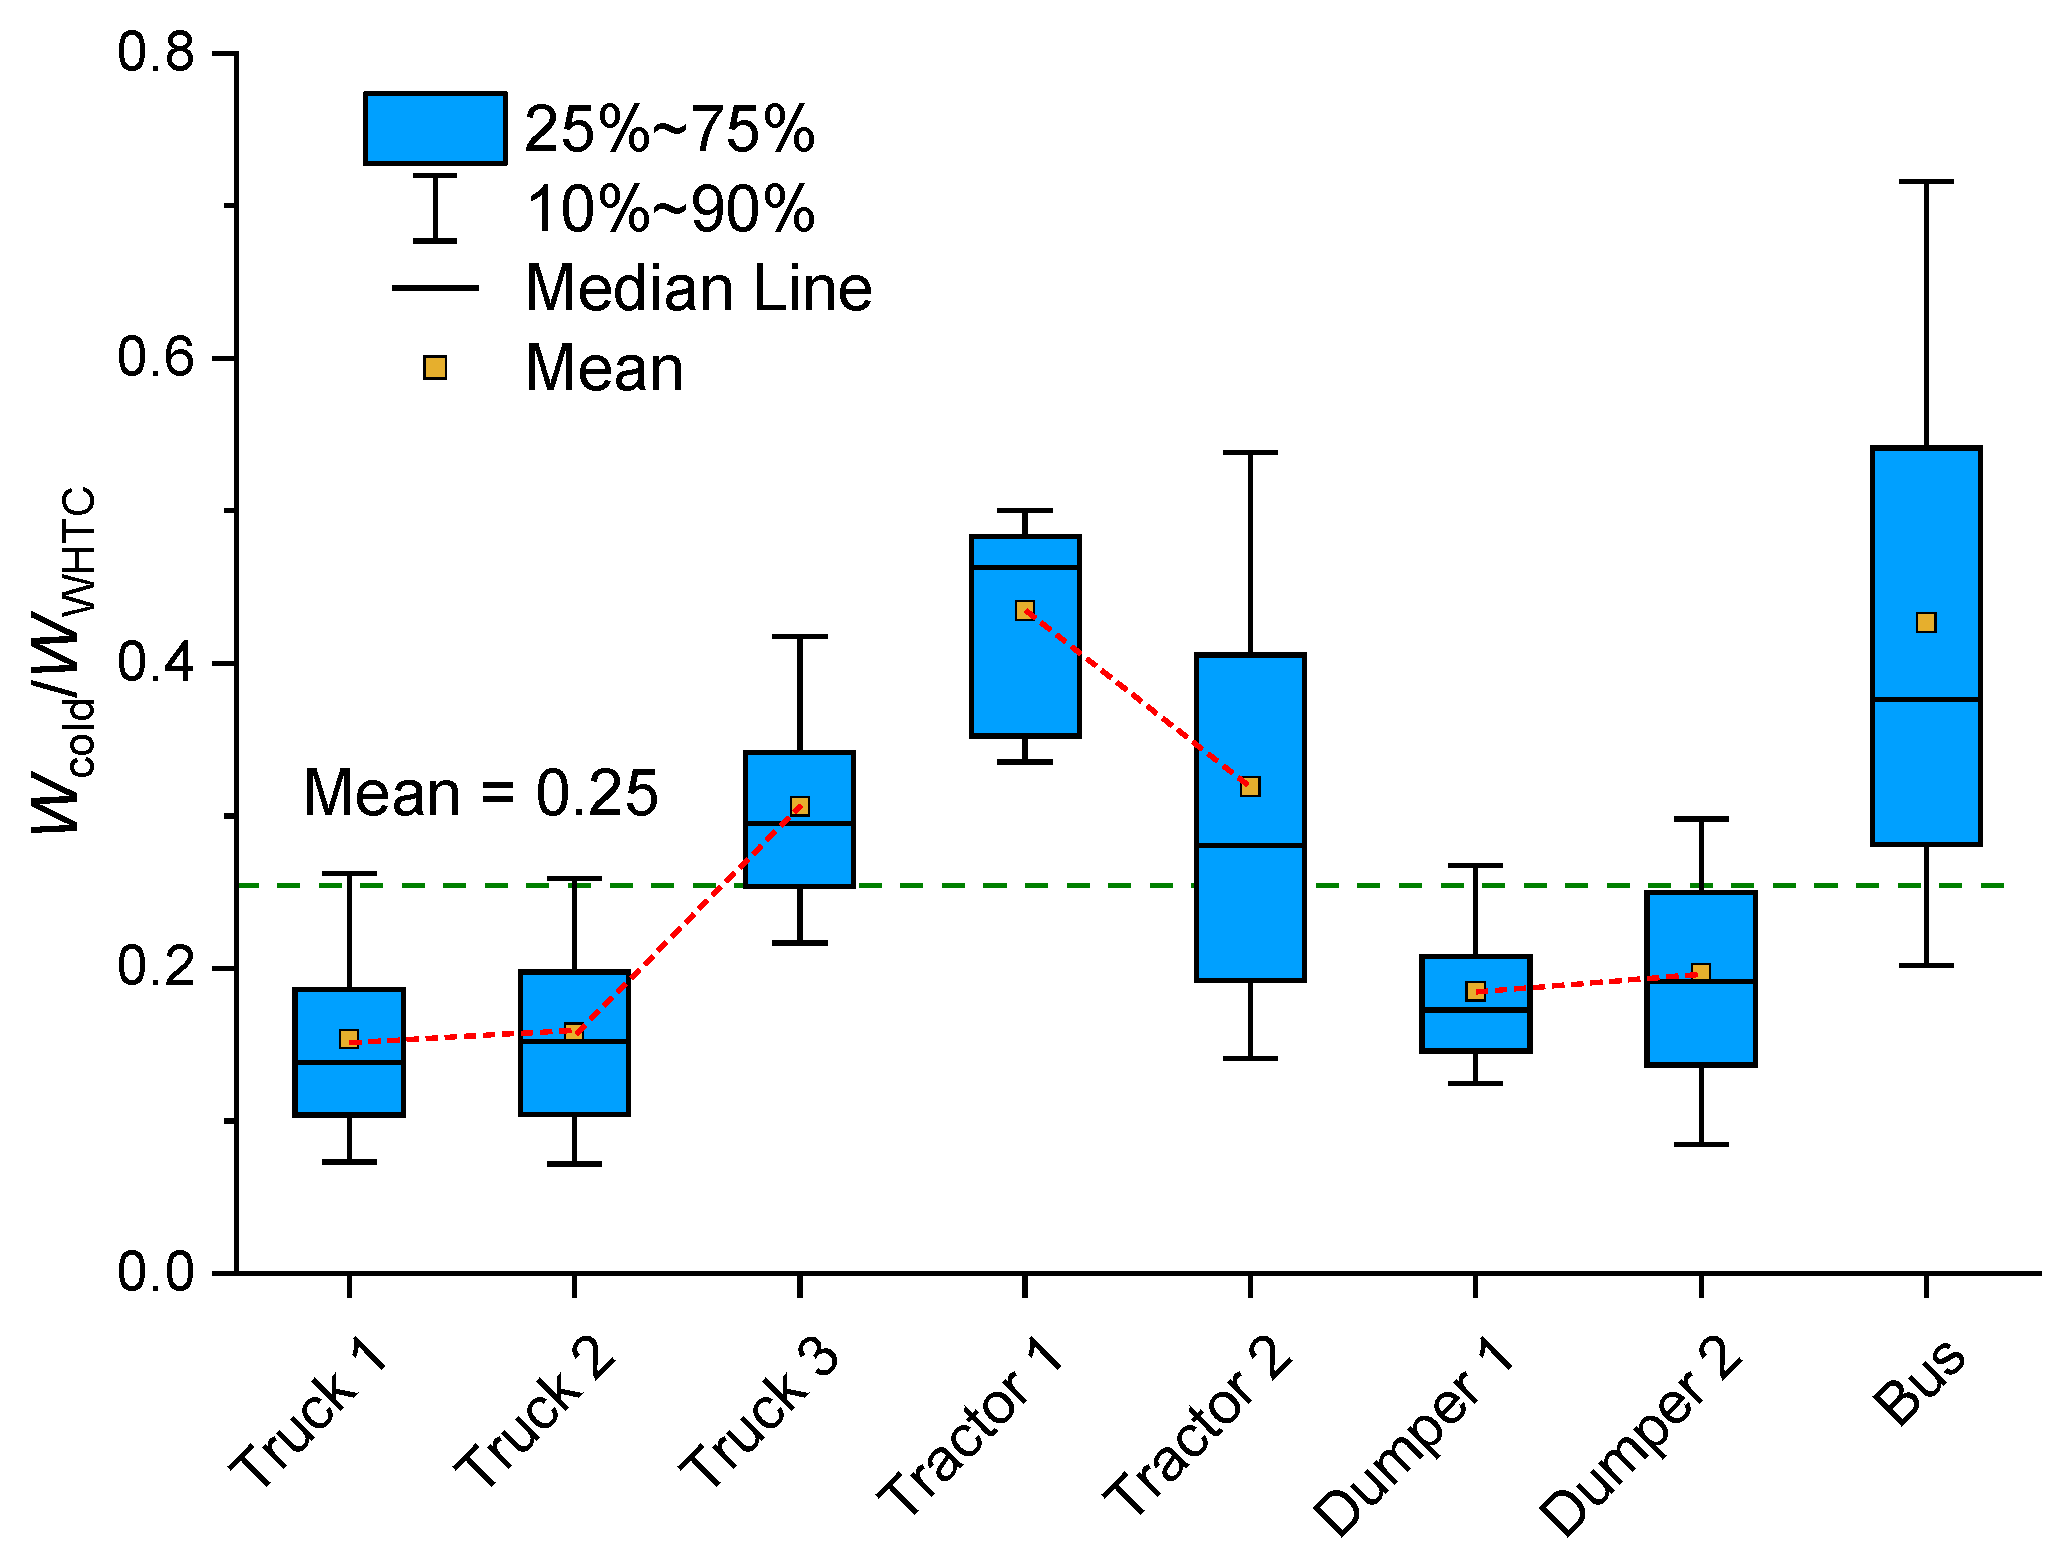
Figure 9 presents the ratio of Wcold to WWHTC (hereafter as ‘Wcold/WWHTC’) for each vehicle model. The average value of Wcold/WWHTC is approximately 0.25. Since the ratio is influenced by several factors such as the payload, the cold-start duration and the ambient condition, Wcold/WWHTC lies within the range from 0.1 to 0.5.
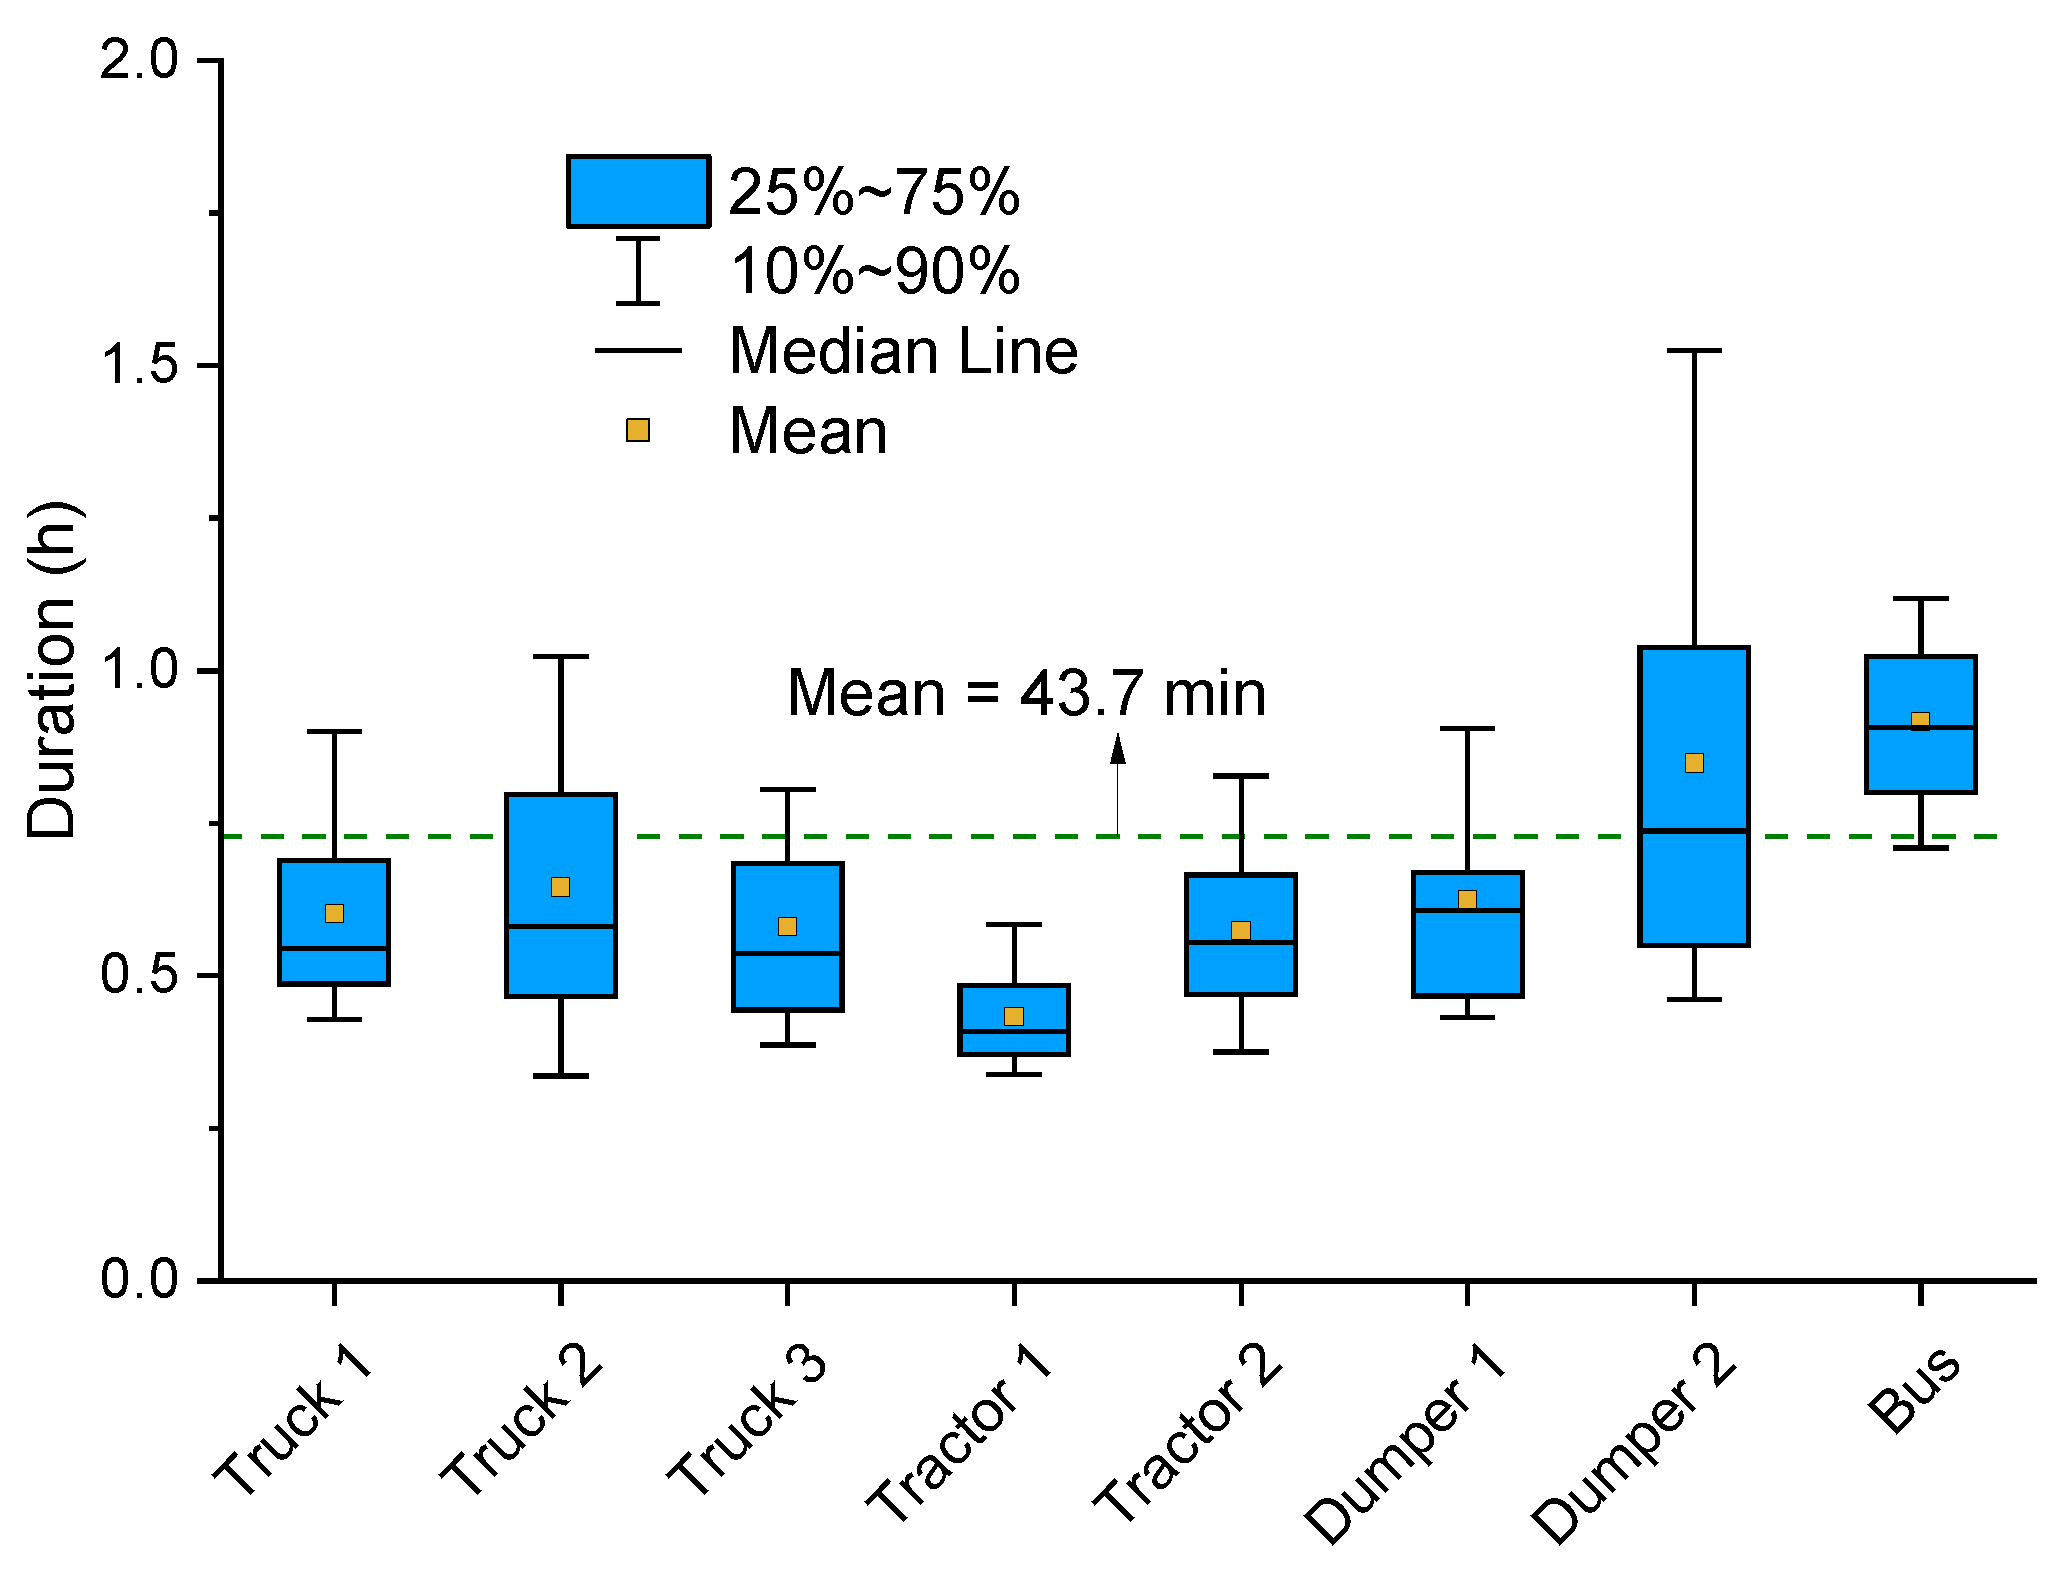
As previously discussed, the value of 0.1 × Pmax is set as Wcold in TBM. By this definition, the average length of cold-start windows is found to be 43.7 min (as shown in Figure 10). In most cases, the duration is about 0.5 h, which is the length of the WHTC test. Thus, the proposed cold-start window definition is validated as feasible for evaluating the cold-start phase in RDE tests, with results comparable to those derived from the WHTC cold-start procedure.
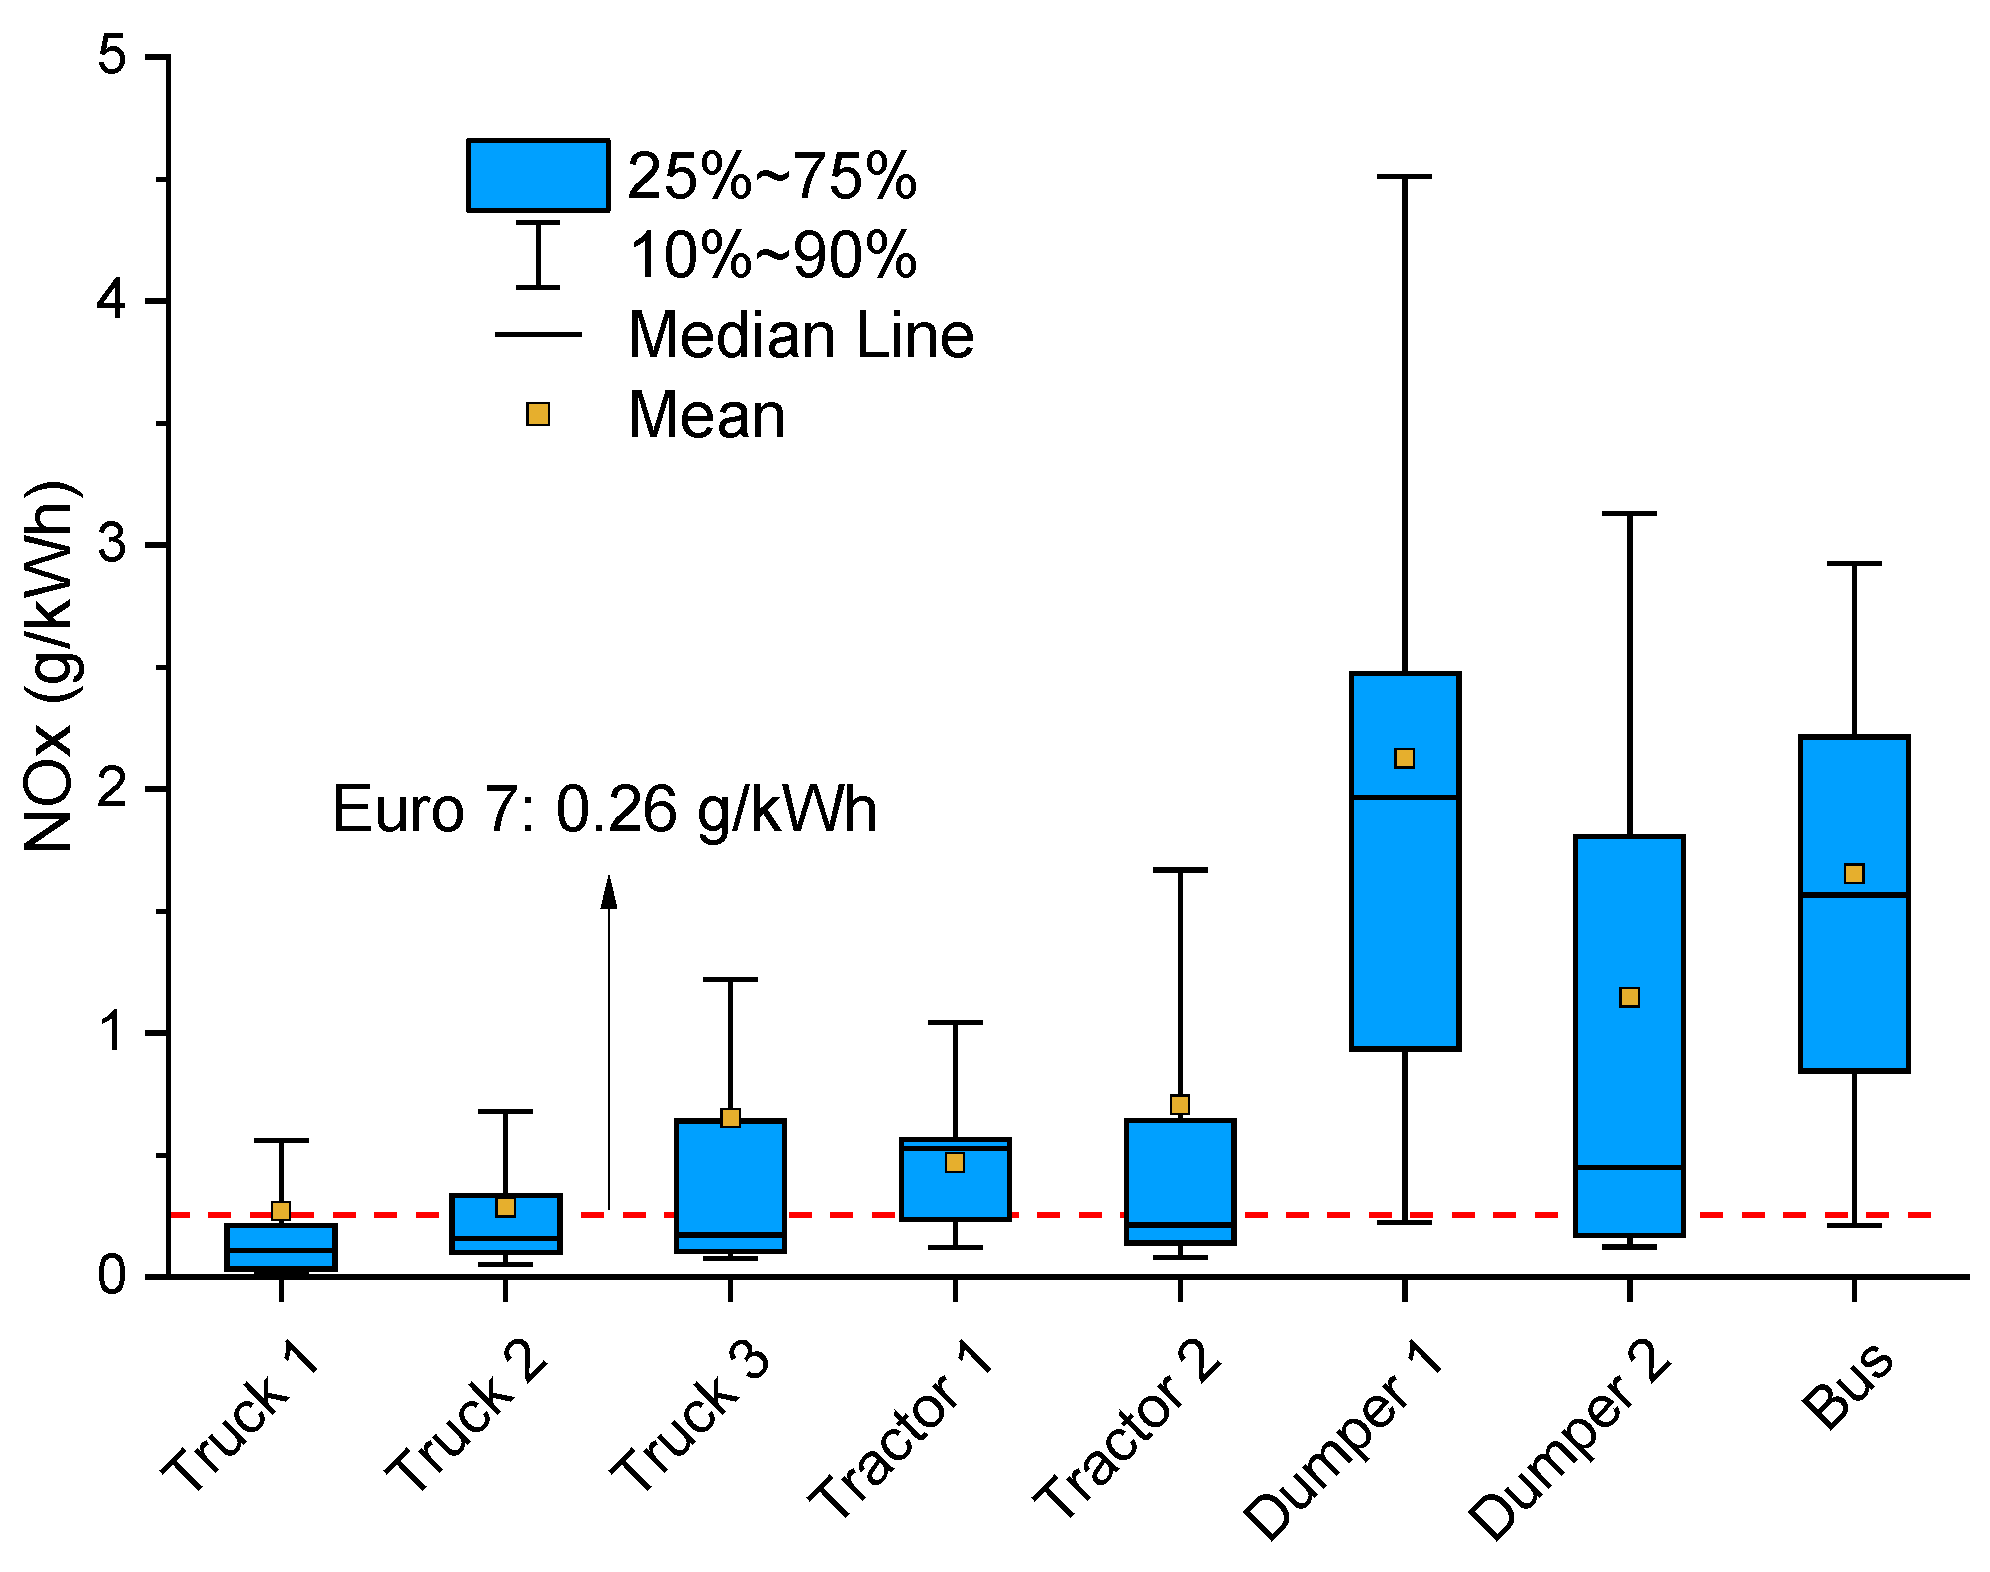
Figure 11 shows the TBM cold-start calculation results for NOx emissions. It should be noted that the NOx emission data used in this study were sourced from a remote monitoring platform, collected by NOx sensors installed on the aftertreatment system. Typically, a NOx sensor need to heat up to its working temperature or the so-called dew point before sending valid values. Thus, the specific NOx emission mass in Figure 11 is calculated using only these valid values and thought to be lower than the actual level since the cold-start emissions are normally very high during the NOx sensor heating up. However, the conclusions are be influenced by this phenomenon. From Figure 11, it is noted that for most vehicle models, the average cold-start NOx emissions are within 1 g/kwh; however, the cold-start NOx emissions of most trips are over the Euro 7 limit (0.26 g/kWh), especially for Dumper 1, Dumper 2 and Bus. Therefore, the optimization of cold-start emissions will be one of the challenges for HDVs to meet the future emission regulations.

3.3. Hot Run Window Classification and Emission Analysis

In 3BM, a conventional framework for heavy-duty vehicle emission assessment, the classification of hot-run operating windows is strictly based on the normalized CO2 emission mass measured over fixed 300 s test intervals. This CO2 based binning strategy is designed to reflect the real-time load status of the engine by leveraging the strong correlation between fuel consumption, CO2 production, and engine load. Specifically, the three distinct bins are defined as follows:
  • Idle bin: the window’s normalized CO2 emission mass is less than or equal to 6%;
  • Low-load bin: the window’s normalized CO2 emission mass is greater than 6% and less than or equal to 20%;
  • Medium-to-high load bin: the window’s normalized CO2 emission mass is greater than 20%.
On the contrary, the TBM adopts a more simplified and straightforward classification criterion, where the division of hot-run operating windows is solely based on the ratio of the window’s average power to the engine’s maximum power (Pmax).
  • Bin 1: the window’s average power is less than or equal to 6% of the engine’s maximum power;
  • Bin 2: the window’s average power is greater than 6% of the engine’s maximum power;
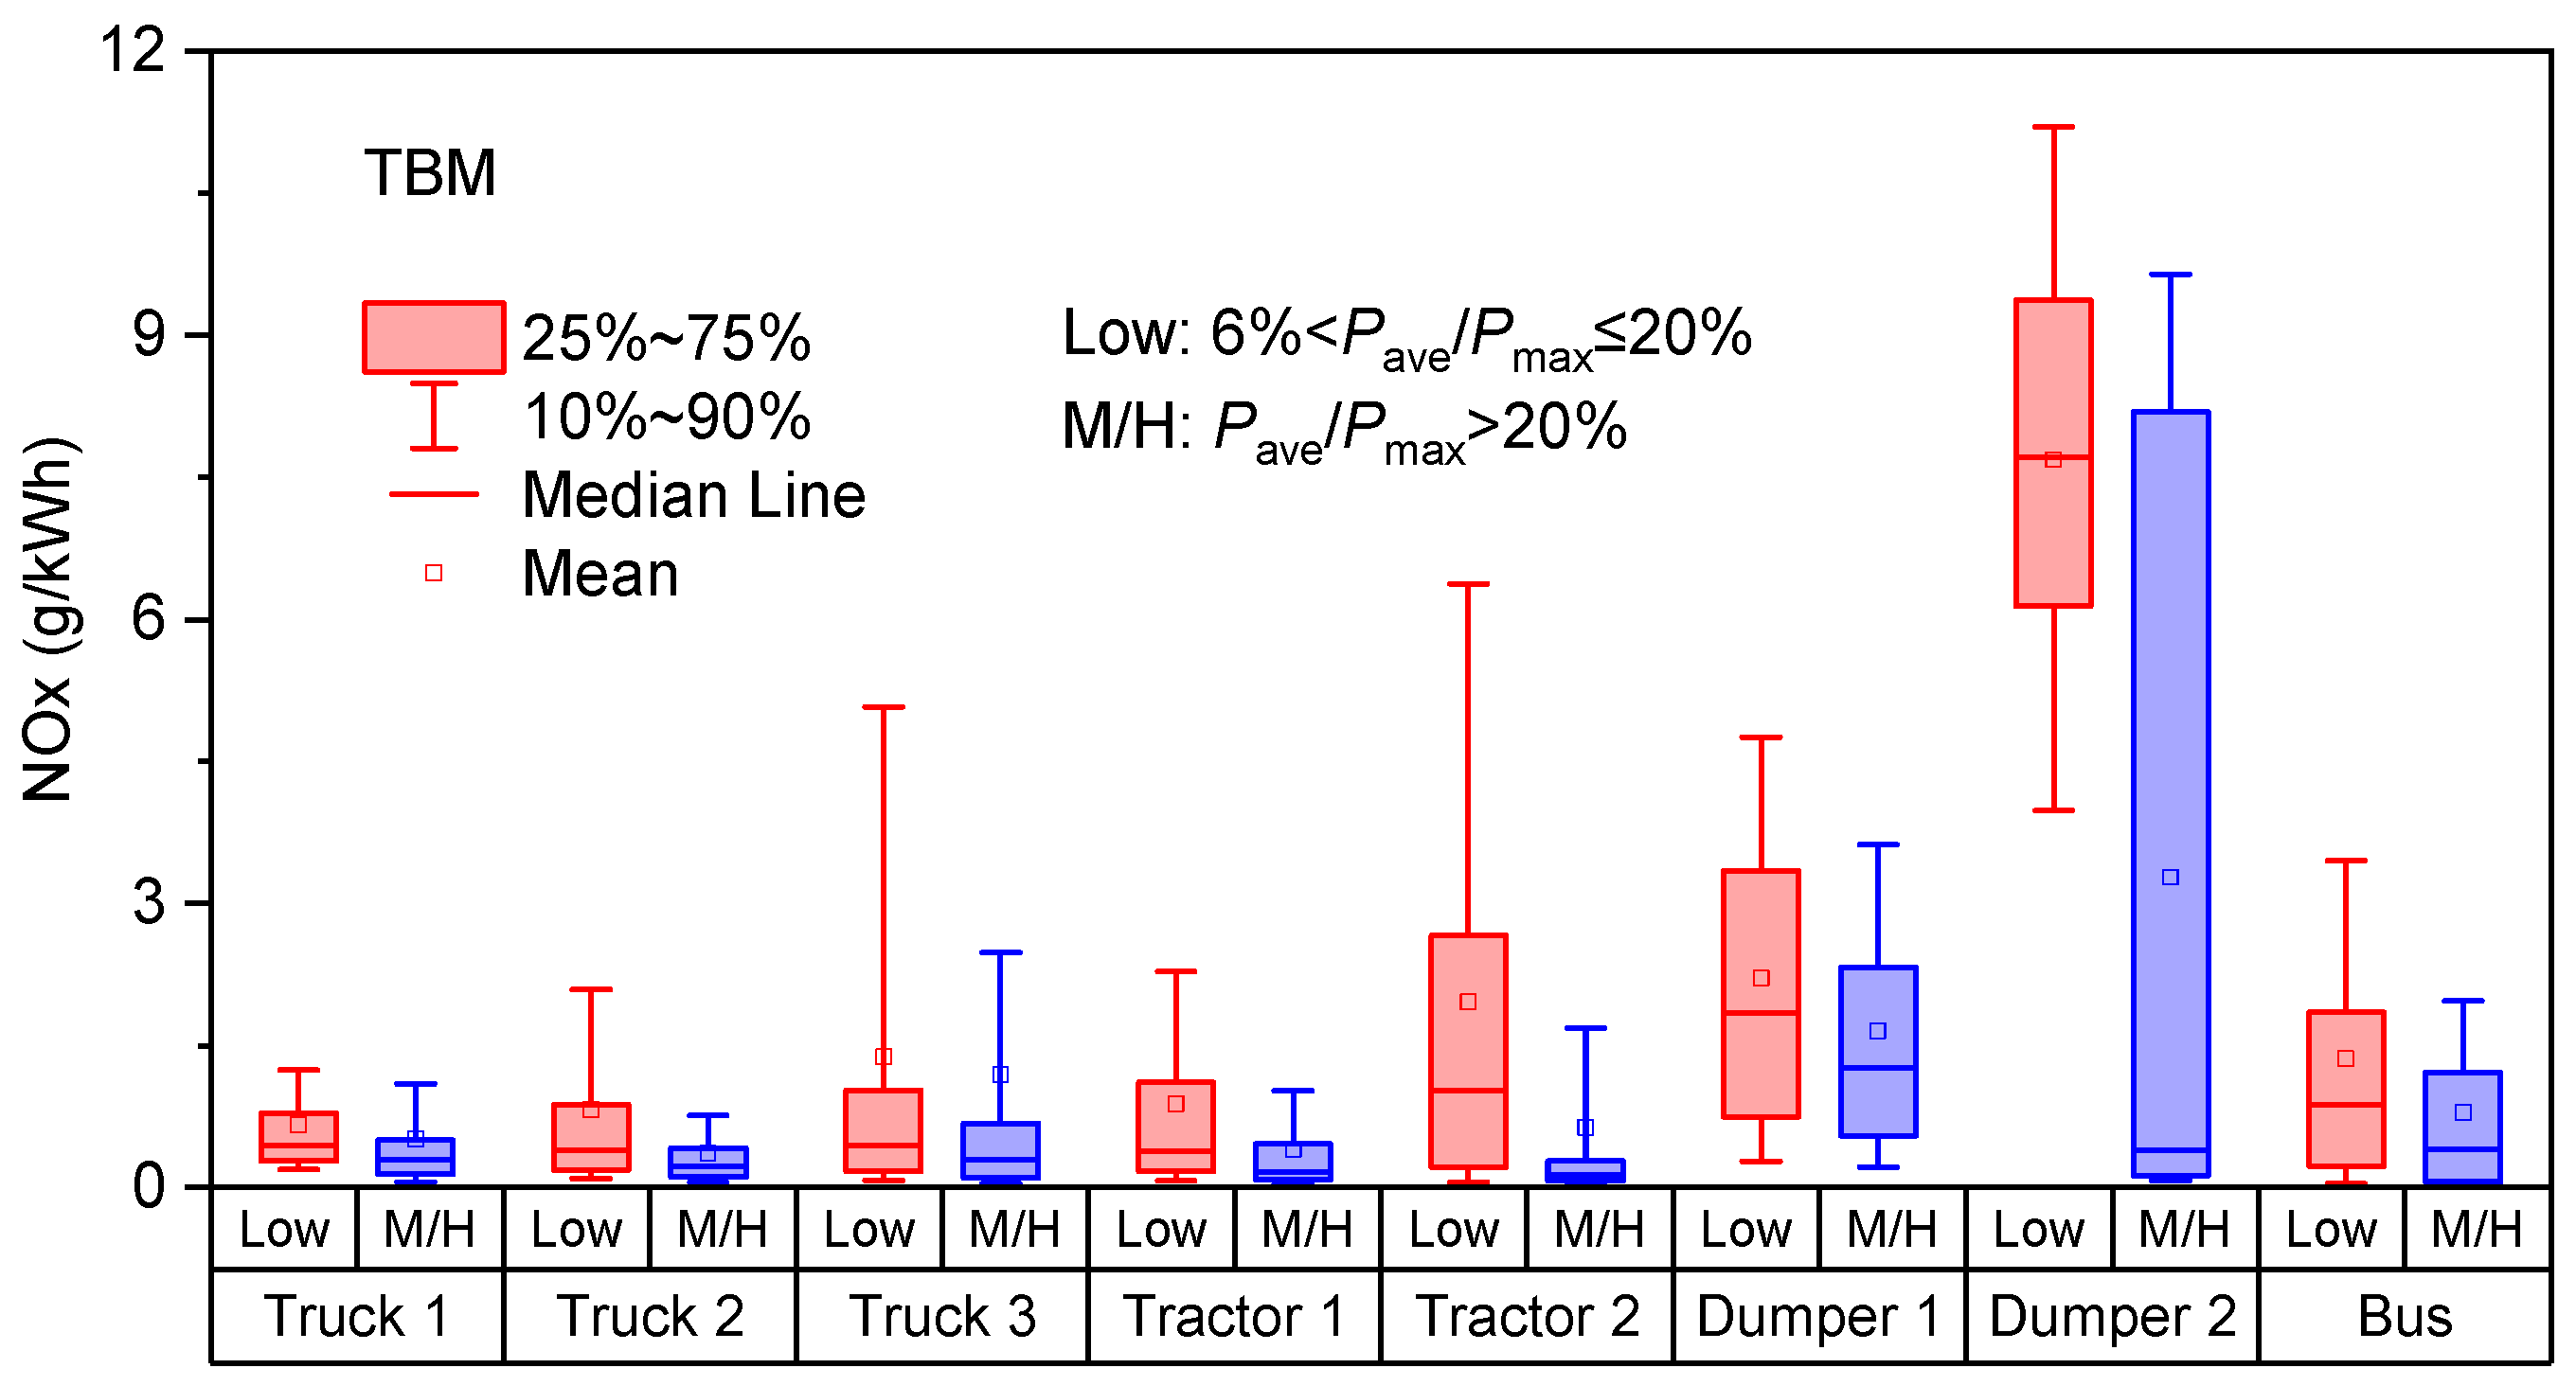
Therefore, Bin 1 represents idle operation and other very low-load operation where engine exhaust temperatures may drop below the optimal temperature for aftertreatment function. Bin 2 standards for higher power operation conditions. The rationale for combining the low-load and medium-to-high-load bins into a single Bin 2 in TBM aligns with the considerations adopted by the EPA during the development of the 2BM [6]. If another line is set (e.g., 20% as shown in Figure 12) to divide Bin 2 into the low-load bin and the medium-to-high load bin, the specific NOx emissions of the medium-to-high load bin tend to be lower than those of the low-load bin for all eight vehicle models, because the aftertreatment catalyst efficiency is greater at higher exhaust temperatures, minimizing the advantage of separating these modes of operation. Therefore, the final bin structure of TBM hot-run analysis only includes two bins of operation.
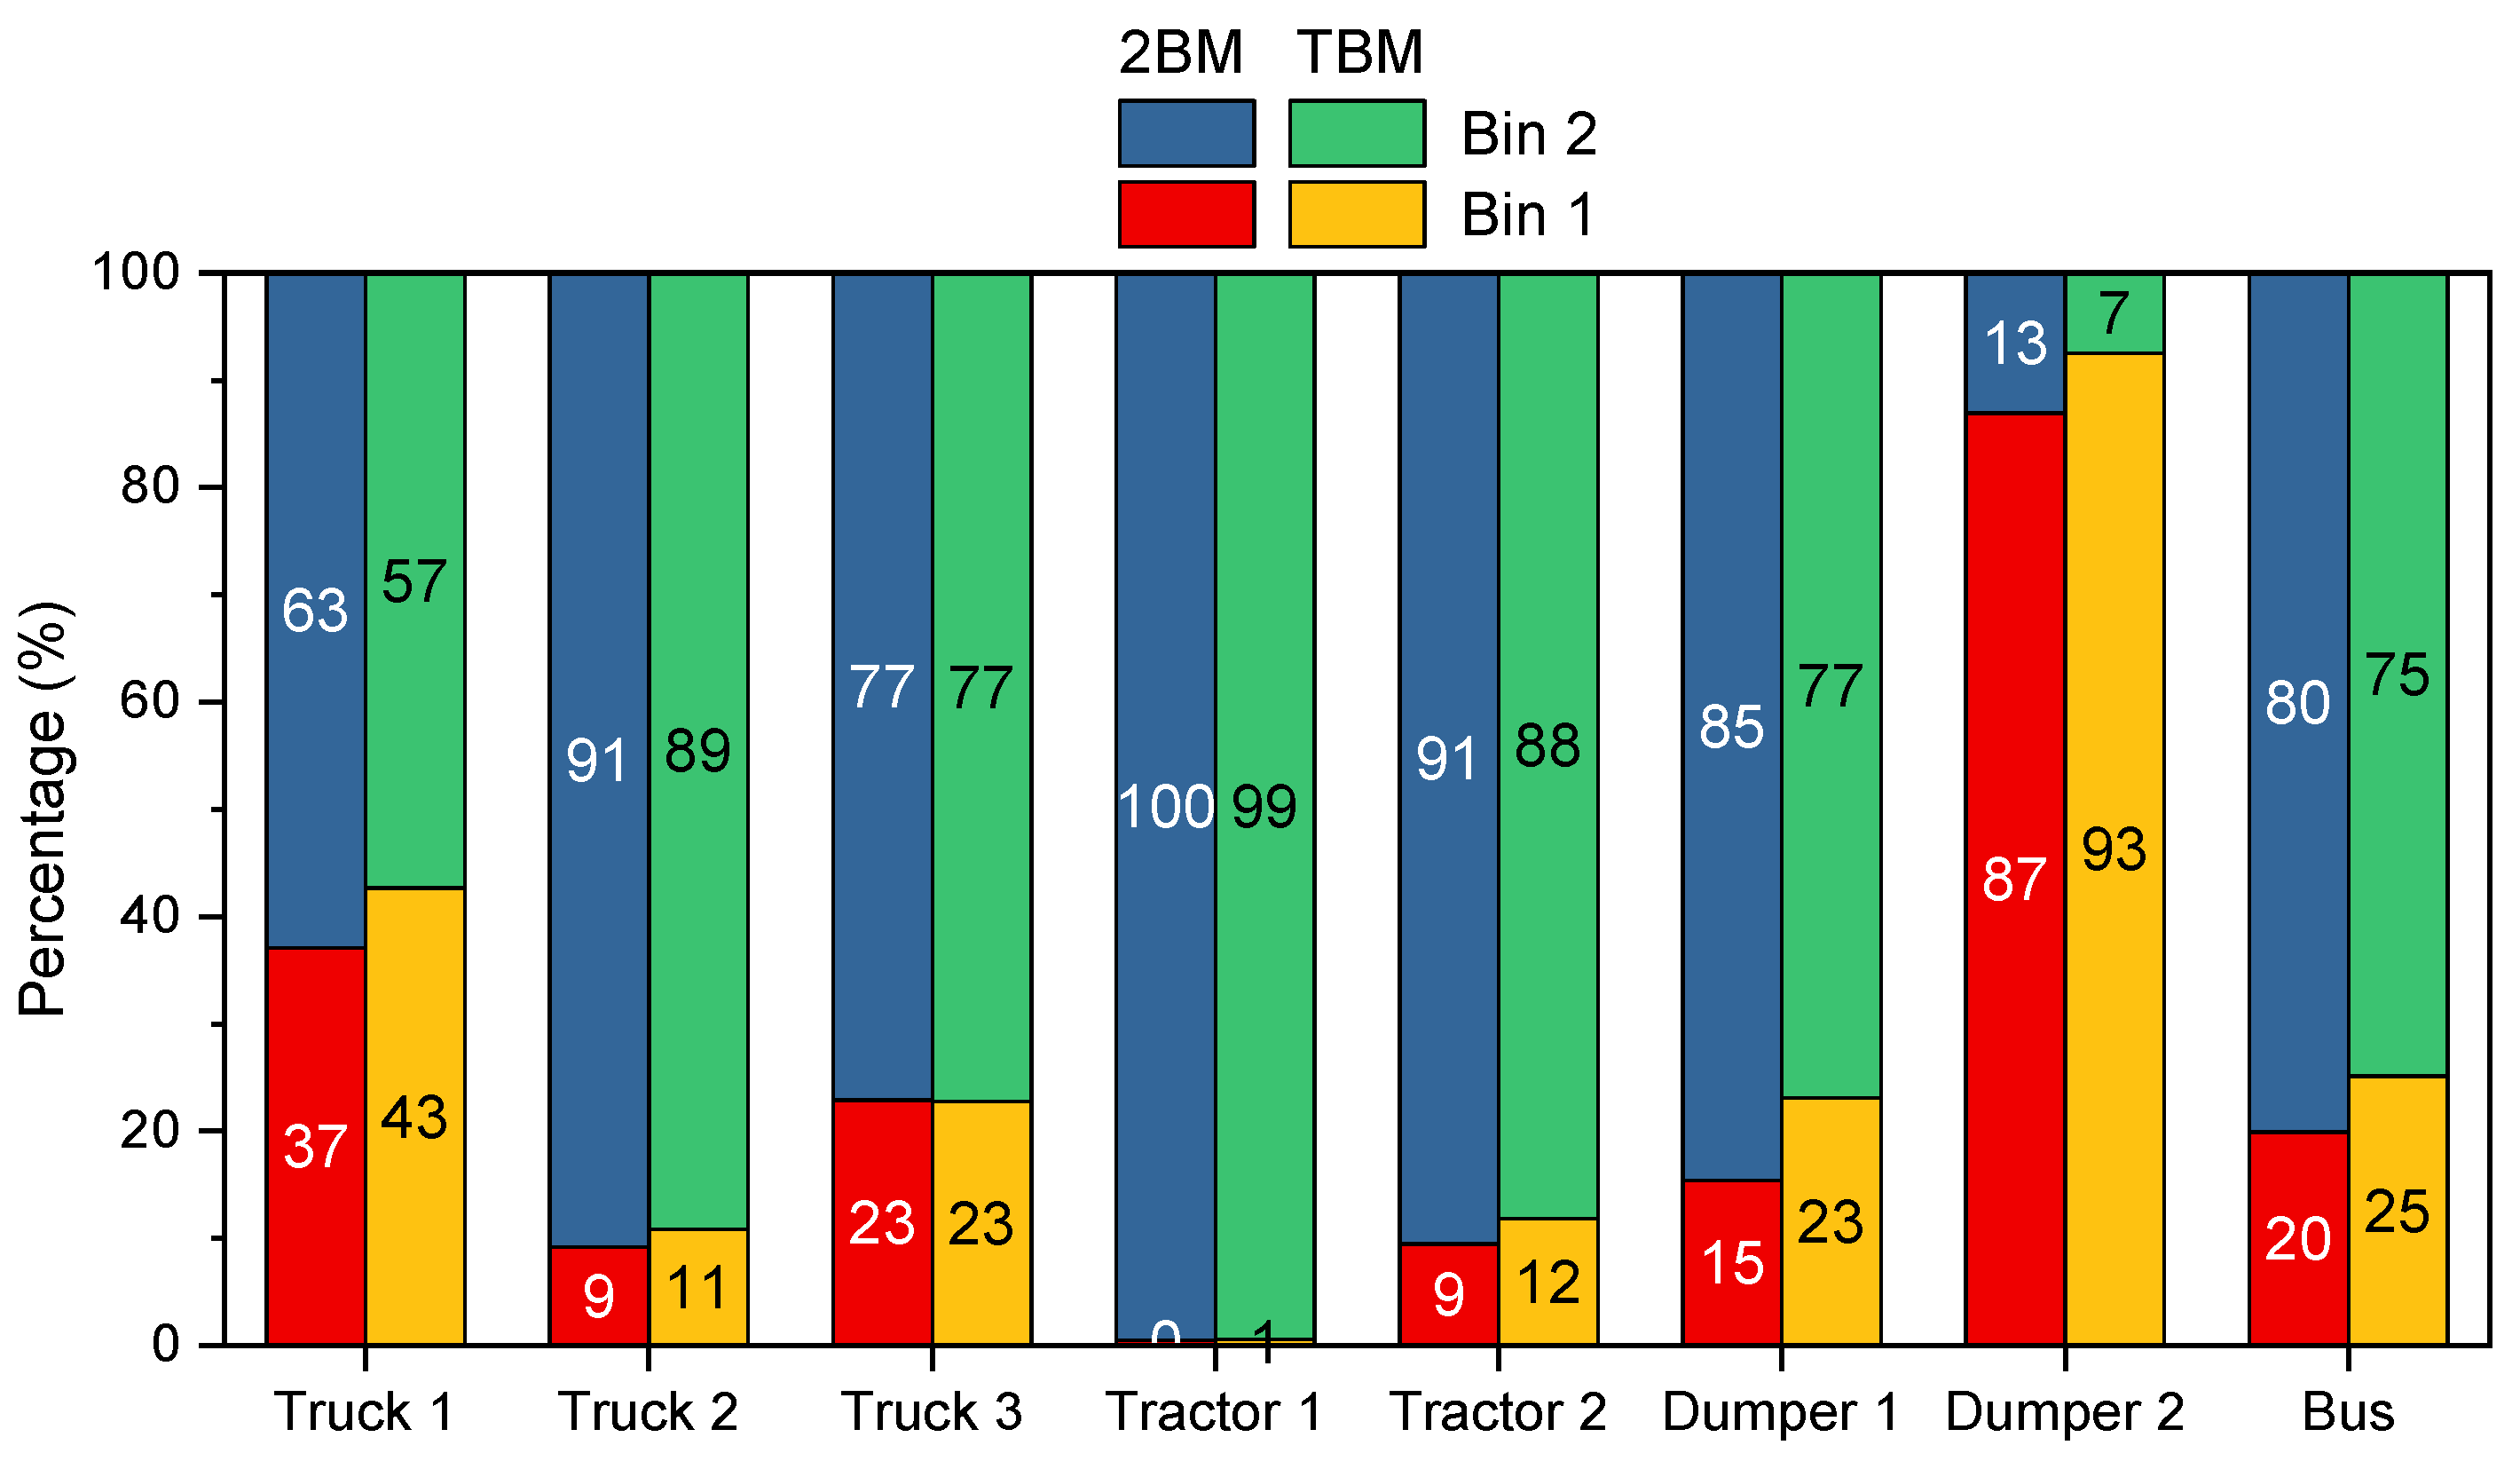
The percentage of Bin 1 and Bin 2 are compared in Figure 13 between TBM and 2BM. It is noteworthy that the proportion of Bin 1 and Bin 2 is directly related to the vehicle model, i.e., the driving scenario. For example, there is barely any Bin 1 windows in the hot run for Tractor 1, indicating that its payload or driving speed are normally high, which is also demonstrated in the cold-start analysis (see Figure 9 and Figure 10). On the contrary, the percentage of Bin 1 windows for Dumper 2 is approximately 90%, suggesting that it always operates at low loads, that is the reason why NOx emissions of Dumper 2 are the highest in Figure 12. Furthermore, the hot-run window categorizing method of 2BM and TBM are different. Although 6% is set as the boundary between Bin 1 and Bin 2 in both methods, TBM is based on the window’s average power, while 2BM is based on the window’s normalized CO2 emission mass. As illustrated in Figure 13, this discrepancy results in approximately 1–6% of Bin 2 windows in 2BM being reclassified as Bin 1 in TBM, demonstrating that the scope of Bin 1 in TBM is marginally broader than that in 2BM.
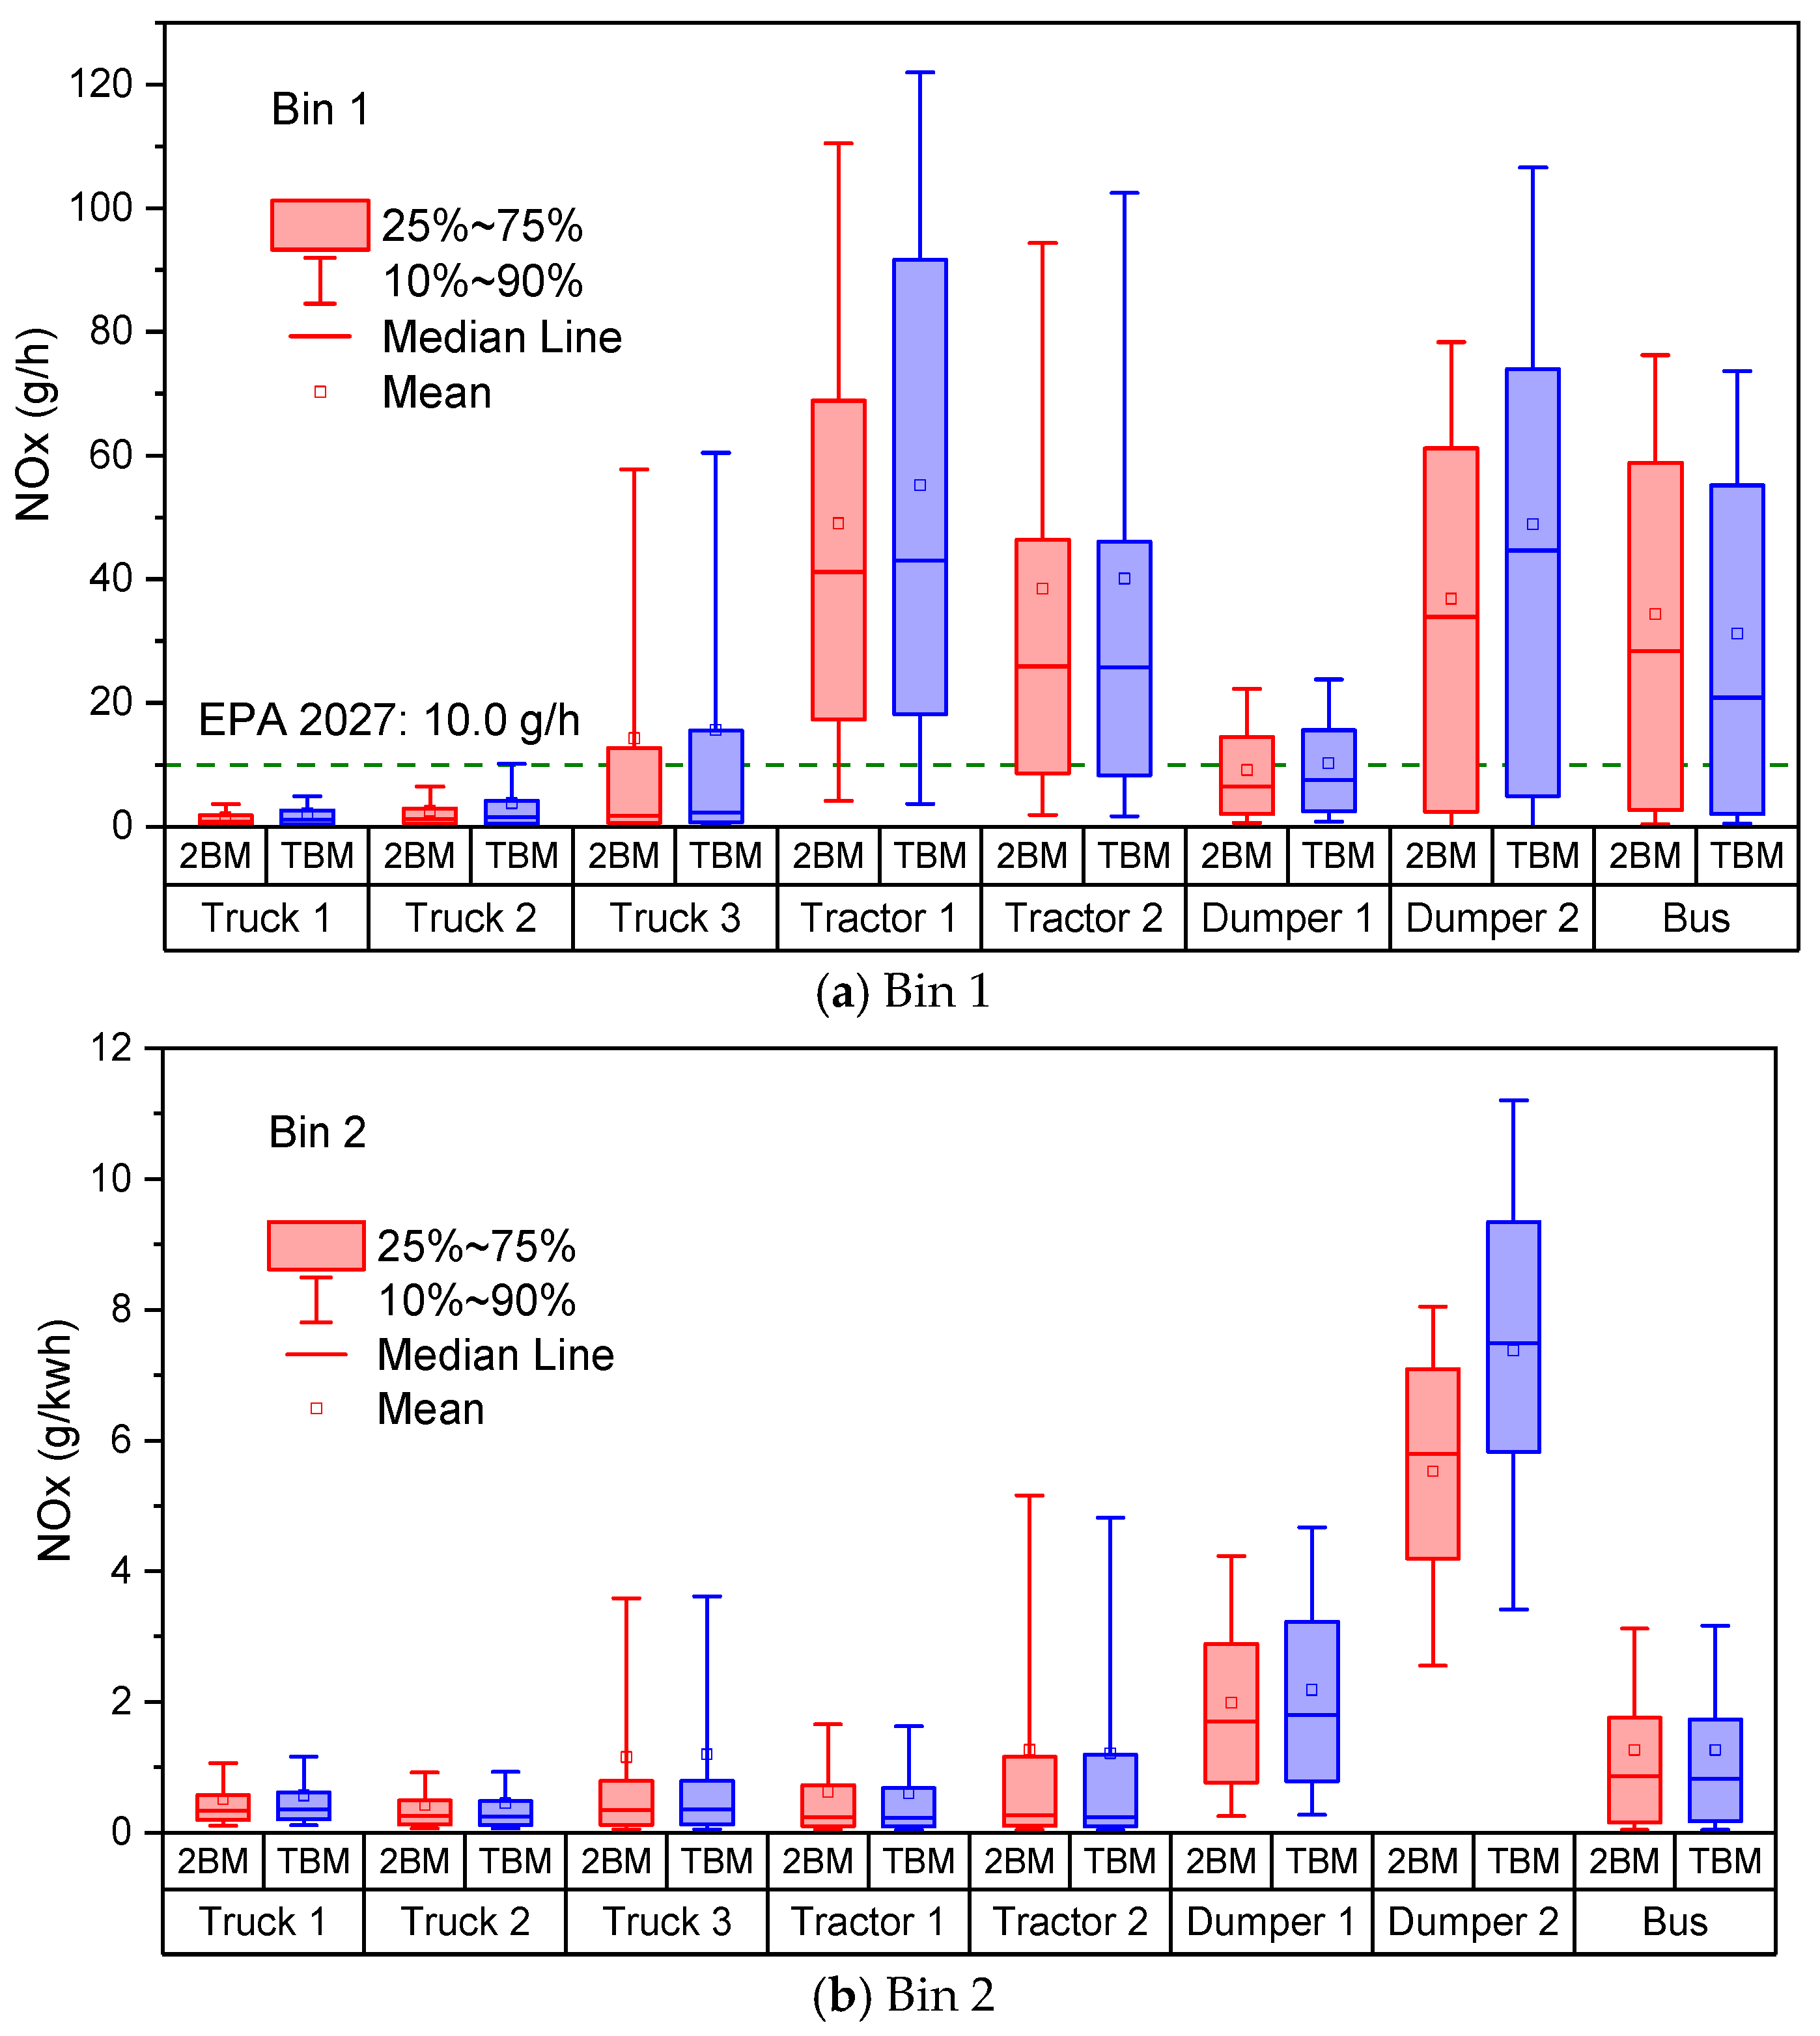
The NOx emission calculation results of Bin 1 and Bin 2 are compared in Figure 14a and b, respectively. The NOx mass emission rate (g/h) calculation method for Bin 1 is the same between TBM and 2BM; therefore, the discrepancy is mainly caused by the difference of Bin 1 range as explained in Figure 13. Moreover, the Bin 1 emission limit in EPA 2027 is challenging for most China 6 vehicle models; thus, idle emission control is one of the key tasks during future model development. In regard to Bin 2, the calculation discrepancies stem from two key factors: differences in bin scope and variations in calculation methodologies. Compared with TBM, the specific emission mass results (g/kWh) are gained by converting the window average value with CO2 FCL in 2BM [6]. Afterall, as shown in Figure 14, both Bin 1 and Bin 2 calculation results of TBM and 2BM are very close for all eight vehicle models. Therefore, comparable emission limits with 2BM can be considered for TBM.
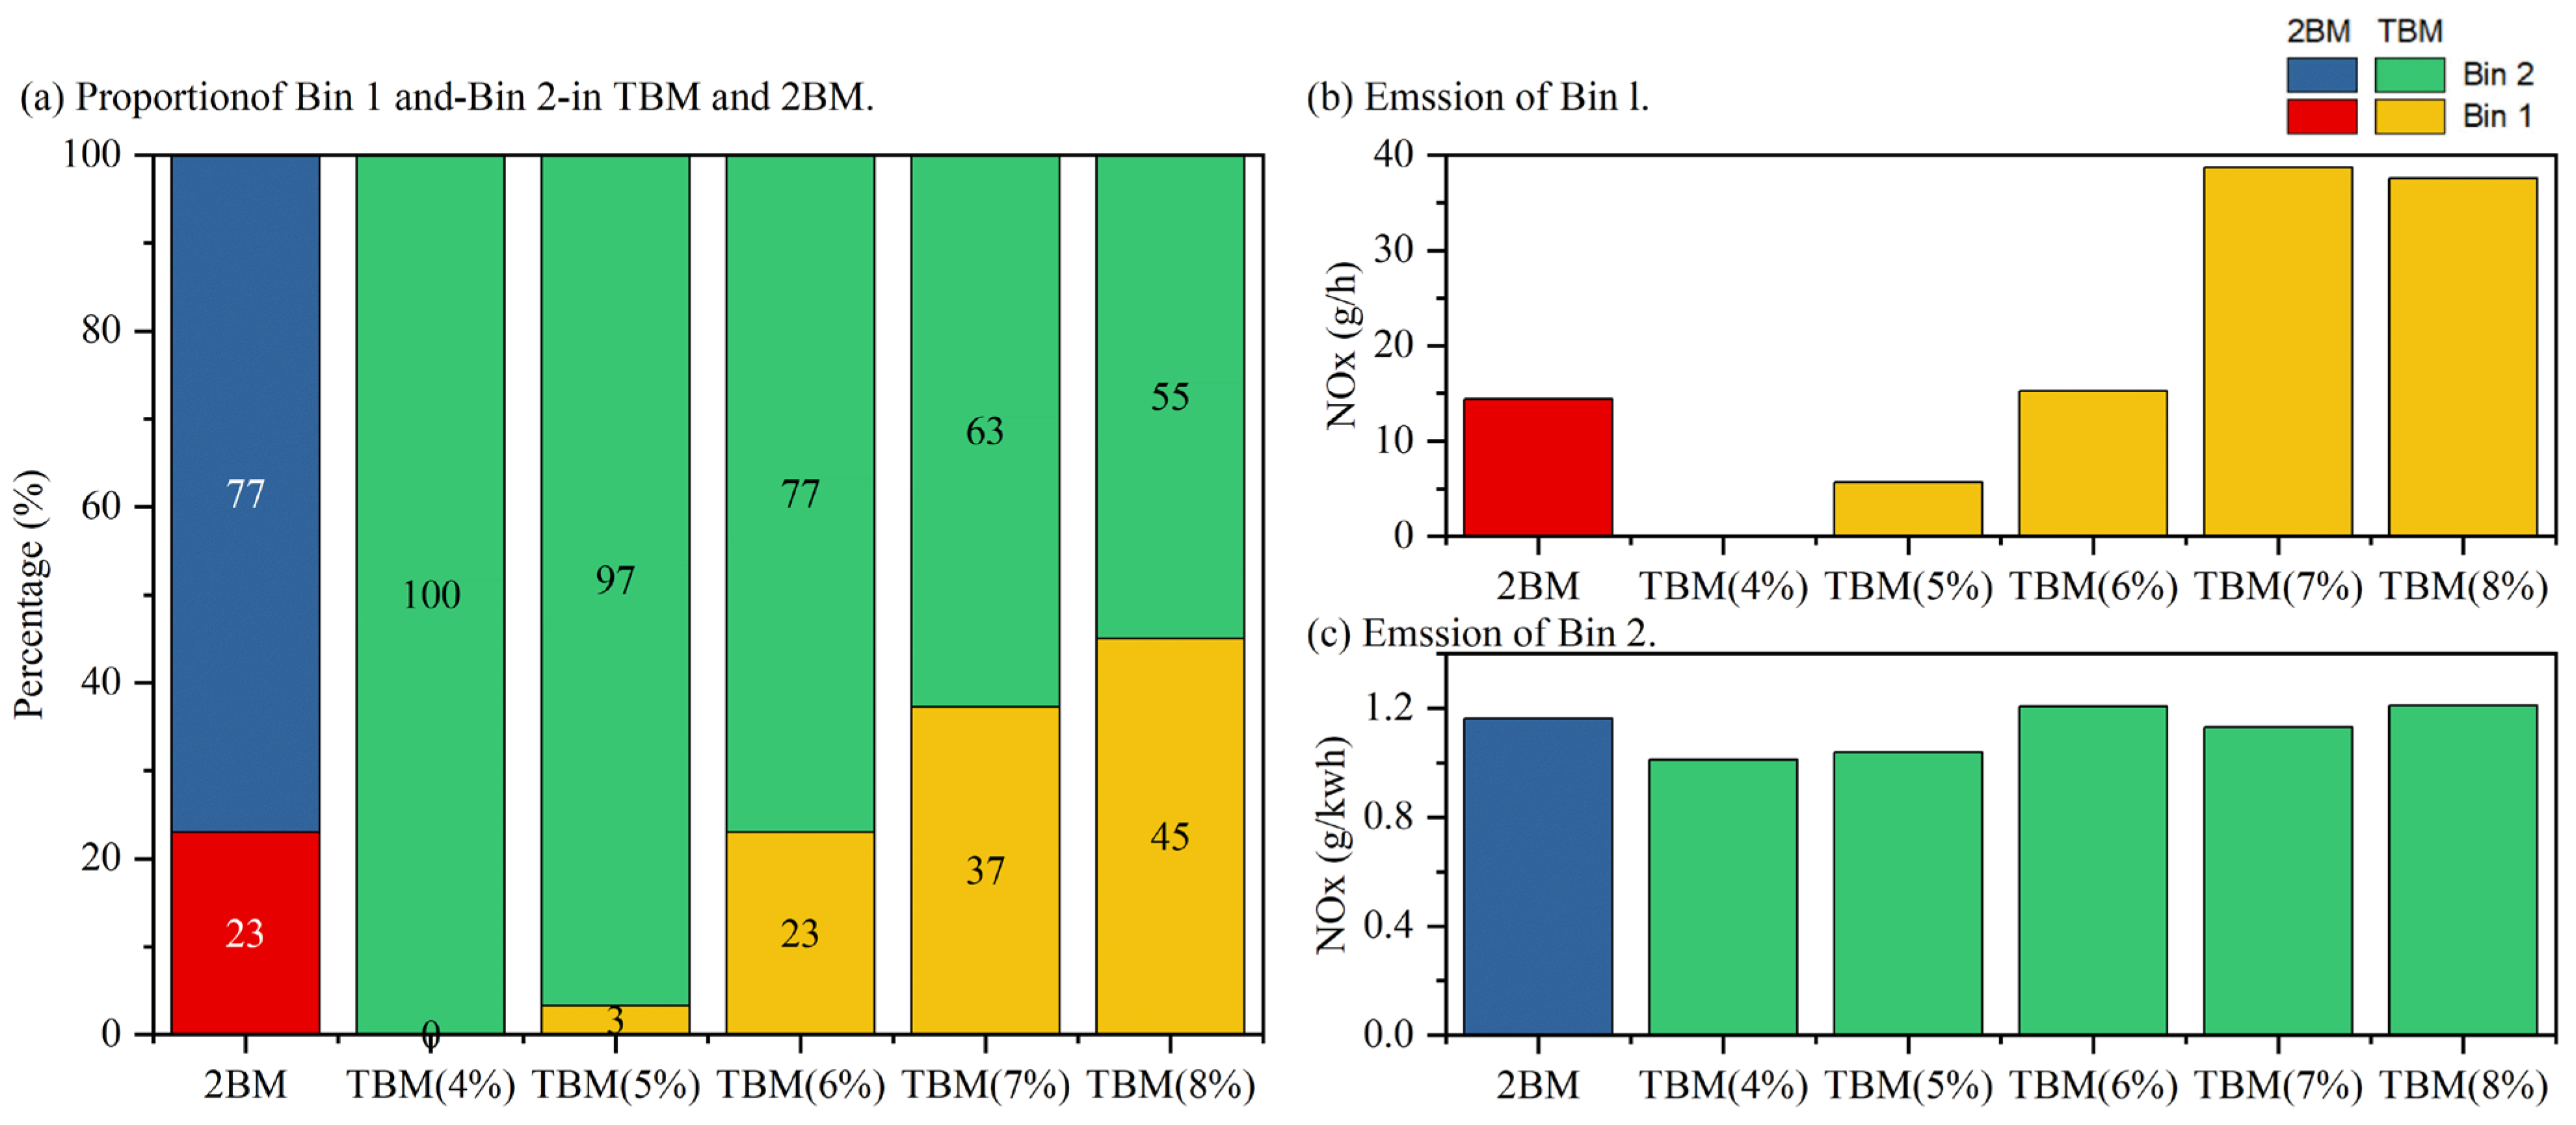
To investigate the influence of the Bin 1/Bin 2 classification threshold in the TBM method on emission results, sensitivity analysis was conducted on Truck 3. This vehicle was selected because its window proportions under baseline conditions were identical for TBM and 2BM, eliminating operational interference and facilitating comparison of threshold variations. Using the baseline threshold of 6% of Pmax as the center, gradient thresholds ranging from 4% to 8% of Pmax were set to compare window proportions and emission results under different thresholds.
As shown in Figure 15a, only when the threshold was set to 6% of Pmax, the Bin 1/Bin 2 window proportions were fully consistent with 2BM, while other thresholds showed obvious deviations. As shown in Figure 15b, Bin 1 emission intensity increased significantly with the threshold, and was closest to the 2BM result only at 6% of Pmax. As shown in Figure 15c, Bin 2 emission intensity showed no clear trend across different thresholds, and was closest to the 2BM result at 6% of Pmax. In summary, the window proportions and emission levels at the threshold of 6% of Pmax had the highest consistency with the 2BM baseline, verifying the reliability of the threshold selection in this study.

4. Conclusions

In the current study, a time-based method (TBM) was proposed for the next-stage HDV RDE test evaluation based on the window binning method. TBM aims at evaluating cold-start and hot-run emissions separately, without using any of the type-approval results. In TBM, the value of 0.1 times maximum engine power is utilized to determine the cold-start window and a 2-bin window structure is adopted for hot-run analysis. To further illustrate and validate this method, remote monitoring data of 36 China 6 HDVs were analyzed for driving and emission characteristics with TBM. The conclusions can be summarized as follows:
  • By the definition in this work, 21,466 trips are analyzed. Most trip durations are less than 3 h, with an average value of about 0.68 h. The ratio of work performed during each trip to the work performed during WHTC (Wtrip/WWHTC) is normally less than 6, the average value of which is 1.38. Therefore, lower test duration and work limits need to be considered in the rulemaking of next-stage HDV RDE standards.
  • The average cold-start duration is about 912.4 s (15.2 min), but in some cases, the cold start could last more than 3600 s (1 h), especially with low ambient temperatures, low driving speeds and frequent stops. The cold-start durations tend to be longer for vehicles that always operate in low-loads (e.g., buses) or with lower ambient temperature. It takes as rapid as 200 s for the SCR system to reach 200 °C and start the urea injection. Wcold/WWHTC lies within the range of 0.1 to 0.5, with an average value of 0.25. The proposed cold-start window definition is feasible to evaluate the cold-start emissions in a comparable process as the cold-start WHTC test. Furthermore, the optimization of cold-start emissions will be one of the challenges for HDVs in the future.
  • The specific NOx emissions of the medium-to-high load bin tend to be lower than these of the low-load bin, thus, only a 2-bin structure is chosen for hot-run analysis. The proportion of Bin 1 and Bin 2 is directly related to the driving scenarios. Idle emission control is also challenging for future HDV updating. Moreover, the Bin 1 range in TBM is 1% to 6% wider than that of 2BM. Since the calculation results of TBM and 2BM are similar, comparable emission limits with 2BM can be considered for TBM.
This study has certain limitations. The remote monitoring data only provide NOx concentration values, which need to be further converted into emission rates by combining other parameters before being used for calculation. This conversion process may introduce a certain degree of systematic error, but it will not significantly affect the method comparison and core conclusions of this study.
In future research, in-depth analysis will be conducted on the impacts of dynamic driving behaviors such as idling and frequent start-stop under urban congested conditions on NOx emissions and aftertreatment systems, with a focus on exploring the mechanism of working condition fluctuations during cold start and the Bin 1 region. In addition, future research will conduct more comprehensive threshold sensitivity analysis based on additional vehicle samples to further verify the generalizability of the conclusions of this study.

Author Contributions

Conceptualization, G.L. and S.R.; methodology, H.Z.; software, J.Z.; validation, X.Z., D.G. and Q.Y.; formal analysis, S.R.; investigation, J.Z.; resources, H.Z.; data curation, S.R.; writing—original draft preparation, S.R.; writing—review and editing, S.R.; visualization, S.R.; supervision, F.W.; project administration, G.L.; funding acquisition, F.W. All authors have read and agreed to the published version of the manuscript.

Funding

This research was funded by the national Key R&D Program of China, grant number 2023YFC3707204. Funding department: Ministry of Science and Technology of the People’s Republic of China.

Institutional Review Board Statement

Not applicable.

Informed Consent Statement

Not applicable.

Data Availability Statement

The data presented in this study are available on request from the corresponding author due to privacy.

Conflicts of Interest

Authors Shuojin Ren, Fengbin Wang, Xianglin Zhong, Jianfu Zhao, Hao Zhang, Dongzhi Gao and Quanshun Yu were employed by the China Automotive Technology and Research Center Co., Ltd. The remaining author declares that the research was conducted in the absence of any commercial or financial relationships that could be construed as a potential conflict of interest.

Abbreviations

AbbreviationFull English Term
HDVheavy-duty vehicles
RDEreal driving emission
PEMSportable emissions measurement system
MAWmoving average window
WBMthe work-based method
CBMCO2 mass-based method
FBMfuel-based method
WHTCworld harmonized transient driving cycle
LDVlight-duty vehicle
SCRselective catalytic reduction
WLTPworldwide harmonized light vehicle test procedure cycle
2BMtwo-bin method
3BMthree-bin method
GVWgross vehicle weights
TBMtime-based method
WHSCworld harmonized steady cycle

References

  1. China Association of Automobile Manufacturers. 2025 China Automobile Industry Economic Operation Report; China Association of Automobile Manufacturers: Beijing, China, 2026. [Google Scholar]
  2. CLOVE. Euro 7 Impact Assessment Study; Publications Office of the European Union: Luxembourg, 2022. [Google Scholar]
  3. Du, B.; Zhang, L.; Zou, J.; Han, J.; Zhang, Y.; Xu, H. Investigating the impact of route topography on real driving emission tests based on large data sample at data window level. Sci. Total Environ. 2022, 809, 151133. [Google Scholar] [CrossRef] [Scilit] [PubMed]
  4. Li, B.-W.; Chen, Z.-H.; Zhu, X.-H.; Zhang, Z.; Peng, Z.-R.; Zhao, H.-M.; He, H.-D. Assessment of eco-driving strategies on carbon emissions for hybrid vehicles through portable emissions measurement systems. Atmos. Pollut. Res. 2025, 16, 102365. [Google Scholar] [CrossRef] [Scilit]
  5. Publications Office of the European Union. Regulation (EU) 2024/1257 of the European Parliament and of the Council on Type-Approval of Motor Vehicles and Engines with Respect to Their Emissions and Battery Durability (Euro 7); Regulation (EU) 2024/1257; Publications Office of the European Union: Luxembourg, 2024. [Google Scholar]
  6. 40 CFR; Control of Air Pollution from New Motor Vehicles: Heavy-Duty Engine and Vehicle Standards. U.S. Environmental Protection Agency: Washington, DC, USA, 2022.
  7. Su, S.; Ge, Y.; Hou, P.; Wang, X.; Wang, Y.; Lyu, T.; Luo, W.; Lai, Y.; Ge, Y.; Lyu, L. China VI heavy-duty moving average window (MAW) method: Quantitative analysis of the problem, causes, and impacts based on the real driving data. Energy 2021, 225, 120295. [Google Scholar] [CrossRef] [Scilit]
  8. Gao, H.; Wang, R.; Wen, Z.; Xiong, X.; Zheng, Z.; Lin, S.; Ding, H.; Tan, W. The real driving emissions characteristics of light-duty diesel vehicle in four typical cities with varying altitudes in China. Case Stud. Therm. Eng. 2025, 67, 105831. [Google Scholar] [CrossRef] [Scilit]
  9. Liu, Y.; Ma, B.; Zhang, H.; Yu, H.; Li, J.; An, X.; Ma, K.; Liang, Y.; Xu, H. Research on the Assessment Method of Heavy-Duty Vehicle Emission Levels Using Remote Monitoring Data. In E3S Web of Conferences; EDP Sciences: Les Ulis, France, 2025; Volume 630. [Google Scholar]
  10. Publications Official Journal of the European Union. Commission Regulation (EU) 582/2011 of 25 May 2011 Implementing and Amending Regulation (EC) No 595/2009 of the European Parliament and of the Council with Respect to Emissions from Heavy Duty Vehicles (Euro VI) and Amending Annexes I and III to Directive 2007/46/EC of the European Parliament and of the Council (Text with EEA Relevance); Commission Regulation (EU) 582/2011; Publications Official Journal of the European Union: Luxembourg, 2011. [Google Scholar]
  11. GB 17691-2018; Limits and Measurement Methods for Emissions from Diesel Fuelled Heavy-Duty Vehicle (China VI). Ministry of Ecology and Environment of the People’s Republic of China: Beijing, China; State Administration for Market Regulation of the People’s Republic of China: Beijing, China, 2018.
  12. Duan, X.; Feng, L.; Liu, H.; Jiang, P.; Chen, C.; Sun, Z. Experimental investigation on exhaust emissions of a heavy-duty vehicle powered by a methanol-fuelled spark ignition engine under world Harmonized Transient Cycle and actual on-road driving conditions. Energy 2023, 282, 128869. [Google Scholar] [CrossRef] [Scilit]
  13. Liu, G.; Yang, X.; Pei, B.; Xu, H.; Wu, B.; Su, W. Development of a representative transient cycle for evaluating real driving emissions of heavy-duty diesel engines. Atmos. Pollut. Res. 2025, 16, 102520. [Google Scholar] [CrossRef] [Scilit]
  14. Feng, R.; Yu, J.; Shu, X.; Deng, B.; Hua, Z. Can the world harmonized steady cycle (WHSC) accurately reflect real-world driving conditions for heavy-duty diesel engine emission valuations? A comprehensive experimental study. Therm. Sci. Eng. Prog. 2025, 59, 103321. [Google Scholar] [CrossRef] [Scilit]
  15. Mendoza-Villafuerte, P.; Suarez-Bertoa, R.; Giechaskiel, B.; Riccobono, F.; Bulgheroni, C.; Astorga, C.; Perujo, A. NOx, NH3, N2O and PN real driving emissions from a Euro VI heavy-duty vehicle. Impact of regulatory on-road test conditions on emissions. Sci. Total Environ. 2017, 609, 546–555. [Google Scholar] [CrossRef] [Scilit] [PubMed]
  16. Liu, C.; Pei, Y.; Wu, C.; Zhang, F.; Qin, J. The impact of the variation in driving conditions on the NOx emissions characteristics in PEMS test for heavy-duty vehicle. J. Eng. Res. 2023, 13, 294–301. [Google Scholar] [CrossRef] [Scilit]
  17. Publications Official Journal of the European Union. Commission Regulation (EU) 2017/1151 of 1 June 2017 Supplementing Regulation (EC) No 715/2007 on Type-Approval of Motor Vehicles with Respect to Emissions from Light Passenger and Commercial Vehicles (Euro 5 and Euro 6); Commission Regulation (EU) 2017/1151; Publications Official Journal of the European Union: Luxembourg, 2017. [Google Scholar]
  18. GB 18352.6-2016; Limits and Measurement Methods for Emissions from Light-Duty Vehicles. Ministry of Environmental Protection of the People’s Republic of China: Beijing, China; General Administration of Quality Supervision, Inspection and Quarantine of the People’s Republic of China: Beijing, China, 2016.
  19. Liu, K.; Zhou, J.; Pei, Z.; Fu, W.; Yang, H.; Jiang, Z.; Feng, X. Research on transient emissions prediction for natural gas engine using the tuna swarm optimization-extreme gradient boosting algorithm under worldwide harmonized transient cycle. Atmos. Pollut. Res. 2025, 16, 102425. [Google Scholar] [CrossRef] [Scilit]
  20. Valverde, V.; Mora, B.A.; Clairotte, M.; Pavlovic, J.; Suarez-Bertoa, R.; Giechaskiel, B.; Astorga-LLorens, C.; Fontaras, G. Emission Factors Derived from 13 Euro 6b Light-Duty Vehicles Based on Laboratory and On-Road Measurements. Atmosphere 2019, 10, 243. [Google Scholar] [CrossRef] [Scilit]
  21. Lee, Y.; Lee, S.; Lee, S.; Choi, H.; Min, K. Characteristics of NOx emission of light-duty diesel vehicle with LNT and SCR system by season and RDE phase. Sci. Total Environ. 2021, 782, 146750. [Google Scholar] [CrossRef] [Scilit] [PubMed]
  22. Zhang, X.; Li, J.; Liu, H.; Li, Y.; Li, T.; Sun, K.; Wang, T. A fuel-consumption based window method for PEMS NOx emission calculation of heavy-duty diesel vehicles: Method description and case demonstration. J. Environ. Manag. 2023, 325, 116446. [Google Scholar] [CrossRef] [Scilit] [PubMed]
  23. Guo, D.; Yu, Q.; Ren, S.; Wang, T.; Shao, P.; Yang, J.; Shi, F.; Li, T.; Zhang, C. Heavy-duty vehicle emission characteristics based on the remote-monitoring three-bin moving-average window method. In E3S Web of Conferences; EDP Sciences: Les Ulis, France, 2023; Volume 438. [Google Scholar]
  24. California Air Resources Board (CARB). California Exhaust Emission Standards and Test Procedures for 2004 and Subsequent Model Heavy-Duty Diesel Engines and Vehicles; California Air Resources Board (CARB): Sacramento, CA, USA, 2020.
  25. Tian, M.; Huang, Z.; Ma, S.; Fu, M.; Wang, X.; Liu, J.; Yu, Q.; Wang, J.; Yin, H.; Wang, J. Identifying high-emitting heavy-duty vehicles using remote emission sensing technology. Atmos. Environ. X 2025, 28, 100377. [Google Scholar] [CrossRef] [Scilit]
  26. GB 30510-2024; Fuel Consumption Limits for Heavy-Duty Commercial Vehicles. State Administration of Market Regulation: Beijing, China; Standardization Administration of China: Beijing, China; Standards Press of China: Beijing, China, 2024.
  27. Sun, M.; Zhao, X.; Zhao, J.; Liu, N.; Zhao, S.; Guo, Y.; Shi, W.; Si, L. A New Spatial Downscaling Method for Long-Term AVHRR NDVI by Multiscale Residual Convolutional Neural Network. IEEE J. Sel. Top. Appl. Earth Obs. Remote Sens. 2024, 17, 7068–7077. [Google Scholar] [CrossRef] [Scilit]
  28. Dev, S.; Guo, H.; Liko, B.; Lafrance, S.; Conde, A. An Experimental Study on NOx Emissions of a Heavy-Duty Diesel Engine during Cold Start and Idling 2021-01-0535. In SAE Technical Paper; SAE International: Warrendale, PA, USA, 2021. [Google Scholar]
  29. Müller, V.; Pieta, H.; Schaub, J.; Ehrly, M.; Körfer, T. On-Board Monitoring to meet upcoming EU-7 emission standards—Squaring the circle between effectiveness and robust realization. Transp. Eng. 2022, 10, 100138. [Google Scholar] [CrossRef] [Scilit]
Figure 1. Linear fitting of the engine work over WHTC and the maximum engine power.
Atmosphere 17 00487 g001
Figure 2. The total trip number for each vehicle model.
Atmosphere 17 00487 g002
Figure 3. The trip durations for each vehicle model.
Atmosphere 17 00487 g003
Figure 4. The Wtrip/WWHTC for each vehicle model.
Atmosphere 17 00487 g004
Figure 5. The speed distribution profiles of driving trips and cold-start across each vehicle model.
Atmosphere 17 00487 g005
Figure 6. Cold start (0 °C~70 °C) temperature distribution.
Atmosphere 17 00487 g006
Figure 7. Effects of vehicle type and ambient temperature on coolant temperature distribution (0 °C~70 °C).
Atmosphere 17 00487 g007
Figure 8. Cold start (0 °C~70 °C) time ratio.
Atmosphere 17 00487 g008
Figure 9. Cold start (0 °C~70 °C) work.
Atmosphere 17 00487 g009
Figure 10. Cold start (0.1 × Pmax) duration.
Atmosphere 17 00487 g010
Figure 11. Cold start (0.1 × Pmax) emissions.
Atmosphere 17 00487 g011
Figure 12. NOx emissions comparison between the low-load bin (abbreviated as “Low”) and the medium-to-high load bin (abbreviated as “M/H”).
Atmosphere 17 00487 g012
Figure 13. Proportion of Bin 1 and Bin 2 in TBM and 2BM.
Atmosphere 17 00487 g013
Figure 14. Comparison of emission results for Bin 1 (a) and Bin 2 (b) between TBM and 2BM.
Atmosphere 17 00487 g014
Figure 15. Sensitivity analysis of the Bin 1/Bin 2 classification threshold in the TBM method based on Truck 3.
Atmosphere 17 00487 g015
Table 1. Comparison of HDV RDE test requirements.
ParameterEuro 6China 6CARBEPA 2027
MAWWBM, CBMWBM3BM2BM
Cold start evaluationnot requirednot requiredrequired after 2027required
Test startTcoolant ≤ 30 °C or Tamb + 2 °CTcoolant ≤ 30 °C or Tamb + 2 °CTcoolant ≤ 30 °CTcoolant ≤ 40 °C
Low loadPave ≥ 0.1 × PmaxPave ≥ 0.1 × Pmaxidle & low load binBin 1
Operation routeurban, rural & motorwayurban, rural & motorwaynormal routenormal route
h (m)not required≤2400≤1676.4≤1676.4
Pamb (kPa)≥825not required≥825not required
Lower Tamb (°C)−7−7−75
Upper Tamb (°C)−0.4514 × (101.3 − Pamb) + 37.85−0.4514 × (101.3 − Pamb) + 37.85(−0.0083 × h + 68) × 5/9−0.0046 × h + 37.78
Payload≥10%≥10%normal loadnormal load
Test duration(4~7) × WWHTC(4~7) × WWHTC≥2400 windows
for each bin
≥2400 windows
for Bin 1;
≥10,000 windows
for Bin 2
Tcoolant refers to the coolant temperature (°C).
Table 2. Vehicle specifications.
TypeNumber of
Vehicles
GVW
(kg)
WWHTC
(kWh)
Pmax
(kW)
Data Length
(h)
Truck 14449510.1115928.8
Truck 2318,00014.51622043.1
Truck 3331,00026.22941500.6
Tractor 1318,00029.9327964.2
Tractor 2725,00037.14265917.7
Dumper 1544958.881955.5
Dumper 2525,00028.13382396.4
Bus616,00023.12281923.1
Disclaimer/Publisher’s Note: The statements, opinions and data contained in all publications are solely those of the individual author(s) and contributor(s) and not of MDPI and/or the editor(s). MDPI and/or the editor(s) disclaim responsibility for any injury to people or property resulting from any ideas, methods, instructions or products referred to in the content.