Diagnostic Ratios and Directional Analysis of Air Pollutants for Source Identification: A Global Perspective with Insights from Kuwait
Abstract
1. Introduction
2. Methodology
2.1. Climate of Kuwait
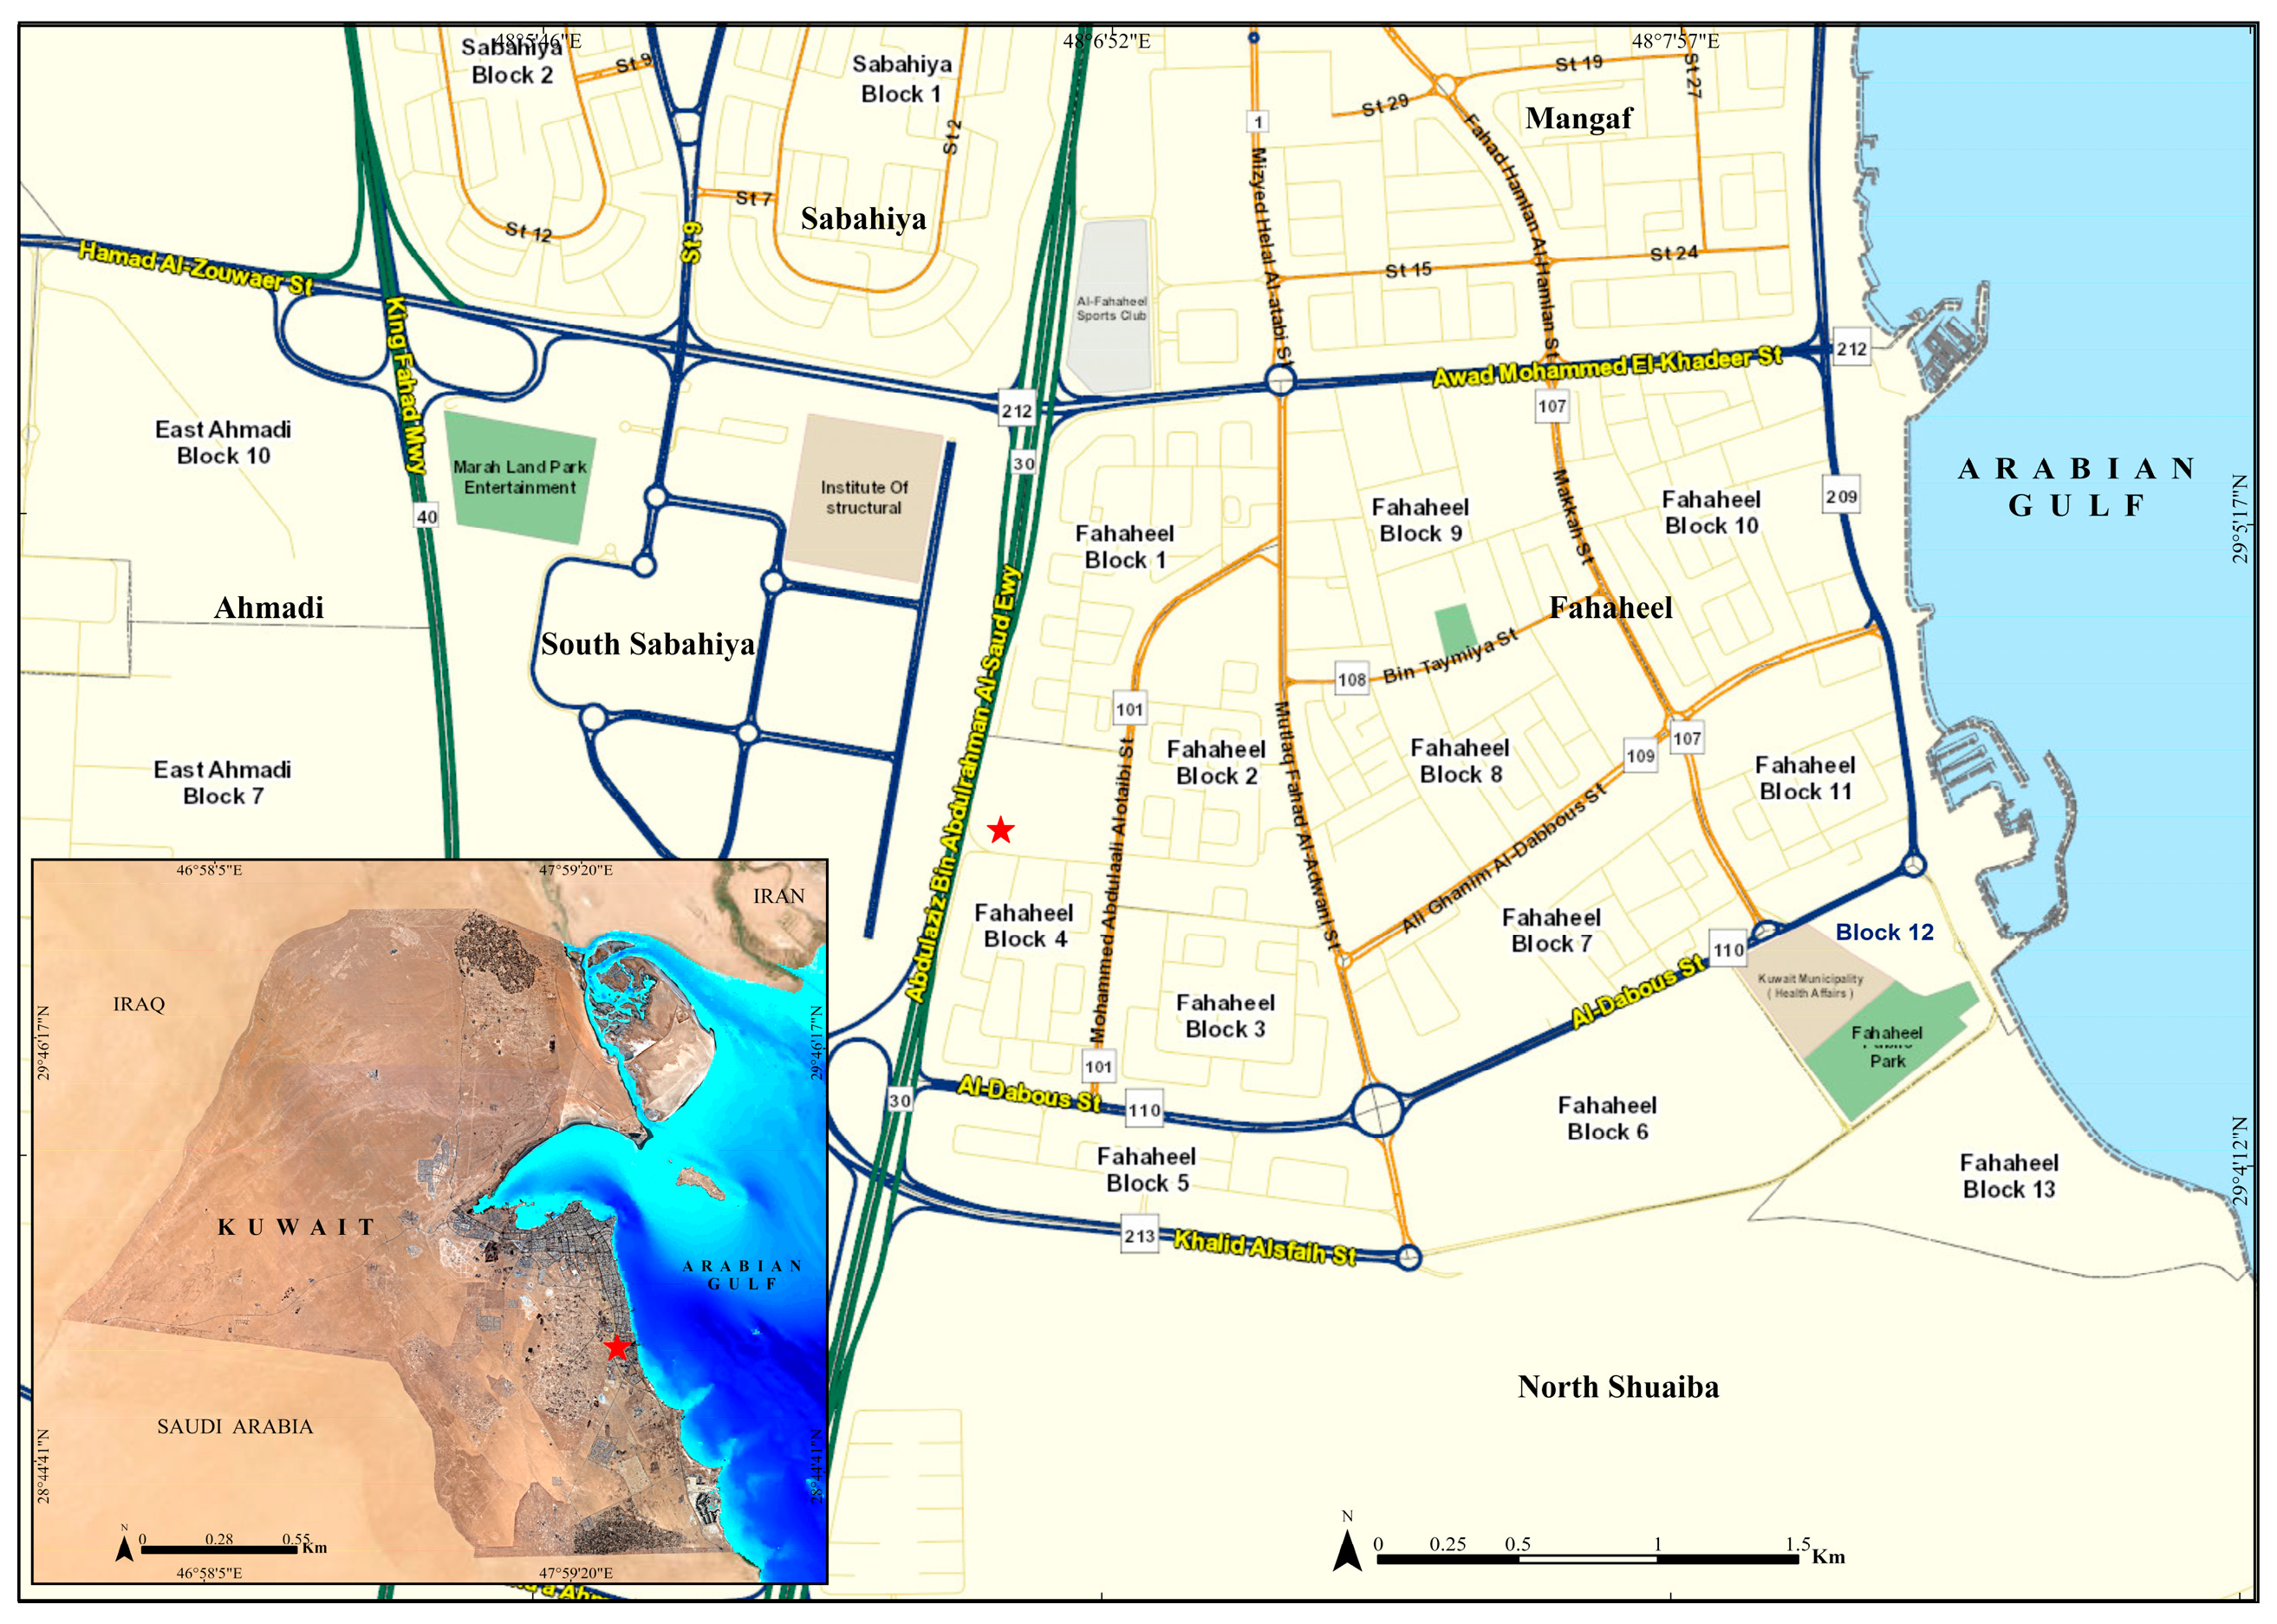
2.2. Description of Study Area
- North: Mangaf residential area.
- South: Major industrial zones including Mina Al-Ahmadi, Mina Al-Shuaiba, and Mina Abdullah.
- East: Arabian Gulf.
- West: Abdulaziz Bin Abdulrahman Al-Saud Expressway (Road 30).

2.3. Data Acquisition/Interpretation
3. Results and Discussion
3.1. Ratio Diagnostics in Literature: A Global Summary
3.2. Indicative Ratios for Pollution Sources in Kuwait
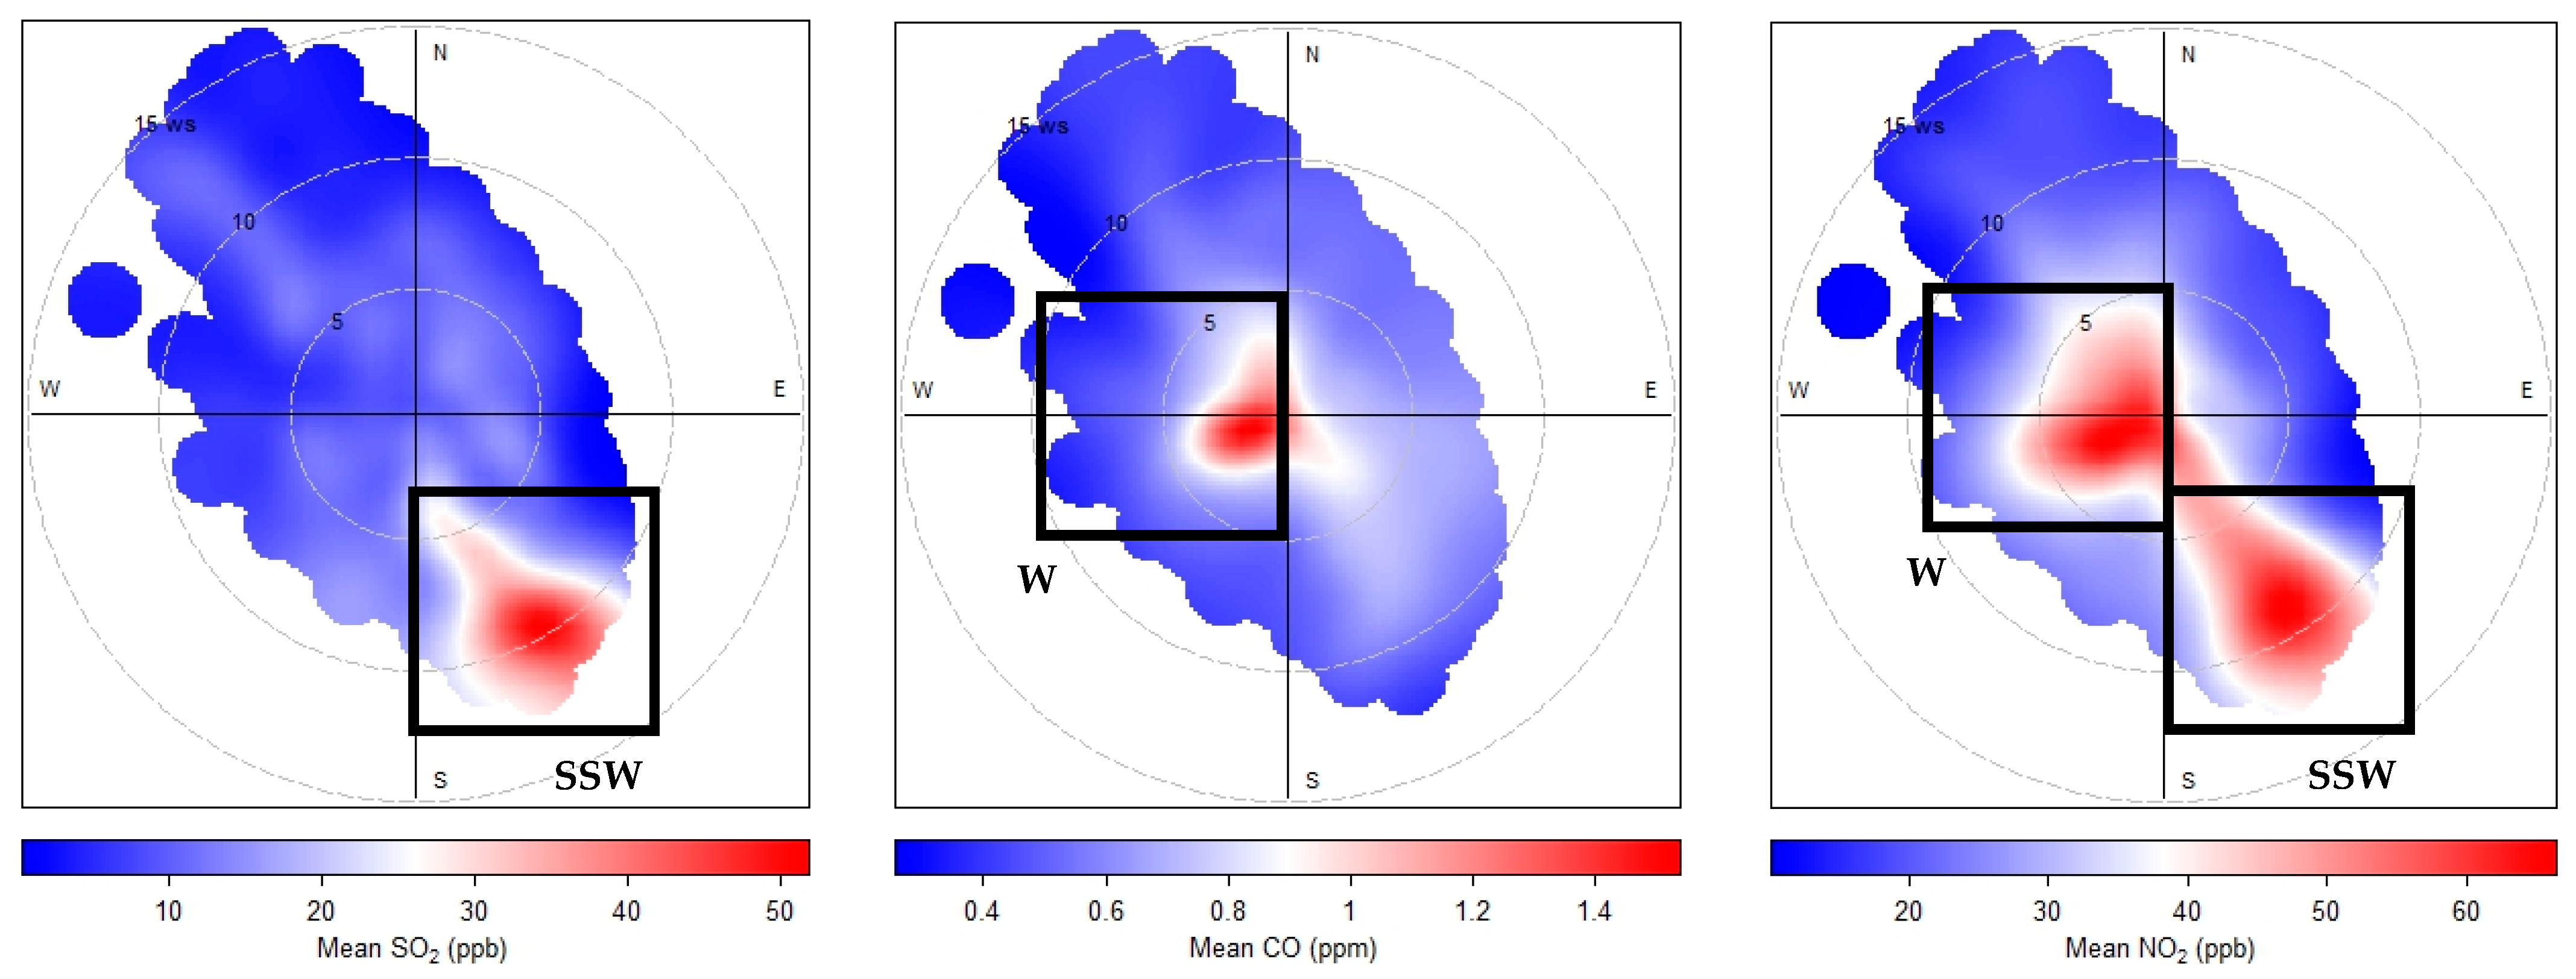
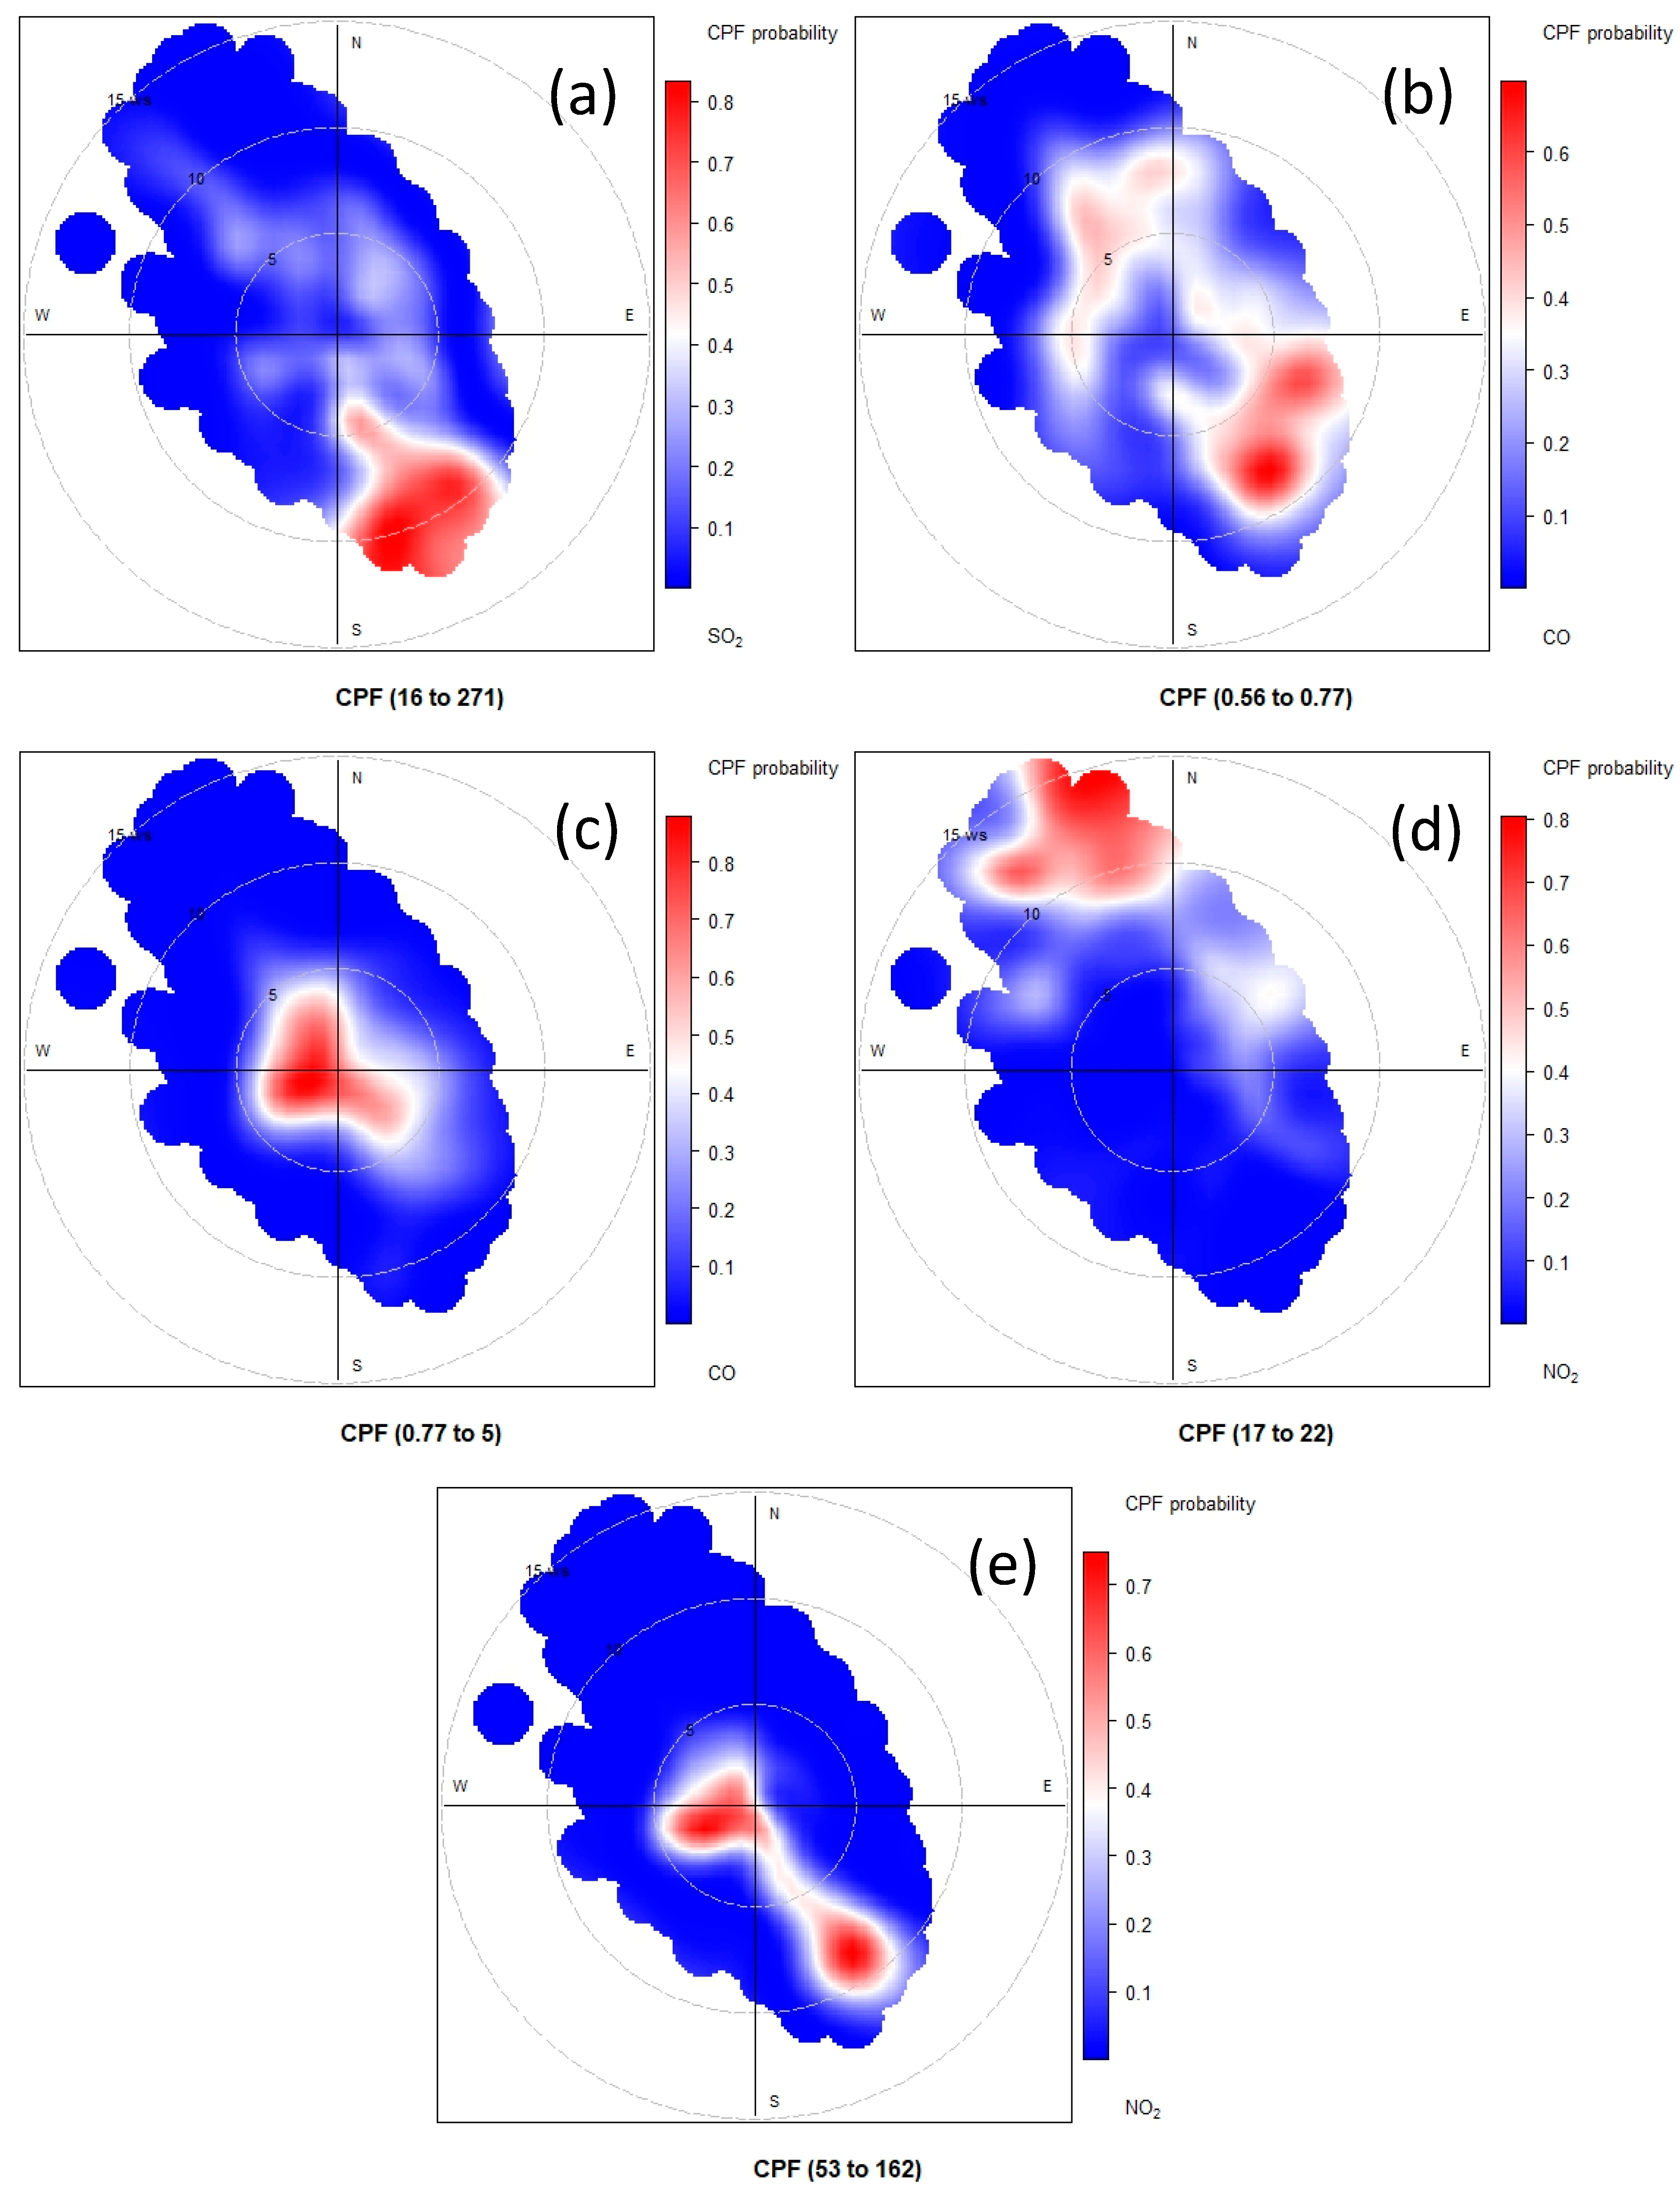
3.3. Directional Source Identification in Kuwait Using CBPF Plots
4. Conclusions
Funding
Institutional Review Board Statement
Informed Consent Statement
Data Availability Statement
Acknowledgments
Conflicts of Interest
References
- World Health Organization. WHO Global Air Quality Guidelines: Particulate Matter (PM2. 5 and PM10), Ozone, Nitrogen Dioxide, Sulfur Dioxide and Carbon Monoxide; World Health Organization: Geneva, Switzerland, 2021; ISBN 9789240034228.
- Zhao, C.; Sun, Y.; Zhong, Y.; Xu, S.; Liang, Y.; Liu, S.; He, X.; Zhu, J.; Shibamoto, T.; He, M. Spatio-Temporal Analysis of Urban Air Pollutants throughout China during 2014–2019. Air Qual. Atmos. Health 2021, 14, 1619–1632. [Google Scholar] [CrossRef]
- Amoatey, P.; Omidvarborna, H.; Baawain, M.S.; Al-Mamun, A. Indoor Air Pollution and Exposure Assessment of the Gulf Cooperation Council Countries: A Critical Review. Environ. Int. 2018, 121, 491–506. [Google Scholar] [CrossRef] [PubMed]
- World Health Organization. WHO Guidelines for Indoor Air Quality: Selected Pollutants; World Health Organization: Geneva, Switzerland, 2010; ISBN 9789289002134.
- Chen, J.; Hoek, G. Long-Term Exposure to PM and All-Cause and Cause-Specific Mortality: A Systematic Review and Meta-Analysis. Environ. Int. 2020, 143, 105974. [Google Scholar] [CrossRef] [PubMed]
- Huangfu, P.; Atkinson, R. Long-Term Exposure to NO2 and O3 and All-Cause and Respiratory Mortality: A Systematic Review and Meta-Analysis. Environ. Int. 2020, 144, 105998. [Google Scholar] [CrossRef] [PubMed]
- Orellano, P.; Reynoso, J.; Quaranta, N. Short-Term Exposure to Sulphur Dioxide (SO2) and All-Cause and Respiratory Mortality: A Systematic Review and Meta-Analysis. Environ. Int. 2021, 150, 106434. [Google Scholar] [CrossRef]
- Chen, T.-M.; Kuschner, W.G.; Gokhale, J.; Shofer, S. Outdoor Air Pollution: Nitrogen Dioxide, Sulfur Dioxide, and Carbon Monoxide Health Effects. Am. J. Med. Sci. 2007, 333, 249–256. [Google Scholar] [CrossRef]
- Doğruparmak, Ş.Ç.; Özbay, B. Investigating Correlations and Variations of Air Pollutant Concentrations under Conditions of Rapid Industrialization–Kocaeli (1987–2009). CLEAN Soil Air Water 2011, 39, 597–604. [Google Scholar] [CrossRef]
- Uria-Tellaetxe, I.; Carslaw, D.C. Conditional Bivariate Probability Function for Source Identification. Environ. Model. Softw. 2014, 59, 1–9. [Google Scholar] [CrossRef]
- Althuwaynee, O.F.; Pokharel, B.; Aydda, A.; Balogun, A.-L.; Kim, S.-W.; Park, H.-J. Spatial Identification and Temporal Prediction of Air Pollution Sources Using Conditional Bivariate Probability Function and Time Series Signature. J. Expo. Sci. Environ. Epidemiol. 2021, 31, 709–726. [Google Scholar] [CrossRef] [PubMed]
- Nguyen, T.N.T.; Vuong, Q.T.; Lee, S.-J.; Xiao, H.; Choi, S.-D. Identification of Source Areas of Polycyclic Aromatic Hydrocarbons in Ulsan, South Korea, Using Hybrid Receptor Models and the Conditional Bivariate Probability Function. Environ. Sci. Process. Impacts 2022, 24, 140–151. [Google Scholar] [CrossRef]
- Sooktawee, S.; Kanabkaew, T.; Boonyapitak, S.; Patpai, A.; Piemyai, N. Characterising Particulate Matter Source Contributions in the Pollution Control Zone of Mining and Related Industries Using Bivariate Statistical Techniques. Sci. Rep. 2020, 10, 21372. [Google Scholar] [CrossRef] [PubMed]
- Al-Dabbous, A.N.; Alsulaili, A.; Al-Dabbous, S.K. Description of Outdoor Air Quality in the Arabian Peninsula: A Case Study of Kuwait. In Environmental Hazards in the Arabian Gulf Region. Advances in Natural and Technological Hazards Research; Abd el-aal, A.e.K., Al-Enezi, A., Karam, Q.E., Eds.; Springer: Cham, Switzerland, 2024; Volume 54, pp. 265–284. ISBN 3-031-71836-4. [Google Scholar]
- Alkhalidi, M.; Al-Dabbous, A.; Al-Dabbous, S.; Alzaid, D. Evaluating the Accuracy of the ERA5 Model in Predicting Wind Speeds Across Coastal and Offshore Regions. J. Mar. Sci. Eng. 2025, 13, 149. [Google Scholar] [CrossRef]
- The Directorate General of Civil Aviation (Meteorological Department). Available online: https://www.met.gov.kw/Climate/climate.php?lang=eng#Annual_Report (accessed on 1 July 2025).
- Al-Dabbous, A.; Khan, A.; Al-Rashidi, M.; Awadi, L. Carbon Dioxide and Volatile Organic Compounds Levels in Mosque in Hot Arid Climate. Indoor Built Environ. 2013, 22, 456–464. [Google Scholar] [CrossRef]
- Al-Dabbous, A.N.; Kumar, P. Source Apportionment of Airborne Nanoparticles in a Middle Eastern City Using Positive Matrix Factorization. Environ. Sci. Process. Impacts 2015, 17, 802–812. [Google Scholar] [CrossRef]
- Al-Salem, S.; Khan, A. Monitoring and Modelling the Trends of Primary and Secondary Air Pollution Precursors: The Case of the State of Kuwait. Int. J. Chem. Eng. 2010, 2010, 879836. [Google Scholar] [CrossRef]
- Carslaw, D.C.; Ropkins, K. Openair—An R Package for Air Quality Data Analysis. Environ. Model. Softw. 2012, 27, 52–61. [Google Scholar] [CrossRef]
- Aneja, V.P.; Agarwal, A.; Roelle, P.A.; Phillips, S.B.; Tong, Q.; Watkins, N.; Yablonsky, R. Measurements and Analysis of Criteria Pollutants in New Delhi, India. Environ. Int. 2001, 27, 35–42. [Google Scholar] [CrossRef]
- Salmon, O.; Shepson, P.; Ren, X.; He, H.; Hall, D.; Dickerson, R.; Stirm, B.; Brown, S.; Fibiger, D.; McDuffie, E. Top-down Estimates of NOx and CO Emissions from Washington, DC-Baltimore during the WINTER Campaign. J. Geophys. Res. Atmos. 2018, 123, 7705–7724. [Google Scholar] [CrossRef]
- Simon, H.; Valin, L.C.; Baker, K.R.; Henderson, B.H.; Crawford, J.H.; Pusede, S.E.; Kelly, J.T.; Foley, K.M.; Chris Owen, R.; Cohen, R.C. Characterizing CO and NOy Sources and Relative Ambient Ratios in the Baltimore Area Using Ambient Measurements and Source Attribution Modeling. J. Geophys. Res. Atmos. 2018, 123, 3304–3320. [Google Scholar] [CrossRef]
- Sadeq, A.M.; Homod, R.Z.; Hasan, H.A.; Alhasnawi, B.N.; Hussein, A.K.; Jahangiri, A.; Togun, H.; Dehghani-Soufi, M.; Abbas, S. Advancements in Combustion Technologies: A Review of Innovations, Methodologies, and Practical Applications. Energy Convers. Manag. X 2025, 26, 100964. [Google Scholar] [CrossRef]
- Sumarsono, D.A.; Agama, A.A.; Kurniawan, A.; Setiapraja, H. Performance, Emissions, and Combustion Analysis of Gasoline-Ethanol-Methanol Blends in a Spark-Ignition Engine. Results Eng. 2025, 26, 105264. [Google Scholar]
- Garg, A.; Shukla, P.; Bhattacharya, S.; Dadhwal, V. Sub-Region (District) and Sector Level SO2 and NOx Emissions for India: Assessment of Inventories and Mitigation Flexibility. Atmos. Environ. 2001, 35, 703–713. [Google Scholar] [CrossRef]
- Halim, N.D.A.; Latif, M.T.; Ahamad, F.; Dominick, D.; Chung, J.X.; Juneng, L.; Khan, M.F. The Long-Term Assessment of Air Quality on an Island in Malaysia. Heliyon 2018, 4, e01054. [Google Scholar] [CrossRef]
- Ravindra, K.; Wauters, E.; Tyagi, S.K.; Mor, S.; Van Grieken, R. Assessment of Air Quality after the Implementation of Compressed Natural Gas (CNG) as Fuel in Public Transport in Delhi, India. Environ. Monit. Assess. 2006, 115, 405–417. [Google Scholar] [CrossRef] [PubMed][Green Version]
- Haider, R.; Yasar, A.; Tabinda, A.B. Urban Emission Patterns at a Semi-Arid Site in Lahore, Pakistan. Pol. J. Environ. Stud. 2017, 26, 59–68. [Google Scholar] [CrossRef]
- Nirel, R.; Dayan, U. On the Ratio of Sulfur Dioxide to Nitrogen Oxides as an Indicator of Air Pollution Sources. J. Appl. Meteorol. 2001, 40, 1209–1222. [Google Scholar] [CrossRef]
- Ibeto, C.; Ugwu, C. Exhaust Emissions from Engines Fuelled with Petrol, Diesel and Their Blends with Biodiesel Produced from Waste Cooking Oil. Pol. J. Environ. Stud. 2019, 28, 3197–3206. [Google Scholar] [CrossRef]
- Yasar, A.; Haider, R.; Tabinda, A.B.; Kausar, F.; Khan, M. A Comparison of Engine Emissions from Heavy, Medium, and Light Vehicles for CNG, Diesel, and Gasoline Fuels. Pol. J. Environ. Stud. 2013, 22, 1277–1281. [Google Scholar]
- Parrish, D.D. Critical Evaluation of US On-Road Vehicle Emission Inventories. Atmos. Environ. 2006, 40, 2288–2300. [Google Scholar] [CrossRef]
- Wallace, H.; Jobson, B.; Erickson, M.; McCoskey, J.; VanReken, T.; Lamb, B.; Vaughan, J.; Hardy, R.; Cole, J.; Strachan, S. Comparison of Wintertime CO to NOx Ratios to MOVES and MOBILE6. 2 on-Road Emissions Inventories. Atmos. Environ. 2012, 63, 289–297. [Google Scholar] [CrossRef]
- Chang, J.H.W.; Chee, F.P.; Kong, S.S.K.; Sentian, J. Variability of the PM10 Concentration in the Urban Atmosphere of Sabah and Its Responses to Diurnal and Weekly Changes of CO, NO2, SO2 and Ozone. Asian J. Atmos. Environ. 2018, 12, 109–126. [Google Scholar] [CrossRef]
- Fujita, E.M.; Campbell, D.E.; Zielinska, B.; Chow, J.C.; Lindhjem, C.E.; DenBleyker, A.; Bishop, G.A.; Schuchmann, B.G.; Stedman, D.H.; Lawson, D.R. Comparison of the MOVES2010a, MOBILE6. 2, and EMFAC2007 Mobile Source Emission Models with on-Road Traffic Tunnel and Remote Sensing Measurements. J. Air Waste Manag. Assoc. 2012, 62, 1134–1149. [Google Scholar] [CrossRef] [PubMed]
- Krotkov, N.A.; McLinden, C.A.; Li, C.; Lamsal, L.N.; Celarier, E.A.; Marchenko, S.V.; Swartz, W.H.; Bucsela, E.J.; Joiner, J.; Duncan, B.N. Aura OMI Observations of Regional SO 2 and NO 2 Pollution Changes from 2005 to 2015. Atmos. Chem. Phys. 2016, 16, 4605–4629. [Google Scholar] [CrossRef]
- Li, P.; Zhuo, Y.; Feng, C.; Hu, P. Effects of Interfering Gases on Catalytic Oxidation of Carbon Monoxide over Manganese Dioxide in Industrial Scenarios: A Systematic Study. Mol. Catal. 2024, 565, 114362. [Google Scholar] [CrossRef]
- Ali, M.A.; Assiri, M.E.; Islam, M.N.; Bilal, M.; Ghulam, A.; Huang, Z. Identification of NO2 and SO2 over China: Characterization of Polluted and Hotspots Provinces. Air Qual. Atmos. Health 2024, 17, 2203–2221. [Google Scholar] [CrossRef]
- Filonchyk, M.; Peterson, M.P. An Integrated Analysis of Air Pollution from US Coal-Fired Power Plants. Geosci. Front. 2023, 14, 101498. [Google Scholar] [CrossRef]
- Wang, Y.; Ali, M.A.; Bilal, M.; Qiu, Z.; Mhawish, A.; Almazroui, M.; Shahid, S.; Islam, M.N.; Zhang, Y.; Haque, M.N. Identification of NO2 and SO2 Pollution Hotspots and Sources in Jiangsu Province of China. Remote Sens. 2021, 13, 3742. [Google Scholar] [CrossRef]
- Zheng, B.; Tong, D.; Li, M.; Liu, F.; Hong, C.; Geng, G.; Li, H.; Li, X.; Peng, L.; Qi, J. Trends in China’s Anthropogenic Emissions since 2010 as the Consequence of Clean Air Actions. Atmos. Chem. Phys. 2018, 18, 14095–14111. [Google Scholar] [CrossRef]
- Zhao, P.; Tuygun, G.T.; Li, B.; Liu, J.; Yuan, L.; Luo, Y.; Xiao, H.; Zhou, Y. The Effect of Environmental Regulations on Air Quality: A Long-Term Trend Analysis of SO2 and NO2 in the Largest Urban Agglomeration in Southwest China. Atmos. Pollut. Res. 2019, 10, 2030–2039. [Google Scholar]
- Ali, M.A.; Wang, Y.; Bilal, M.; Assiri, M.E.; Islam, A.R.M.T.; Malafaia, G.; Huang, Z.; Mhawish, A.; Islam, M.N.; Qiu, Z. Trace Gases over Land and Ocean Surfaces of China: Hotspots, Trends, and Source Contributions. Earth Syst. Environ. 2023, 7, 801–819. [Google Scholar] [CrossRef]
- Andreae, M.O.; Merlet, P. Emission of Trace Gases and Aerosols from Biomass Burning. Global Biogeochem. Cycles 2001, 15, 955–966. [Google Scholar] [CrossRef]
- Streets, D.G.; Bond, T.; Carmichael, G.; Fernandes, S.; Fu, Q.; He, D.; Klimont, Z.; Nelson, S.; Tsai, N.; Wang, M.Q. An Inventory of Gaseous and Primary Aerosol Emissions in Asia in the Year 2000. J. Geophys. Res. Atmos. 2003, 108, 8809. [Google Scholar] [CrossRef]
- Jain, N.; Bhatia, A.; Pathak, H. Emission of Air Pollutants from Crop Residue Burning in India. Aerosol Air Qual. Res. 2014, 14, 422–430. [Google Scholar] [CrossRef]
- Chen, L.-W.A.; Moosmüller, H.; Arnott, W.P.; Chow, J.C.; Watson, J.G.; Susott, R.A.; Babbitt, R.E.; Wold, C.E.; Lincoln, E.N.; Hao, W.M. Emissions from Laboratory Combustion of Wildland Fuels: Emission Factors and Source Profiles. Environ. Sci. Technol. 2007, 41, 4317–4325. [Google Scholar] [CrossRef] [PubMed]
- Akagi, S.; Yokelson, R.J.; Wiedinmyer, C.; Alvarado, M.J.; Reid, J.S.; Karl, T.; Crounse, J.D.; Wennberg, P.O. Emission Factors for Open and Domestic Biomass Burning for Use in Atmospheric Models. Atmos. Chem. Phys. 2011, 11, 4039–4072. [Google Scholar] [CrossRef]
- Bentson, S.; Evitt, D.; Still, D.; Lieberman, D.; MacCarty, N. Retrofitting Stoves with Forced Jets of Primary Air Improves Speed, Emissions, and Efficiency: Evidence from Six Types of Biomass Cookstoves. Energy Sustain. Dev. 2022, 71, 104–117. [Google Scholar] [CrossRef]
- Hayyat, U.; Khan, M.U.; Farooq, M.; Sultan, M.; Amjed, M.A.; Liu, G.; Chunyu, X.; Riaz, F.; Alkhedher, M. Recent Developments and Challenges in Biomass Cookstove. Energy Rep. 2024, 12, 2193–2208. [Google Scholar] [CrossRef]
- Vakkilainen, E.K. Industrial Applications of Steam Generated from Biomass. In Comprehensive Renewable Energy; Elsevier: Amsterdam, The Netherlands, 2022; pp. 299–329. ISBN 978-0-12-819734-9. [Google Scholar]


| Season 1 | Seasonal Phase | Duration | Days | Typical Weather Conditions | Dominant Wind Patterns |
|---|---|---|---|---|---|
| Winter | Cold | 6 Dec–15 Jan | 41 | Cold weather with NW winds, warm weather intervals with wet SE winds | NW, SE |
| Mild | 16 Jan–15 Feb | 31 | Rain with SE winds, severe cold weather with NW winds | NW, SE | |
| Spring | Cold moderate | 16 Feb–8 April | 52 | Increase in temperature, hot S winds, and then moderate cold W winds, thunder, and dust storms | S, W, E (daytime), SE (daytime) |
| Warm | 9 April–20 May | 42 | More increase in temperature, humid and hot with SE winds, followed by NW winds, thunder, and dust storms | SE (morning), NW, E (afternoon) | |
| Summer | Transition | 21 May–5 Jun | 16 | Initiating summer with high temperatures and clear skies | Fluctuated |
| Dry | 6 Jun–19 Jul | 44 | Hot and dry with frequent dust storms | NW | |
| Wet | 20 Jul–4 Nov | 108 | Hot and humid with light E and SE winds | E, SE | |
| Autumn | - | 5 Nov–5 Dec | 31 | Hot and humid with SE winds, cold (night) and warm (daytime) | SE, NW (at the end of the season) |
| Source Type | SO2/NOx | CO/NOx | Key Indicators |
|---|---|---|---|
| Vehicular emissions | Very low | Moderate to high (variable) | Vehicular emissions are characterized by minimal sulfur content in their fuels, resulting in very low SO2/NOx ratios. CO/NOx ratios in vehicular emissions can be (i) high (~50) in older or poorly tuned vehicles, (ii) moderate (~4–16) in modern urban fleets, and (iii) relatively low (~<1) in diesel engines, and in modern vehicular emissions with well-maintained engines or emission control technologies. |
| Industrial emissions | Moderate to high | Low | Industrial sources show low CO/NOx ratios due to efficient combustion processes designed for complete carbon oxidation. An SO2/NOx ratio exceeding approximately 0.6 is suggested as a quantitative marker for industry-dominated air pollution, depending on source strength and emission control technologies. In heavy industries such as oil refineries, this ratio is often observed to exceed 1, reflecting the higher sulfur content of fuels and limited desulfurization. |
| Biomass burning emissions | Very low | Moderate to high | Biomass burning are characterized by minimal sulfur content in its fuels, resulting in very low SO2/NOx ratios. Various types of biomass burning typically produce high CO/NOx ratios exceeding 15, indicating incomplete combustion. Both biomass burning and vehicular emissions exhibit high CO/NOx and low SO2/NOx ratios, but they are distinguishable by their distinct temporal and spatial patterns. |
Disclaimer/Publisher’s Note: The statements, opinions and data contained in all publications are solely those of the individual author(s) and contributor(s) and not of MDPI and/or the editor(s). MDPI and/or the editor(s) disclaim responsibility for any injury to people or property resulting from any ideas, methods, instructions or products referred to in the content. |
© 2025 by the author. Licensee MDPI, Basel, Switzerland. This article is an open access article distributed under the terms and conditions of the Creative Commons Attribution (CC BY) license (https://creativecommons.org/licenses/by/4.0/).
Share and Cite
Al-Dabbous, A.N. Diagnostic Ratios and Directional Analysis of Air Pollutants for Source Identification: A Global Perspective with Insights from Kuwait. Atmosphere 2025, 16, 1101. https://doi.org/10.3390/atmos16091101
Al-Dabbous AN. Diagnostic Ratios and Directional Analysis of Air Pollutants for Source Identification: A Global Perspective with Insights from Kuwait. Atmosphere. 2025; 16(9):1101. https://doi.org/10.3390/atmos16091101
Chicago/Turabian StyleAl-Dabbous, Abdullah N. 2025. "Diagnostic Ratios and Directional Analysis of Air Pollutants for Source Identification: A Global Perspective with Insights from Kuwait" Atmosphere 16, no. 9: 1101. https://doi.org/10.3390/atmos16091101
APA StyleAl-Dabbous, A. N. (2025). Diagnostic Ratios and Directional Analysis of Air Pollutants for Source Identification: A Global Perspective with Insights from Kuwait. Atmosphere, 16(9), 1101. https://doi.org/10.3390/atmos16091101


