Abstract
The volumetric Hirst method is considered a golden standard in aerobiology for determining particle number concentrations of bioaerosols. Using Hirst-type pollen and spore traps on mobile platforms (i.e., aircraft, cars, motorbikes, bicycles or carried by pedestrians) is anticipated to significantly enhance the spatial and temporal granularity of data for bioaerosol monitoring. Mobile sampling promises to enhance our understanding of bioaerosol dynamics, ecological interactions and the impact of human activities on airborne biological particles. In this article, we present the design and test of an airborne Hirst-type volumetric sampler. We followed a structured approach and incorporated the fundamental principles of the original design, while optimizing for size, weight, power and cost. Our portable Hirst-type volumetric sampler (FlyHirst) was attached to an ultralight aircraft, together with complementing instrumentation, and was tested for collection of atmospheric concentrations of pollen, fungal spores and hyphae. By linking the temporal resolution of the samples with the spatial position of the aircraft, using flight time, we calculated the spatial resolution of our measurements in 3D. In six summer flights over Denmark, our study revealed that the diversity of the recorded spores corresponded to the seasonal expectance. Urtica pollen was recorded up to 1300 m above ground (a.g.l.), and fungal spores up to 2100 m a.g.l. We suggest that, based on this proof-of-concept, FlyHirst can be applied on other mobile platforms or as a personal sampler.
1. Introduction
There is increasing interest in studying primary biological aerosols due to their relevance for human and plant health, as well as their impact on the hydrological cycle and climate through their influence on clouds and precipitation [1] (with references therein). Current research on bioaerosols deals with a wide range of particle sizes, from nano- to micro-sized particles, which is further complicated by bioaerosol concentrations being masked by mineral particle concentrations, requiring bio-selective detection methods [2]. Methodological challenges include on one hand the choice of collection technique appropriate to particle size [1], and on the other hand competing bio-analytical techniques, each having their advantages and limitations: culture-based, cheap but selective and slow; microscopic, cheap and routine, but limited to particles >3 micrometer and only genus-specific; metagenomic analysis targeting the variability of conserved regions, highly specific and routine, but selective and laborious; next-generation sequencing (NGS), in-depth specific and non-selective, but laborious and expensive. Pollen and fungal spores are the most studied bioaerosol components due to their allergenic potential, and also, for the spores, their capacity as plant pathogens. However, their relatively large size and the need for specific identification has so far limited their quantification to morphological and DNA methods, while continuous particle counting, comparable to air quality particulate matter measurements, is still under early development [3,4].
Volumetric sampling is the method of choice for exploring the diversity of airborne pollen and fungal spores. Standard measurements according to the European standard method [5] are usually performed either on the ground close to local sources or, at best, at roof top level (up to 30 m above the ground) using pollen and spore traps of the Hirst design [6] coupled with microscopic analysis to determine morphology-specific particle number concentrations vs. time. Hirst samplers work on the principle of impaction, which requires the sample air to be sucked actively at a predetermined fixed rate through a jet and against a sticky surface, where particles with an aerodynamic cut-off size >3 µm are impacted [6]. At intervals, the sticky surface is removed, and the sample is subjected to (usually microscopic) analysis. There have been efforts to explore bioaerosols at higher altitudes using airplanes [7,8,9], UAVs [10] or balloons [11], but all of these methods collected cumulative samples on filters, glass slides, petri dishes, or even through impingers in liquid [7,12], limiting the measurement of concentration changes along the flight path. By introducing continuous temporally resolved sampling and linking the sample time stamps to geographical area and altitude, researchers would be able to describe the 3D characteristics of airborne pollen and spore clouds and link them either to sources on the ground or to atmospheric characteristics. Although the Hirst-type samplers available on the market allow for continuous temporally resolved sampling, resolution is usually limited to one- or two-hour intervals, which is insufficient for short flights and for capturing changes in the atmosphere due to the fast horizontal and vertical movement of the aircraft. The exception is the Burkard Scientific SporeWatch [13], but its weight exceeds 3 kg, making it unsuitable for use on airborne platforms. To our knowledge, the only commercially available lightweight Hirst-type sampler is the Burkard PVAS (Portable Volumetric Air Sampler), but it can only collect single cumulative samples.
The need to develop new methods and adapt existing techniques, to facilitate scientific breakthroughs in the understanding of bioaerosols and their interactions with the environment, has recently been addressed by a large group of experts within the framework of the EU COST Action CA18226 “New Approaches in Detection of Pathogens and Aeroallergens (ADOPT).” The workgroup for mobile and low-cost devices emphasized the importance of mobile sampling for both assessing exposure and exploring atmospheric dispersion. Applying the standard continuous volumetric Hirst method (currently considered the gold standard in aerobiology) for mobile sampling is expected to increase the spatial and temporal granularity of data and foster greater measurement coverage, which will inevitably lead to better mapping of bioaerosols, similar to advancements seen in air quality monitoring [14].
Therefore, the main goal of this study was to design a small light-weight Hirst-type volumetric sampler that provides time-resolved data and has adjustable time resolution from minutes to hours, and to test its performance in quantifying airborne pollen and fungal spores when used on a mobile platform. The study also aimed to build on recent work [15] and to reveal the 3D variability in number concentrations of airborne pollen and fungal spores.
2. Materials and Methods
2.1. Study Area
Air samples were collected over Sjælland (Denmark) from 30 August to 1 September 2024. The study area features diverse land use, dominated by agricultural fields mixed with numerous shrubs and small forest patches. This diversity, along with the proximity of large water bodies (i.e., Isefjord and Roskilde Fjord), allowed for the testing of potential relationships between the quantity and diversity of airborne pollen and fungal spores, and different land use elements. The sampling period was outside the main pollen season, but, according to the “pollen calendar” for eastern Denmark [16], high levels of nettle pollen and of Alternaria and Cladosporium spores, along with medium levels of grass pollen, were expected for surface-level measurements. No data were available for the vertical distribution of these bioaerosol types, whether caused by mixing within the planetary boundary layer (PBL) or by long distance transport.
2.2. Equipment
2.2.1. Portable Hirst-Type Volumetric Sampler—FlyHirst
For designing portable Hirst-type devices, we adopted the approach of scaling down and changing the mechanical clock for driving the sampling surface with a stepper motor and supporting electronics. To simplify sample handling, we decided to sample directly on the microscopic slide rather than on the commonly used Melinex tape. Therefore, instead of a rotating drum with Melinex tape, FlyHirst has a translating microscope slide holder. This approach also simplified positioning the orifice at <1 mm from the microscope glass impaction surface. According to the European standard method [5], 0.7 mm (±0.1 mm) is a prerequisite for the highest capture efficiency of pollen and fungal spores. The distance between the microscope glass and sampling orifice inner edge was designed to be 0.5 mm as shown in the CAD drawing in Figure 1c, considering the thickness of the microscope glass slide of 1 mm. After assembly, the distance between orifice inner edge and microscope glass (Figure 1d) was visually checked for full moving range.
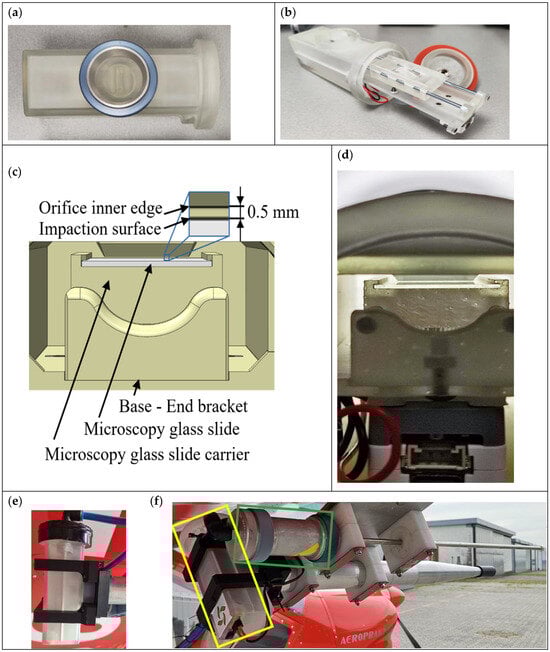
Figure 1.
FlyHirst, a portable volumetric Hirst-type pollen and spore sampler: (a) housing and external orifice with thread for attaching to an air-tight 47 mm coupling using the blue ring nut; (b) components; (c) design details of impactor; (d) microscope slide holder under internal orifice; (e) FlyHirst attached to inlet, mounted under the left wing of the UL aircraft; (f) two bioaerosol samplers mounted under the right wing: yellow rectangle, FlyHirst attached to a 650 mm-long conical inlet; green rectangle, an isokinetic impactor [15] with its own 650 mm-long stainless-steel inlet. The sharpened openings of both isokinetic inlet types (on ground covered for safety reasons and to prevent contamination) had an inner diameter of 4 mm, matching pump performance and aircraft speed.
The portable FlyHirst (Figure 1) is designed for ease of use, featuring a housing (Figure 1a), an inner drawer-style panel (Figure 1b), a linear guiding mechanism with a microscope glass carrier (Figure 1c,d) and a threaded lid (Figure 1a). The housing includes an impactor inlet with a 15 × 1 mm rectangular orifice, a thread for attaching the device to an aircraft, internal triangular grooves to support the drawer-style panel, a thread for securing the lid, a power switch and a power supply connector (type XT-60, AMASS, Changzhou Amass Electronics Co. Ltd., Changzhou, China). The inner drawer-style panel, designed for easy assembly and maintenance, supports the linear guiding mechanism with the microscope glass carrier, as well as the stepper motor and its supporting electronics. It slides in and out of the internal triangular grooves of the housing, requiring only two M3 screws to secure it in place. The linear guiding mechanism features a microscope glass carrier mounted on two linear rails, supported by end brackets, providing smooth and low-friction movement. The threaded lid is designed to close the device by sealing the interior with a silicone ring gasket, preventing air gaps.
The main components of the FlyHirst device were designed using the 3D CAD software, SolidWorks 2024. They were manufactured using stereolithography (SLA) technology, with the Anycubic Photon M3 Premium 3D printer and Anycubic ABS-Like V2 resin. This resin was selected for its similar properties to ABS, offering high toughness, impact resistance and precise dimensions. Additionally, SLA technology allows for the creation of airtight models with excellent sealing capabilities and accurate dimensions.
The supporting electronics, mounted on the underside of the drawer-style panel, included a 12V DC-DC voltage converter, a microcontroller module and a stepper motor driver (AtomS3 Lite ESP32S3 and ATOMIC Stepmotor Base driver DRV8825, ATOM, M5Stack Technology Co. Ltd., Shenzhen, China). For precise movements of the linear guiding mechanism and the microscope glass carrier, a micro-stepping motor (24BYJ48) with a 60:1 gear reduction was selected. The transmission between the micro-stepping motor and the microscope glass carrier, which is positioned on top of the drawer panel, uses a rack and pinion system. In this setup, the pinion (gear) on the stepper motor shaft converts circular motion into linear movement for the linear gear, which is attached to the microscope glass carrier. The micro-stepper motor movement was programmed for linear movement of the glass slide under the orifice at 1 mm every minute. As a result, we were able to analyze bioaerosols at 1 min temporal resolution from samples collected continuously for up to 60 min.
The orifice of the FlyHirst was connected to an isokinetic inlet attached under the aircraft wing (Figure 1e). The inlet consisted of a 650 mm-long conical aluminium pipe with a sharp 4 mm-I.D. opening facing in the direction of aircraft motion. The air flux through the isokinetic inlet was calculated at 2.78 × 106 mm min−1, corresponding to 46.3 m s−1, which matches the air speed of the aircraft. By widening from 4 mm to 40 mm inner diameter at an angle of 4 degrees, the pipe expanded the sample air stream to laminar flow, in which the orifice of the FlyHirst was immersed.
An air flow of up to 40 l min−1 through the device was generated by an on-board suction system [17]. A flowmeter (model 4100, TSI, Shoreview, MN, USA) recorded air flow normalized to standard atmosphere (21.1 C; 101.3 kPa). Checking the flow at the isokinetic inlet before and after flight using an easyFlux (CAVAZZA ANNA, Bologna, Italy) hot wire low resistance flowmeter, did not reveal any losses.
2.2.2. Isokinetic Impactor
An isokinetic impactor for sampling on a polycarbonate membrane filter was used to validate the FlyHirst samples. This sampler, as described earlier [15], consisted of a 650 mm-long stainless-steel pipe (4 mm inner diameter) with a sharp inlet facing in the direction of aircraft motion. A jet was located 3 mm from the surface of the Isopore polycarbonate membrane filter (47 mm diameter, 5.0 μm pore size; Merck, Darmstadt, Germany), which was supported by a stainless-steel mesh. The edge of the filter was sealed and positioned by an aluminum filter holder (Mesa Laboratories, Lakewood, CO, USA). The central area of the filter, 10 mm in diameter, was sealed using an adhesive medium to form an impaction zone opposite the jet, while the remaining surface of the filter facilitated airflow through it. The airflow through the impactor was generated by a vacuum system identical to the one used for the FlyHirst samplers.
2.2.3. Optical Particle Counter
A Portable Aerosol Spectrometer (Dustdecoder 11-D; Grimm Aerosol Technik, Durag Group, Hamburg, Germany), i.e., a battery-powered optical particle counter (OPC), was used for measuring aerosol concentrations. The device constantly samples at a volumetric flow rate of 1.2 l min−1, independent of altitude and temperature, and classifies sampled particles into one of 31 size bins ranging from 0.25 μm to 32 μm. The measurement interval was set to 6 s and the obtained particle concentrations (number of particles m−3) were averaged to 1 min intervals matching the temporal resolution of the FlyHirst. The Grimm OPC was connected to a separate pressure-free isokinetic inlet attached under the left aircraft wing (Brechtel, Hayward, CA, USA) as described earlier [15]. For flight no. 5, during which we sampled along an altitude profile up to 2797 m a.g.l., we converted the OPC data to standard atmosphere, based on altitude–temperature–pressure records written down by the observer during flight. This effected a data correction of up to +36%, depending on altitude (Supplementary Material: Equation S1). For all other flights, which did not exceed 407 m a.g.l., the OPC’s underestimate was deemed insignificant, and data were not converted.
2.2.4. Airborne Instrument Platform
The study focused on mobile sampling using an aircraft, aiming both to test the performance of the Hirst-type volumetric sampler and to explore variations in the diversity of airborne pollen and fungal spores suspended in the atmosphere. An ultralight fixed-wing AP32 aircraft (Aeroprakt, Kiev, Ukraine) was selected, due to its high payload (up to 285 kg; two passengers, 35 kg equipment and 90 l of fuel) and its legal flexibility for modifications, including the inter-changeable attachment of multiple sampling instruments. The same aircraft and sampling inlets were used in recent studies that focused on the isokinetic sampling of airborne pollen and fungal spores [15] and particulate matter [18], allowing us to directly compare and validate our results.
The inlets of the samplers used (i.e., FlyHirst, isokinetic impactor and Grimm OPC) were mounted at least 130 mm below the wing’s lower surface and at least 2180 mm from the aircraft’s center line, in an area defined by the manufacturer as undisturbed by propeller slipstream and engine exhaust. The inlet tips protruded 125 mm forward and at least 205 mm below the wing’s leading edge, ensuring that they remained free of turbulence generated by the wing (Figure 1e).
2.3. Sampling Flights
We conducted six flights between 30 August and 1 September 2024, which facilitated both the evaluation of FlyHirst performance and the examination of variations in airborne pollen and fungal spores over a variety of potential sources and altitudes. In addition to the pilot, there was an observer in the cockpit responsible for switching on the FlyHirst samplers, taking notes on time-specific land use features that the aircraft flew over, monitoring the flow generated by the pumps and observing the physical conditions of the samplers. Details of flights and sampling conditions are summarized in Table 1.

Table 1.
Summary of flights, heights, land use types, sampling periods and sampler types, along with references to Supplementary Materials.
When used, the Grimm OPC was continuously operating for the entire flight. However, the FlyHirst devices had a sampling time of 60 min, after which the slide holders stopped moving. This required a coordinated turning on-and-off of slide motors and suction pumps. For flights nos. 2, 3, 4 and 5, the step motors of the FlyHirst devices were switched on while the aircraft was still on the ground in order to visually confirm that the slide holder moved at the start of sampling. The pumps were then activated immediately before take-off. During these flights, the FlyHirst slide holders, which by design stopped moving after 1 h, stood still during the last 12, 7, 4 and 8 min of the flight, respectively, while the pumps were still running. As a result, the last millimeter of the samples contained bioaerosols collected for ≤12 min from the last leg of the flight.
As calculated by the operational SILAM European air quality forecast v5_9_1 [19,20], the upper limit of the PBL during flights on August 30 and August 31 varied between 1000 and 1300 m, and on 1 September between 700 and 950 m. This way, we were able to plan all flights to remain within the PBL, except for the high-altitude sampling during flight no. 5.
2.4. Analysis of Samples and Data
Aerosol samples on Isopore polycarbonate filters and microscope slides were mounted under cover slips using fuchsine-stained glycerine jelly. The slide holder had been set to move past the orifice in 1 mm steps for every minute of sample, resulting in 15 × 1 mm areas on the slide corresponding to the one-minute sample. To minimize loss of representativity from subsampling, the entire surface of the one-minute samples was analyzed microscopically. Pollen grains, fungal spores and hyphae were identified to the highest most certain taxon or morphotype (Supplementary Material: Figure S9) and counted. The obtained counts were converted to number concentrations (particles m−3) by normalizing to the volume of air sampled during the collection period, in accordance with (2).
The data from Grimm OPC were aggregated to two size classes (>3.515 µm and >5.757 µm) to check the alignment of measured bioaerosol concentrations to measured particulate matter that corresponds in size to the known size of detected pollen and spores (>3 µm).
Flight data (GPS, coordinates and aircraft altitude) were recorded with SkyDemon (Divelements Limited, Yeovil, UK). The altitude was recorded as above sea level (a.s.l.) and was converted to above ground level (a.g.l.) by subtracting earth elevation at each location using the Elevation online converter [21]. Using the time stamps of all recorded data as the common denominator, we used the flight data to convert time-resolved data to 3D-resolved data.
In addition, daily concentrations of pollen and fungal spores were obtained from the two national aerobiological monitoring stations operated by Asthma-Allergy Denmark following the European standard method [5] and standard European guidelines [22,23]. Continuous pollen and spore monitoring was performed with Hirst-type spore traps in Viborg (western Denmark) and Copenhagen (eastern Denmark). Considering the prevailing winds on our flight days, these data were suitable for validating our results with respect to the diversity and local quantity of airborne pollen and fungal spores.
3. Results
3.1. FlyHirst Performance
During flight no. 1, as a result of malfunction of both FlyHirst devices, two entire samples were collected on a 15 mm × 1 mm area, hence it was not possible to obtain temporally resolved data. Examination of the two devices following flight no. 1 revealed that one of the devices had been overtightened during mounting to the aircraft, which distorted its shape and prevented the movement of the sliding mechanism. Although we were able to fix the sliding mechanism, we excluded this device from further collection of data. However, we included it in most flights to gain experience relevant for the device’s future design. The second device had experienced power failure during flight no. 1, which was resolved by replacing an electrical switch. Hereafter, we used the second device for sample collection. Data reported and analyzed in this work are solely from the second device.
FlyHirst performance was validated during flight no. 4 by comparing total particle concentration measured at two different altitudes from FlyHirst samples and samples collected simultaneously on filters using the isokinetic cumulative impactor as described earlier [15]. FlyHirst collected about 22% more particles on average. For both sampling approaches, more than twice the number of particles were recorded at the higher altitude (Figure 2). It is interesting to note that the Grimm OPC also detected more coarse particles at the higher altitude (Figure 2).

Figure 2.
Number concentrations of total pollen and fungal spores from samples collected simultaneously during flight no. 4 at two different heights, 172 and 404 m a.g.l., and averaged for the two heights. “Filter” denotes microscopic quantification of samples collected by cumulative impaction on two filters [15], one for each altitude. “FlyHirst” denotes time-resolved microscopic quantification of one sample collected on a FlyHirst microscopy slide. “Grimm OPC” denotes average particulate matter number concentrations measured using the Grimm OPC.
Pollen concentrations were consistently low and, with few exceptions, limited to heights < 1200 m a.g.l. (Figure 3a–e). The total pollen count consisted almost completely of Urtica. The highest number concentrations were recorded during flight over patches of natural vegetation within an agricultural area. Although flight no. 3 also indicated the importance of local sources by showing that air over water (even at low heights, <200 m a.g.l) contained less suspended Urtica pollen (Figure 3b), the overall very low concentrations prevent conclusions.
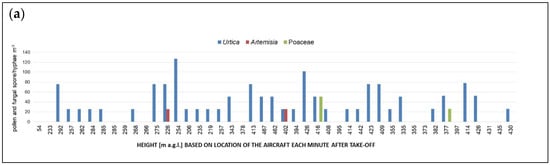
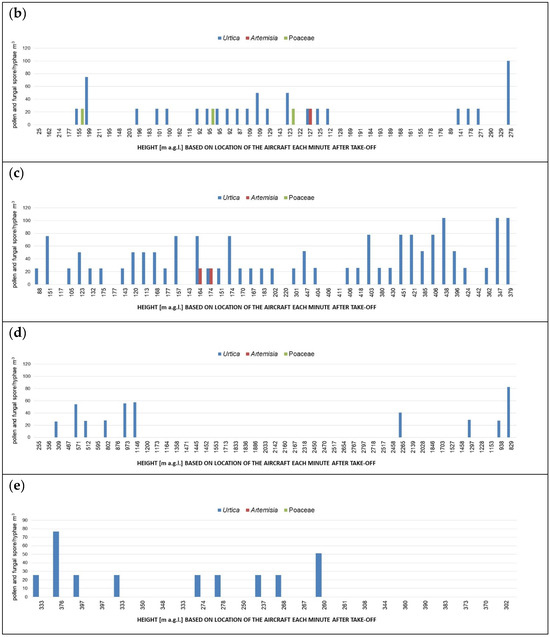
Figure 3.
Number concentrations of pollen identified in the FlyHirst samples collected along the path of flights: no. 2 (a), no. 3 (b), no. 4 (c), no. 5 (d) and no. 6 (e). Each height in meters above ground level (m a.g.l.), as labelled on the x-axes, corresponds to a 3D position of the aircraft each minute while airborne, from take-off until the FlyHirst stopped by design. Mind different scales of y-axes.
The Grimm OPC often did not detect particles larger than 3.515 µm even during minutes when notable quantities of fungal spores, which are known to be larger than 3 µm in diameter, were detected using the FlyHirst (Figure 4a–c).

Figure 4.
Number concentrations of pollen, and fungal spores and hyphae, identified in the FlyHirst samples collected along the paths of flights: no. 3 (a), no. 4 (b) and no. 6 (c). Bars indicate particulate matter number concentrations measured using the Grimm OPC. Each height in meters above ground level (m a.g.l.), as labelled on the x-axes, corresponds to a 3D position of the aircraft each minute while airborne, from take-off until the FlyHirst stopped by design. Mind different scales of y-axes.
3.2. Variation in Diversity and Quantity of Airborne Pollen and Fungal Spores
In the analyzed samples, Urtica pollen was the most frequent and abundant, while Artemisia and Poaceae pollens, although recorded daily, were present in very low quantities (up to three grains per sample for Artemisia and up to nine grains for Poaceae). The highest average hourly concentration of Urtica pollen (36 pollen grains m−3) was recorded in the afternoon sample of August 31 (flight no. 4). The most abundant and frequently recorded spores were from Cladosporium and Alternaria, but also rusts and smuts occasionally exceeded 10% of catch (Table 2).
Table 2.
Diversity of fungal spores (including hyphae) quantified from FlyHirst samples. Average concentration (particles m−3) and percentage for spores contributing at least 1.5% of total catch in at least one sample presented (in brackets).
Flight no. 1 did not allow for the analysis of the spatial characteristics of the measured bioaerosols because the two microscopy slides failed to move, producing two cumulative samples for the whole flight. Sampling over various agricultural fields during flight no. 2 confirmed that a Hirst-type sampler attached to the aircraft can detect both pollen and fungal spores. However, the sampled quantities per minute were quite low, and a <3 min passage over non-agricultural land (forest) did not detect notable peaks of bioaerosols that could be related to the location of the sample along the flight path.
Flight no. 3 was planned to facilitate longer sampling above three different land use classes (i.e., large water surfaces, agricultural fields and forests). The analysis clearly showed lower concentrations of pollen, fungal spores and hyphae in the samples collected over the fjords (Figure 5a). Over land, there were measurable differences in bioaerosol concentration between different parts of the flight path. A notable increase was seen circling above the National Forest (Bidstrup Skovene). Then, circling above an agricultural field, where straw was being harvested, yielded samples with bioaerosol concentrations higher than above surrounding agricultural land. Finally, flying over the North Forest (Nordskoven) resulted in another notable increase in concentrations of pollen, fungal spores and hyphae. The spatial variability in the diversity of fungal spores was also revealed. Rusts and Alternaria spores were particularly abundant in air over the National Forest (Bidstrup Skovene) and above the field with straw harvest (Figure 5b), while smuts were found in the sample over the North Forest (Nordskoven) (Figure 5c).
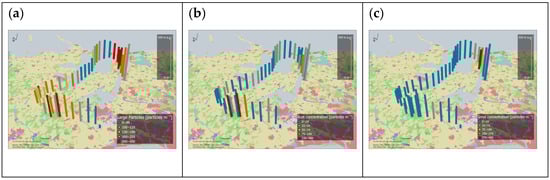
Figure 5.
Particle number concentrations per m3 of air of (a) sum of total pollen, fungal spores and hyphae, (b) rust spores and (c) smut spores, measured along the path of flight no. 3. Locations of bars on the map indicate the GIS positions of the aircraft averaged for 1 min intervals, matching microscopy slide positions in the FlyHirst. Short distances between bars indicate circling of the aircraft. The height of the bars indicates sampling height in m a.g.l. Measured concentrations from the FlyHirst samples were pooled in five concentration classes and displayed by the colors of the bars, as indicated. Results are shown for 38 min of flight, from take-off at Roskilde airport (bottom center) until the FlyHirst stopped by design. The color code for Corine Land Cover Classes [24] represented in the study area is detailed in Supplementary Material Figure S8.
Samples collected during flight no. 5 along an altitudinal profile contained Urtica pollen, fungal hyphae and a variety of fungal spores. Cladosporium, Alternaria, rust, smuts (Tilletia and Ustilago morphotypes) and Ganoderma accounted for more than 81% of the fungal spore catch. Pollen was detected up to about 1300 m a.g.l. (Figure 6a), while most spores were detected under 2140 m a.g.l. (Figure 6b). It is interesting to note that the Grimm OPC did not detect particles > 3.515 µm in the second half of the flight. Also during flight nos. 3, 4 and 6, the Grimm OPC often did not detect particles larger than 3.515 µm even during minutes when notable quantities of fungal spores, which are known to be larger than 3 µm in diameter, were detected using the FlyHirst (Figure 4a–c).

Figure 6.
Number concentrations of particulate matter (measured using the Grimm OPC) presented together with (a) total pollen and fungal material (measured using FlyHirst) and (b) most dominant fungal spores (measured using FlyHirst) during flight no. 5 (1 September 13:28–14:37 UTC). Each height in meters above ground level (m a.g.l.), as labelled on the x-axes, corresponds to a 3D position of the aircraft for each minute while airborne, from take-off until the FlyHirst stopped by design.
3.3. Spore and Pollen Measurements at Monitoring Sites
Daily pollen and spore data were collected from the two sites in the national monitoring programme, located in Viborg (western Denmark) and Copenhagen (eastern Denmark) (Table 3). Primarily Urtica pollen and Alternaria and Cladosporium spores were present in the near ground samples on these days. Data also show high variation between days and sites.
Table 3.
Daily pollen and spore counts (particles m−3) from the two existing Danish monitoring stations, East (Copenhagen) and West (Viborg), Denmark, for 30 August to 1 September 2024.
4. Discussion
Recently, systems for the automatic real-time measurement of bioaerosols were developed [25] (and references therein) with particular focus on airborne pollen [3]. The ultimate goal was to provide real-time measurement of a spectrum of bioaerosols that are relevant for health and plant protection. Regardless, quality assurance requires the validation of automatic measurements against the golden standard [25], which is the volumetric Hirst method [6] and CEN 2020 standard [5].
Atmospheric research and modelling show interest in quantifying aerosol concentrations in the air column utilizing both in situ and remote sensing instruments [26]. Different approaches, such as light detection and ranging (LiDAR) instruments and lunar/sun sky photometers, allow quantifying aerosol mass and particle concentrations along an altitudinal gradient. All those remote sensing instruments require in situ measurements for the validation of atmospheric concentration profiles. This is usually achieved by attaching optical particle counters able to measure the size and concentration of aerosol particles to an unmanned aerial vehicle [27,28,29]. However, none of the mentioned automatic real-time methods allow discrimination between different kinds of aerosols, particularly between different bioaerosols (i.e., pollen vs. fungal spores, even less between different biological genera or species). Only recently, there was progress in distinguishing pollen clouds from other aerosols using a ceilometer [30]. This study showed the possibility of estimating the mass concentration of large aerosols. But discrimination between pollen types of similar size (e.g., birch vs. alder) was still not possible. Our work introduces the Hirst-type volumetric method for sampling from mobile platforms, i.e., aircraft, vehicles or boats. In the future, such samplers may support the validation of automatic measurements from LiDAR systems.
Continuous sampling is more convenient for exploring altitude profiles compared to systems that take cumulative samples at selected altitudes [31], and therefore our study endeavored to use the Hirst-type volumetric method for mobile sampling from an aircraft to allow spatial exploration of bioaerosols and direct comparison to the European standard method [5] used in aerobiology.
An earlier study [32] emphasized the advantage of sampling spores from plant pathogens at different altitudes above a vegetation canopy, and a custom-made Hirst-type sampler was developed to sample on adhesive-covered Melinex tape. By stepwise movement of the holding aluminium drum, using a servo motor, several cumulative samples were collected during UAV flight. In contrast, our FlyHirst facilitated continuous sampling at a one-minute temporal resolution. This approach, together with GPS position recording, allowed us to transfer temporal resolution to spatial resolution and to explore 3D characteristics of the bioaerosol cloud over a studied region. Spatial resolution was approx. 2 km horizontally, considering the speed of the aircraft, and therefore FlyHirst would be suitable for studying local-scale variability of bioaerosol concentrations and validating dispersion models. This would require a larger number of flights and a different sampling strategy in terms of height and geography, which was not possible within the limitations of this study.
The diversity of spores that we recorded corresponded to what was expected during the summer season [33], with so called “dry spores” dominating, as there was no rain to foster the notable emission of hyaline spores. Diversity of pollen detected is notably lower from what was recorded in the same region in June [15], which corresponds to the expected seasonality in flowering of major sources of airborne pollen as depicted in the pollen calendar for Denmark [16]. Fungal spore concentrations were lower than those reported for higher altitudes during the main season [8], while for pollen we recorded more Urtica. Our results, obtained during flights within the PBL, were consistent with the ground-based detection of mainly Urtica, Alternaria and Cladosporium (Table 3). However, when flying over potential sources, like forests or agricultural activities, local bioaerosol signatures were recorded. On the other hand, detecting Cladosporium, Alternaria, rusts, smuts and Ganoderma above the PBL does not prove local sources, as long distance transport may be a factor [9].
The Grimm OPC recorded very few particles in the size range of pollen, fungal spores and hyphae. The discrepancy may relate to the fact that the OPC sampled only 1.2 l min−1, i.e., it analyzed over 30-fold less air than FlyHirst. Even more importantly, the size calibration for OPCs is based on homogenous polystyrene spheres, while dry pollen is not spherical and its cytoplasm cannot be considered homogenous (containing nuclei and other organelles), which is expected to affect size estimation. The discrepancy in pollen size from the expected has been seen in measurements using an air flow cytometer and attributed exactly to numbered aspects [34]. In a different study, a similar discrepancy was noted for a fungal spore species [35]. We speculate that the long tubing that delivered aerosols from the inlet under the wing to the measurement chamber may have retained large biological particles, although the identical system delivered reasonable values for PM10 earlier [18], as verified against air pollution values predicted by modelling. Therefore, collecting particles immediately behind the isokinetic inlet, as was the case for FlyHirst and filter sampling, may offer some advantage when sampling for large and rare particles.
Our FlyHirst development involved design decisions to reduce size, weight, power and cost. Improving even one or two of these criteria can be reason enough for developing a new design. The sampler currently weighs 500 g. By changing the 3D printing resin and embedded electronics, and by eliminating the sturdy housing required for use on the aircraft, we expect to reduce the weight to 300 g. With this next design, the FlyHirst is set to be integrated into a flexible and modular industrial-grade drone system, decreasing the overall cost for sampling and enhancing its capabilities for various applications. This integration aligns with the growing trend in drone technology, driven by advancements in artificial intelligence (AI) and increased autonomy. Further advancements of FlyHirst design will include remote control of the system [36] and sampling directly on the growth medium for identification of specific viable spores [37], which is particularly useful in agricultural settings for monitoring fungal pathogens.
Provided sampling time is adapted to support hourly slide movement, FlyHirst could be a low-cost alternative to standard Burkard and Lanzoni samplers allowing for continuous measurements at multiple locations, which is expected to facilitate local scale bioaerosol studies using similar approaches as in air quality research [38]. We estimate the marginal per-unit production cost of a FlyHirst unit to be below EUR 500. Using standard Hirst-type volumetric sampling on ground mobile platforms (i.e., cars, public transport buses, bicycles; with inlets adapted to speed, situation and purpose) will, like in air quality assessment [14], provide an opportunity to understand local exposure patterns, to locate important emission sources and to develop urban scale particle dispersion models dealing with airborne pollen and spores. However, before absolute values of the measurements can be compared for each of the FlyHirst designs, a thorough metrological assessment will be needed to address sampling and measurement uncertainties, including the sampling efficiency across particle sizes.
In the near future, NGS is expected to become the standard in bioaerosol analysis, in particular for bacteria and viruses, with filter sampling being the most promising sampling method [39]. If FlyHirst should be adaptable to filter sampling, e.g., by redesigning the glass slide carrier to become a filter holder, the envisioned filter–FlyHirst may be able to generate multiple time-resolved filter samples suitable for individual NGS analysis. Then, if mounted on an aircraft or a drone, the filter–FlyHirst would facilitate the detailed characterization of the air microbiome in geographically referenced three-dimensional space.
5. Conclusions
Samples collected using FlyHirst attached under the wings of an ultralight aircraft facilitated the measurement of atmospheric number concentrations of pollen, fungal spores and hyphae. The temporal resolution of the sample was converted to 3D spatial resolution via the GPS position of the aircraft, which facilitated the identification of potential sources of bioaerosols. The approach for studying bioaerosols described in this study will help in exploring 3D profiles of airborne pollen and fungal spores, thus providing data for the validation of particle dispersion models, identifying important sources and revealing altitudinal gradients.
Supplementary Materials
The following supporting information can be downloaded at https://www.mdpi.com/article/10.3390/atmos16091060/s1. Figure S1: Flight no. 1 trajectory presented on Corine Land Cover Classes (CLC 2018 [40]) map; Figure S2: Flight no. 2 trajectory presented on Corine Land Cover Classes (CLC 2018 [40]) map; Figure S3: Flight no. 3 trajectory presented on Corine Land Cover Classes (CLC 2018 [40]) map; Figure S4: Flight no. 3 circling segments over (a) the State Forest (Bidstrup Skovene), (b) agriculture field involved in straw harvest, (c) the North forest (Nordskoven) and (d) urban area (Fredrikssund) presented on Corine Land Cover Classes (CLC 2018 [40]) map; Figure S5: Flight no. 4 trajectory presented on Corine Land Cover Classes (CLC 2018 [40]) map; Figure S6: Flight no. 5 trajectory presented on Corine Land Cover Classes (CLC 2018 [40]) map; Figure S7: Flight no. 6 trajectory presented on Corine Land Cover Classes (CLC 2018 [40]) map; Figure S8: List and colour code for Corine Land Cover Classes (CLC 2018 [40]) represented in study area; Figure S9: Micrographs (x400) of the most abundant spores detected in samples collected by FlyHirst devices during six flights: (a) Alternaria, (b,c) Cladosporium, (d,e) Coprinus/Agaricus/Agrocybe-morphotype, (f) hypha, (g) Epicoccum, (h) Ganoderma, (i) Pithomyces, (j) Polythrincium, (k–m) rusts, (n–p) smuts, (q) Periconia-morphotype, (r) Torula.
Author Contributions
Conceptualization, B.S., S.B., V.S. and P.V.Ø.; data curation, B.I., P.V.Ø. and M.K.; formal analysis, B.I.; investigation, S.B., B.I., V.S., P.V.Ø., M.K. and U.G.; methodology, B.S., S.B. and U.G.; resources, M.K., B.S. and U.G.; software, B.I. and S.B.; supervision, B.S.; validation, B.S., S.B. and U.G.; visualization, B.I., S.B. and P.V.Ø.; writing—original draft, B.S.; writing—review and editing, B.S., S.B., V.S., P.V.Ø., M.K. and U.G. Author V.S. passed away prior to the publication of this manuscript. All authors have read and agreed to the published version of the manuscript.
Funding
This research was funded by the Ministry of Science, Technological Development and Innovation of the Republic of Serbia (grant agreement No. 200358), European Union’s Horizon 2020 research and innovation programme, under grant agreement No. 664387 (ANTARES, https://doi.org/10.3030/739570), APV Vojvodine-Provincial secretariat for high education and science (Short term project: Assessment of exposure to health relevant bioaerosols for population of AP Vojvodina, Grant agreement no. 000883544-2024-09418-003-000-000-001-04-002). In addition, support was provided by the Danish Ministry of Defence Acquisition and Logistics Organisation (DALO/FMI) within the frame of the NATO Technical Activity, SET-HFM-328 “Sequencing for Environmental Aerosol Background Monitoring”, and by the European Research Council (ERC) Synergy Grant DEEP PURPLE (grant agreement no. 856416).
Institutional Review Board Statement
Not applicable. The study did not involve humans, animals, or materials derived from humans or animals.
Informed Consent Statement
Not applicable. The objects of this study were pollen (plants) and fungal spores (microorganisms).
Data Availability Statement
The data that supports the findings of this study are available from the authors upon reasonable request.
Acknowledgments
Our special thanks go to the air traffic controllers of Naviair (Roskilde, Denmark) for facilitating our measuring flights within controlled airspace, and to Frank Stratmann for valuable advice in the design of the airborne sampling system. The study was partly implemented in the frame of the European Cooperation in Science and Technology (EU-COST) program, “New approaches in detection of pathogens and aeroallergens (ADOPT)”. The authors are thankful to Anders Stangel and Mikhail Sofiev for providing PBL heights over the study area through their operational SILAM model.
Conflicts of Interest
The authors declare no conflicts of interest. The funders had no role in the design of the study; in the collection, analyses or interpretation of data; in the writing of the manuscript; or in the decision to publish the results.
Abbreviations
The following abbreviations are used in this manuscript:
| PBL | Planetary Boundary Layer |
| a.g.l. | Above ground level |
| a.s.l. | Above sea level |
| AI | Artificial intelligence |
| NGS | Next-generation sequencing |
| OPC | Optical particle counter |
| UL | Ultralight (aircraft) |
References
- Després, V.R.; Huffman, J.A.; Burrows, S.M.; Hoose, C.; Safatov, A.S.; Buryak, G.; Fröhlich-Nowoisky, J.; Elbert, W.; Andreae, M.O.; Pöschl, U.; et al. Primary Biological Aerosol Particles in the Atmosphere: A Review. Tellus B Chem. Phys. Meteorol. 2012, 64, 15598. [Google Scholar] [CrossRef]
- Yang, J.; Seo, J.H.; Jee, Y.K.; Kim, Y.K.; Sohn, J.R. Composition Analysis of Airborne Microbiota in Outdoor and Indoor Based on Dust Separated by Micro-sized and Nano-sized. Aerosol Air Qual. Res. 2023, 23, 210231. [Google Scholar] [CrossRef]
- Huffman, J.A.; Perring, A.E.; Savage, N.J.; Clot, B.; Crouzy, B.; Tummon, F.; Shoshanim, O.; Damit, B.; Schneider, J.; Sivaprakasam, V.; et al. Real-Time Sensing of Bioaerosols: Review and Current Perspectives. Aerosol Sci. Technol. 2020, 54, 465–495. [Google Scholar] [CrossRef]
- Buters, J.; Clot, B.; Galán, C.; Gehrig, R.; Gilge, S.; Hentges, F.; O’Connor, D.; Sikoparija, B.; Skjoth, C.; Tummon, F.; et al. Automatic Detection of Airborne Pollen: An Overview. Aerobiologia 2024, 40, 13–37. [Google Scholar] [CrossRef]
- EN 16868:2019; Ambient Air-Sampling and Analysis of Airborne Pollen Grains and Fungal Spores for Networks Related to Allergy-Volumetric Hirst Method CEN, Brussels . German Institute for Standardisation: Berlin, Germany, 2019. Available online: https://standards.iteh.ai/catalog/standards/cen/5f1349aa-f4cc-430a-978e-3044737e3f28/en-16868-2019 (accessed on 22 July 2025).
- Hirst, J.M. An Automatic Volumetric Spore Trap. Ann. Appl. Biol. 1952, 39, 257–265. [Google Scholar] [CrossRef]
- Zweifel, U.L.; Hagström, Å.; Holmfeldt, K.; Thyrhaug, R.; Geels, C.; Frohn, L.; Skjøth, C.A.; Gosewinkel, U.B. High Bacterial 16S rRNA Gene Diversity above the Atmospheric Boundary Layer. Aerobiologia 2012, 28, 481–498. [Google Scholar] [CrossRef]
- Damialis, A.; Kaimakamis, E.; Konoglou, M.; Akritidis, I.; Traidl-Hoffmann, C.; Gioulekas, D. Estimating the Abundance of Airborne Pollen and Fungal Spores at Variable Elevations Using an Aircraft: How High Can They Fly? Sci. Rep. 2017, 7, 44535. [Google Scholar] [CrossRef]
- Rodó, X.; Pozdniakova, S.; Borràs, S.; Matsuki, A.; Tanimoto, H.; Armengol, M.-P.; Pey, I.; Vila, J.; Muñoz, L.; Santamaria, S.; et al. Microbial Richness and Air Chemistry in Aerosols above the PBL Confirm 2,000-Km Long-Distance Transport of Potential Human Pathogens. Proc. Natl. Acad. Sci. USA 2024, 121, e2404191121. [Google Scholar] [CrossRef]
- Crazzolara, C.; Ebner, M.; Platis, A.; Miranda, T.; Bange, J.; Junginger, A. A New Multicopter-Based Unmanned Aerial System for Pollen and Spores Collection in the Atmospheric Boundary Layer. Atmos. Meas. Tech. 2019, 12, 1581–1598. [Google Scholar] [CrossRef]
- Comtois, P.; Fernández-González, D.; Valencia-Barrera, R.M.; Sánchez, J.L.; Fraile, R.; Rodier, S. Pollen Content Study of the Lower Atmosphere in León (Spain) by Use of a Tethered Balloon. Aerobiologia 2000, 16, 187–191. [Google Scholar] [CrossRef]
- Bieber, P.; Seifried, T.M.; Burkart, J.; Gratzl, J.; Kasper-Giebl, A.; Schmale, D.G.; Grothe, H. A Drone-Based Bioaerosol Sampling System to Monitor Ice Nucleation Particles in the Lower Atmosphere. Remote Sens. 2020, 12, 552. [Google Scholar] [CrossRef]
- Sikoparija, B.; Mimić, G.; Matavulj, P.; Panić, M.; Simović, I.; Brdar, S. Short Communication: Do We Need Continuous Sampling to Capture Variability of Hourly Pollen Concentrations? Aerobiologia 2020, 36, 3–7. [Google Scholar] [CrossRef]
- Chen, Y.; Gu, P.; Schulte, N.; Zhou, X.; Mara, S.; Croes, B.; Herner, J.; Vijayan, A. A New Mobile Monitoring Approach to Characterize Community-Scale Air Pollution Patterns and Identify Local High Pollution Zones. Atmos. Environ. 2022, 272, 118936. [Google Scholar] [CrossRef]
- Plaza, M.P.; Charalampopoulos, A.; Leier-Wirtz, V.; Ørby, P.V.; Kloster, M.; Christiansen, M.D.; Traidl-Hoffmann, C.; Damialis, A.; Gosewinkel, U. Optimisation of Bioaerosol Sampling Using an Ultralight Aircraft: A Novel Approach in Determining the 3-D Atmospheric Biodiversity. Heliyon 2024, 10, e38924. [Google Scholar] [CrossRef]
- Den Komplette Pollenkalender-Astma-Allergi Danmark. Available online: https://www.astma-allergi.dk/pollenservices/den-komplette-pollenkalender/ (accessed on 22 July 2025).
- Grawe, S.; Jentzsch, C.; Schaefer, J.; Wex, H.; Mertes, S.; Stratmann, F. Next-Generation Ice-Nucleating Particle Sampling on Board Aircraft: Characterization of the High-Volume Flow aERosol Particle Filter sAmpler (HERA). Atmos. Meas. Tech. 2023, 16, 4551–4570. [Google Scholar] [CrossRef]
- Thomas, D.C.; Gosewinkel, U.; Christiansen, M.D.; Frohn, L.M.; Ye, Z.; Massling, A.; Skov, H. Application of Ultralight Aircraft for Aerosol Measurement Within and Above the Planetary Boundary Layer Above the City of Copenhagen. Atmosphere 2025, 16, 39. [Google Scholar] [CrossRef]
- Sofiev, M.; Siljamo, P.; Valkama, I.; Ilvonen, M.; Kukkonen, J. A Dispersion Modelling System SILAM and Its Evaluation against ETEX Data. Atmos. Environ. 2006, 40, 674–685. [Google Scholar] [CrossRef]
- Sofiev, M.; Genikhovich, E.; Keronen, P.; Vesala, T. Diagnosing the Surface Layer Parameters for Dispersion Models within the Meteorological-to-Dispersion Modeling Interface. J. Appl. Meteorol. Climatol. 2010, 49, 221–223. [Google Scholar] [CrossRef]
- GPS Elevation Calculator-Online Location (Lat/Long) Altitude Finder. Available online: https://www.dcode.fr/earth-elevation (accessed on 22 July 2025).
- Oteros, J.; Galán, C.; Alcázar, P.; Domínguez-Vilches, E. Quality Control in Bio-Monitoring Networks, Spanish Aerobiology Network. Sci. Total Environ. 2013, 443, 559–565. [Google Scholar] [CrossRef]
- Galán, C.; Smith, M.; Thibaudon, M.; Frenguelli, G.; Oteros, J.; Gehrig, R.; Berger, U.; Clot, B.; Brandao, R. EAS QC Working Group Pollen Monitoring: Minimum Requirements and Reproducibility of Analysis. Aerobiologia 2014, 30, 385–395. [Google Scholar] [CrossRef]
- CORINE Land Cover 2018 (Raster 100 m), Europe, 6-Yearly-Version 2020_20u1. May 2020. Available online: https://sdi.eea.europa.eu/catalogue/copernicus/api/records/960998c1-1870-4e82-8051-6485205ebbac (accessed on 23 July 2025).
- Tummon, F.; Bruffaerts, N.; Celenk, S.; Choël, M.; Clot, B.; Crouzy, B.; Galán, C.; Gilge, S.; Hajkova, L.; Mokin, V.; et al. Towards Standardisation of Automatic Pollen and Fungal Spore Monitoring: Best Practises and Guidelines. Aerobiologia 2024, 40, 39–55. [Google Scholar] [CrossRef]
- Mamali, D.; Marinou, E.; Sciare, J.; Pikridas, M.; Kokkalis, P.; Kottas, M.; Binietoglou, I.; Tsekeri, A.; Keleshis, C.; Engelmann, R.; et al. Vertical Profiles of Aerosol Mass Concentration Derived by Unmanned Airborne in Situ and Remote Sensing Instruments during Dust Events. Atmos. Meas. Tech. 2018, 11, 2897–2910. [Google Scholar] [CrossRef]
- Altstädter, B.; Platis, A.; Wehner, B.; Scholtz, A.; Wildmann, N.; Hermann, M.; Käthner, R.; Baars, H.; Bange, J.; Lampert, A. ALADINA—An Unmanned Research Aircraft for Observing Vertical and Horizontal Distributions of Ultrafine Particles within the Atmospheric Boundary Layer. Atmos. Meas. Tech. 2015, 8, 1627–1639. [Google Scholar] [CrossRef]
- Bezantakos, S.; Schmidt-Ott, F.; Biskos, G. Performance Evaluation of the Cost-Effective and Lightweight Alphasense Optical Particle Counter for Use Onboard Unmanned Aerial Vehicles. Aerosol Sci. Technol. 2018, 52, 385–392. [Google Scholar] [CrossRef]
- Brady, J.M.; Stokes, M.D.; Bonnardel, J.; Bertram, T.H. Characterization of a Quadrotor Unmanned Aircraft System for Aerosol-Particle-Concentration Measurements. Environ. Sci. Technol. 2016, 50, 1376–1383. [Google Scholar] [CrossRef]
- Filioglou, M.; Tiitta, P.; Shang, X.; Leskinen, A.; Ahola, P.; Pätsi, S.; Saarto, A.; Vakkari, V.; Isopahkala, U.; Komppula, M. Lidar Estimates of Birch Pollen Number, Mass, and CCN-Related Concentrations. Atmos. Chem. Phys. 2025, 25, 1639–1657. [Google Scholar] [CrossRef]
- Bryan, N.C.; Stewart, M.; Granger, D.; Guzik, T.G.; Christner, B.C. A Method for Sampling Microbial Aerosols Using High Altitude Balloons. J. Microbiol. Methods 2014, 107, 161–168. [Google Scholar] [CrossRef]
- Gottwald, T. A Spore and Pollen Trap for Use on Aerial Remotely Piloted Vehicles. Phytopathology 1985, 75, 801–807. [Google Scholar] [CrossRef]
- Simović, I.; Matavulj, P.; Šikoparija, B. Manual and Automatic Quantification of Airborne Fungal Spores during Wheat Harvest Period. Aerobiologia 2023, 39, 227–239. [Google Scholar] [CrossRef]
- Sikoparija, B.; Matavulj, P.; Simovic, I.; Radisic, P.; Brdar, S.; Minic, V.; Tesendic, D.; Kadantsev, E.; Palamarchuk, J.; Sofiev, M. Classification Accuracy and Compatibility across Devices of a New Rapid-E+ Flow Cytometer. Atmos. Meas. Tech. 2024, 17, 5051–5070. [Google Scholar] [CrossRef]
- Ørby, P.V.; Andersen, J.L.; Ottosen, T.B.; Thrane, U.; Gosewinkel, U. Detection of a Biological Aerosol Using Optical Particle Counters. Atmos. Environ. 2024, 338, 120819. [Google Scholar] [CrossRef]
- Vélez-Rodríguez, Z.; Torres-Pratts, H.; Maldonado-Ramírez, S.L. Use of Drones to Recover Fungal Spores and Pollen from the Lower Atmosphere. Caribb. J. Sci. 2020, 50, 159–170. [Google Scholar] [CrossRef]
- Adkins, K.; Li, K.; Cabrera, J.; Neal, B.; Brines, S.; Perfecto, I.; Blasko, M.; James, T.; Hajian-Forooshani, Z. A Simple Mechanism for Uncrewed Aircraft Bioaerosol Sampling in the Lower Atmosphere. Landsc. Ecol. 2024, 39, 133. [Google Scholar] [CrossRef]
- Wang, A.; Mora, S.; Machida, Y.; deSouza, P.; Paul, S.; Oyinlola, O.; Duarte, F.; Ratti, C. Hyperlocal Environmental Data with a Mobile Platform in Urban Environments. Sci. Data 2023, 10, 524. [Google Scholar] [CrossRef]
- Hou, J.; Fujiyoshi, S.; Perera, I.U.; Nishiuchi, Y.; Nakajima, M.; Ogura, D.; Yarimizu, K.; Maruyama, F. Perspectives on Sampling and New Generation Sequencing Methods for Low-Biomass Bioaerosols in Atmospheric Environments. J. Indian Inst. Sci. 2023, 103, 687–697. [Google Scholar] [CrossRef]
- CLC. Corine Land Cover Dataset. Copernicus Land Monitoring Service. 2018. Available online: https://land.copernicus.eu/en/products/corine-land-cover/clc2018 (accessed on 22 July 2025).
Disclaimer/Publisher’s Note: The statements, opinions and data contained in all publications are solely those of the individual author(s) and contributor(s) and not of MDPI and/or the editor(s). MDPI and/or the editor(s) disclaim responsibility for any injury to people or property resulting from any ideas, methods, instructions or products referred to in the content. |
© 2025 by the authors. Licensee MDPI, Basel, Switzerland. This article is an open access article distributed under the terms and conditions of the Creative Commons Attribution (CC BY) license (https://creativecommons.org/licenses/by/4.0/).