Article

Assessing the Performance of the WRF Model in Simulating Squall Line Processes over the South African Highveld †

1
Unit for Environmental Sciences and Management, North-West University, Potchefstroom 2520, South Africa
2
South African Weather Service, Centurion Central, Centurion 0157, South Africa
3
Goddard Institute for Space Studies, National Aeronautics and Space Administration, New York, NY 10025, USA
4
Department of Geography, Geoinformatics and Meteorology, University of Pretoria, Pretoria 0028, South Africa
5
Department of Geography and Environmental Studies, University of Limpopo, Sovenga 0727, South Africa
6
South African Environmental Observation Network, National Research Foundation, Pretoria 0001, South Africa
7
Global Change Institute, University of Witwatersrand, Johannesburg 2050, South Africa
*
Author to whom correspondence should be addressed.
This article is a revised and expanded version of a paper entitled WRF simulations of squall line features over the South African Highveld, which was presented at 37th Annual conference of South African Society for Atmospheric Sciences, Cape Town, South Africa, 30 October–3 November 2023.
Atmosphere 2025, 16(9), 1055; https://doi.org/10.3390/atmos16091055
Submission received: 30 July 2025 / Revised: 28 August 2025 / Accepted: 4 September 2025 / Published: 6 September 2025
(This article belongs to the Section Meteorology)

Abstract

Squall lines are some of the most common types of mesoscale cloud systems in tropical and subtropical regions. Thunderstorms associated with these systems are among the major causes of weather-related disasters and socio-economic losses in many regions across the world. This study investigates the capability of the Weather Research and Forecasting (WRF) model in simulating squall line features over the South African Highveld region. Two squall line cases were selected based on the availability of South African Weather Service (SAWS) weather radar data: 21 October 2017 (early austral summer) and 31 January–1 February 2018 (late austral summer). The European Centre for Medium-Range Weather Forecasts ERA5 datasets were used as observational proxies to analyze squall line features and compare them with WRF simulations. Mid-tropospheric perturbations were observed along westerly waves in both cases. These perturbations were coupled with surface troughs over central interior together with the high-pressure systems to the south and southeast of the country creating strong pressure gradients over the plateau, which also transports relative humidity onshore and extending to the Highveld region. The 2018 case also had a zonal structured ridging High, which was responsible for driving moisture from the southwest Indian Ocean towards the eastern parts of South Africa. Both ERA5 and WRF captured onshore near surface (800 hPa) winds and high-moisture contents over the eastern parts of the Highveld. A well-defined dryline was observed and well simulated for the 2017 event, while both ERA5 and WRF did not show any dryline for the 2018 case that was triggered by orography. While WRF successfully reproduced the synoptic-scale processes of these extreme weather events, the simulated rainfall over the area of interest exhibited a broader spatial distribution, with large-scale precipitation overestimated and convective rainfall underestimated. Our study shows that models are able to capture these systems but with some shortcomings, highlighting the need for further improvement in forecasts.

1. Introduction

Extreme rainfall events and associated floods in South Africa are largely attributed to convective rain, usually from isolated thunderstorms or thunderstorms embedded within large scale cloud bands [1,2,3] and cut-off low pressure systems [4,5,6]. Defined as violent storms localized in scale, thunderstorms are characterized by deep convective clouds, lightning, thunder, and heavy precipitation, sometimes accompanied by hail. The development and nature of thunderstorms are studied through comprehensive analyses using weather radars, satellite products as well as numerical weather and climate models. Hailstorms, floods, downbursts, tornadoes, and lightning associated with thunderstorms [7] pose significant threats to property, crops, and livestock, and can lead to fatalities. A substantial portion of the South African population resides in the eastern part of the country [8], a region prone to frequent thunderstorms during austral summer. Notably, studies (e.g., refs. [9,10,11,12,13,14]) emphasized the expectation that thunderstorms will not only become more prevalent in the future but also intensify due to the impacts of global warming and climate change.
South Africa experiences diverse thunderstorm systems, which also include supercell, single-cell, multi-cell, and Mesoscale Convective Systems (MCSs) [2,15,16,17,18,19]. Our study focusses on a type of MCS, i.e., squall lines, and an MCS is typically defined as a complex thunderstorm that organizes into a larger, cohesive structure [15,20]. Earlier investigations [21,22,23] indicated that these systems undergo a developmental process lasting from 3 to 6 h or longer and produce both convective and stratiform precipitation. MCSs are the largest of the convective storm family [22] and are common over the eastern region of South(ern) Africa [24]. These MCSs are also linked to severe weather events, resulting in adverse socio-economic impacts [25]. Most common MCSs over the Southern African region are the Mesoscale Convective Complexes (MCCs) and squall lines, both of which cover a large area and produce heavy rainfall over the region. Squall line thunderstorms are narrow bands of non-frontal cumulonimbus storms producing intense rainfall along a downdraft front [26,27,28,29]. They are associated with severe weather such as hail, floods, downbursts, tornadoes, and a high rate of positive lightning, especially in drier regions with trailing stratiform clouds [30,31,32]. Despite their damaging potential and impact on infrastructure and the economy, squall lines remain understudied in Southern Africa, though they account for about seven percent of multicellular storms over the South African Highveld alone, a region known for its high frequency of thunderstorm occurrences [2,33].
Numerical Weather Prediction (NWP) models are commonly used in atmospheric research to study and forecast the behaviour of high-impact events such as squall line thunderstorms. The Weather Research and Forecasting (WRF) model is widely used for such studies since it supports various cloud physics schemes with different complexities [34,35]. In South Africa, the WRF model has been used successfully in the past for seasonal forecasting and for the simulation of convective rainfall events where different cloud physics were adopted (e.g., refs. [36,37,38]). Due to the complexities that exist for squall line events in different environments, cloud microphysical schemes are also used to represent physical processes within the lifecycle of squall line thunderstorms, from initiation all the way to when the storms dissipate. Cloud microphysical processes usually occur on very small scales and are therefore commonly represented through parameterization [39,40,41].
Different cloud microphysical schemes have been used in models to simulate the stratiform and/or convective regions of squall lines in different parts of the world (e.g., refs. [42,43,44,45,46,47,48,49]). Morrison et al. [43] compared single- and double-moment schemes and found that the latter produced larger stratiform regions that persist for several hours, which was credited to the reduced rain evaporation rates in the double-moment scheme. Hong et al. [44] used both WRF Double-Moment 6-Class (WDM6) and Single-Moment 6-Class (WSM6) and found that WDS6 simulated better precipitation forecast of both the light and heavy precipitation of a squall line event in the Great Plains.
A study by Gallus and Pfeifer [42] compared various WRF microphysical schemes, i.e., the Lin [50], older and newer Thompson [51], WRF Single-Moment 5-Class (WSM5), and WRF Single Moment 6-class (WSM6) [52,53] for simulating a squall line thunderstorm in Germany, finding that all these schemes overestimated radar reflectivity in the trailing stratiform region of the squall line thunderstorm. Similarly, Wu et al. [45] evaluated different microphysics schemes, including WSM5, WSM6, and Goddard Cumulus Ensemble (GCE) schemes, over the U.S. Southern Great Plains and found that surface precipitation and storm structure were sensitive to schemes containing graupel or ice.
Fan et al. [54] and Han et al. [55] conducted a two-part intercomparison study of a well-observed squall line during the Midlatitude Continental Convective Clouds Experiment (MC3E) campaign, using a cloud-resolving model with eight cloud microphysics schemes. Seven schemes were common to both studies, i.e., the Morrison (MORR), Milbrandt–Yau (MY2), WSM6, Thompson (THOM), NSSL, P3, and Fast Spectral-Bin Microphysics (FSBM). The eighth scheme was TAMU in Part I and FSBM_NEW in Part II. Fan et al. [54] found that all simulations overestimated convective regions and vertical updrafts while underrepresenting stratiform areas. Han et al. [55] then reported that most schemes underestimated stratiform precipitation and total rainfall. Over the tropics on the other hand, McCumber et al. [56] showed that ice microphysics schemes increased stratiform rainfall compared to liquid-only schemes.
Despite advances in atmospheric modelling, there is still a crucial gap in comprehending the simulation of squall line features, notably over Africa. While the occurrence of squall lines was found to be infrequent over South Africa in the past compared to other storm types, squall lines can account for a significant quantity of rainfall due to their large spatial scale when they travel across parts of the country [57]. The goal of this study is therefore to investigate the capability of the WRF model in capturing observed features of squall line events over the Highveld region of South Africa. This study also explores how well WRF model simulations reproduce both the stratiform and convective regions in squall lines over the study area.

2. Data and Methods

2.1. Study Area

This study focusses on the South Africa Highveld indicated in Figure 1, which is characterized by an elevation exceeding 1400 m and is particularly prone to substantial number of severe thunderstorm occurrences [58]. This is due to a combination of factors, including the Highveld region’s elevated topography, abundant summer moisture, and favourable atmospheric conditions such as instability and frequent dryline occurrences, which act as lifting mechanisms to trigger severe thunderstorms [59,60]. The Highveld region is also highly industrialized, with high aerosol loading during spring, and a decrease in aerosol loading is observed during summer as a result of the wet deposition removal processes [61]. Tesfaye et al. [61] also mentioned that early summer tends to have higher aerosols than late summer, which can be attributed to the fact that the country receives the bulk of its rainfall during late summer [2], which washes away aerosol in the atmosphere.

2.2. Case Study Selection

Two squall line events, which were observed on 21 October 2017 and 31 January/1 February 2018, were selected for this study. The case selection was motivated by the availability of the Irene’s S-band radar located in the Gauteng province. While the Irene S-band radar covers the region where both events occurred, the SAWS radar reflectivity composites were used to provide coverage for a larger region in order to track storm movements even beyond the study area. The country typically experiences extratropical and conditionally unstable atmospheric conditions from October to early December, while conditions are mostly tropical and convectively unstable from late December to February [33,62]. As a result, the two selected events occur during seasons of different atmospheric instabilities. These two cases were also amongst the most notable severe weather events, as they led to significant weather-related disasters and were documented in the SAWS Caelum publication [63], highlighting both their meteorological and societal significance. Caelum is a publication managed by SAWS that records and archives weather-related disasters in South Africa.

2.3. Synoptic Analysis

Observational rainfall data used was obtained from the SAWS automatic weather and rainfall stations. For circulation datasets, the European Centre for Medium Range weather Forecasting (ECMWF) ERA5 reanalysis datasets [64] were used as a proxy of observations in this study, owing to a lack of data availability for weather observations of most parameters. The ERA5 datasets have a spatial resolution of 0.25° and 137 hybrid sigma/pressure levels in the vertical, with the top level at 0.01 hPa. ERA5 replaced ERA-interim [65] and has been found to correlate well with observations in all seasons over Africa when analyzing precipitation [66]. ERA5 was selected for this study due to its high spatial and temporal resolution, along with strong physical consistency, ensuring that atmospheric variables evolve in a realistic and physically coherent manner. The SAWS surface weather charts were used to complement surface features observed in ERA5 data. The variables discussed are sea level pressure, geopotential height, horizontal winds, relative humidity, dew point temperature, and the Convective Available Potential Energy (CAPE). The CAPE is defined as a measure of how much energy an air parcel would gain by being raised to a specific height in the atmosphere [67] and contributes to the kinetic energy of the updraft. Whilst CAPE may be the most preferred index, it does not always bring best results when it is analyzed alone. Therefore, additional instability indices, namely, the K Index (K, Equation (1)) and the Total Totals Index (TT, Equation (2)), were also analyzed in this study. The K assesses thunderstorm potential based on temperature and dew point in the lower atmosphere, incorporating both lapse rate and moisture content, while the TT Index indicates the likelihood and severity of thunderstorm development [68].
K = T 850 T 500 + T d 850 T 700 T d 700
T T = T 850 T 500 + T d 850 T 500
where T is temperature, and Td is dewpoint temperature in °C at the indicated pressure level in hPa. Subscripts indicate specific pressure levels.

2.4. Model and Simulation Description

The WRF model, version 4.1.2 [35] was used in this study. The WRF model is a fully nonhydrostatic model and runs at various spatial and temporal resolutions. This model was selected because it is an open-source model with many microphysics scheme options with different levels of complexity. The tropical suite was selected because of the latitudinal location of South Africa, as the country is dominated by both tropical and subtropical systems. The physics suite selected applies the following schemes: (i) WRF Single Moment 6-class [69], (ii) new Tiedtke cumulus scheme [70], (iii) Rapid Radiative Transfer Model (RRTM); Ref. [71] for both shortwave and long wave radiation, (iv) Yonsei University scheme [72], and (v) Mellor–Yamada–Janjic TKE scheme [73]. The WRF model was set up to run at a horizontal resolution of 6 km with 390 × 251 grid points over SA. While the 6 km resolution falls within the grey zone for deep convection [74], the study kept the cumulus scheme turned on to capture smaller-scale weak convection that the grid cannot fully resolve, particularly in the trailing stratiform region of squall line thunderstorms. Stratiform regions often feature under-resolved weak convection that benefits from parameterization [75]. Therefore, this approach allows for the simulation of both convective and stratiform portions of squall lines, providing a realistic representation of total precipitation and squall line thunderstorm structure. A study by Bopape et al. [76] also found that, at 6 km, turning off the cumulus parameterization did not significantly weaken the simulation quality, particularly in terms of rainfall distribution over Southern Africa.
The model domain ranges from latitude −36° S to −20° S and longitudes 10° E to 40° E, and the system is centred at −27.5° S and 24° E, running on Mercator projection. The model had 33 vertical pressure levels, from 1000 hPa near the surface to a top level of 50 hPa in the upper atmosphere. The WRF simulation domain, previously shown as part of the study area in Figure 1, encompasses parts of the adjacent Atlantic and Indian Oceans as well as neighbouring countries. The WRF system is initialized with the Global Forecast System (GFS) data, which has the same spatial resolution of 0.25° as ERA5. The GFS data has been used and compared to ERA5 reanalysis data over several regions over Southern Africa in the recent past (e.g., refs. [48,49,77,78] and proved to capture the synoptic conditions of events analyzed. The model is initialized with GFS input data at three hourly intervals, with an integration time step of 36 (dt = 6*dx) seconds, producing forecasts for lead time up to 30 h. The model output is written out every 1 h. The first 6 h of each simulation were discarded as spin-up and not included in the analysis, consistent with previous studies of severe convection (e.g., refs. [79,80]). The WRF model outputs are then compared to ERA5 datasets. As noted in Section 2.3, ERA5 is used as a reference due to the limited availability of pressure-level datasets and to provide information on convective and stratiform rainfall components, serving as a comparison rather than a validation dataset. All the current simulations were performed on the Council for Scientific and Industrial Research (CSIR), Centre for High-Performance Computing (CHPC) dell cluster.

2.5. Model Verification

In this study, quantitative statistical verification techniques were applied. The study used the commonly preferred root mean square error (RMSE), which is calculated as shown in Equation (3). In addition to the RMSE, coefficient of efficiency (COE), and the correlation coefficient (r), which have previously been used for WRF model verification for thunderstorm simulations (e.g., ref. [81]) were also calculated as shown by Equations (4) and (5). In COE and r, a value of 1 in both statistics indicates a perfect match between the model output and observation data, while a value of zero indicates no relationship; thus, the interpretations of these are nearly identical.
R M S E = i = 1 n M i O i 2 n 1 / 2
C O E = 1.0 i = 1 n M i O i i = 1 n O i O ¯
r = 1 ( n 1 ) i = 1 n M i M ¯ σ M O i O ¯ σ O
where Oi represents the ith observed value, and Mi represents the ith modelled value for a total of n observations.
This study also employed the Bias Score (BIAS) and Threat Score (TS) model validation metrics (Equations (6) and (7)) to assess the performance of the WRF model for the two squall line events using hourly rainfall data of both the WRF model and SAWS stations. This method has also been employed in the past for convection studies (e.g., refs. [82,83]).
B I A S = N h i t s + N f a l s e N h i t s + N m i s s e s
T S = N h i t s N h i t s + N f a l s e + N m i s s e s
where N h i t s represents the number of hours correctly forecasted to have rain, N f a l s e represents the number of hours predicted to have rain but where no rain occurred, and N m i s s e s represents the number of hours when rain occurred but was not forecast. A BIAS value below 1 indicates that the model underpredicts the frequency of hours, whereas a BIAS above 1 indicates overprediction. The TS ranges from 0 to 1, with values closer to 1 showing better agreement between the model and observations and thus higher forecast skill.

3. Event Description

3.1. Case 1: 21 October 2017 Squall Line (Afternoon Case)

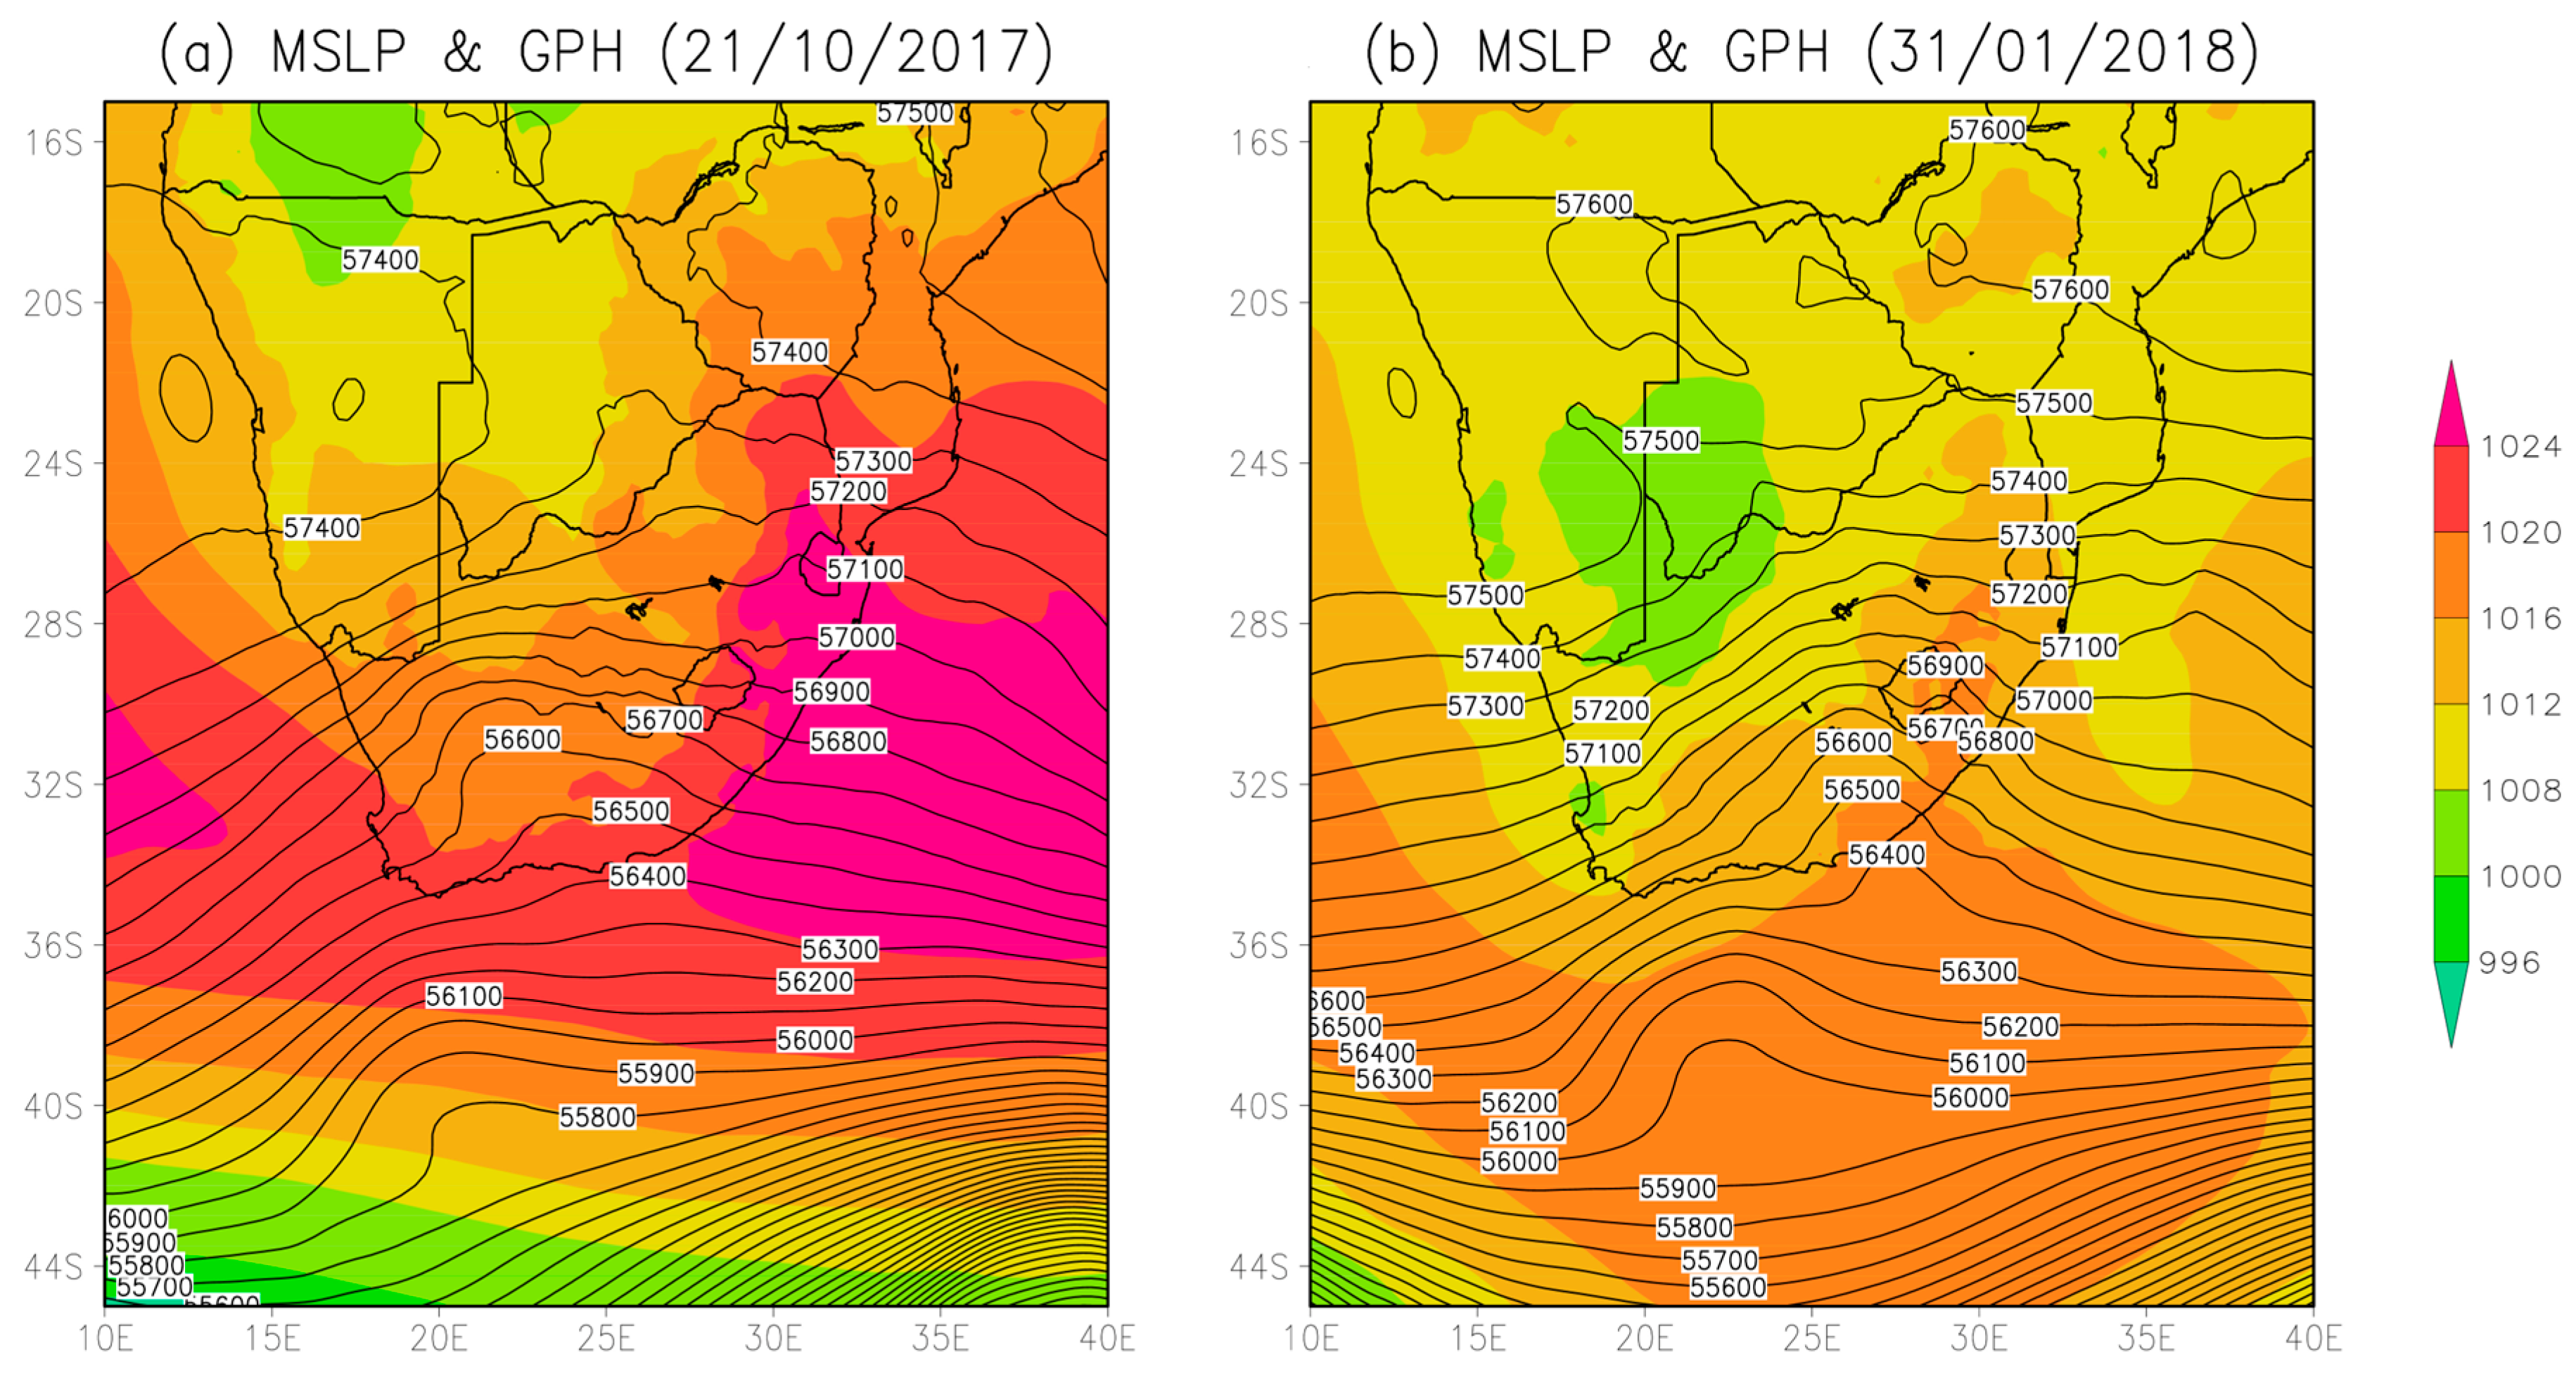
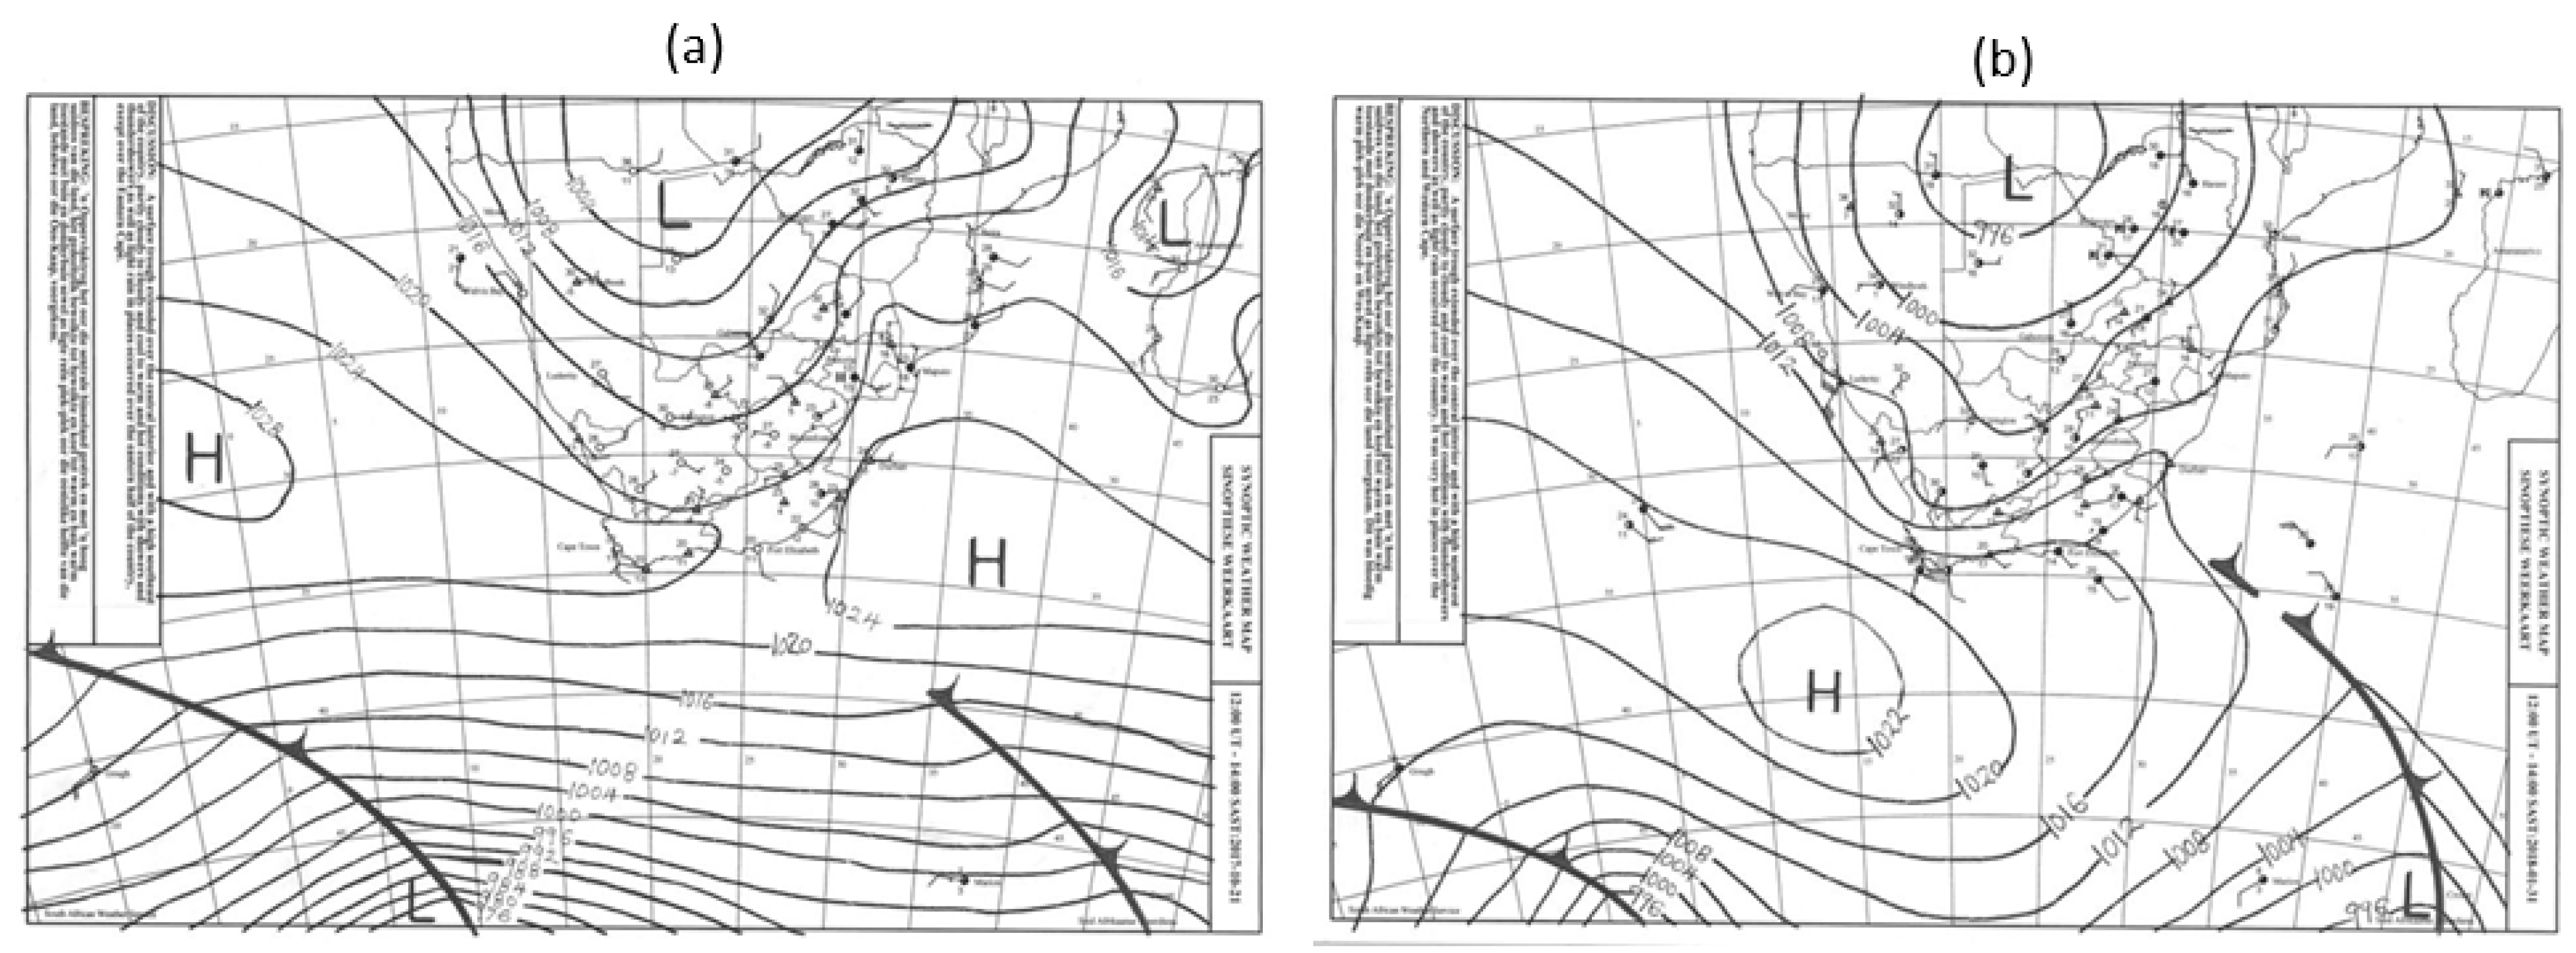
In the case of the first event that was observed on the 21 of October 2017, SAWS issued an alert (media release archived on the SAWS website; https://www.weathersa.co.za/, accessed on 20 April 2025) indicating level 2,3,4 or 5 watch on the impact-based forecasting scale, which shows that the storm was expected to be associated with high impact. Several warnings for severe thunderstorms over large parts of South Africa were later issued by SAWS as an attempt to minimize the resulting impacts. This thunderstorm was reported by local newspapers (e.g., ref. [84]) to have affected much of South Africa’s interior, including regions such as the eastern parts of North-West and Free State, Gauteng, Western Bushveld of the Limpopo province, and the Highveld of Mpumalanga. This event was associated with a surface trough (Figure 2a and Figure 3a) extending over the northern interior of the country, which was coupled with mid-tropospheric (500 hPa) perturbations within a general westerly wave pattern over the highveld (Figure 2a). The trough together with the anticyclonic circulation of the high-pressure system observed to the southeast of the country created a significant pressure gradient, which may have been responsible for the onshore advection of moisture from the southwest Indian Ocean (SWIO) towards most of the eastern parts of the country.

3.2. Case 2: 31 January 2018/1 February 2018 Squall Line (Midnight Case)

A high-impact squall line thunderstorm was observed and confirmed by SAWS on the 1 of February 2018 in media release documents archives online at the SAWS website (https://www.weathersa.co.za/, accessed on 20 April 2025) and also available upon request from the SAWS library. Media reports suggested that this event was associated with damaging winds and hail, affecting most parts of the Free State Province in the South African Highveld in the early hours of the day, which led to at least 950 miners being trapped underground [85]. The Guardian also provided images of damages from this event, ranging from damaged roofs and roads [85]. Mid-tropospheric perturbations and jet streaks over southern region of the Highveld were also observed on 31 January 2018, which extended to the early hours on the 1 of February 2018 (Figure 2b). The middle-level perturbations were coupled with a surface trough extending over the northern interior of the country and a zonal structured type-N ridging high [86] in the southern parts of the country, which was responsible for moisture advection towards the eastern parts of the country. The interplay of the surface trough and ridging high was also observed in the SAWS surface chart at 14:00 SAST (Figure 3b).

4. Results and Discussions

The results of this study are presented in four subsections. The first subsection presents a brief radar analysis for selected times during the squall line events, followed by a subsection presenting model verification statistics. The third subsection presents and discusses circulation patterns, both observed and simulated, for the two squall line events in the South African Highveld. Finally, the last subsection presents 24 h total simulated rainfall in comparison to the observations. Furthermore, a breakdown analysis of convective and stratiform rainfall of the squall lines is also presented in the last subsection.

4.1. Radar Analysis

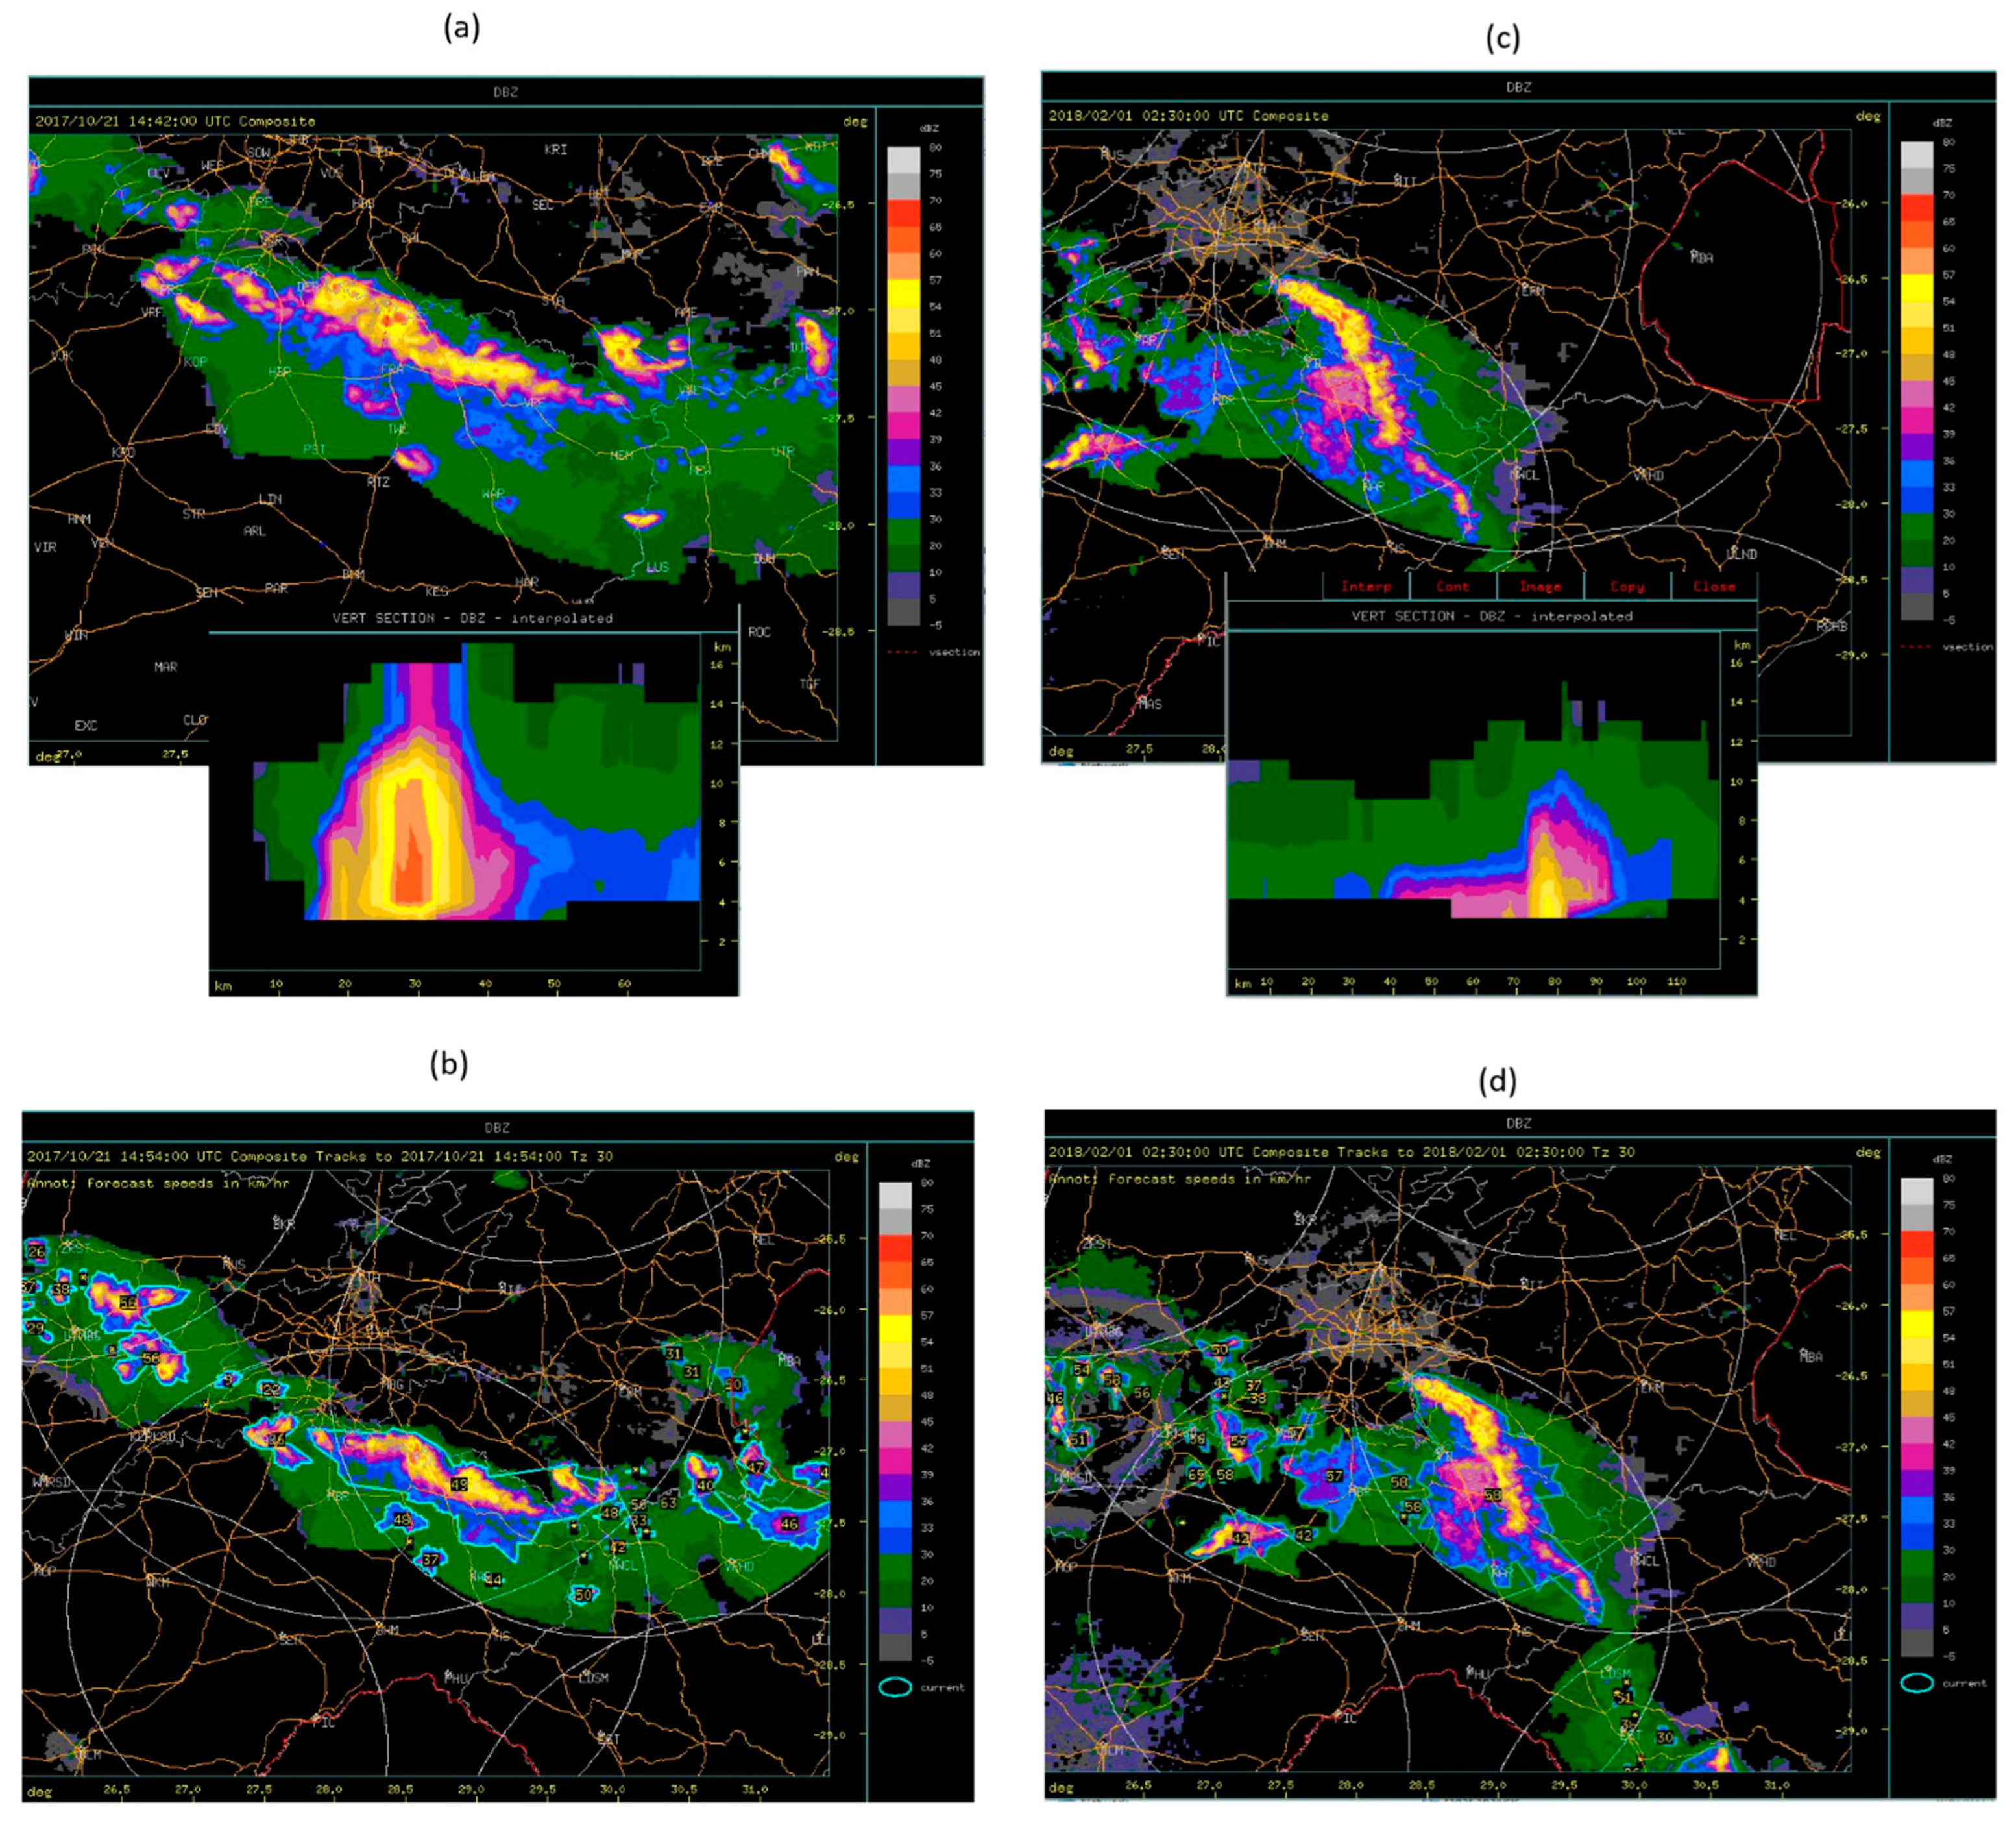
Radar reflectivity composites for both squall line incidents are shown in Figure 4. These squall line thunderstorm events on the radar plots are characterized by elongated and continuous bands of high radar reflectivity (>40 dBZ), extending over tens to hundreds of kilometres. The squall line on 21 October 2017 had a shallow stratiform zone and an intense convection region marked by an overshooting top (Figure 4a), which is indicative of a strong updraft and a severe thunderstorm. The radar reflectivity of this event’s convective zone was more than 57 dBZ (Figure 4a), indicating the possibility of hail and severe rainfall, which was later reported on SAWS Caelum [63], which is a publication that archives weather related disasters. This indicates the significance of this case as one notable weather-related disaster. The storm extended 17.5 km into the upper troposphere as shown by the radar cross section in Figure 4a. Further investigation of the radar plots for this case reveals a bow echo. Bow echoes, in general, indicate the risk of destructive winds at the surface [87]. The storm was moving at a horizontal speed of 49 km/h, as shown in the radar observations (Figure 4b).
The second squall line, which occurred in the early hours of 1 February 2018, also featured a line of active cells followed by a large stratiform zone (Figure 4c). This storm’s radar shows hail probability of 90%, with reflectivity above 50 dBZ (Figure 4c). The storm exhibited limited vertical development, reaching only about 8 km in height. This case was also listed in the SAWS Caelum publication. The squall one of 31 January to 1 February 2018 was the fastest of the two cases, moving at a horizontal speed of 58 km/h around 02:30 UTC (Figure 4d).

4.2. Verification Statistics

The model verification statistics presented in Table 1 were discussed in Section 2.5. Observed and simulated rainfall data were compared over a 24 h period for each of the two case studies. For this evaluation, hourly rainfall data from SAWS automatic weather stations (AWSs) were used, with one station selected per case study due to the completeness of the AWS data. The comparison was performed using model output from the grid cells corresponding to the AWS locations. For the 21 October 2017 squall line event, there is general agreement between the modelled and observed rainfall across all three verification statistics (RMSE = 1.96 mm, COE = 0.7, r = 967). For the 31 January to 1 February 2018 event, despite a correlation coefficient (r = 0.962) comparable to that of the 21 October 2017 case and an RMSE indicating reasonable agreement between simulations and observations (RMSE = 12.19 mm) indicating large errors, COE had negative values, which implies that this statistic was not in agreement with the other two verification statistics but rather indicating the substantially overestimate rainfall amount for this case.
The TS hourly data analysis results show a BIAS of 1.67 and a TS of 0.6, indicating moderate forecasting skill for the 2017 case (Table 2). This was not the case for the 2018 case, and this corresponded to a BIAS of 7.5 and a TS of 0.13, reflecting very low skill.

4.3. Circulation Analysis: Observations Versus WRF Simulations of the Two Squall Lines

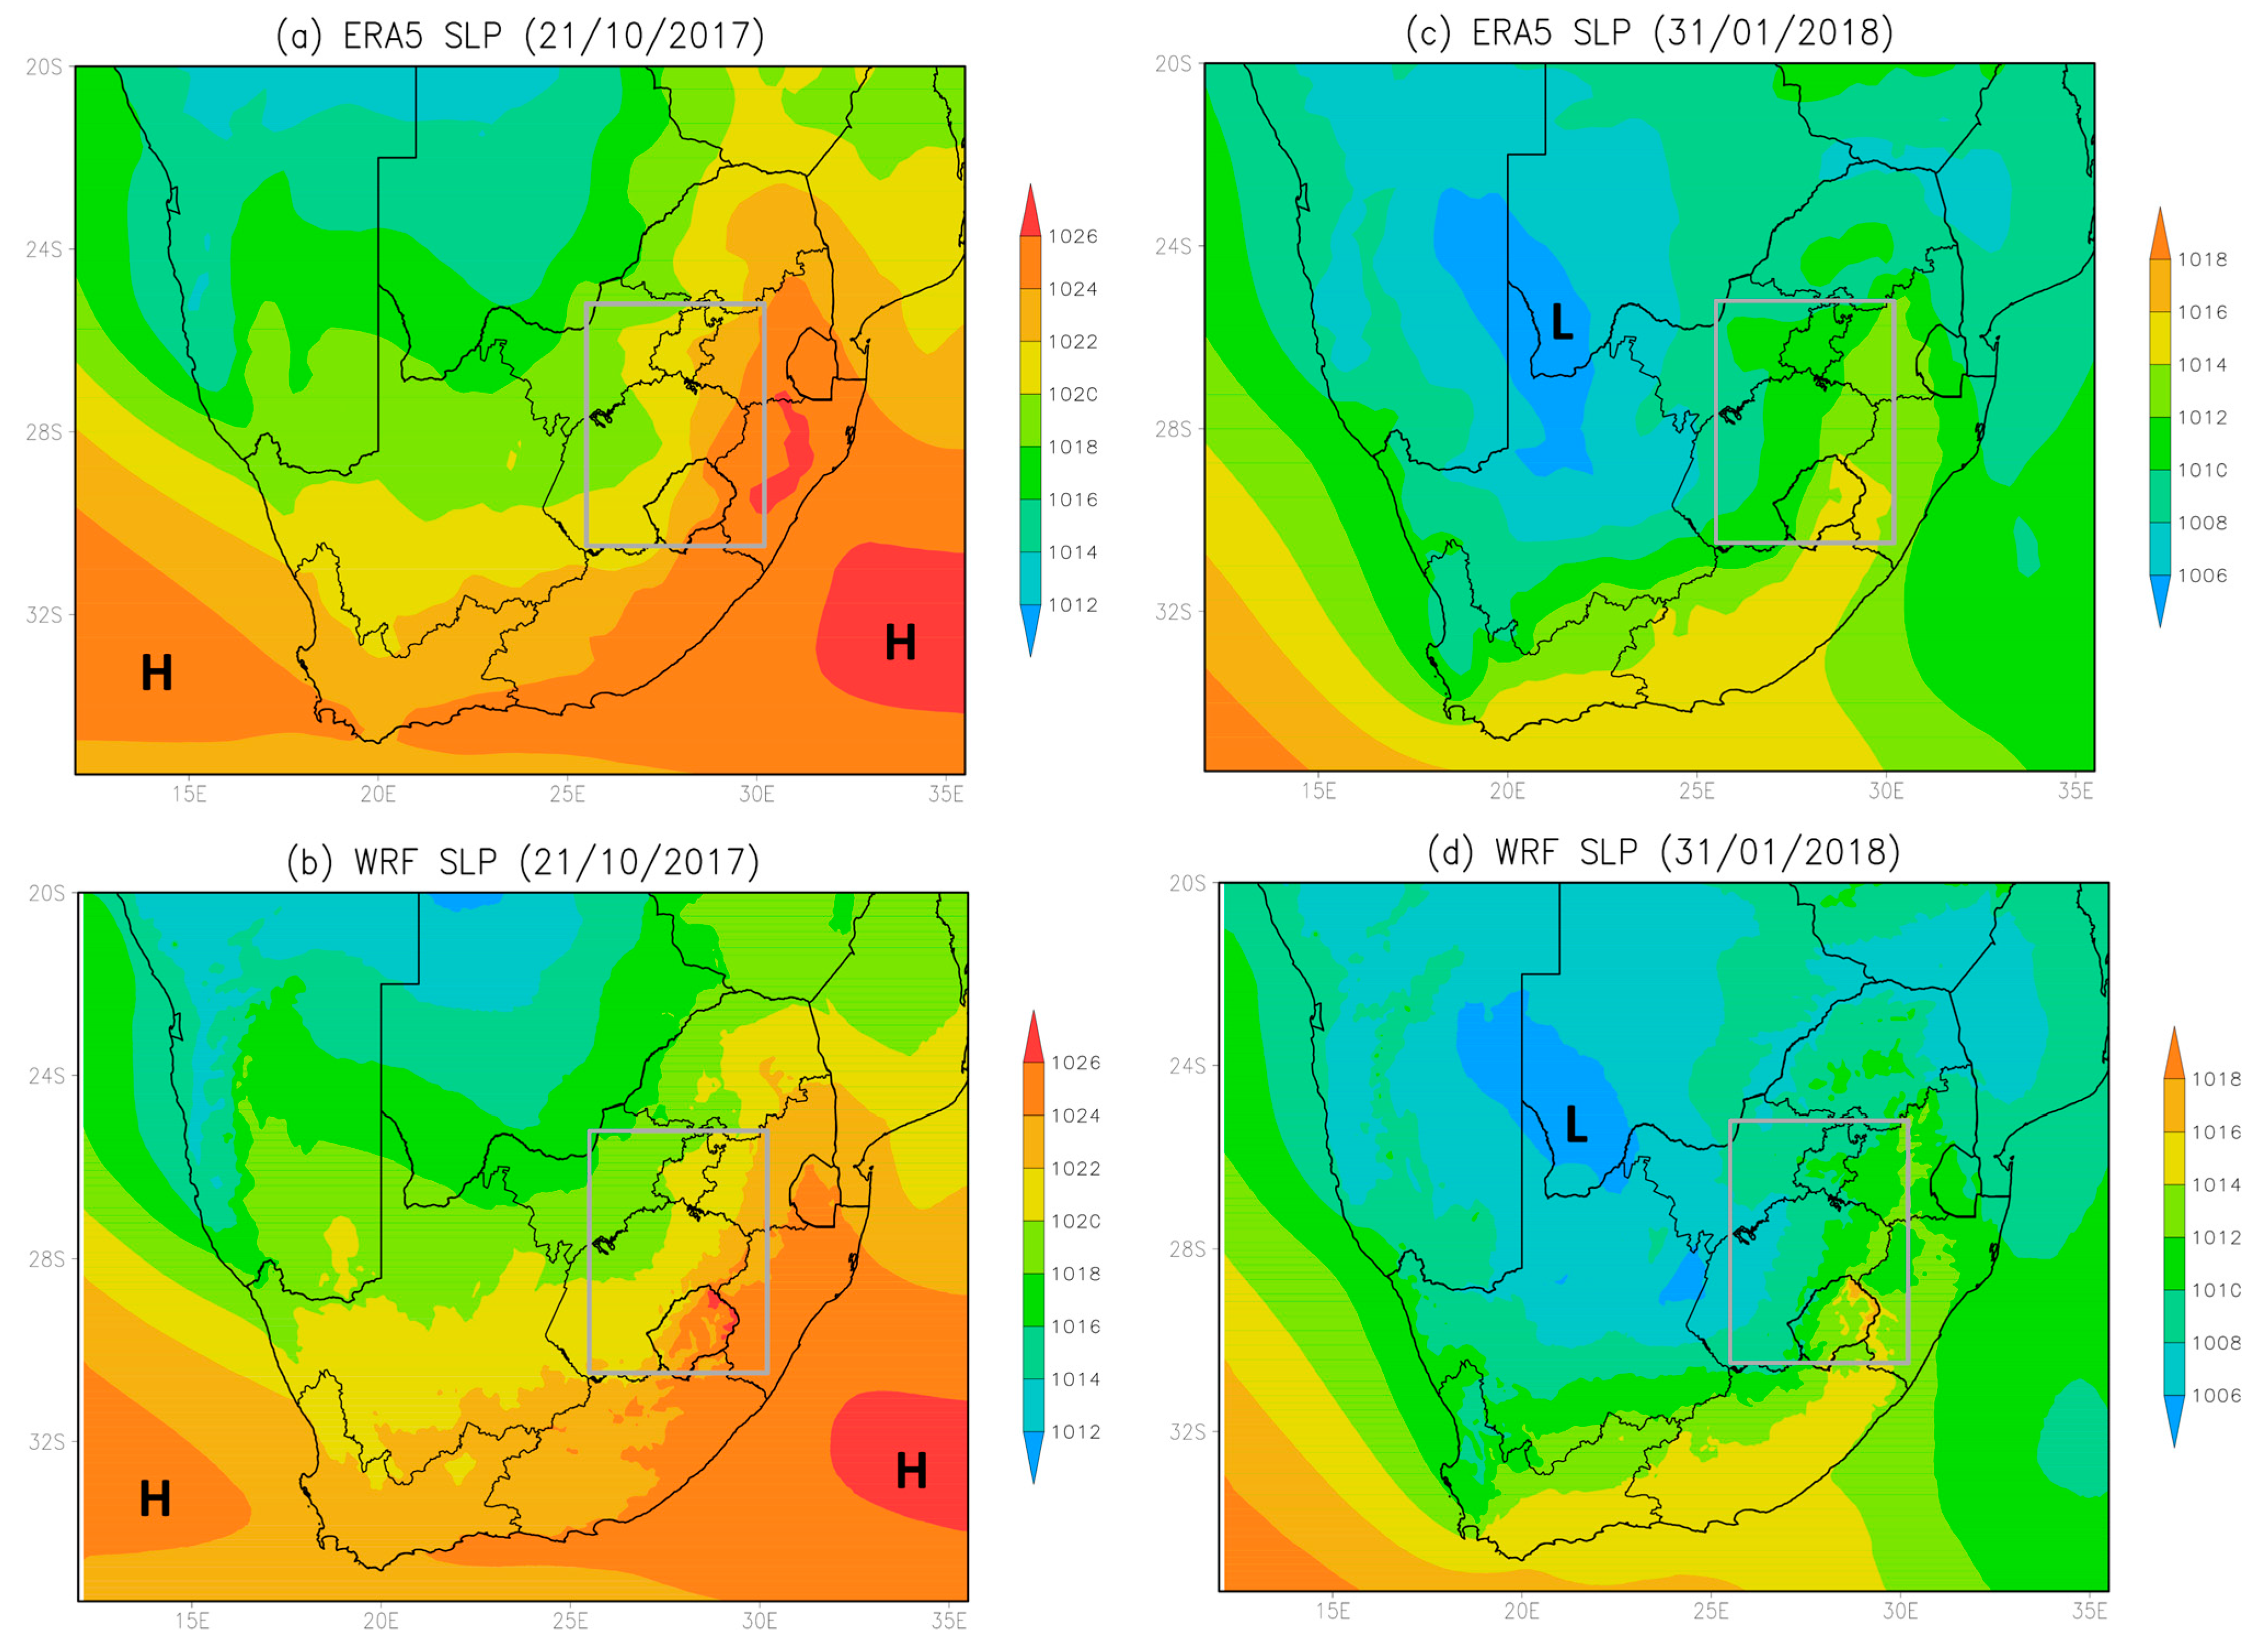
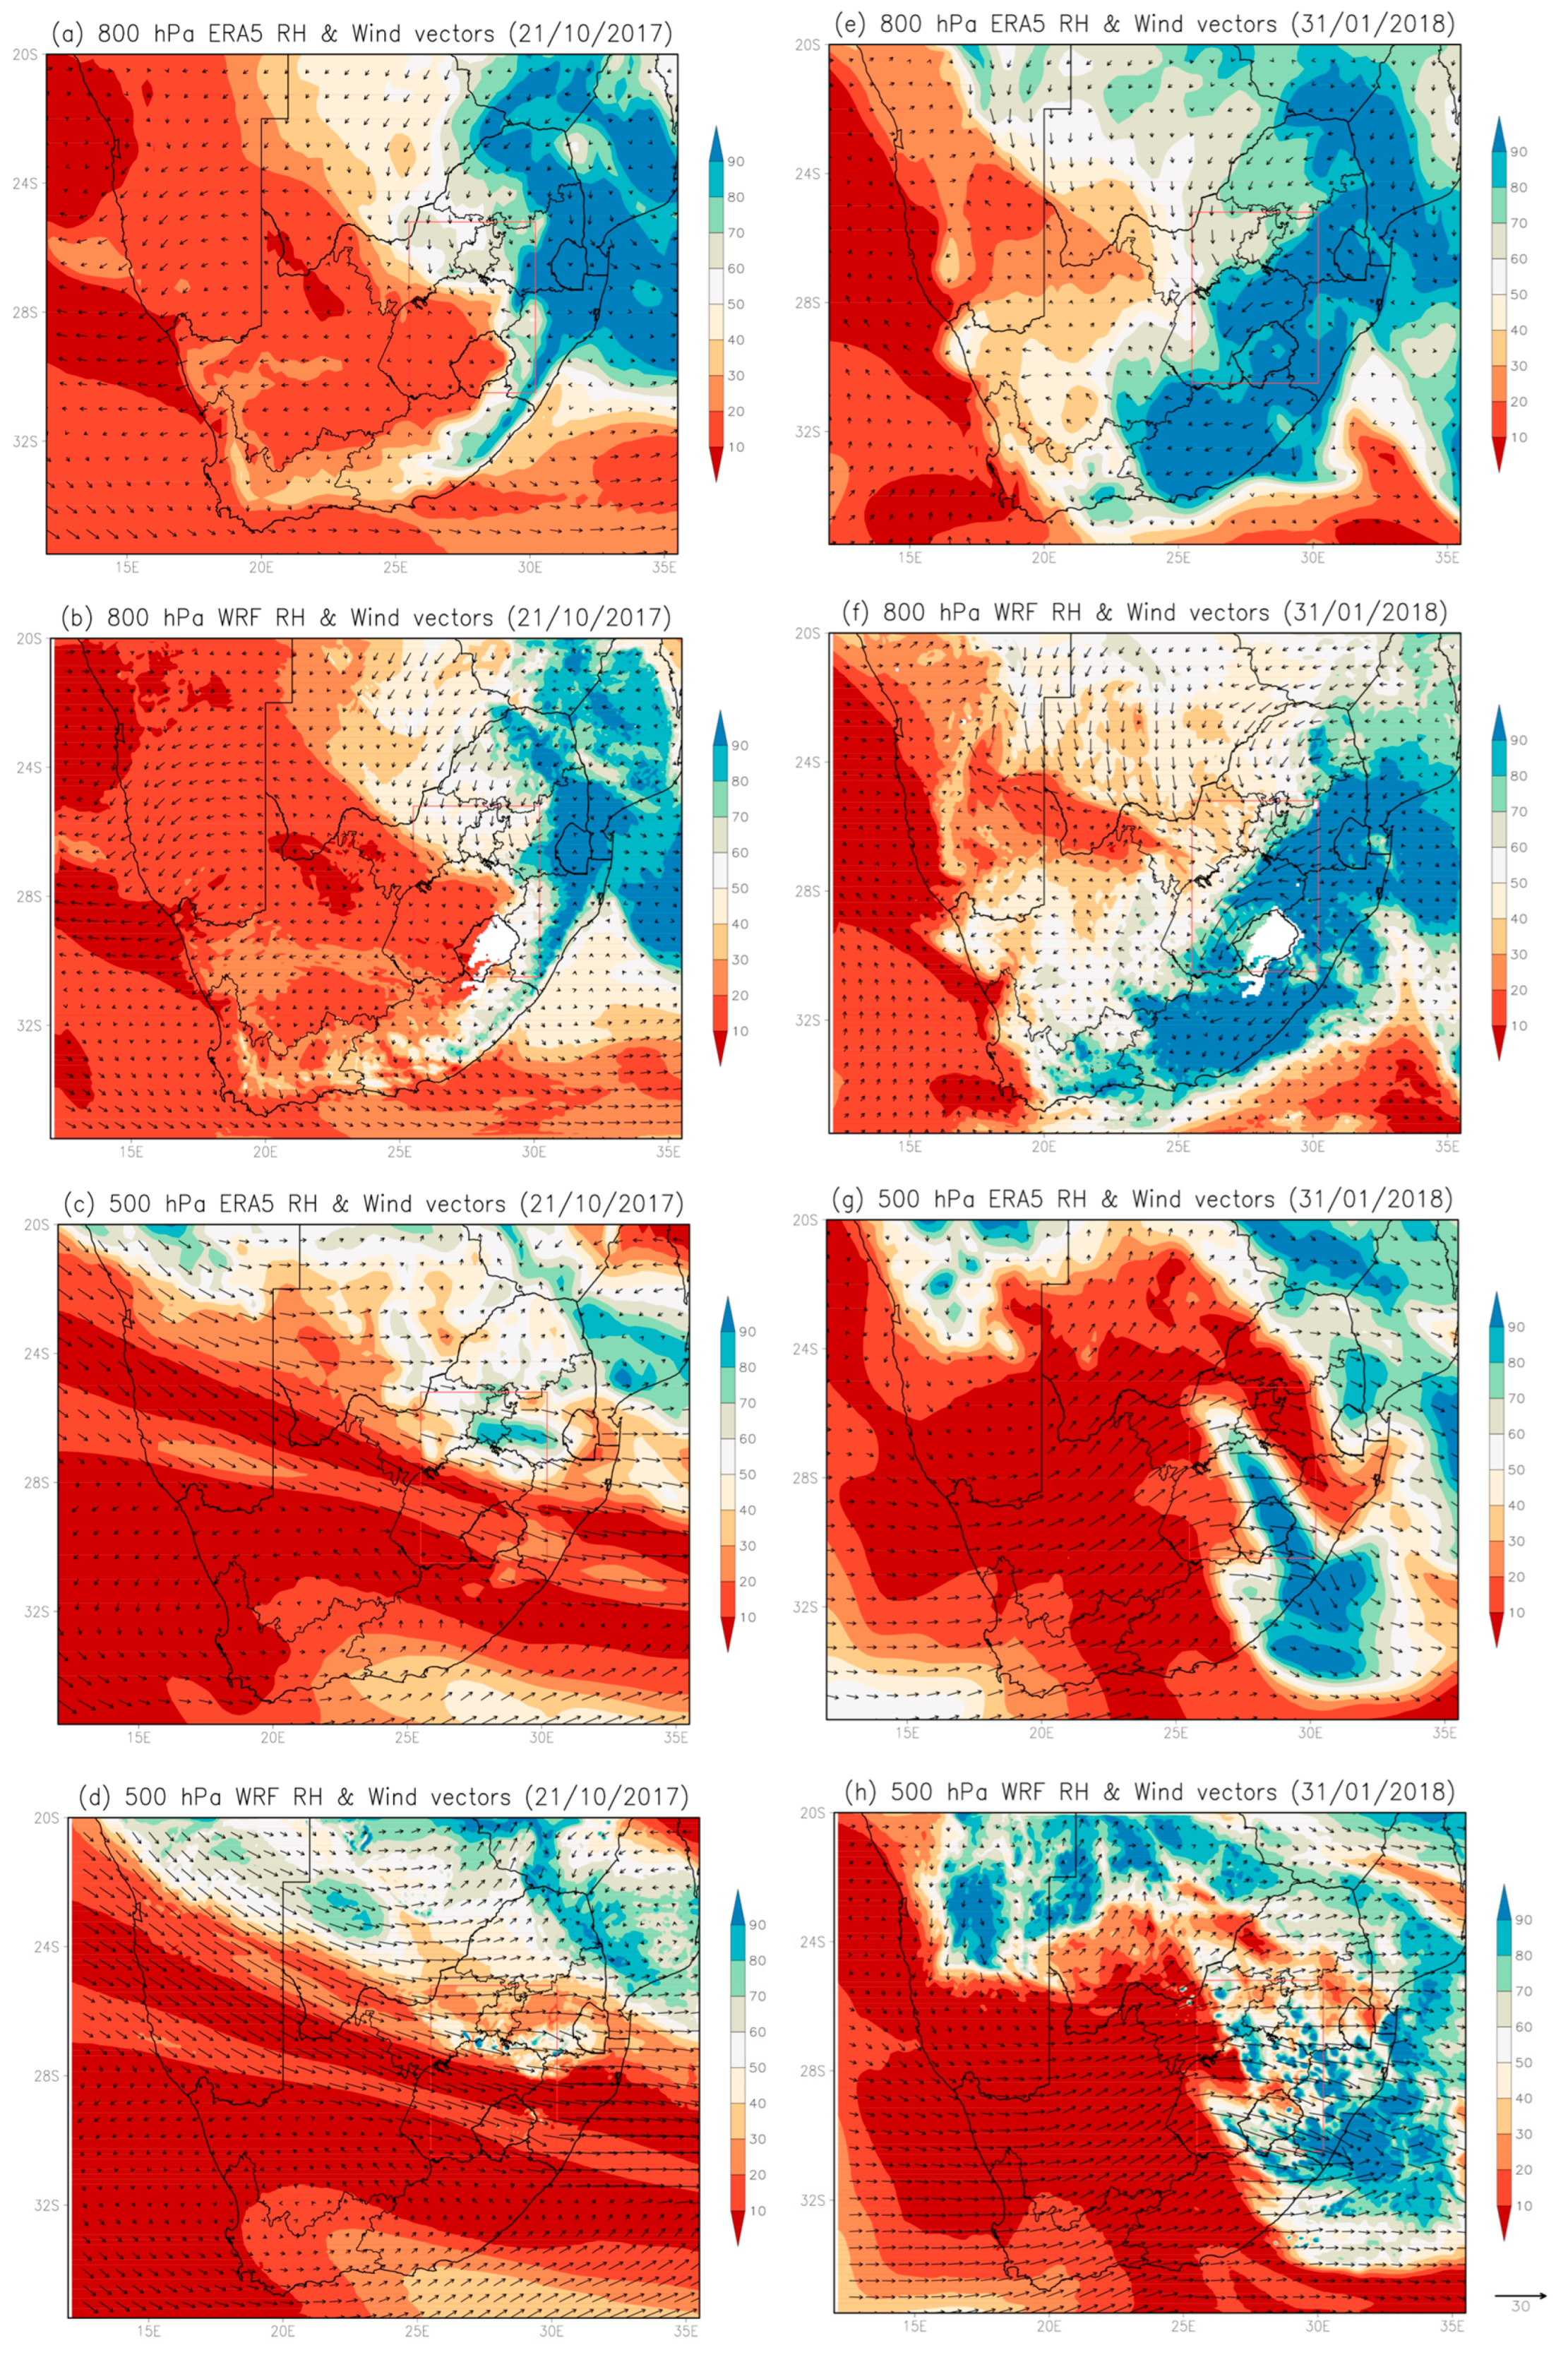
The ERA5 sea level pressure (SLP) on 21 of October 2017 shows a surface trough extending over much of the northern central interior of the country, with a high-pressure system to the southeast of the country during the squall line (Figure 5a). The combination of cyclonic circulation around the surface trough together with the anticyclonic circulation of the high-pressure system created a strong pressure gradient, which was responsible for onshore moisture flow from the SWIO towards most of the eastern parts of the country. The observed and simulated SLP agree on the latitudinal location for both the Atlantic and Indian oceans anticyclones (Figure 5b). The source of moisture during the 2017 squall line event was likely the Mozambique Channel as indicated for both ERA5 and WRF; there was significantly high RH (>70%) at 800 hPa with horizontal winds towards the area of interest (Figure 6a,b). The northern and northeastern regions of the Highveld exhibited higher moisture levels near the surface, in contrast to the drier conditions observed in the southern and western areas. The WRF simulations demonstrated reliable performance by reproducing the distinct moisture patterns observed at lower levels of the atmosphere over South Africa.
ERA5 relative humidity values suggest a middle-level dryness in southern parts of the Highveld (Figure 6c) on 21 October 2017. However, the presence of moisture in the middle levels of the atmosphere observed across the northern parts of the Highveld during the afternoon provided a steady flow of moist air into the storm, which may strengthen the thunderstorm updraft. This moisture flow sustains and strengthens the updraft, enhancing the vertical growth of the thunderstorm convective clouds. The WRF simulations had a somewhat thin layer of fairly high (>70%) moisture content at 500 hPa within the area of interest, while most of the South African Highveld, just like much of the country, had a drier atmosphere (Figure 6d). Noteworthy insights from earlier studies, such as Browning and Ludlum [88] and Johns and Doswell [89] in the United Kingdom and United States of America, respectively, also emphasized that a moist mid-level atmosphere during thunderstorms can lead to the formation of stronger downdrafts. This finding was also echoed by recent work from Miao and Yang [90].
For the 31 of January to 1 February 2018 squall line, WRF was also able to simulate the general location of large-scale patterns when compared to the observed pressure patterns, i.e., surface trough, which was observed over the northern interior of South Africa and the zonal ridging high pressure (Figure 5c,d). While RH was transported from the Mozambique Channel towards the north-eastern parts of the country extending to the Highveld during this squall line event, the ridging high played a pivotal role in channelling onshore moisture flow from the SWIO towards the eastern and southeastern parts (Figure 6e,f) of the country. This dynamic interaction likely enhanced orographic lifting, contributing to widespread rainfall over the eastern regions of South Africa where the Drakensberg Mountains are found.
The middle-level atmosphere for this case exhibited generally drier conditions over the western half of the country, a consensus observed in both the ERA5 and WRF datasets (Figure 6g,h) for the 31 January to 1 February 2018 event. However, the comparisons were not as consistent in the country’s eastern half compared to the western half. The model largely overestimated the amount of moisture in the mid-troposphere over the eastern parts of the country, which includes the South African Highveld by ~40%.
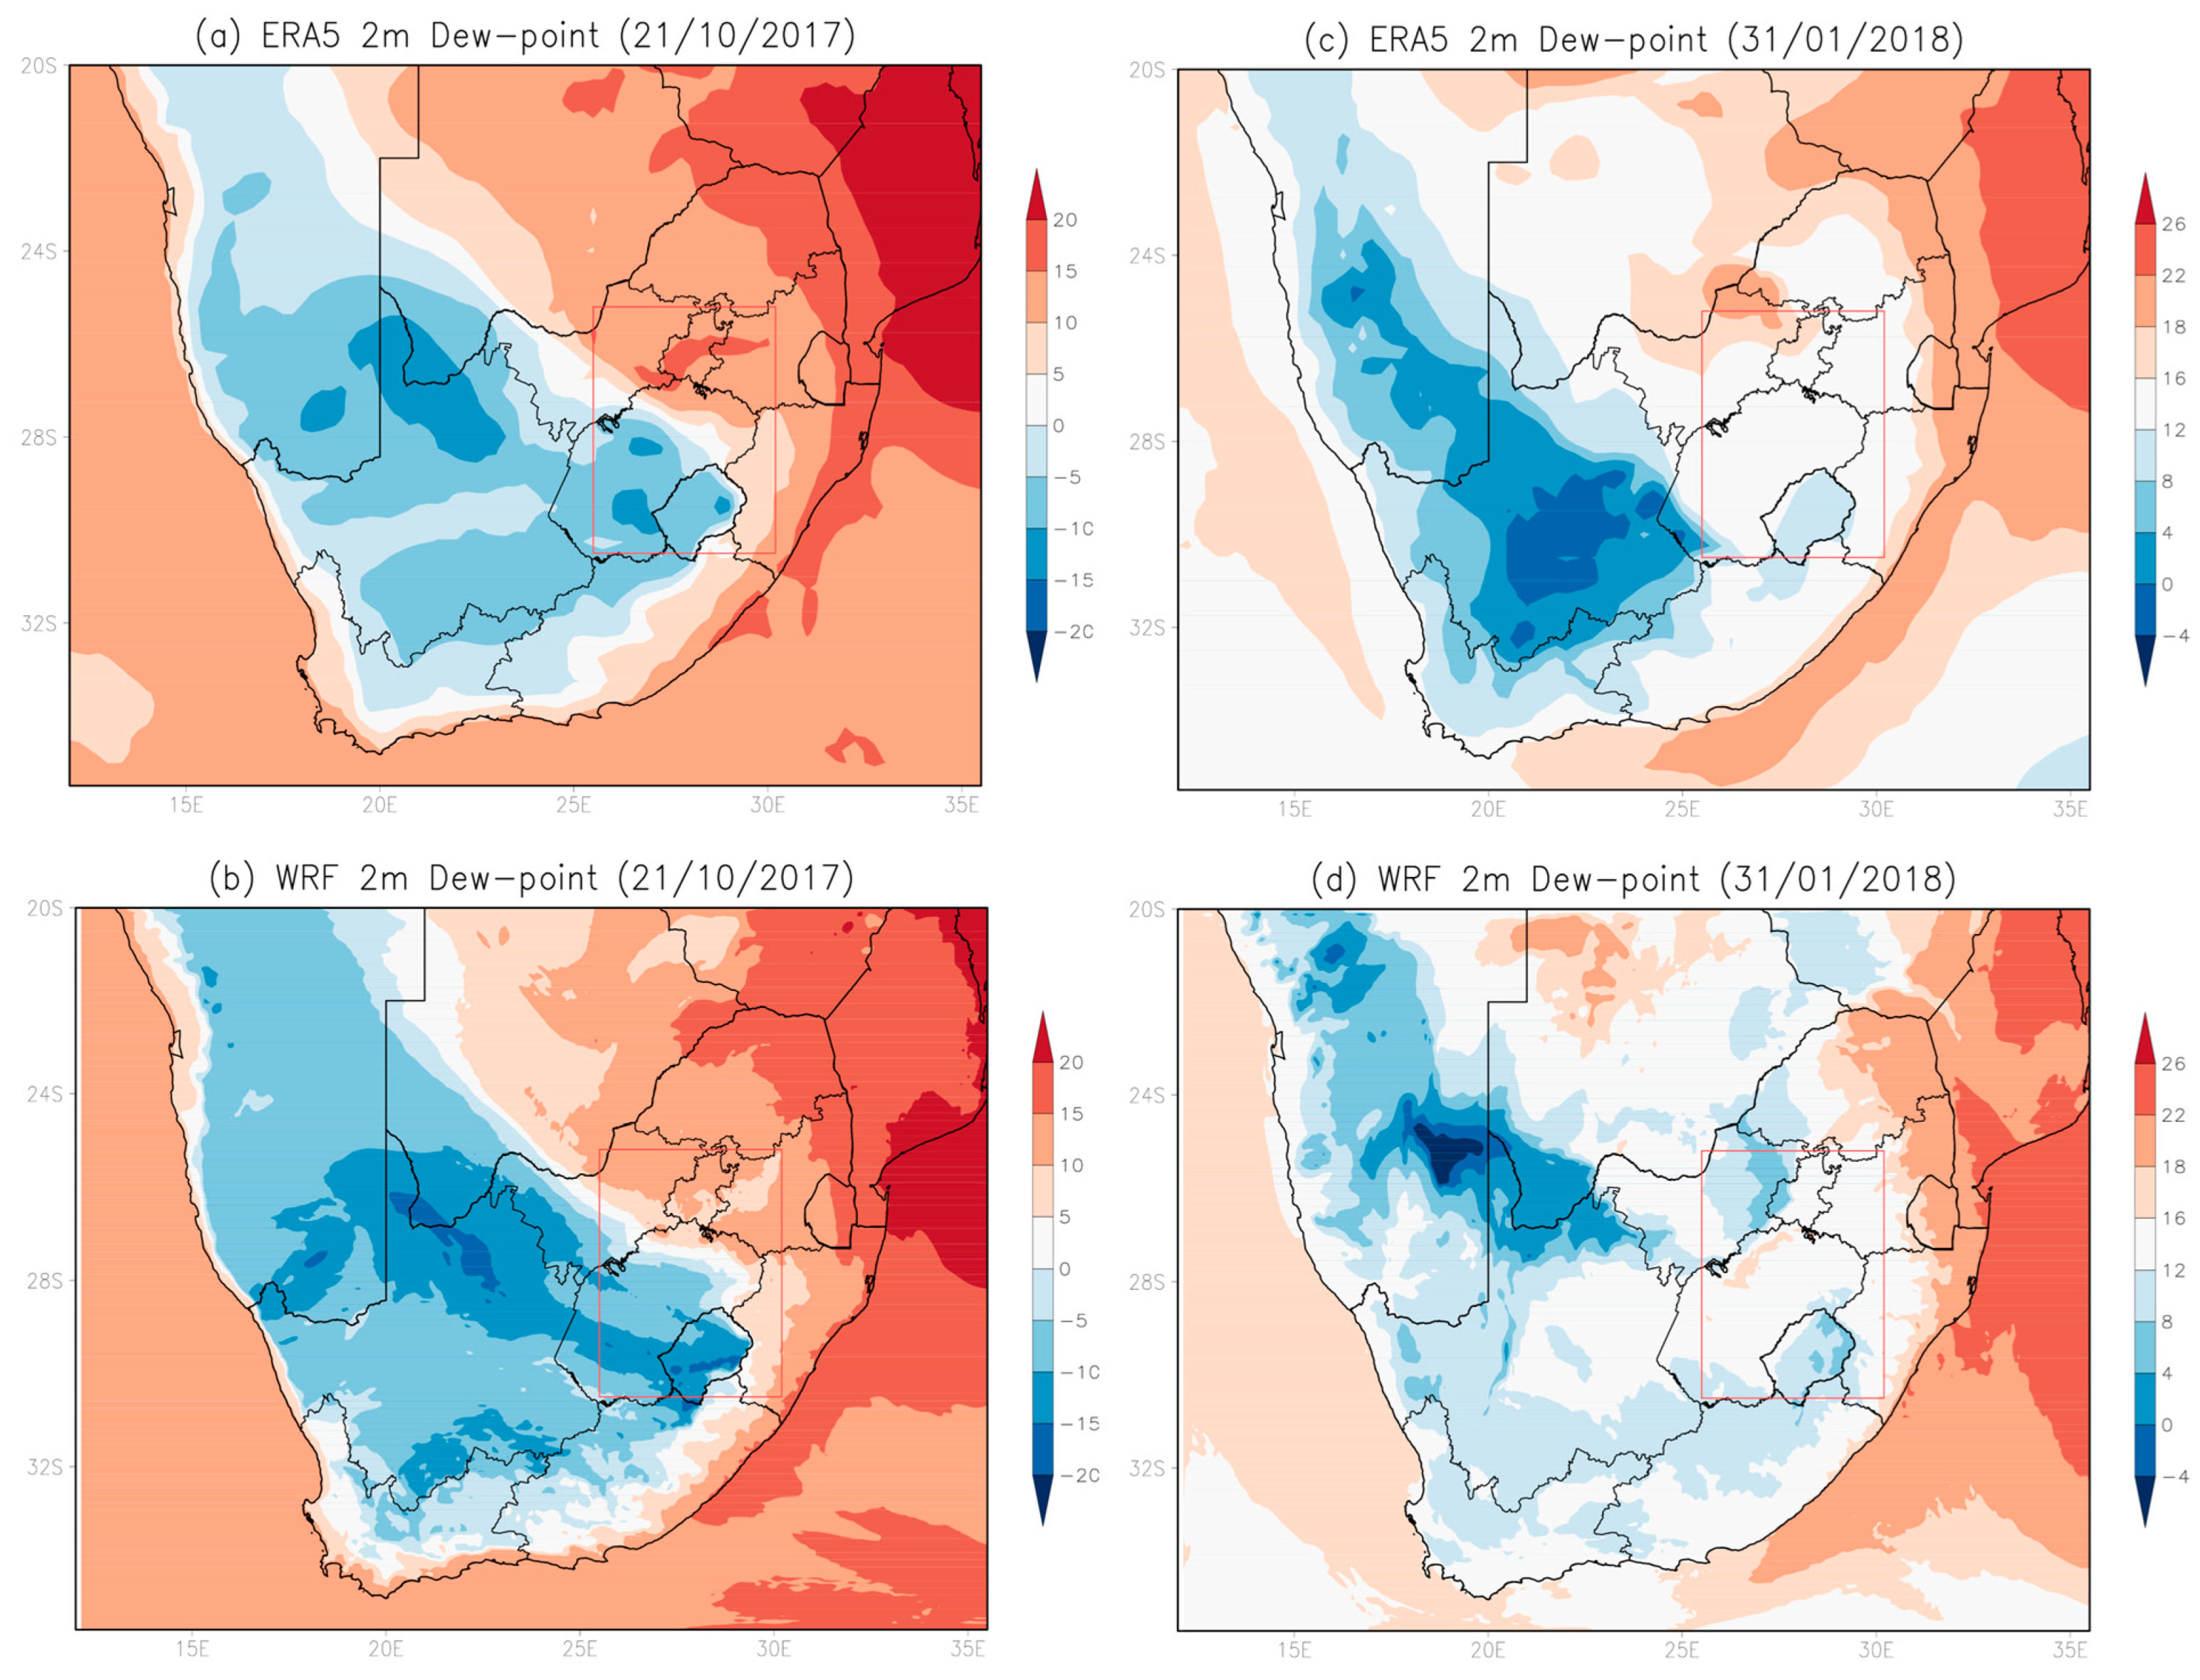
Both ERA5 data and WRF simulations for the 21 October 2017 squall line thunderstorm were able to depict a well-defined dryline (Figure 7a,b) over the Highveld, which often serves as a triggering mechanism for thunderstorms [59]. The western region was much drier than the eastern region within the Highveld. In the January to February 2018 case, neither the observed nor simulated 2m-dewpoint (Figure 7c,d) could exhibit a dryline over the Highveld, which might be attributed to the fact that the atmosphere is mostly barotropic at this time of year [33]. This suggests that, through the process of orographic lifting, the Drakensberg Mountain range to the eastern parts of South Africa (Figure 1) where the thunderstorm occurred, served as a triggering mechanism for the formation of the thunderstorm on 1 February 2018 instead of a dryline. The observed and simulated dryline results in this study agree with the findings of a recent study by van Schalkwyk et al. [59], which focused on the climatology of drylines over the region and demonstrated that frequent drylines are observed during early summer over our study area, but these drylines are typically located far west in the Northern Cape Province as the summer season progresses.
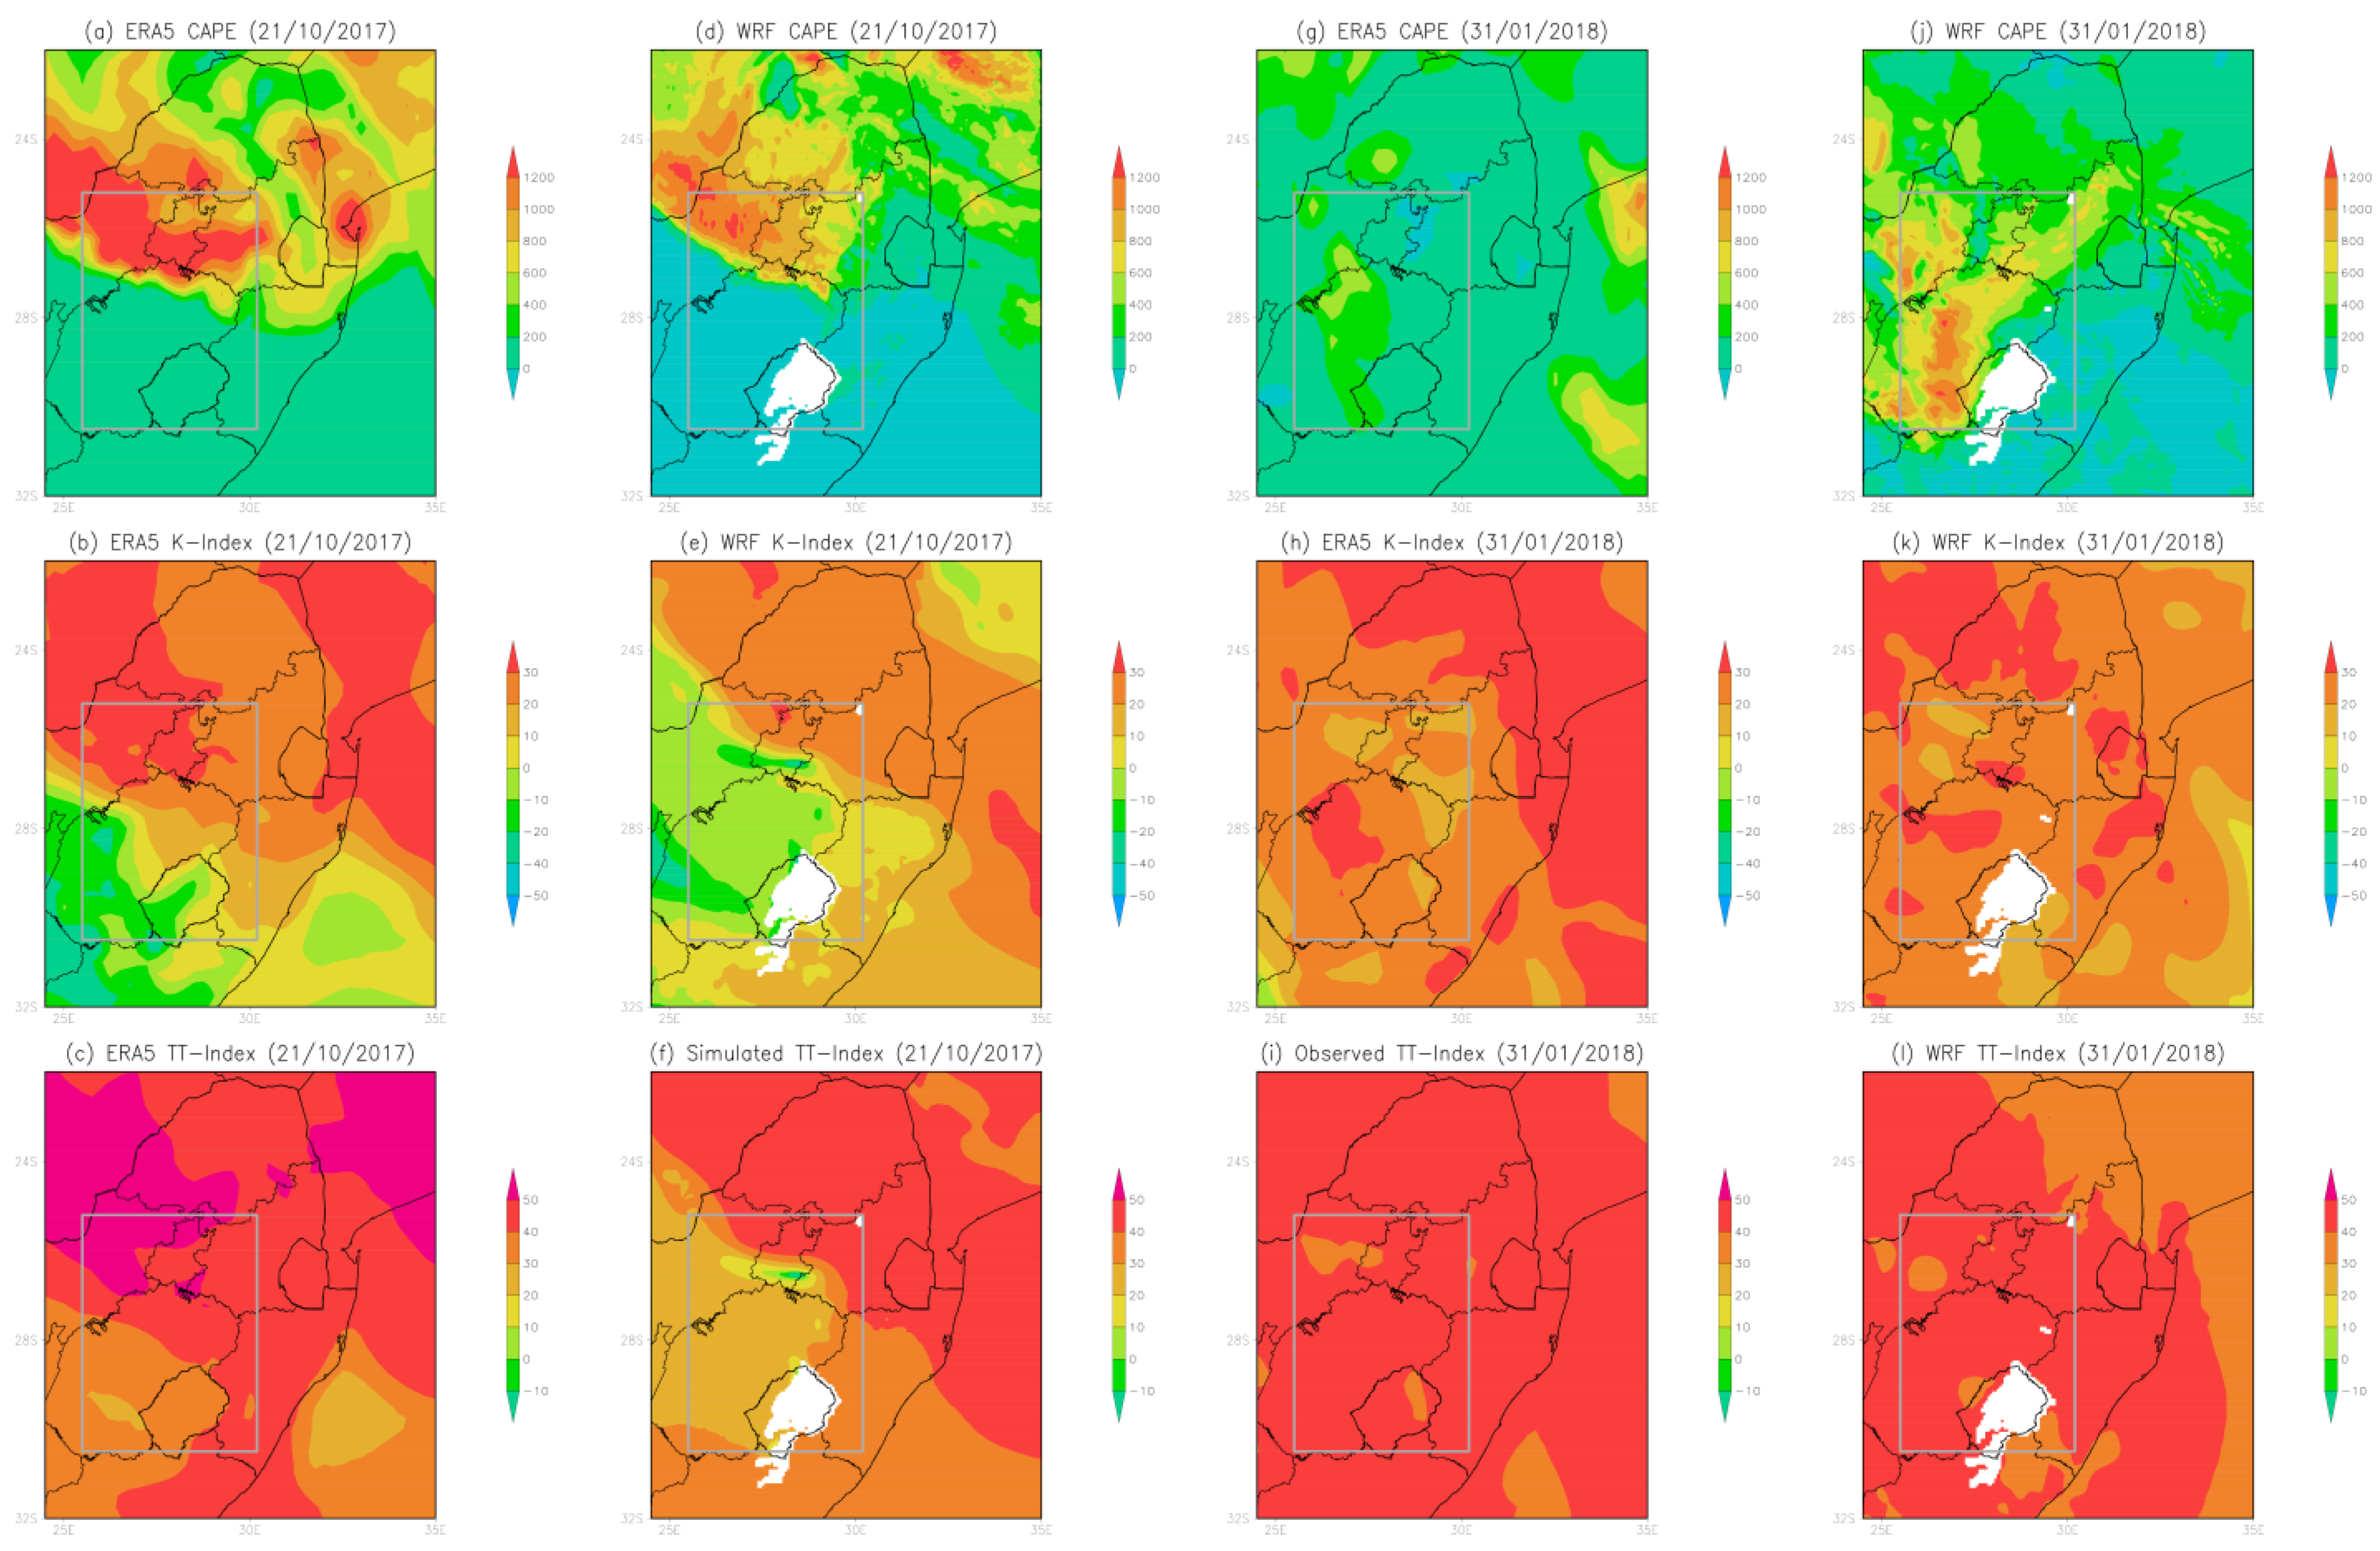
An analysis of three instability indices was performed during the event’s occurrences on 21 October 2017: CAPE, K, and TT. The ERA5 data of these indices all concurred that the atmosphere was unstable (Figure 8a–c) for this event, which favours the occurrence of severe thunderstorms. While the CAPE indicated a very unstable environment (~2000 J/kg), the K was around 30 °C, and the TT was 45–50 °C, indicating a higher likelihood of thunderstorm with heavy rain. The WRF simulations captured the general pattern of all three atmospheric instability indices (Figure 8d–f). The CAPE was accurately simulated, while both K and TT were underestimated by the WRF model by 10 °C and 20 °C, respectively. Simulated K were around 20–30 °C and did not favour severe thunderstorm occurrence. However, it must be noted that this index considers dewpoint temperature and dryness that can occur at 700 hPa, but, given sufficient moisture below this level (as it is the case here) and a suitable lifting mechanism, thunderstorms can still occur.
The observed CAPE values are lower than simulated values, which are favourable for thunderstorm development for the 31 January/1 February 2018 squall line (Figure 8g,j); however, CAPE is a crude estimation. Previous studies [91,92] indicated that low CAPE values together with high shear can lead to a severe thunderstorm, particularly over regions of moist boundary layers as in the case of this squall line event (Figure 6c,d). Wind shear has also been linked to the organization of convection in squall line events [33]. The simulated CAPE at midnight for the 2018 case may be underestimated because temperature drops around this time, and surface cooling stabilizes the boundary layer, which then suppresses vertical motions and prevents the atmosphere from becoming sufficiently unstable in the model. Figure 8h,i show the K (20–30 °C) and TT (above 45 °C), respectively, both indicating favourable conditions for the generation of moderate thunderstorms. Simulated patterns of K and TT-indices (Figure 8k,l) agree with observations.
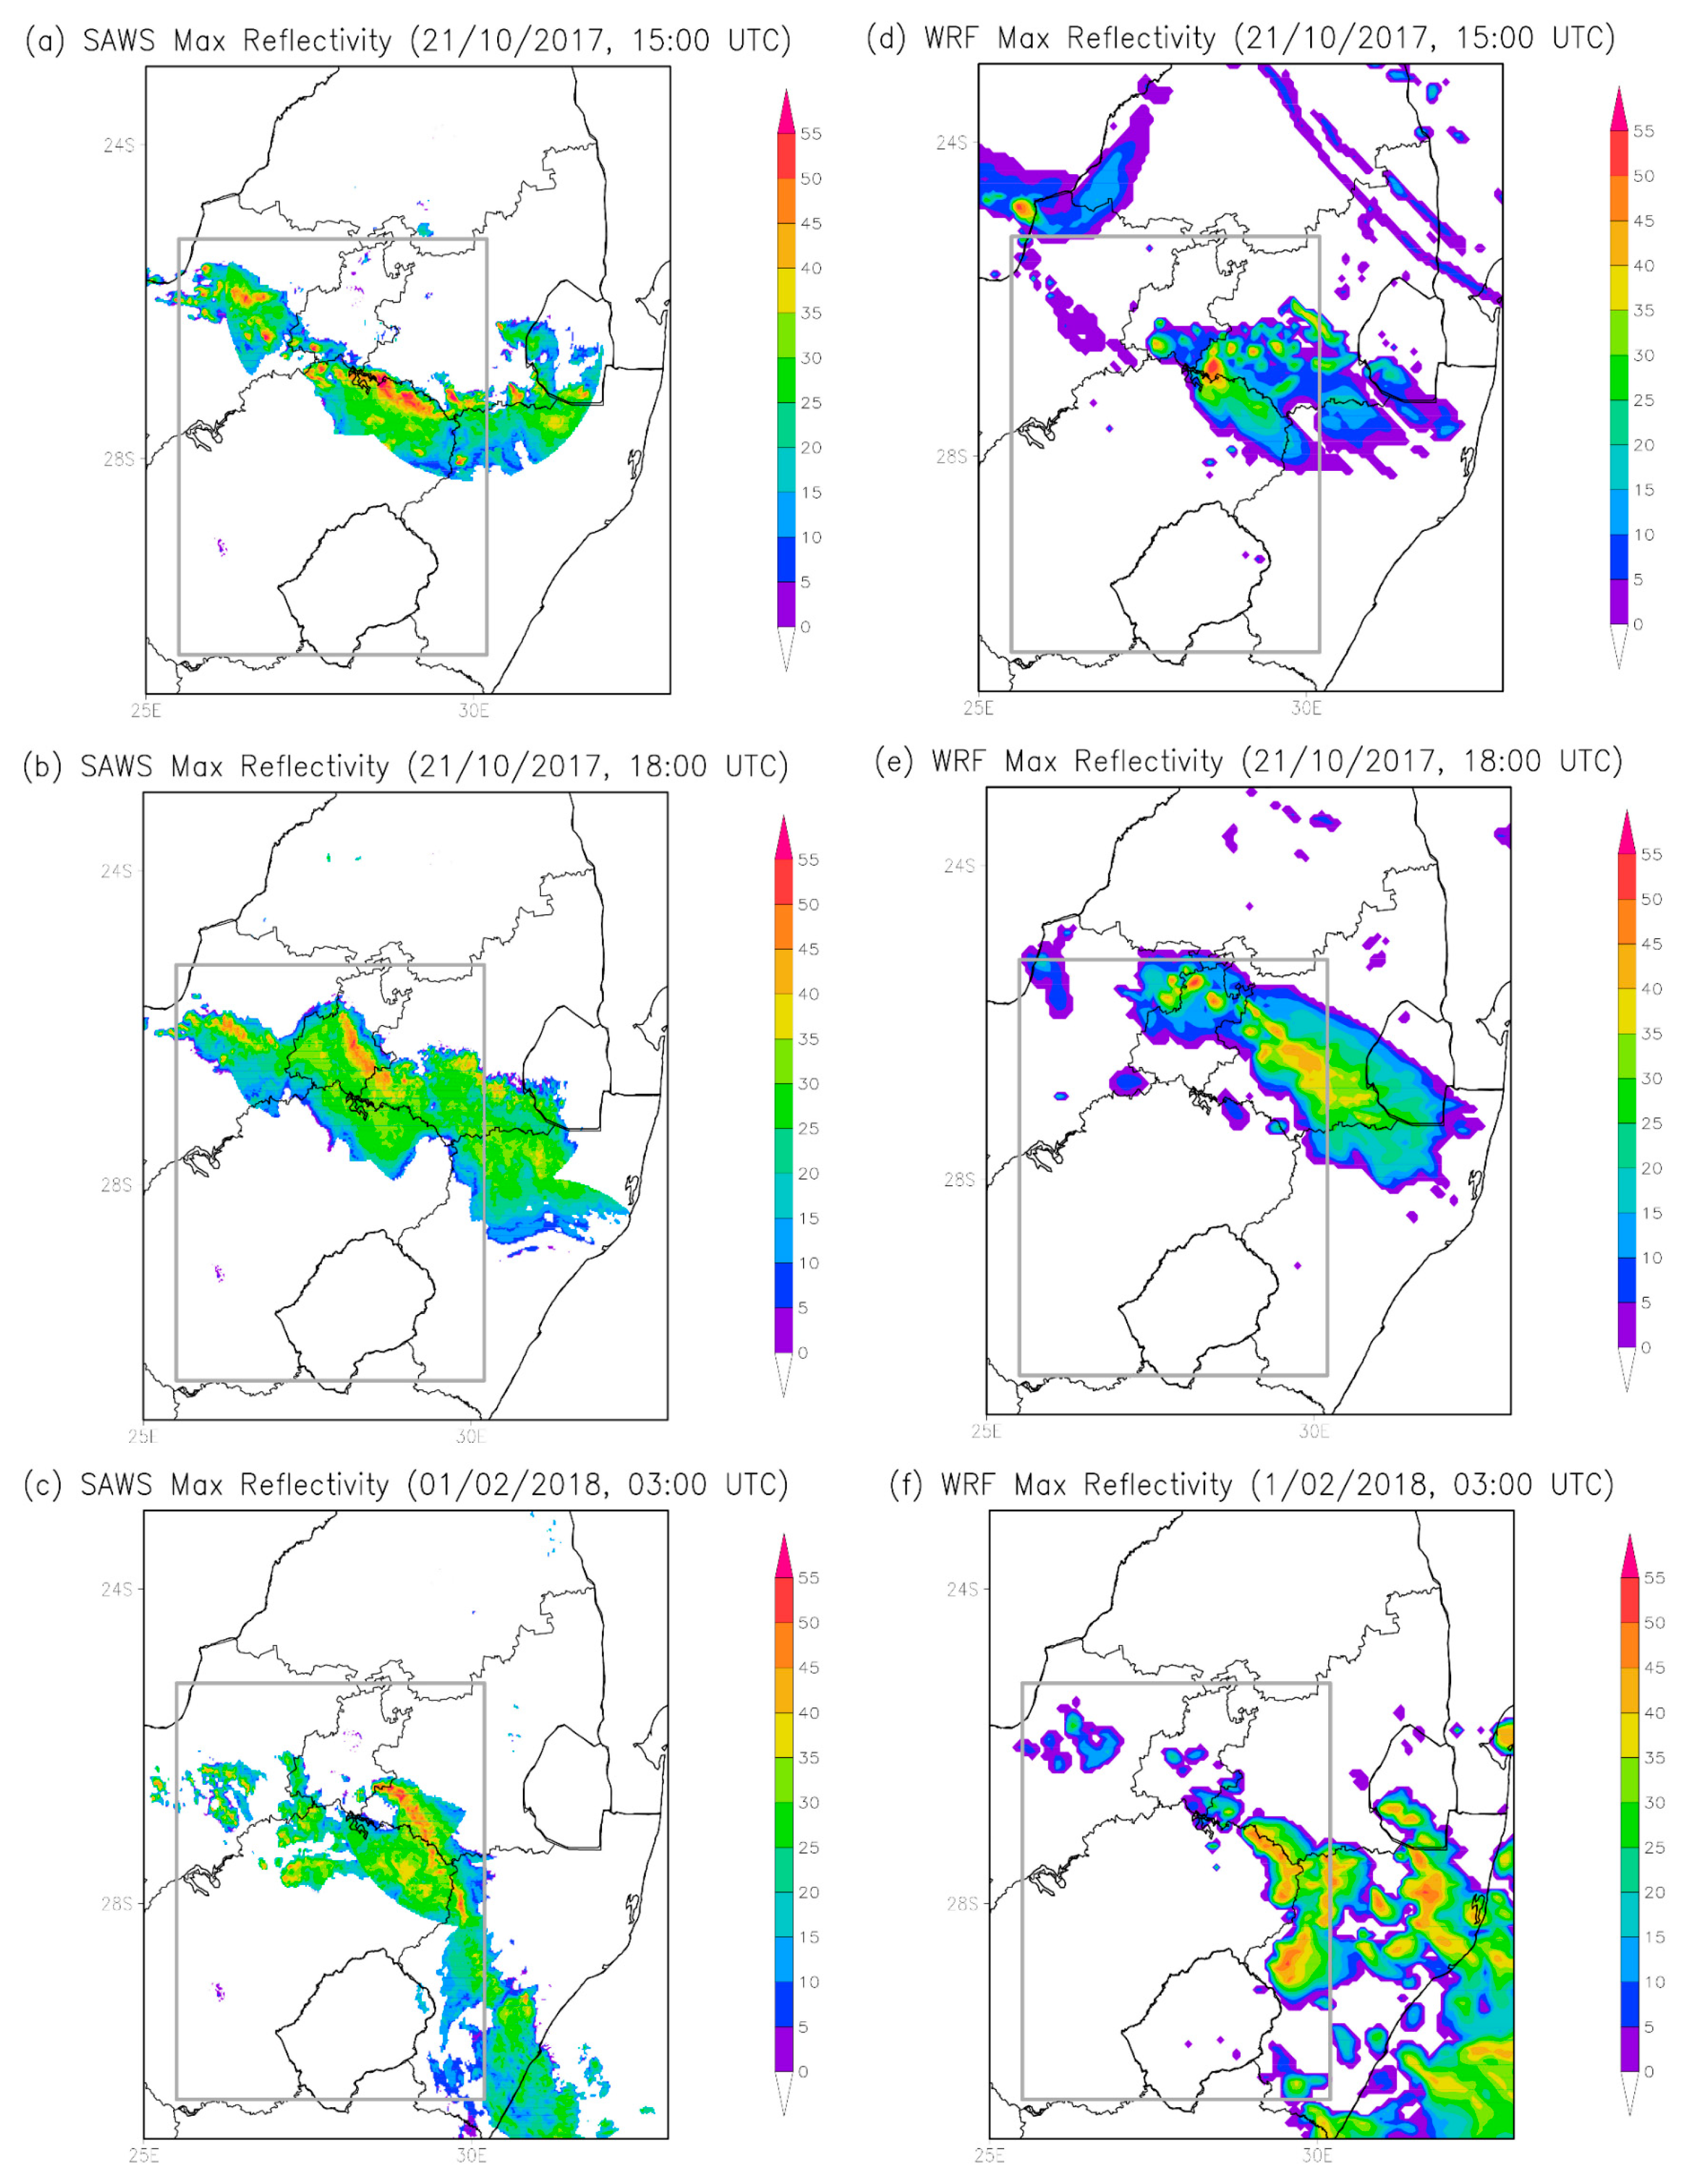
Figure 9 presents a comparison between observed maximum radar reflectivity data from SAWS and WRF model simulations during both squall line events. The observed maximum reflectivity showed a developing thunderstorm in the northern regions of the South African Highveld. The WRF model demonstrates a commendable ability in capturing the development of these thunderstorms. However, a noticeable inconsistency arises as the model consistently simulated the storms further eastward compared to the observed data. While both observations and simulations are similar in terms of storm propagation direction and align with the direction of the originating moisture influx, the simulated storm location appears to be displaced further eastward.
Figure 9a shows a well-defined squall line event on the 21 of October 2017 with a very shallow stratiform region as discussed earlier in Section 2.1. The WRF simulations were able to reproduce storm cells, which were later developed to form a squall line (Figure 9e). The primary origin of moisture for the squall line event on 21 October 2017, could be traced back to the Mozambique Channel as detailed in Section 2.3. Consequently, the simulated storm exhibits a marginal eastward displacement in comparison to the observations around 18:00 UTC (Figure 9b), aligning with the trajectory of horizontal winds that transported RH near the surface.
For the 31 January to 1 February 2018 squall line event, a substantial moisture content was driven from the SWIO by a prominent ridging high-pressure system (Figure 5c,d). In comparison to the observed storm location (Figure 9c), this event was simulated to the southeastern parts of the country (Figure 9f) towards the direction of where RH is transported from. This may suggest that the simulated storm velocity was higher than the observed velocity.

4.4. Observed Versus Simulated Rainfall

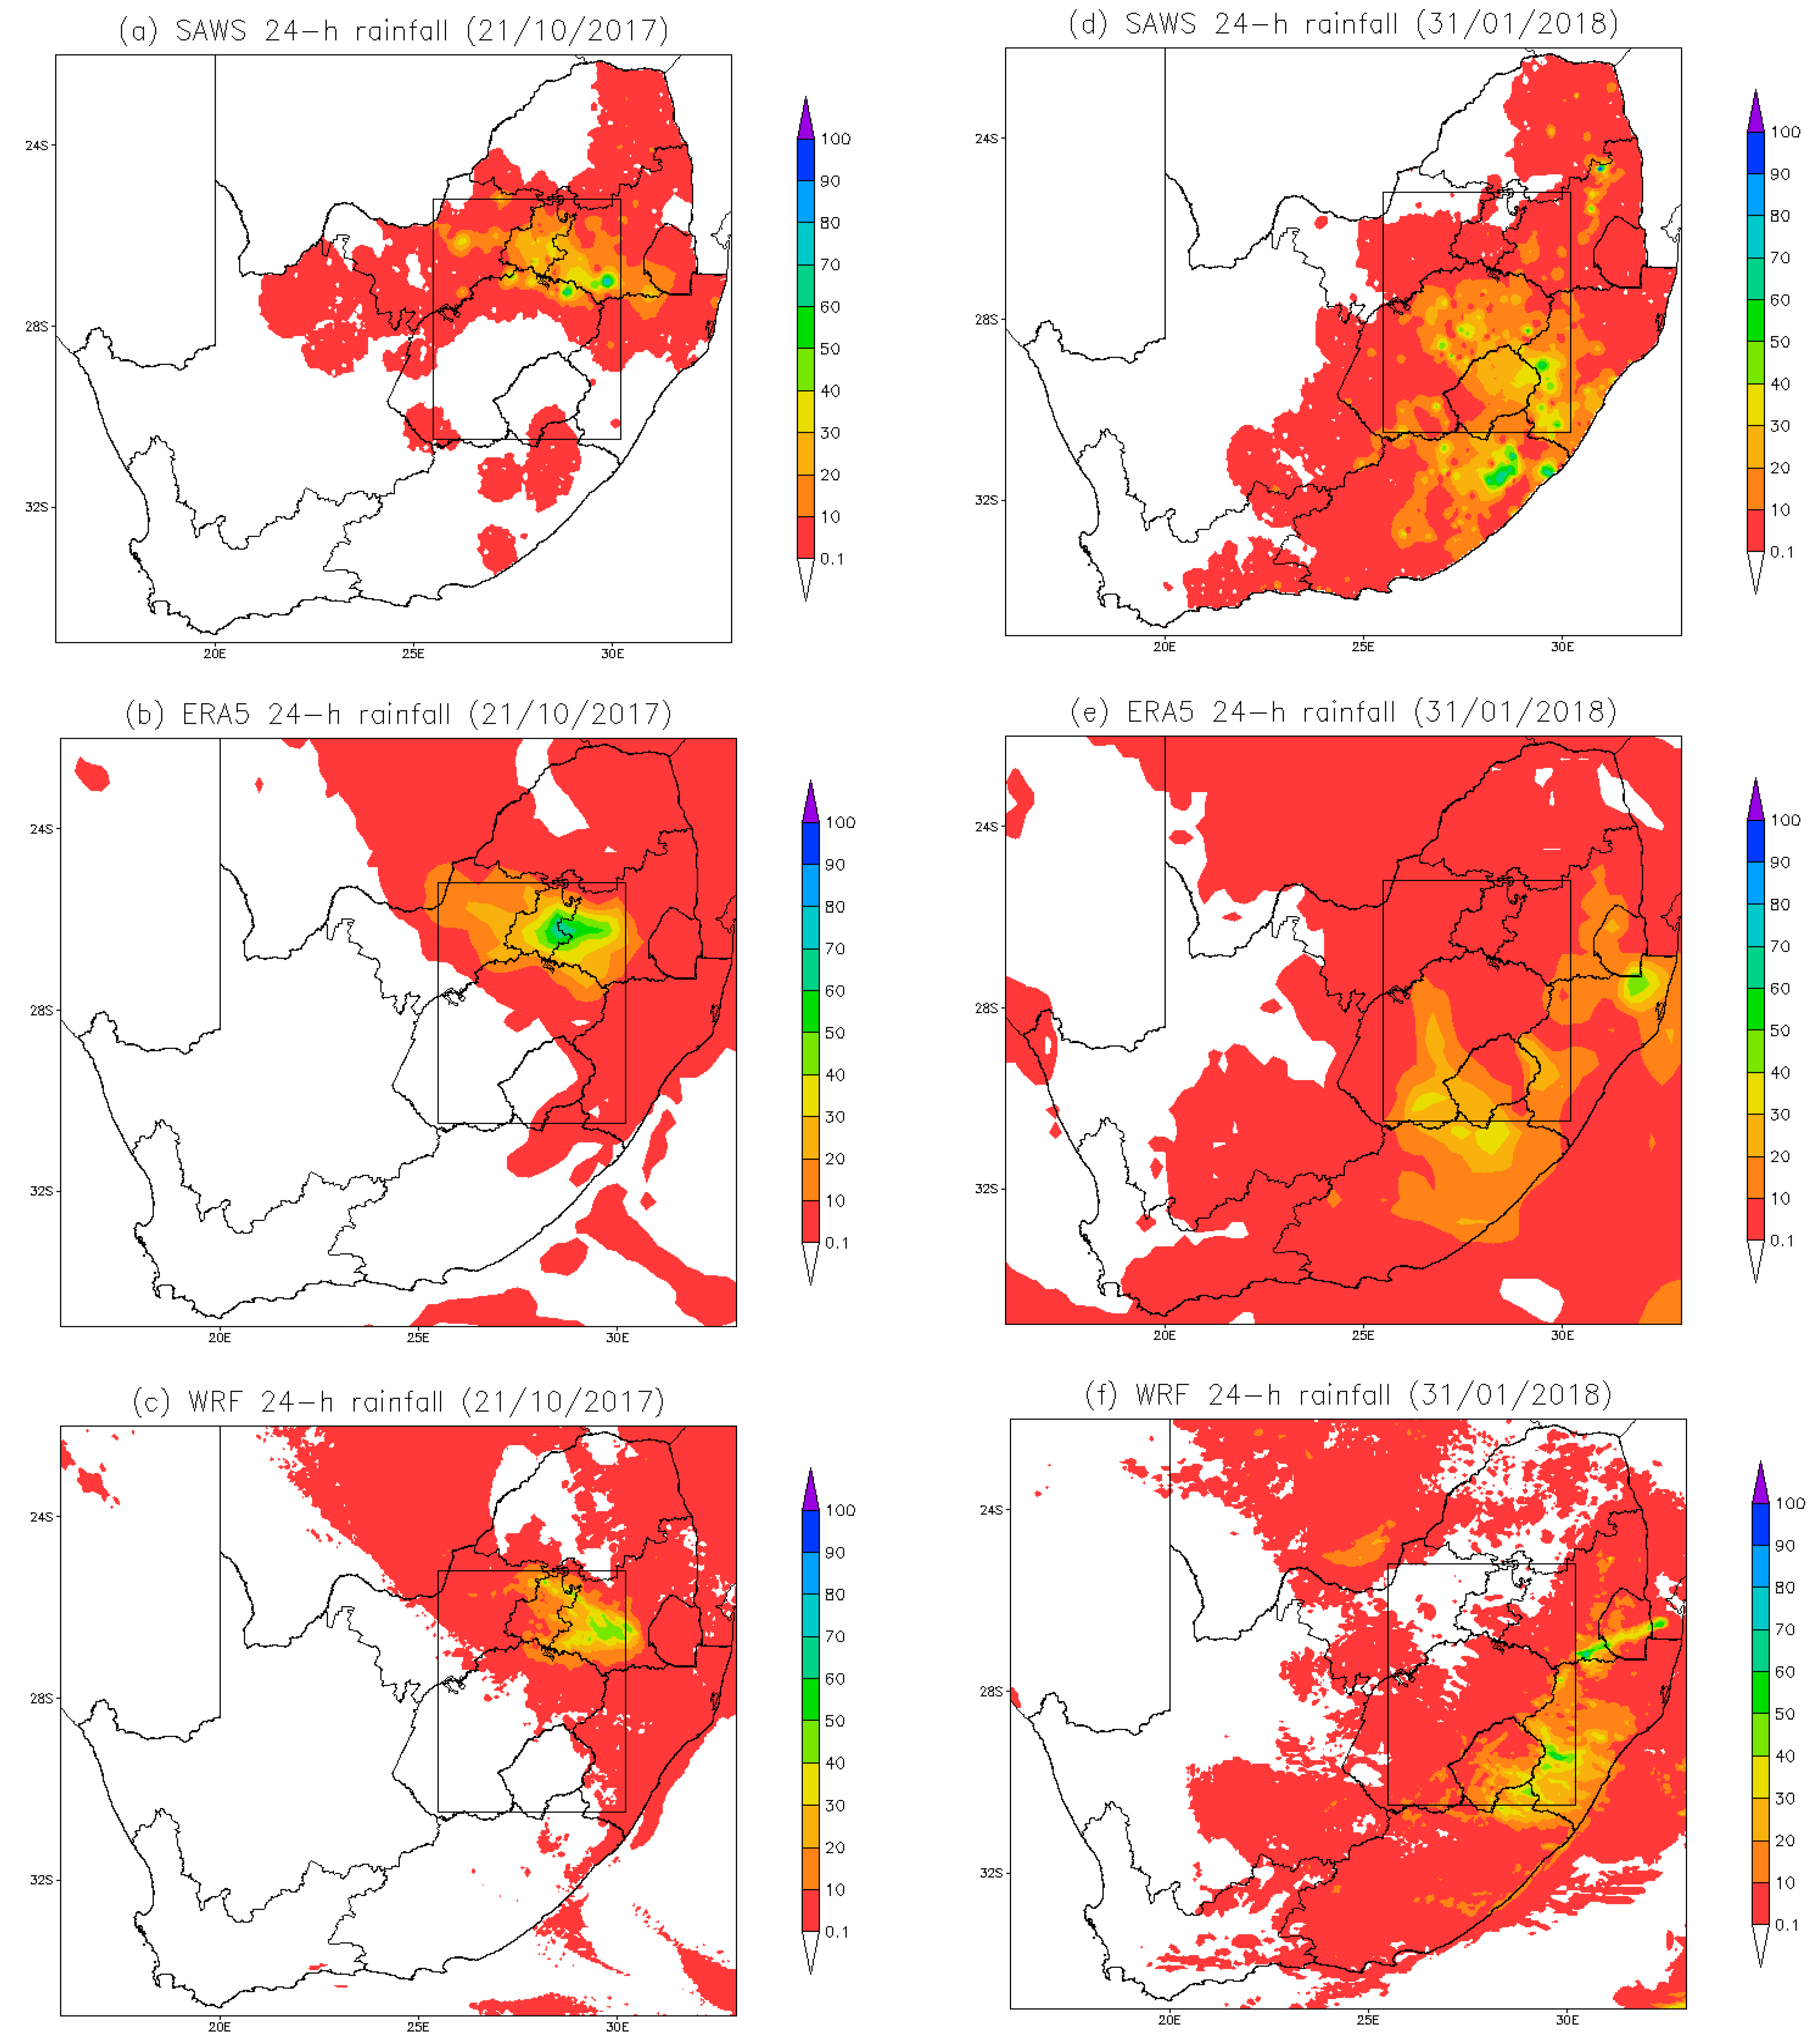
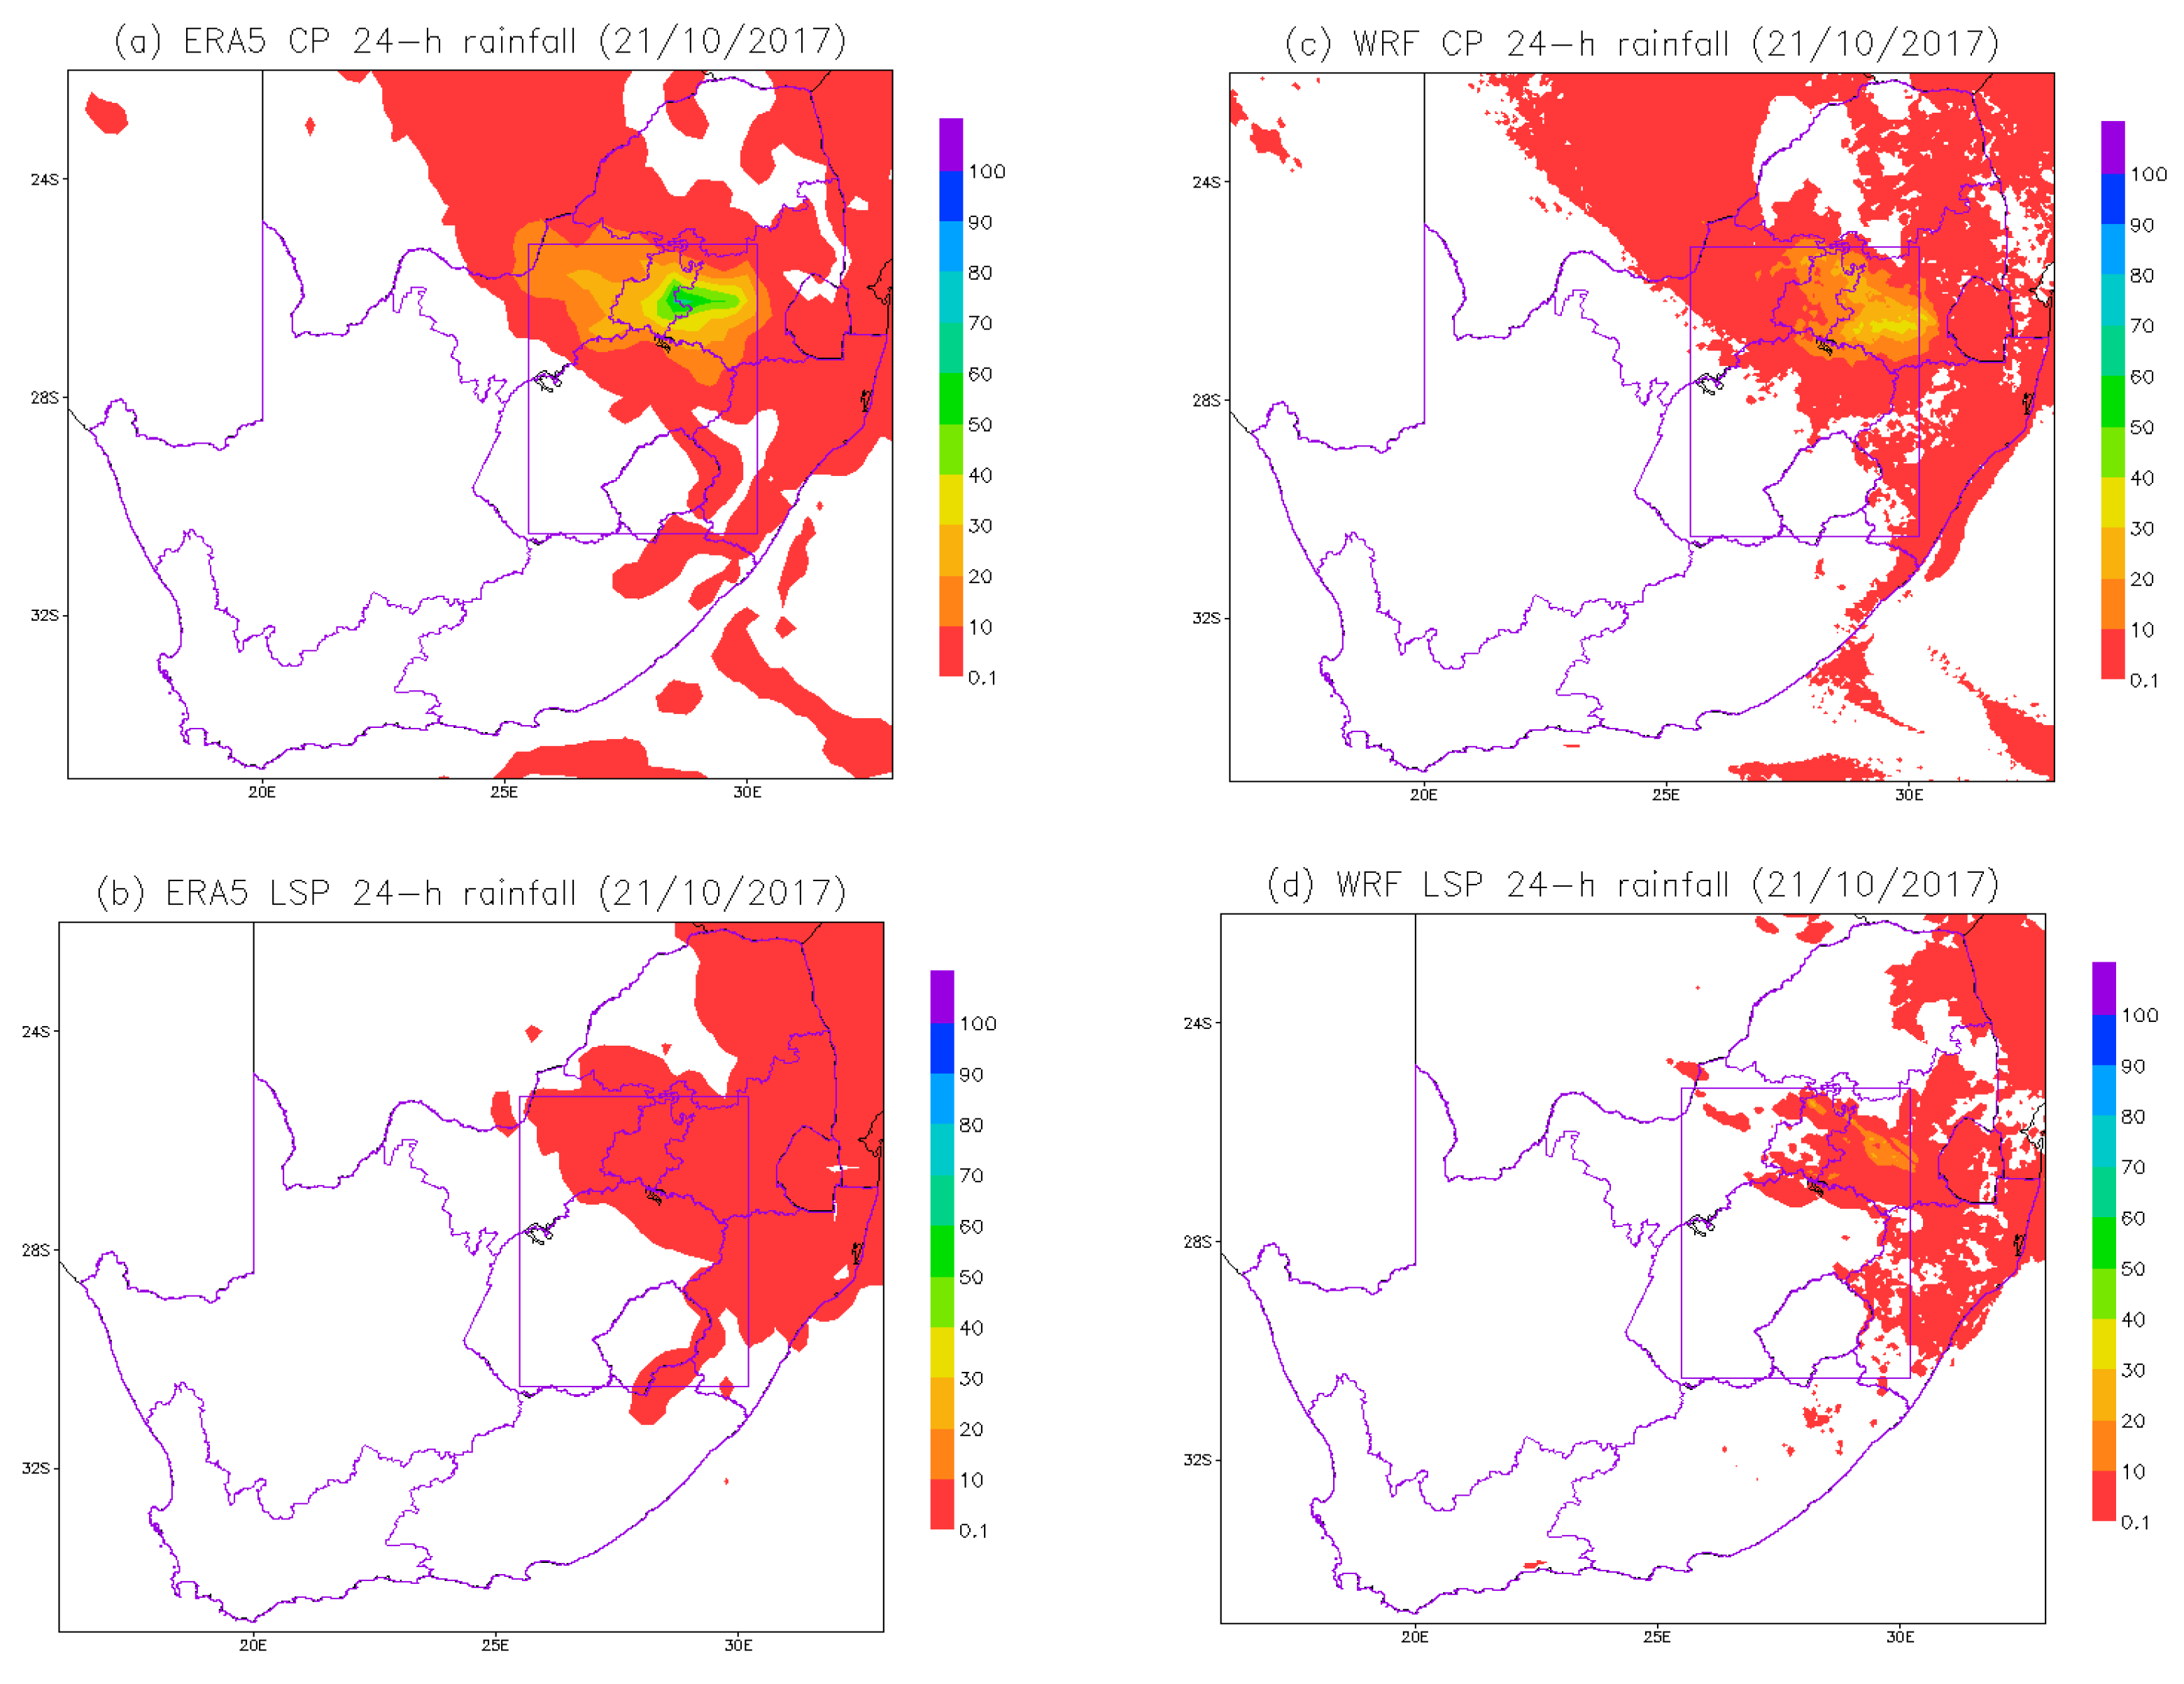
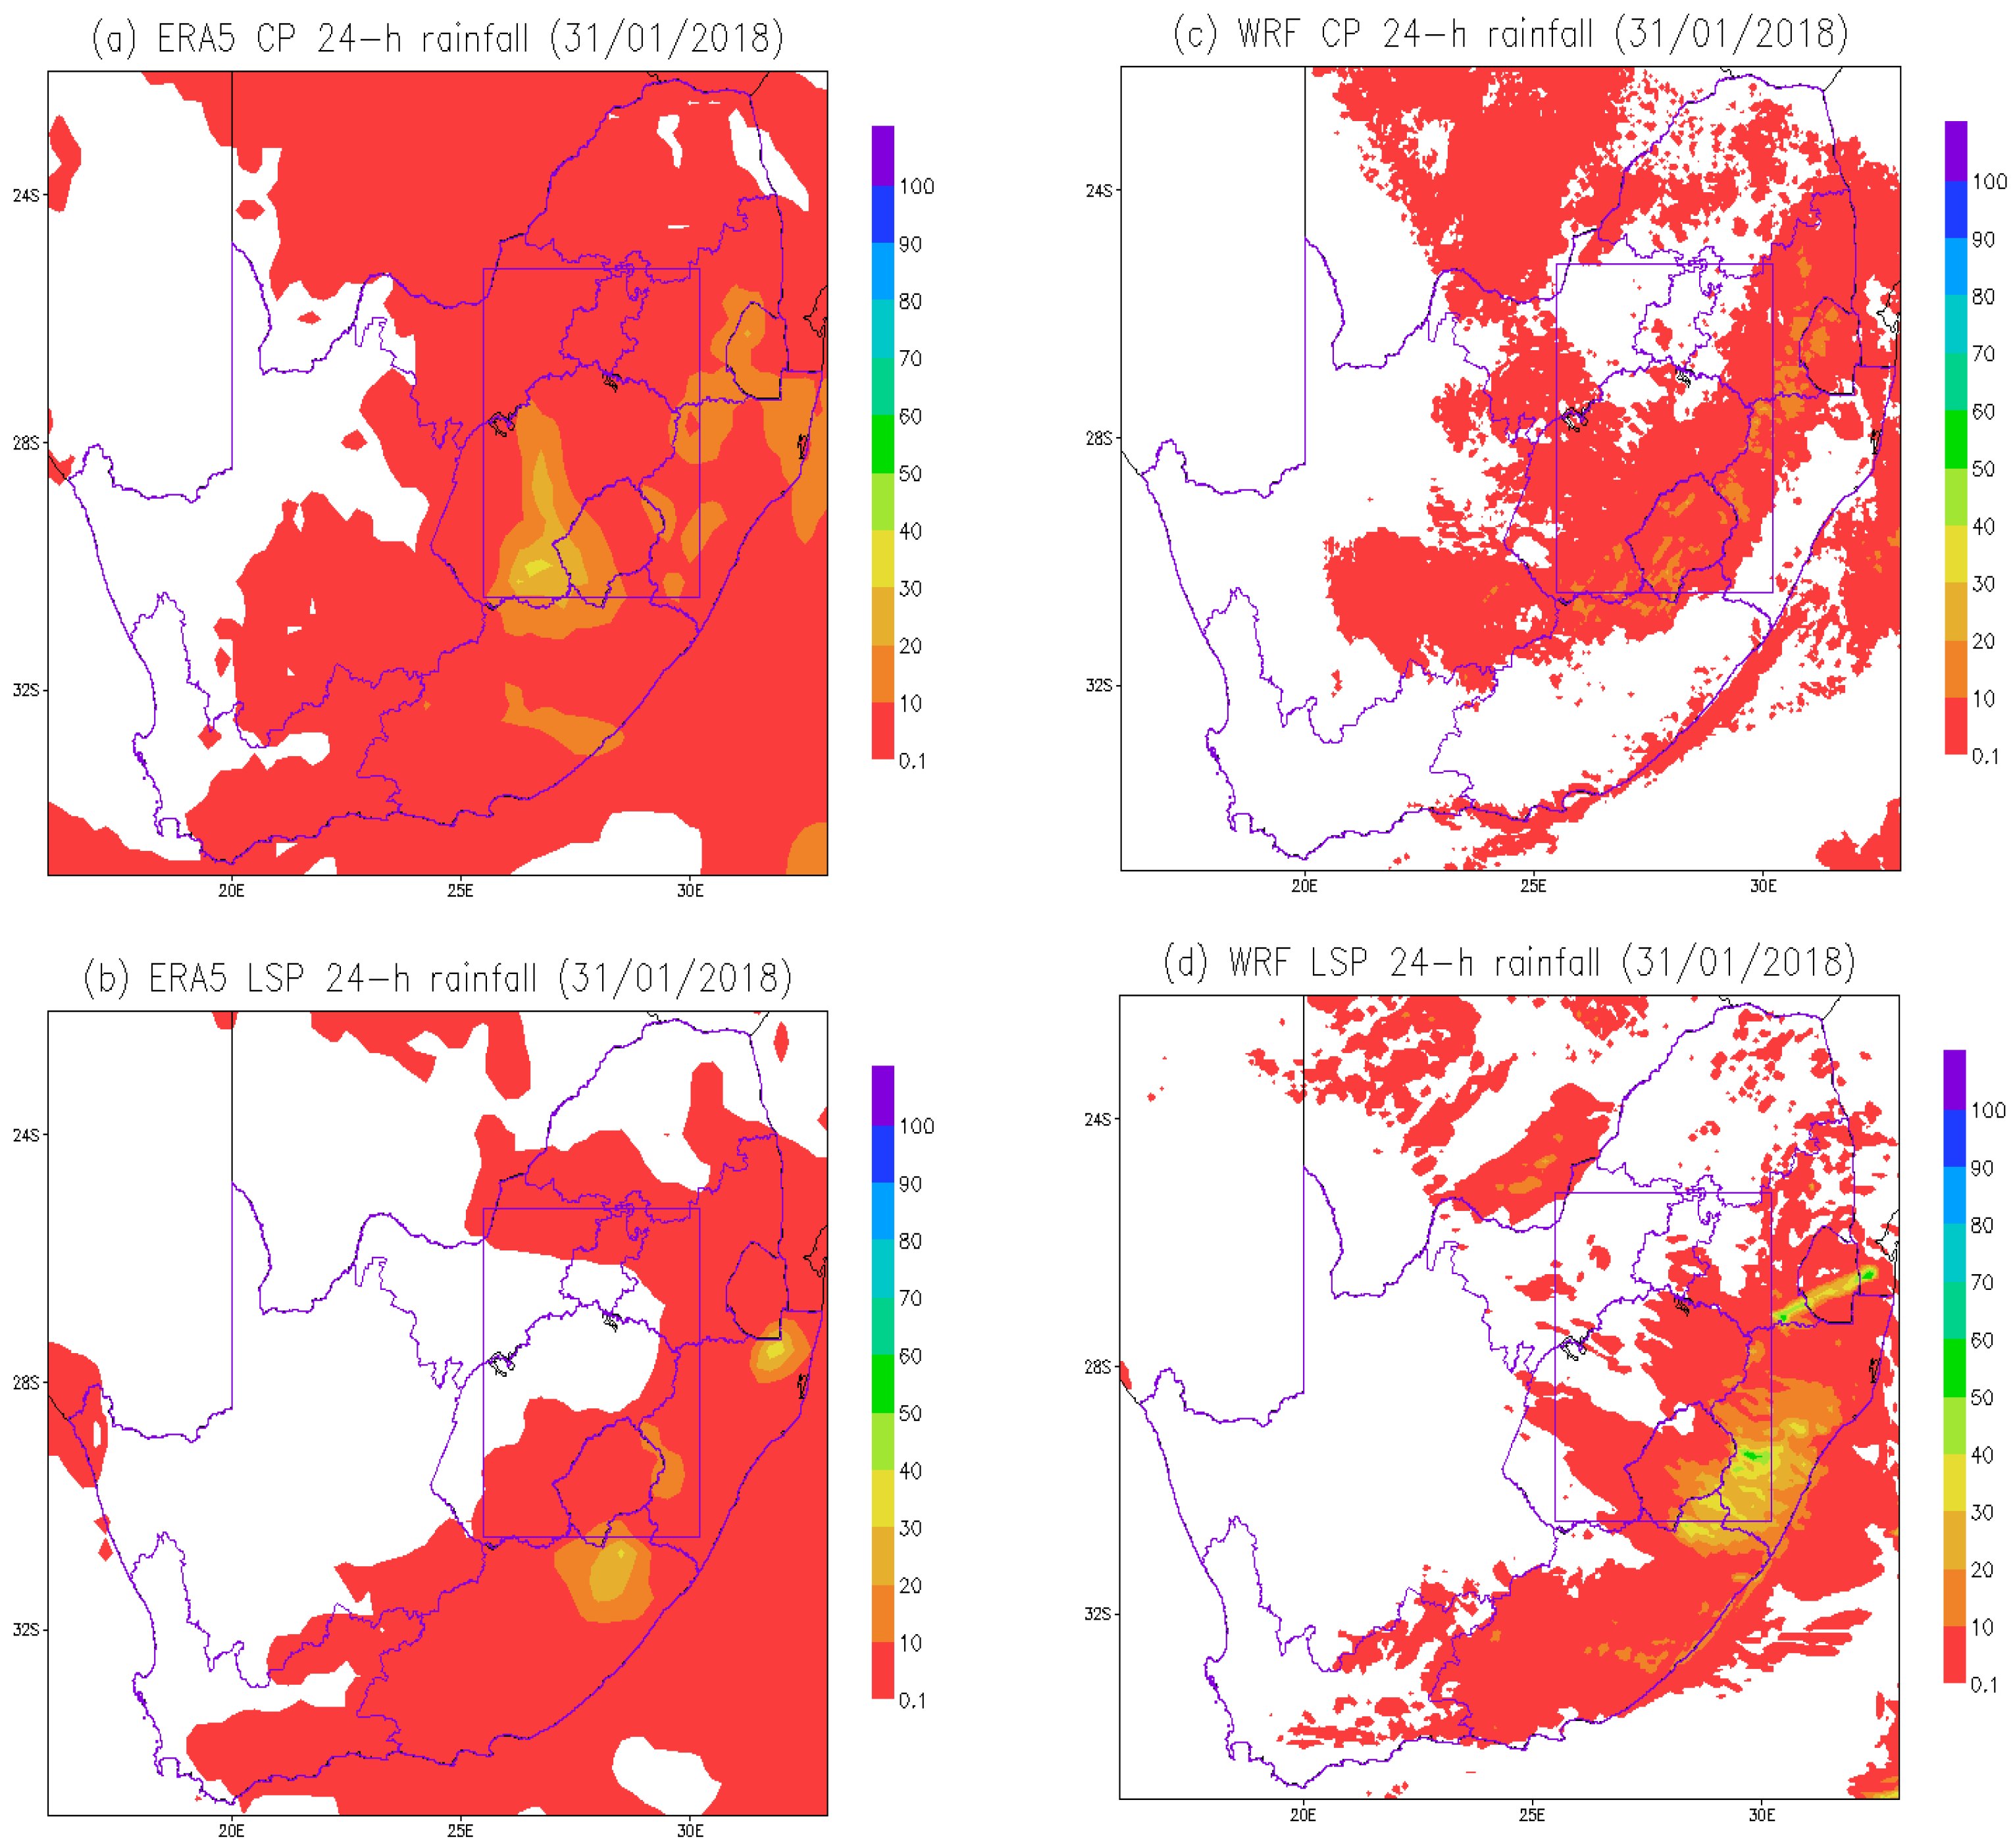
The SAWS observed rainfall data in this section were interpolated using ArcGIS version 10 and applied the Inverse Distance Weighted (IDW) approach [93]. The IDW method of interpolation is known for its simplicity and applicability, making it less prone to errors during the interpretation of results. It also works well with high-density station data [93] as in the case of the SAWS density network (Figure 1). The 24 h rainfall totals were used in this analysis because most SAWS stations report manual rainfall measurements at daily intervals. During the 2017 case, the Highveld region experienced heavy rainfall exceeding 50 mm shown by the SAWS data (Figure 10a). The WRF model performed well in capturing this event, particularly in reproducing the highest rainfall amounts observed over the eastern parts of Mpumalanga. Both ERA5 and the WRF model were able to reproduce the rainfall occurrence for this event (Figure 10b,c); however, the WRF simulated rainfall region was higher than the observed rainfall from SAWS stations. The WRF model also captures heavy rainfall in the southern regions of the Highveld region where the squall line of 1 February 2018 occurred (Figure 10d–f). Furthermore, despite simulating the correct location of the heaviest rainfall, the simulated rainfall was higher than observed. Further investigation of this study involved a comparative analysis of convective and large-scale rainfall for ERA5 data and WRF simulations, revealing that WRF underestimated convective rainfall while overestimating stratiform rainfall in both cases (Figure 11 and Figure 12). The underestimation of convective rainfall in both cases may be partly linked to the underestimation of instability parameters, with the K and TT indices in the 2017 case and CAPE in the 2018 case, all indicating a weaker convective environment in WRF.

5. Summary and Conclusions

This study investigated the performance of the WRF model in simulating squall line processes over the South African Highveld. The Highveld is an elevated region in the eastern parts of South Africa that is prominently industrialized and experiences a high frequency of thunderstorm occurrence, including squall lines. This study applied observational datasets, including station data, ERA5, and SAWS radar images to examine the incidence of squall lines and their related significant circulation patterns. Despite its limitations in resolving fine-scale convective processes, ERA5 remains the most advanced and reliable reanalysis dataset currently available for studying squall line environments due to its high spatial and temporal resolution and comprehensive assimilation of observations in comparison to other reanalysis datasets such as ERA-interim [65], NCEP/NCAR [94], and MERRA-2 [95]. The observed datasets were compared to the WRF simulations, a model initialized using GFS data. In this study, ERA5 is used solely for comparison of circulations, including convective and stratiform rainfall patterns, and not as a validation dataset due to its coarser resolution compared to WRF. Validation is performed using SAWS station observational data. The WRF model used the tropical physics suite owing to the latitudinal location of the study area.
Two squall line events were selected for analysis during the austral summer season, with the selection guided by radar availability. The first event occurred on 21 October 2017, and the second occurred from 31 January to 1 February 2018. These events occurred during different rainfall regimes, i.e., early and late summer rainfall regimes, which are separated by a mid-summer dry spell between late December and early January [96,97], which are typically marked by distinct atmospheric instabilities [33].
The two squall line events were characterized by surface troughs, which extended over the northern interior of South Africa, coupled with middle-level perturbations. The 2018 squall line also had a prevailing zonal structured ridging anticyclone, which is usually associated with high-moisture fluxes over the eastern parts of the country [86]. The WRF model did a good job in reproducing these prevailing large scale circulation patterns during the squall line occurrence. The model was also capable of capturing surface horizontal winds and the distribution of moisture. The primary source of moisture for the 2017 squall line was the Mozambique Channel, while the SWIO provided warm and moist air for the 2018 event. While the horizontal winds and dry conditions in the country’s western interior at 500 hPa were also well simulated, the model was unable to reproduce the middle-level moisture content observed in the northern parts of the Highveld for the 2017 event. This middle-level moisture played a role in sustaining the updraught during the event.
Three atmospheric instability indices were analyzed in this study, i.e., CAPE, K, and the TT. While CAPE is preferred in most studies, using it in conjunction with other indices helps in optimizing results. The WRF model simulated all three indices for both cases well, apart from an overestimation of CAPE for the 2018 event. While the observed CAPE did not favour thunderstorm occurrence for this event, previous studies (e.g., refs. [91,92]) argued that low-CAPE values together with wind shear can lead to thunderstorm occurrences. The 2 m-dew point temperature was then analyzed for both the observations and simulations and showed a well-defined dryline for the 2017 event. The 2018 event was of an orographic nature, and the dryline was neither observed nor simulated as the atmosphere was mostly barotropic. The dryline results are also consistent with findings by van Schalkwyk et al. [59] who proved that dry lines are generally eastward during early summer and further placed western regions in late summer. The resulting rainfall was also simulated by the model; however, the simulated region is far larger than observed. The model also underestimates convective rainfall while overestimating stratiform rainfall. Since convective processes heavily rely on model resolution, future research could benefit from higher-resolution WRF simulations to better resolve localized convective rainfall.
This study contributes to the understanding of squall line processes in South Africa, highlighting the capabilities and limitations of the WRF model in simulating these events. Beyond contributing to the scientific understanding of squall lines, our study underscores the critical need for ongoing research and model refinement. Improvements in sub-daily observing stations, upper air data, and radar observations will also assist in improving the quality of similar studies in the future. This continuous effort is essential not only for improving our scientific insights into squall lines but also for providing more dependable information crucial for effective decision making. As weather-related risks are expected to continue in the future [98,99,100], the persistent improvement of models and exploration of additional research avenues are crucial. These efforts play a pivotal role in enhancing regional resilience and preparedness to tackle the challenges posed by dynamic extreme weather conditions.

Author Contributions

I.L.M. conceptualized this study. I.L.M., M.-J.M.B. and R.M. performed the model set up, simulations, event investigation, and data analysis; I.L.M. wrote the initial draft; M.-J.M.B., R.M., R.P.B., A.F., H.C. and T.N. revised and edited the manuscript. All authors have read and agreed to the published version of the manuscript.

Funding

This work was supported by generous funding from the SAWS and Water Research Commission (WRC) under project no. C2020/2021-00596 as part of a PhD study.

Institutional Review Board Statement

Not applicable.

Informed Consent Statement

Not applicable.

Data Availability Statement

The data used in this study was obtained from the South African Weather Service (rainfall, radar imagery and Caelum publication) and can be made available upon request. The ERA5 reanalysis data can be obtained online via the web portal (https://climate.copernicus.eu/, accessed on 18 March 2022). GFS data was obtained from the National Center for Atmospheric Research website at https://rda.ucar.edu/datasets/d084001/, accessed on 20 October 2024.

Acknowledgments

The Weather Research and Forecasting (WRF) model simulations were performed on the clusters of the Centre for High Performance Computing (CHPC), hosted at the CSIR. The Global Forecast System (GFS) data was used to initialize the WRF model while ERA5 reanalysis data was used for observational analysis. This article is a revised and expanded version of a paper [101], which was presented at 37th Annual conference of South African Society for Atmospheric Sciences, Cape Town, South Africa, 30 October–3 November 2023.

Conflicts of Interest

The authors declare no conflicts of interest.

References

  1. Harrison, M.S.J. The annual rainfall cycle over the central interior of South Africa. S. Afr. Geogr. J. 1984, 66, 47–64. [Google Scholar] [CrossRef]
  2. Tyson, P.D.; Preston-Whyte, R.A. The Weather and Climate of Southern Africa; Oxford University Press: Oxford, UK, 2000; 396p. [Google Scholar]
  3. Hart, N.C.G.; Reason, C.J.C.; Fauchereau, N. Cloud bands over southern Africa: Seasonality, contribution to rainfall variability and modulation by the MJO. Clim. Dyn. 2013, 41, 1199–1212. [Google Scholar] [CrossRef]
  4. Singleton, A.T.; Reason, C.J.C. Variability in the characteristics of cut-off low pressure systems over subtropical southern Africa. Int. J. Climatol. 2007, 27, 295–310. [Google Scholar] [CrossRef]
  5. Favre, A.; Hewitson, B.; Lennard, C.; Cerezo-Mota, R.; Tadross, M. Cut-off lows in the South Africa region and their contribution to precipitation. Clim. Dyn. 2013, 41, 2331–2351. [Google Scholar] [CrossRef]
  6. Xulu, N.G.; Chikoore, H.; Bopape, M.-J.M.; Ndarana, T.; Muofhe, T.P.; Mbokodo, I.L.; Munyai, R.B.; Singo, M.V.; Mohomi, T.; Mbatha, S.M.S.; et al. Cut-off lows over South Africa: A review. Climate 2023, 11, 59. [Google Scholar] [CrossRef]
  7. Schefczyk, L.; Heinemann, G. Climate change impact on thunderstorms: Analysis of thunderstorm indices using high-resolution regional climate simulations. Meteorol. Z. 2017, 26, 409–419. [Google Scholar] [CrossRef]
  8. STATSSA. Census 2022 Results. 2023. Available online: www.statssa.gov.za/wp-content/uploads/2023/10/Mbalo-brief-October-2023-WEB-FINAL.pdf (accessed on 25 January 2023).
  9. Kruger, A.C.; Shongwe, S. Temperature trends in South Africa: 1960–2003. Int. J. Clim. 2004, 24, 1929–1945. [Google Scholar] [CrossRef]
  10. Berg, P.; Moseley, C.; Haerter, J.O. Strong increase in convective precipitation in response to higher temperatures. Nat. Geosci. 2013, 6, 181–185. [Google Scholar] [CrossRef]
  11. Brooks, H.E. Severe thunderstorms and climate change. Atmos. Res. 2013, 123, 129–138. [Google Scholar] [CrossRef]
  12. Maure, G.; Pinto, I.; Ndebele-Murisa, M.; Lennard, C.; Nikulin, G.; Dosio, A.; Meque, A. The southern African Climate under 1.5 and 2 degree of global warming as simulated by CORDEX Regional Climate Models. Environ. Res. Lett. 2018, 13, 065002. [Google Scholar] [CrossRef]
  13. Kruger, A.C.; Rautenbach, H.; Mbatha, S.; Ngwenya, S.; Makgoale, T.E. Historical and projected trends in near-surface temperature indices for 22 locations in South Africa. S. Afr. J. Sci. 2019, 115, 50–58. [Google Scholar] [CrossRef] [PubMed]
  14. Intergovernmental Panel on Climate Change (IPCC). Linking Global to Regional Climate Change. Climate Change 2021—The Physical Science Basis; Intergovernmental Panel on Climate Change (IPCC): Geneva, Switzerland, 2023. [Google Scholar]
  15. Blamey, R.C.; Reason, C.J.C. Numerical simulation of a mesoscale convective system over the east coast of South Africa. Tellus A Dyn. Meteorol. Oceanogr. 2009, 61, 17–34. [Google Scholar] [CrossRef]
  16. Crétat, J.; Pohl, B. How physical parameterizations can modulate internal variability in a regional climate model. J. Atmos. Sci. 2012, 69, 714–724. [Google Scholar] [CrossRef]
  17. Crétat, J.; Macron, C.; Pohl, B.; Richard, Y. Quantifying internal variability in a regional climate model: A case study for Southern Africa. Clim. Dyn. 2011, 37, 1335–1356. [Google Scholar] [CrossRef]
  18. Ratnam, J.V.; Behera, S.K.; Masumoto, Y.; Takahashi, K.; Yamagata, T. A simple regional coupled model experiment for summer-time climate simulation over southern Africa. Clim. Dyn. 2011, 39, 2207–2217. [Google Scholar] [CrossRef]
  19. Landman, S. A Multi-Model Ensemble System for Short-Range Weather Prediction in South Africa. Master’s Thesis, University of Pretoria, Pretoria, South Africa, 2012; 132p. [Google Scholar]
  20. Blamey, R.C.; Reason, C.J.C. Mesoscale convective complexes over southern Africa. J. Clim. 2012, 25, 753–766. [Google Scholar] [CrossRef]
  21. Houze, R.A., Jr. Cloud Dynamics; Academic Press: Cambridge, MA, USA, 1993; 573p. [Google Scholar]
  22. Houze, R.A., Jr. Mesoscale convective systems. Rev. Geophys. 2004, 42, RG4003. [Google Scholar] [CrossRef]
  23. Thurai, M.; Bringi, V.; Wolff, D.; Marks, D.; Pabla, C. Testing the drop-size distribution-based separation of stratiform and convective rain using radar and disdrometer data from a mid-latitude coastal region. Atmosphere 2021, 12, 392. [Google Scholar] [CrossRef]
  24. Maddox, R.A. Mesoscale convective complexes. Bull. Am. Meteorol. Soc. 1980, 61, 1374–1387. [Google Scholar] [CrossRef]
  25. Thoithi, W.; Blamey, R.; Reason, C. The contribution of mesoscale weather systems to extreme rainfall over the coast of southeastern Africa: The April 2022 event. In Proceedings of the XXVIII General Assembly of the International Union of Geodesy and Geophysics (IUGG), Berlin, Germany, 11–20 July 2023; GFZ German Research Centre for Geosciences: Potsdam, Germany, 2023. [Google Scholar]
  26. Lilly, D.K. The dynamical structure and evolution of thunderstorms and squall lines. Annu. Rev. Earth Planet. Sci. 1979, 7, 117–161. [Google Scholar] [CrossRef]
  27. Lu, Y.; Ozaki, M. 2015S-GS18-5 Research on Squall Line and the Effects on Offshore Operation During its Passage. In Conference Proceedings the Japan Society of Naval Architects and Ocean Engineers; The Japan Society of Naval Architects and Ocean Engineers: Tokyo, Japan, 2015; Volume 20, pp. 461–464. [Google Scholar]
  28. Yang, H.-L.; Xiao, H.; Guo, C.-W. Structure and evolution of a squall line in northern China: A case study. Atmos. Res. 2015, 158–159, 139–157. [Google Scholar] [CrossRef]
  29. Sousa, A.C.; Candido, L.A.; Satyamurty, P. Convective cloud clusters and squall lines along the coastal Amazon. Mon. Weather. Rev. 2021, 149, 3589–3608. [Google Scholar] [CrossRef]
  30. Rutledge, S.A.; MacGorman, D.R. Cloud-to-ground lightning activity in the 10–11 June 1985 mesoscale convective system observed during the Oklahoma–Kansas PRE-STORM project. Mon. Weather. Rev. 1988, 116, 1393–1408. [Google Scholar] [CrossRef]
  31. Gill, T. Initial Steps in the Development of a Comprehensive Lightning Climatology of South Africa. Master’s Thesis, University of the Witwatersrand, Johannesburg, South Africa, 2009. [Google Scholar]
  32. Panda, J.; Paul, D.; Sarkar, A.; Mukherjee, A.; Bhasi, I.; Tom, G.; Das, S.; Lohan, N.; Roy, D.; Kumar, S. Severe Storms in Changing Climate Scenario with a Distinctive Emphasis on South Asia and India. In Severe Storms: Anatomy, Early Warning Systems and Aftermath in Changing Climate Scenarios; Springer: Singapore, 2025; pp. 563–606. [Google Scholar]
  33. Dyson, L.L., Jr.; van Heerden, J.; Sumner, P.D. A baseline climatology of sounding--derived parameters associated with heavy rainfall over Gauteng, South Africa. Int. J. Clim. 2015, 35, 114–127. [Google Scholar] [CrossRef]
  34. Skamarock, W.C.; Klemp, J.B.; Dudhia, J.; Gill, D.O.; Barker, D.M.; Duda, M.G.; Huang, X.Y.; Wang, W.; Powers, J.G. A Description of the Advanced Research WRF Version 3; NCAR Technical Note; National Center for Atmospheric Research: Boulder, CO, USA, 2008; Volume 475, pp. 10–5065. [Google Scholar]
  35. Skamarock, W.C.; Klemp, J.B.; Dudhia, J.; Gill, D.O.; Liu, Z.; Berner, J.; Wang, W.; Powers, J.G.; Duda, M.G.; Barker, D.M.; et al. A Description of the Advanced Research WRF Version 4; NCAR Technical Note ncar/tn-556+str; National Center for Atmospheric Research: Boulder, CO, USA, 2019; p. 145. [Google Scholar]
  36. Ratna, S.B.; Ratnam, J.V.; Behera, S.K.; Rautenbach, C.J.D.; Ndarana, T.; Takahashi, K.; Yamagata, T. Performance assessment of three convective parameterization schemes in WRF for downscaling summer rainfall over South Africa. Clim. Dyn. 2014, 42, 2931–2953. [Google Scholar] [CrossRef]
  37. Maisha, T.R. The influence of topography and model grid resolution on extreme weather forecasts over South Africa. Master’s Thesis, University of Pretoria, Pretoria, South Africa, 2014. [Google Scholar]
  38. Ratnam, J.V.; Doi, T.; Landman, W.A.; Behera, S.K. Seasonal forecasting of onset of summer rains over South Africa. J. Appl. Meteorol. Clim. 2018, 57, 2697–2711. [Google Scholar] [CrossRef]
  39. Khain, A.P.; Beheng, K.D.; Heymsfield, A.; Korolev, A.; Krichak, S.O.; Levin, Z.; Pinsky, M.; Phillips, V.; Prabhakaran, T.; Teller, A.; et al. Representation of microphysical processes in cloud--resolving models: Spectral (bin) microphysics versus bulk parameterization. Rev. Geophys. 2015, 53, 247–322. [Google Scholar] [CrossRef]
  40. Morrison, H.; Milbrandt, J.A. Parameterization of cloud microphysics based on the prediction of bulk ice particle properties. Part I: Scheme description and idealized tests. J. Atmos. Sci. 2015, 72, 287–311. [Google Scholar] [CrossRef]
  41. Köcher, G.; Zinner, T.; Knote, C. Influence of cloud microphysics schemes on weather model predictions of heavy precipitation. Atmos. Chem. Phys. Discuss. 2023, 23, 6255–6269. [Google Scholar] [CrossRef]
  42. Gallus, W.A., Jr.; Pfeifer, M. Intercomparison of simulations using 5 WRF microphysical schemes with dual-polarization data for a German squall line. Adv. Geosci. 2008, 16, 109–116. [Google Scholar] [CrossRef]
  43. Morrison, H.; Thompson, G.; Tatarskii, V. Impact of cloud microphysics on the development of trailing stratiform precip-itation in a simulated squall line: Comparison of one-and two-moment schemes. Mon. Weather. Rev. 2009, 137, 991–1007. [Google Scholar] [CrossRef]
  44. Hong, S.-Y.; Lim, K.-S.S.; Lee, Y.-H.; Ha, J.-C.; Kim, H.-W.; Ham, S.-J.; Dudhia, J. Evaluation of the WRF double-moment 6-class microphysics scheme for precipitating convection. Adv. Meteorol. 2010, 2010, 707253. [Google Scholar] [CrossRef]
  45. Wu, D.; Dong, X.; Xi, B.; Feng, Z.; Kennedy, A.; Mullendore, G.; Gilmore, M.; Tao, W.-K. Impacts of microphysical scheme on convective and stratiform characteristics in two high precipitation squall line events. J. Geophys. Res. Atmos. 2013, 118, 11119–11135. [Google Scholar] [CrossRef]
  46. Fridlind, A.M.; Li, X.; Wu, D.; van Lier-Walqui, M.; Ackerman, A.S.; Tao, W.-K.; McFarquhar, G.M.; Wu, W.; Dong, X.; Wang, J.; et al. Derivation of aerosol profiles for MC3E convection studies and use in simulations of the 20 May squall line case. Atmos. Meas. Tech. 2017, 17, 5947–5972. [Google Scholar] [CrossRef]
  47. Karimkhani, M.; Azadi, M.; Meshkatee, A.H.; Saadatabadi, A.R. Evaluation of WRF microphysics schemes in the simulation of a squall line over IRAN using radar and reanalysis data. Nexo Rev. Cient. 2021, 34, 682–697. [Google Scholar] [CrossRef]
  48. Meroni, A.N.; Oundo, K.A.; Muita, R.; Bopape, M.-J.; Maisha, T.R.; Lagasio, M.; Parodi, A.; Venuti, G. Sensitivity of some African heavy rainfall events to microphysics and planetary boundary layer schemes: Impacts on localised storms. Q. J. R. Meteorol. Soc. 2021, 147, 2448–2468. [Google Scholar] [CrossRef]
  49. Bopape, M.-J.M.; Engelbrecht, F.A.; Maisha, R.; Chikoore, H.; Ndarana, T.; Lekoloane, L.; Thatcher, M.; Mulovhedzi, P.T.; Rambuwani, G.T.; Barnes, M.A.; et al. Rainfall Simulations of High-Impact Weather in South Africa with the Conformal Cubic Atmospheric Model (CCAM). Atmosphere 2022, 13, 1987. [Google Scholar] [CrossRef]
  50. Lin, Y.L.; Farley, R.D.; Orville, H.D. Bulk parameterization of the snow field in a cloud model. J. Appl. Meteorol. Climatol. 1983, 22, 1065–1092. [Google Scholar] [CrossRef]
  51. Thompson, G.; Rasmussen, R.M.; Manning, K. Explicit forecasts of winter precipitation using an improved bulk microphysics scheme. Part I: Description and sensitivity analysis. Mon. Weather. Rev. 2004, 132, 519–542. [Google Scholar] [CrossRef]
  52. Hong, S.Y.; Dudhia, J.; Chen, S.H. A revised approach to ice microphysical processes for the bulk parameterization of clouds and precipitation. Mon. Weather. Rev. 2004, 132, 103–120. [Google Scholar] [CrossRef]
  53. Lim, K.-S.S.; Hong, S.-Y. Development of an effective double-moment cloud microphysics scheme with prognostic cloud condensation nuclei (CCN) for weather and climate models. Mon. Weather. Rev. 2010, 138, 1587–1612. [Google Scholar] [CrossRef]
  54. Fan, J.; Han, B.; Varble, A.; Morrison, H.; North, K.; Kollias, P.; Chen, B.; Dong, X.; Giangrande, S.E.; Khain, A.; et al. Cloud—Resolving model intercomparison of an MC3E squall line case: Part I—Convective updrafts. J. Geophys. Res. Atmos. 2017, 122, 9351–9378. [Google Scholar] [CrossRef]
  55. Han, B.; Fan, J.; Varble, A.; Morrison, H.; Williams, C.R.; Chen, B.; Dong, X.; Giangrande, S.E.; Khain, A.; Mansell, E.; et al. Cloud—Resolving model intercomparison of an MC3E squall line case: Part II. Stratiform precipitation properties. J. Geophys. Res. Atmos. 2019, 124, 1090–1117. [Google Scholar] [CrossRef]
  56. McCumber, M.; Tao, W.-K.; Simpson, J.; Penc, R.; Soong, S.-T. Comparison of ice-phase microphysical parameterization schemes using numerical simulations of tropical convection. J. Appl. Meteorol. Clim. 1991, 30, 985–1004. [Google Scholar] [CrossRef]
  57. Carte, A.E.; Held, G. Variability of hailstorms on the South African Plateau. J. Appl. Meteorol. 1978, 17, 365–373. [Google Scholar] [CrossRef]
  58. Gijben, M. The lightning climatology of South Africa. S. Afr. J. Sci. 2012, 108, 1–10. [Google Scholar] [CrossRef]
  59. van Schalkwyk, L.; Blamey, R.C.; Dyson, L.L.; Reason, C.J.C. A climatology of drylines in the interior of subtropical southern Africa. J. Clim. 2022, 35, 6411–6430. [Google Scholar] [CrossRef]
  60. Liesker, C.G.; Dyson, L.L.; Becker, E.H. Characteristics of warm season left-moving supercells over the Highveld of South Africa. Atmos. Res. 2024, 300, 107234. [Google Scholar] [CrossRef]
  61. Tesfaye, M.; Sivakumar, V.; Botai, J.; Mengistu Tsidu, G. Aerosol climatology over South Africa based on 10 years of Mul-tiangle Imaging Spectroradiometer (MISR) data. J. Geophys. Res. 2011, 116, D20216. [Google Scholar] [CrossRef]
  62. D’ABreton, P.C.; Lindesay, J.A. Water vapour transport over southern Africa during wet and dry early and late summer months. Int. J. Clim. 1993, 13, 151–170. [Google Scholar] [CrossRef]
  63. SAWS Caelum. Notable Weather Related Disasters; South African Weather Service: Pretoria, South Africa, 2023. [Google Scholar]
  64. Hersbach, H.; Bell, B.; Berrisford, P.; Hirahara, S.; Horányi, A.; Muñoz-Sabater, J.; Nicolas, J.; Peubey, C.; Radu, R.; Schepers, D.; et al. The ERA5 global reanalysis. Q. J. R. Meteorol. Soc. 2020, 146, 1999–2049. [Google Scholar] [CrossRef]
  65. Dee, D.P.; Uppala, S.M.; Simmons, A.J.; Berrisford, P.; Poli, P.; Kobayashi, S.; Andrae, U.; Balmaseda, M.A.; Balsamo, G.; Bauer, P.; et al. The ERA-Interim reanalysis: Configuration and performance of the data assimilation system. Q. J. R. Meteorol. Soc. 2011, 137, 553–597. [Google Scholar] [CrossRef]
  66. Steinkopf, J.; Engelbrecht, F. Verification of ERA5 and ERA-Interim precipitation over Africa at intra-annual and interannual timescales. Atmos. Res. 2022, 280, 106427. [Google Scholar] [CrossRef]
  67. Riemann-Campe, K.; Fraedrich, K.; Lunkeit, F. Global climatology of convective available potential energy (CAPE) and convective inhibition (CIN) in ERA-40 reanalysis. Atmos. Res. 2009, 93, 534–545. [Google Scholar] [CrossRef]
  68. Yavuz, V. An analysis of atmospheric stability indices and parameters under air pollution conditions. Environ. Monit. Assess. 2023, 195, 934. [Google Scholar] [CrossRef]
  69. Hong, S.Y.; Lim, J.O.J. The WRF single-moment 6-class microphysics scheme (WSM6). Asia-Pac. J. Atmos. Sci. 2006, 42, 129–151. [Google Scholar]
  70. Zhang, C.; Wang, Y.; Hamilton, K. Improved representation of boundary layer clouds over the southeast Pacific in ARW-WRF using a modified Tiedtke cumulus parameterization scheme. Mon. Weather. Rev. 2011, 139, 3489–3513. [Google Scholar] [CrossRef]
  71. Iacono, M.J.; Delamere, J.S.; Mlawer, E.J.; Shephard, M.W.; Clough, S.A.; Collins, W.D. Radiative forcing by long-lived greenhouse gases: Calculations with the AER radiative transfer models. J. Geophys. Res. Atmos. 2008, 113, D13103. [Google Scholar] [CrossRef]
  72. Huang, M.; Mielikainen, J.; Huang, B.; Chen, H.; Huang, H.-L.A.; Goldberg, M.D. Development of efficient GPU parallelization of WRF Yonsei University planetary boundary layer scheme. Geosci. Model. Dev. 2015, 8, 2977–2990. [Google Scholar] [CrossRef]
  73. Sušelj, K.; Sood, A. Improving the Mellor–Yamada–Janjić parameterization for wind conditions in the marine planetary boundary layer. Bound.-Layer. Meteorol. 2010, 136, 301–324. [Google Scholar] [CrossRef]
  74. Steeneveld, G.-J.; Peerlings, E.E. Mesoscale model simulation of a severe summer thunderstorm in the Netherlands: Performance and uncertainty assessment for parameterised and resolved convection. Atmosphere 2020, 11, 811. [Google Scholar] [CrossRef]
  75. Tao, W.K.; Wu, D.; Lang, S.; Chern, J.D.; Peters-Lidard, C.; Fridlind, A.; Matsui, T. High-resolution NU-WRF simulations of a deep convective-precipitation system during MC3E: Further improvements and comparisons between Goddard microphysics schemes and observations. J. Geophys. Res. Atmos. 2016, 121, 1278–1305. [Google Scholar] [CrossRef] [PubMed]
  76. Bopape, M.-J.M.; Cardoso, H.; Plant, R.S.; Phaduli, E.; Chikoore, H.; Ndarana, T.; Khalau, L.; Rakate, E. Sensitivity of Tropical Cyclone Idai simulations to cumulus parametrization schemes. Atmosphere 2021, 12, 932. [Google Scholar] [CrossRef]
  77. Somses, S.; Bopape, M.-J.M.; Ndarana, T.; Fridlind, A.; Matsui, T.; Phaduli, E.; Limbo, A.; Maikhudumu, S.; Maisha, R.; Rakate, E. Convection parametrization and multi-nesting dependence of a heavy rainfall event over Namibia with Weather Research and Forecasting (WRF) model. Climate 2020, 8, 112. [Google Scholar] [CrossRef]
  78. Mulovhedzi, P.T.; Rambuwani, G.T.; Bopape, M.-J.; Maisha, R.; Monama, N. Model inter-comparison for short-range forecasts over the southern African domain. S. Afr. J. Sci. 2021, 117, 93–104. [Google Scholar] [CrossRef]
  79. Nooni, I.K.; Tan, G.; Hongming, Y.; Saidou Chaibou, A.A.; Habtemicheal, B.A.; Gnitou, G.T.; Lim Kam Sian, K.T. Assessing the performance of WRF Model in simulating heavy precipitation events over East Africa using satellite-based precipitation product. Remote. Sens. 2022, 14, 1964. [Google Scholar] [CrossRef]
  80. Maisha, T.; Mulovhedzi, P.T.; Rambuwani, G.T.; Makgati, L.N.; Barnes, M.; Lekoloane, L.; Engelbrecht, F.A.; Ndarana, T.; Mbokodo, I.L.; Xulu, N.G.; et al. The Development of a Locally Based Weather and Climate Model in Southern Africa; Water Research Commission: Pretoria, South Africa, 2025; pp. 1–197. [Google Scholar]
  81. Litta, A.J.; Mary Ididcula, S.; Mohanty, U.C.; Kiran Prasad, S. Comparison of thunderstorm simulations from WRF-NMM and WRF-ARW models over east indian region. Sci. World J. 2012, 2012, 951870. [Google Scholar] [CrossRef]
  82. Pyle, M.E.; Brill, K.F. A comparison of two methods for bias correcting precipitation skill scores. Weather. Forecast. 2019, 34, 3–13. [Google Scholar] [CrossRef]
  83. Li, J.; Lu, C.; Chen, J.; Zhou, X.; Yang, K.; Xu, X.; Wu, X.; Zhu, L.; He, X.; Wu, S.; et al. The combined effects of convective entrainment and orographic drag on precipitation over the Tibetan Plateau. Sci. China Earth Sci. 2025, 68, 2615–2630. [Google Scholar] [CrossRef]
  84. News24. MAP: Severe Thunderstorm Headed for Gauteng, Motorists Warned of Flooding, 2017. Available online: https://www.news24.com/map-severe-storm-headed-for-gauteng-motorists-warned-of-flooding-20171021 (accessed on 26 February 2025).
  85. The Guardian. South Africa: More than 950 Trapped Gold Miners Brought to Surface, 2018. Available online: https://www.theguardian.com/world/2018/feb/02/south-africa-gold-miners-trapped-underground-power-sibanye-stillwater (accessed on 19 February 2023).
  86. Ndarana, T.; Rammopo, T.S.; Reason, C.J.; Bopape, M.-J.; Engelbrecht, F.; Chikoore, H. Two types of ridging South Atlantic Ocean anticyclones over South Africa and the associated dynamical processes. Atmos. Res. 2022, 265, 105897. [Google Scholar] [CrossRef]
  87. Goulet, L. Bow Echoes: Conceptual Schemes and European Relevance. The European Forecaster, 2015, No. 20, 22–31. Available online: https://www.euroforecaster.org/newsletter20/meteofr2 (accessed on 28 April 2025).
  88. Browning, K.A.; Ludlam, F.H. Airflow in convective storms. Q. J. R. Meteorol. Soc. 1962, 88, 117–135. [Google Scholar] [CrossRef]
  89. Johns, R.H.; Doswell, C.A., III. Severe local storms forecasting. Weather. Forecast. 1992, 7, 588–612. [Google Scholar] [CrossRef]
  90. Miao, J.-E.; Yang, M.-J. The Impacts of Midlevel Moisture on the Structure, Evolution, and Precipitation of Afternoon Thunderstorms: A Real-Case Modeling Study at Taipei on 14 June 2015. J. Atmos. Sci. 2022, 79, 1837–1857. [Google Scholar] [CrossRef]
  91. Sherburn, K.D.; Parker, M.D.; King, J.R.; Lackmann, G.M. Composite environments of severe and nonsevere high-shear, low-CAPE convective events. Weather. Forecast. 2016, 31, 1899–1927. [Google Scholar] [CrossRef]
  92. Wade, A.R.; Parker, M.D. Dynamics of simulated high-shear, low-CAPE supercells. J. Atmos. Sci. 2021, 78, 1389–1410. [Google Scholar] [CrossRef]
  93. Watson, D.F. A refinement of inverse distance weighted interpolation. Geoprocessing 1985, 2, 315–327. [Google Scholar]
  94. Kalnay, E.; Kanamitsu, M.; Kistler, R.; Collins, W.; Deaven, D.; Gandin, L.; Iredell, M.; Saha, S.; White, G.; Woollen, J.; et al. The NCEP/NCAR 40-year reanalysis project. In Renewable Energy; Routledge: London, UK, 2018; pp. Vol1_146–Vol1_194. [Google Scholar]
  95. Gelaro, R.; McCarty, W.; Suárez, M.J.; Todling, R.; Molod, A.; Takacs, L.; Randles, C.A.; Darmenov, A.; Bosilovich, M.G.; Reichle, R.; et al. The Modern-Era Retrospective Analysis for Research and Applications, Version 2 (MERRA-2). J. Clim. 2017, 30, 5419–5454. [Google Scholar] [CrossRef]
  96. Grobler, E.J.M.L. Die Midsomerdroogte in the Sentrale Dele Van Die Somerreenvalgebied Van Suid Afrika. Master’s Thesis, University of Stellenbosch, Stellenbosch, South Africa, 1993. [Google Scholar]
  97. Mengistu, M.G.; Olivier, C.; Botai, J.O.; Adeola, A.M.; Daniel, S. Spatial and temporal analysis of the mid-summer dry spells for the summer rainfall region of South Africa. Water SA 2021, 47, 76–87. [Google Scholar] [CrossRef]
  98. Pinto, I.; Lennard, C.; Tadross, M.; Hewitson, B.; Dosio, A.; Nikulin, G.; Panitz, H.-J.; Shongwe, M.E. Evaluation and projections of extreme precipitation over southern Africa from two CORDEX models. Clim. Chang. 2016, 135, 655–668. [Google Scholar] [CrossRef]
  99. Archer, E.; Engelbrecht, F.; Hänsler, A.; Landman, W.; Tadross, M.; Helmschrot, J. Seasonal prediction and regional climate projections for southern Africa. Biodivers. Ecol. 2018, 6, 14–21. [Google Scholar] [CrossRef]
  100. Jury, M.R. South Africa’s future climate: Trends and projections. In The Geography of South Africa: Contemporary Changes and New Directions; Springer: Cham, Switzerland, 2019; pp. 305–312. [Google Scholar] [CrossRef]
  101. Mbokodo, I.L.; Bopape, M.-J.M.; Burger, R.P.; Fridlind, A. WRF simulations of squall line features over the South African Highveld. In Proceedings of the 37th Annual conference of South African Society for Atmospheric Sciences, Cape Town, South Africa, 30 October–3 November 2023. [Google Scholar]
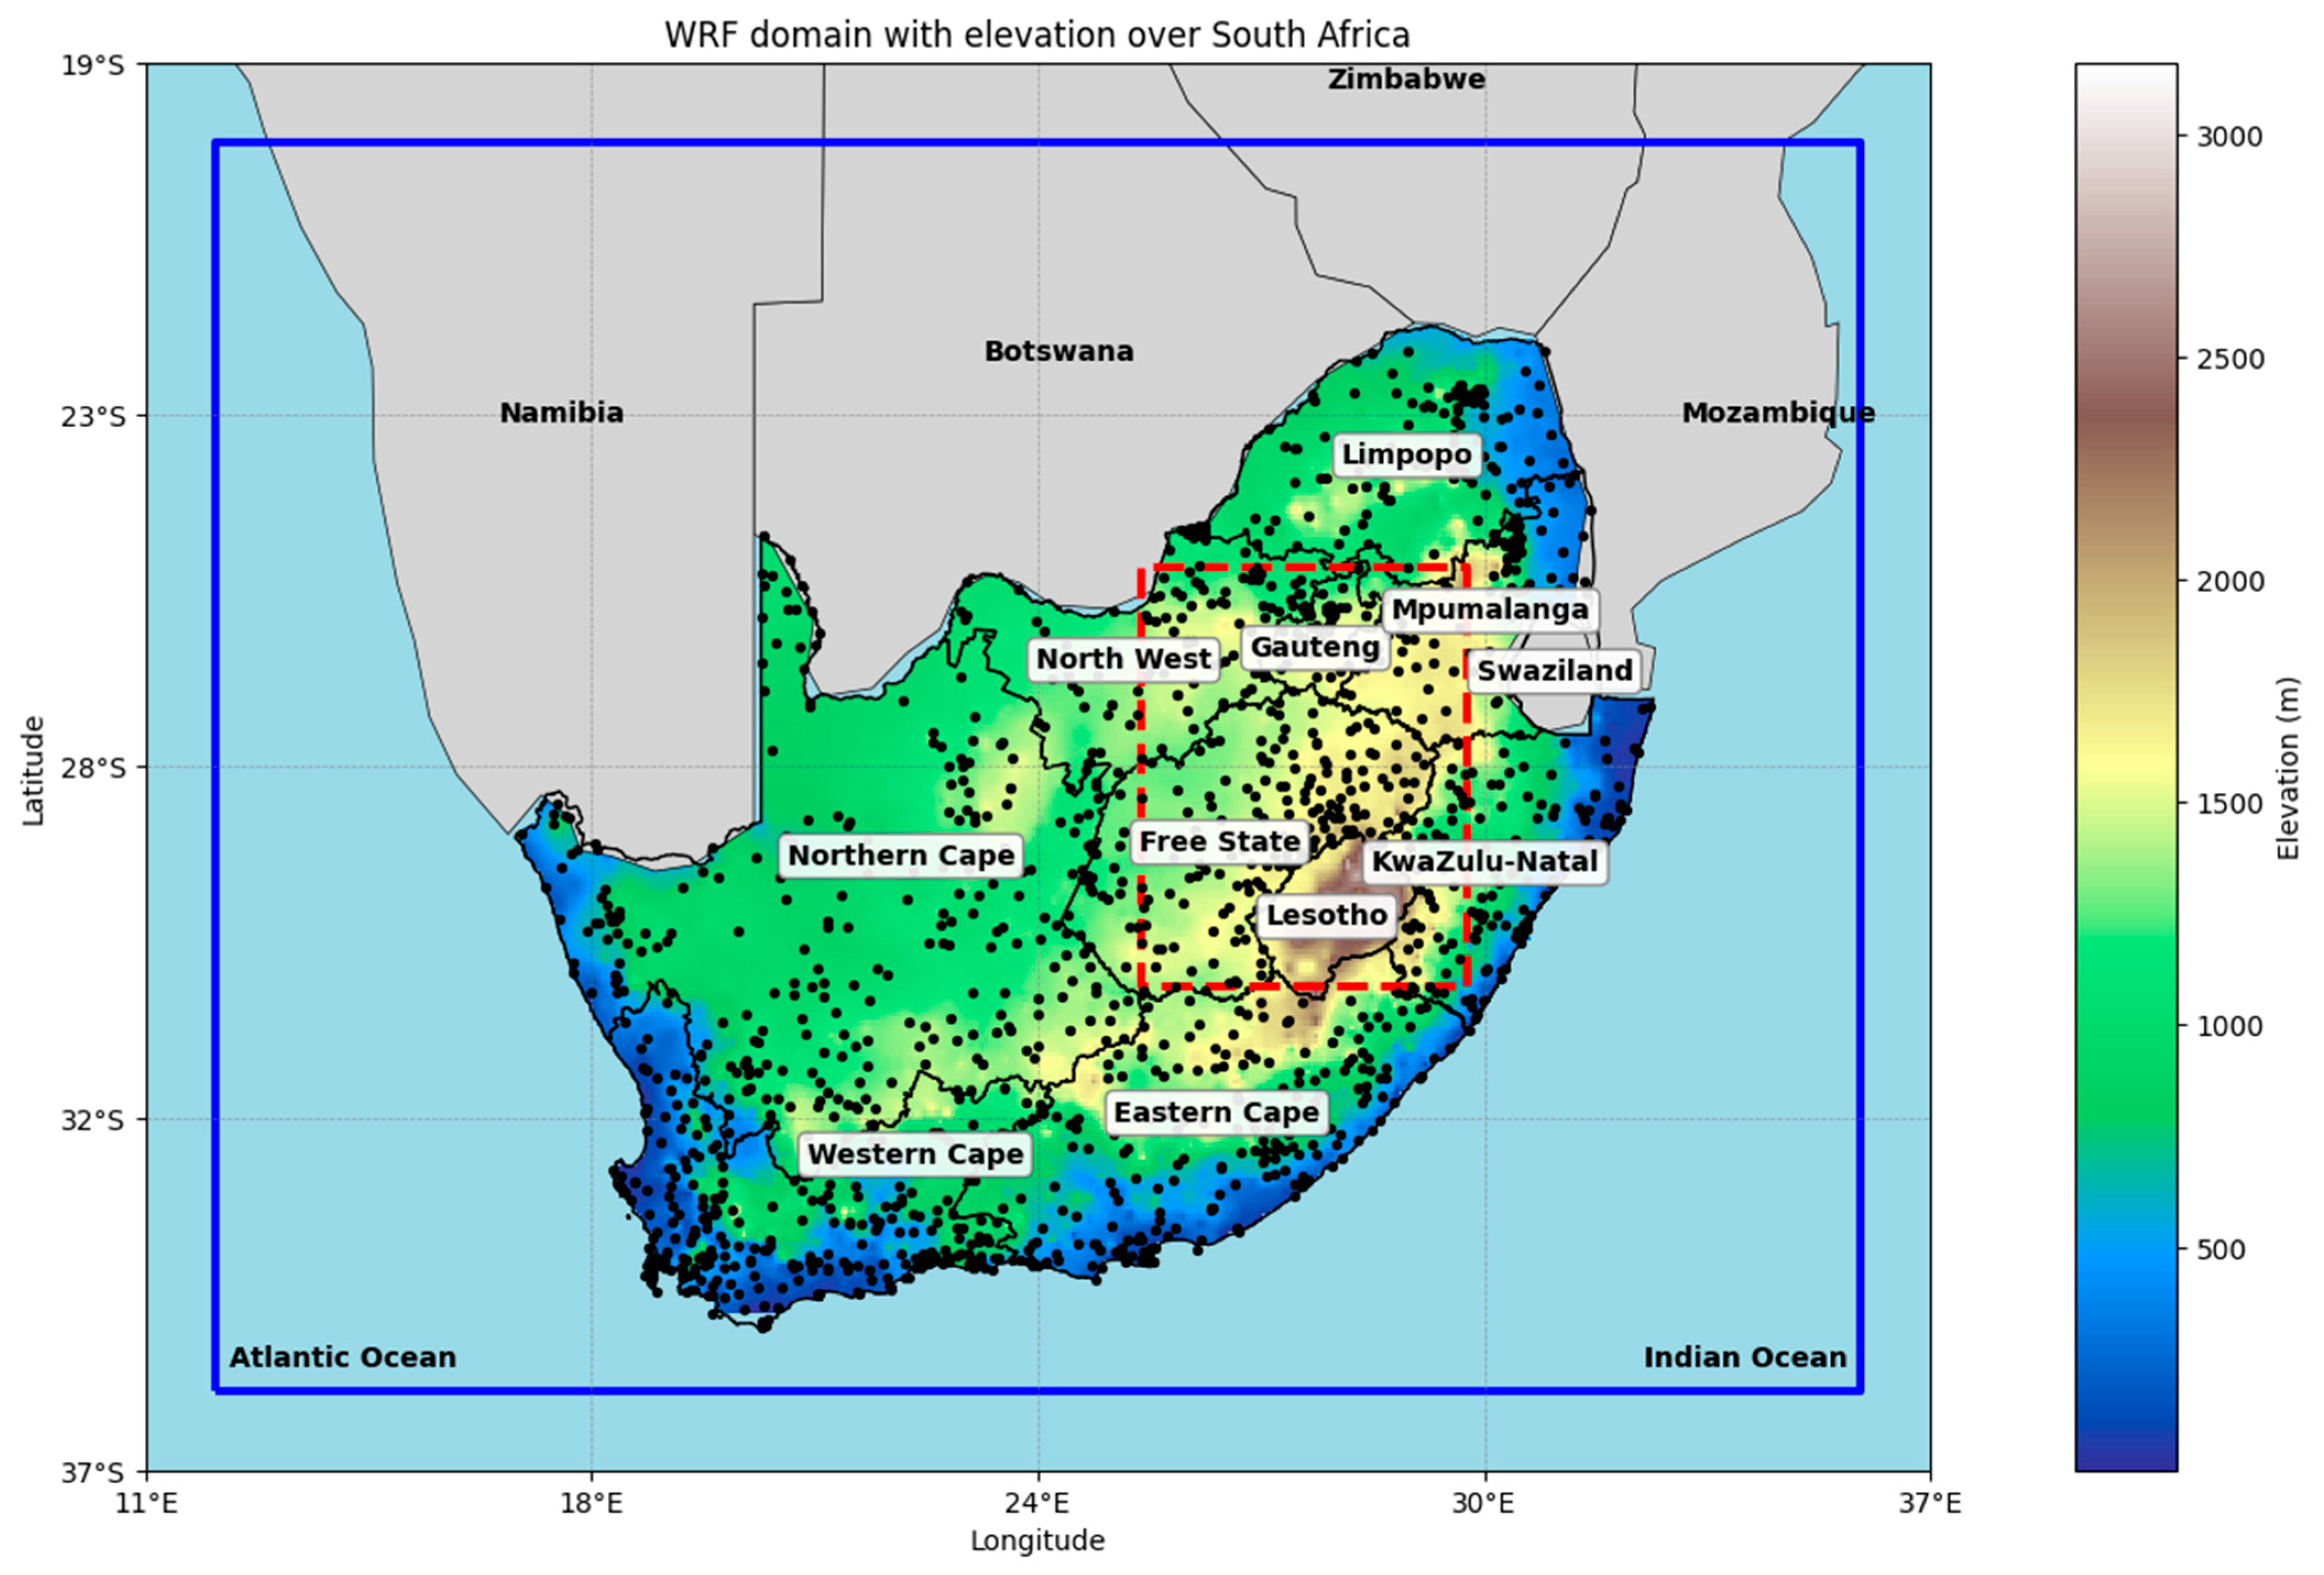
Figure 1. Topographical map of South Africa with elevation in metres. The red dashed line indicates the location of the South African Highveld, while the black dots show location of South African Weather Service (SAWS) stations, which are used for rainfall distribution for the two squall line thunderstorm events. The blue box shows the WRF simulation domain.
Atmosphere 16 01055 g001
Figure 2. Mean sea level pressure (MSLP, shaded) and 500 hPa geopotential height (GPH, contours) during the (a) 21 October 2017 at 12:00 UTC and (b) 31 January 2018/1 February 2018 squall lines at 23:00 UTC.
Atmosphere 16 01055 g002
Figure 3. The SAWS surface weather charts on (a) the 21 of October 2017 and (b) 31 of January 2018 for 14:00 South African Standard Time (SAST). The letters ‘L’ and ‘H’ on the charts indicate low pressure and high-pressure systems respectively.
Atmosphere 16 01055 g003
Figure 4. (a) Radar reflectivity and cross section at 14:42 UTC and (b) forecast speed for the squall line event of 21 October 2017 squall line at 14:54 UTC. (c) Radar reflectivity, cross section and (d) forecast speed at 02:30 UTC for the squall line event of 1 February 2018. SAWS radar reflectivity data composites are analyzed to track the storm movement.
Atmosphere 16 01055 g004
Figure 5. ERA5 SLP (a) and WRF SLP (b) on 21 October 2017. (c) ERA5 SLP and (d) WRF SLP on 31 January 2018. The grey box indicates the South African Highveld. The letters ‘L’ and ‘H’ indicate low pressure and high-pressure systems respectively.
Atmosphere 16 01055 g005
Figure 6. Relative humidity (RH, 0–100%) and horizontal wind vectors at 800 hPa and 500 hPa for two cases over South Africa. Right panels (ad): 21 October 2017 (a) ERA5 800 hPa, (b) WRF 800 hPa, (c) ERA5 500 hPa, (d) WRF 500 hPa. Left panels (eh): 31 January 2018 (e) ERA5 800 hPa, (f) WRF 800 hPa, (g) ERA5 500 hPa, (h) WRF 500 hPa. The red box highlights the South African Highveld. Both pressure levels are shown to illustrate the vertical structure and support of storm development.
Atmosphere 16 01055 g006
Figure 7. (a) ERA5 2 m dewpoint (°C) and (b) WRF 2 m dewpoint on 21 Oct 2017 at 12: 00 UTC. (c) ERA5 2 m dewpoint (°C) and (d) WRF 2 m dewpoint on 31 Jan 2018 at 23: 00 UTC. The red box indicates the South African Highveld, while the green arrow in (a,b) indicates the location of the dryline.
Atmosphere 16 01055 g007
Figure 8. Atmospheric instabilities: ERA5 (a) CAPE (J kg−1), (b) K (°C), (c) TT (°C), and WRF simulated (d) CAPE (J kg−1), (e) K (°C), (f) TT (°C) for the 21 October 2017 squall line event at 12: 00 UTC. Atmospheric instabilities: ERA5 (g) CAPE (J kg−1), (h) K (°C), (i) TT (°C), and WRF simulated (j) CAPE (J kg−1), (k) K (°C), (l) TT (°C) for the 31 January 2018 squall line event at 23: 00 UTC. The grey box indicates the South African Highveld.
Atmosphere 16 01055 g008
Figure 9. (a) SAWS maximum reflectivity for 21 October 2017 at 15:00 UTC, (b) for 21 October 2017 at 18:00 UTC, (c) for 1 February 2018 at 03:00 UTC. WRF maximum reflectivity (d) for 21 October 2017 at 15:00, (e) for 21 October 2017 at 18:00 UTC, and (f) for 1 February 2018 at 03:00 UTC. The grey box indicates the South African Highveld.
Atmosphere 16 01055 g009
Figure 10. (a) SAWS 24 h rainfall, (b) ERA5 24 h rainfall, and (c) WRF 24 h rainfall on 21 October 2017. (d) SAWS 24 h rainfall, (e) ERA5 24 h rainfall, and (f) and WRF 24 h rainfall on 31 December 2018. The black box indicates the South African Highveld.
Atmosphere 16 01055 g010
Figure 11. (a) ERA5 24 h convective precipitation (CP) rainfall, (b) WRF 24 h CP rainfall, (c) ERA5 24 h large scale precipitation (LSP), and (d) WRF 24 h LSP on 21 October 2017. The box indicates the South African Highveld.
Atmosphere 16 01055 g011
Figure 12. (a) ERA5 24 h convective precipitation (CP) rainfall, (b) WRF 24 h CP rainfall, (c) ERA5 24 h large scale precipitation (LSP), and (d) WRF 24 h LSP on 1 February 2018. The box indicates the South African Highveld.
Atmosphere 16 01055 g012
Table 1. Rainfall verification statistics (RMSE, COE, and r) during two squall line events over the South African Highveld.
Event DateRMSE (mm)COEr
21 October 20171.9598550.7033130.967335
1 February 201812.19444−0.614670.961866
Table 2. Rainfall verification results using the BIAS and TS methods for two squall line events over the South African Highveld.
Event DateHitsMissesFalse AlarmsBiasTS
21 October 20170.3600.241.670.6
1 February 20180.0800.527.50.13
Disclaimer/Publisher’s Note: The statements, opinions and data contained in all publications are solely those of the individual author(s) and contributor(s) and not of MDPI and/or the editor(s). MDPI and/or the editor(s) disclaim responsibility for any injury to people or property resulting from any ideas, methods, instructions or products referred to in the content.