Abstract
Straight-edge thin plate orifices (90° half-angle) are used as the focusing elements in most aerodynamic lenses. They are simple to fabricate and have fewer boundary-layer effects as compared to other geometries, such as capillaries and converging and diverging orifices. This study presents the first systematic evaluation of lens focusing performance across a wide range of half-angles. Computational fluid dynamics (CFD) simulations and Lagrangian particle tracking were used to investigate aerodynamic focusing of converging, straight-edge, and diverging orifices with half-angles ranging from 30° to 150° at two Reynolds numbers (50 and 100) and three Mach numbers (0.03, 0.1, and 0.3). The results show that the optimal Stokes number for near-axis particles has small differences between the straight-edge orifice and the converging or diverging orifices, indicating small changes in focusing behavior for different orifice geometries. This study further optimized exit nozzle dimensions to enhance focusing. Several nozzle radial aspect ratios and nozzle constriction lengths were simulated in a two-dimensional axisymmetric domain. The optimal geometry was identified for generating the least divergent particle beams and maintaining the highest transmission efficiencies for 10 nm–10 μm particles. Identifying such a nozzle geometry is critical for future designs of more efficient aerodynamic focusing lenses.
1. Introduction
Atmospheric aerosols play a key role in air quality, climate, and human health. Aerosol mass spectrometers (AMS) are widely used to measure atmospheric aerosols’ chemical and physical properties. A key component of an AMS system is the aerodynamic focusing lens inlet (AFL), which uses a series of focusing orifices (lenses) to generate a concentrated, low-diverging beam of particles for more efficient sizing, collection, and/or ionization in the AMS [1,2,3,4].
A number of lens geometries, such as straight-edge thin plate orifices, capillaries, converging orifices, and converging–diverging orifices, have been used for generating molecular or aerosol beams [5,6,7,8]. The most common lenses used in AFLs are straight-edge thin plate orifices, favored for their strong focusing performance, minimal boundary effects, and ease of fabrication and integration into an AFL [9,10,11,12,13,14].
Fernández de la Mora et al. [15,16] examined the optimal Stokes number () for which particles are perfectly focused along the axis as a function of half-angle, , for several lens geometries, i.e., capillary ( = 0°), converging orifice (0° < < 90°), straight-edge thin plate orifice ( = 90°), and diverging orifice (90° < < 180°) (see Figure 1). They found that decreased with increasing α, indicating that diverging orifices might better focus smaller particles. To the best of our knowledge, no numerical or experimental studies have examined particle focusing using a diverging orifice, other than those by Fernández de la Mora et al. [15,16], who did not show detailed flow fields or explain why diverging orifices would have a smaller . Middha et al. [17] simulated particle focusing in a sonic jet through a nozzle consisting of a cap and a cone, with α ranging from 90° to 130°. They found that a diverging sonic nozzle had a smaller than thin plate orifices. Because the low inertia and high diffusivity are key barriers to effectively focusing nanoparticles [18,19,20], lenses with smaller enable smaller particles to be optimally focused. They also allow the lenses to operate at higher pressures to reduce diffusion broadening. Therefore, diverging orifices can potentially improve the focusing of particles with aerodynamic diameters of <30 nm in subsonic, low-Reynolds number (Re) conditions [19]. However, in a subsonic (Mach number, Ma < 0.3) and low-Re (200) flow, it is possible that the flow near the edges where the orifice contacts the wall stagnates and traps particles; the viscous boundary layer around the walls might make the flow velocity non-uniform. This demonstrates the significance of further investigating the flow field and particle trajectories through diverging orifices.
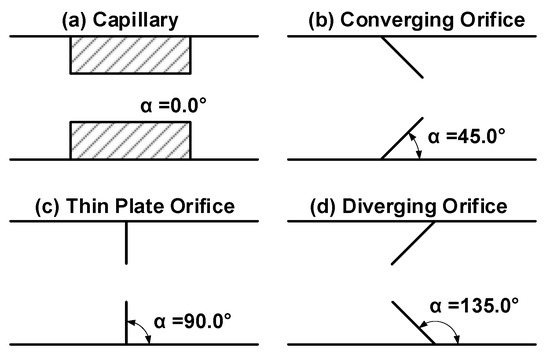
Figure 1.
Examples of orifices with different values of .
The AFL’s accelerating exit nozzle is also a critical part, as it controls the AFL’s internal pressure and accelerates the particles into the vacuum chamber. The nozzle often has an aperture that is smaller in diameter than the lenses; thus, it may focus smaller particles and defocus larger particles. The higher at the nozzle may generate turbulence and disperse the particle beam. Liu et al. [10] examined the particle trajectories of a step nozzle consisting of a cylindrical constriction followed by a thin plate orifice. They found a specific combination of step length, step diameter, orifice diameter, and flow rate that generated the least particle divergence. Zhang et al. [21,22] confirmed that this design performed the best among several different geometries. They also found that a smooth converging nozzle used in the AMS had higher divergence than Liu’s design for particles <50 nm [23]. Many AFL designs emphasize the focusing by lenses, with little attention paid to potential focusing or defocusing at the exit nozzle. A proper design of a step nozzle would refocus larger particles, which tend to become defocused in the last lenses and the exit nozzle. Furthermore, a short capillary instead of a thin plate orifice might reduce the beam spread in the vacuum, as capillaries offer smaller divergence angles for wider particle size ranges [3].
To address these knowledge gaps, single aerodynamic focusing lenses with varying values of α are numerically modeled using computational fluid dynamics (CFD) and Lagrangian particle tracking to investigate whether converging or diverging lenses improve particle focusing. Additionally, the behavior of particles traveling through step accelerating nozzles with varying dimensions of interest is numerically studied to find an optimal design that yields the lowest beam divergence and highest transmission efficiency for 10 nm–10 μm particles.
2. Model Descriptions and Methods
2.1. Converging and Diverging Lens Model
Flow through a single lens with different values of α was simulated with 2D axisymmetric models using the finite volume method (FVM) in ANSYS FLUENT (R2 2022) [24]. As shown in Figure 2, this model consists of two spacer regions separated by a 0.3 mm thick lens with an orifice (lens) radius of 1 mm. The spacers have a length of 60 mm and a radius of 5 mm. Nine values of α (30°, 45°, 60°, 75°, 90°, 105°, 120°, 135°, and 150°) were simulated for two of Re (50 and 100) and three of Ma (0.03, 0.1, and 0.3).
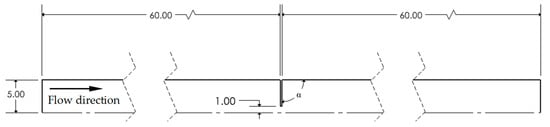
Figure 2.
Two-dimensional (2D) axisymmetric model used for the divergent lens study. Units in millimeters.
The boundary conditions consist of a fixed mass flow rate at the inlet and a fixed pressure at the outlet. Wall surface roughness is neglected, assuming perfectly smooth walls. More details on the boundary conditions are provided in Supplementary Materials S1. Given the low considered for the simulations, a steady-state laminar viscous flow model was employed. The effect of gravity was assumed to be negligible. The air density was calculated using the ideal gas law, and Sutherland’s model was used for air viscosity [25]. Particles were modeled as perfect spheres of liquid water droplets with a constant density of . A user-defined function was used to calculate the drag force based on local flow conditions [9,19]. Particles’ Brownian motion was not accounted for [11]. Particles were considered to be trapped when the distance between the particle center and the wall was smaller than the particle radius.
A mesh sensitivity study was conducted with four meshes with increasing rectangular cell counts, as detailed in Supplementary Materials S2, based on [26]. The mesh consisting of ~50,000 cells was deemed sufficient, as the results were independent from further refinement.
Two criteria were used to evaluate lens performance: the particle contraction factor, ; and . , defined as the ratio of the particle’s radial position () downstream of the lens to its initial radial position () upstream of the lens, indicating how the lens alters the trajectory of a particle. < 1 indicates focusing, while > 1 indicates defocusing. Particles with = 0 are perfectly focused on the axis, and their corresponding particle Stokes number () is defined as . is the ratio of a particle’s relaxation time, , multiplied by the average flow velocity () over the lens diameter () [9,11]:
where and are the densities of particles and air upstream of the lens, respectively, is the mass flow rate of air, is the particle diameter, is the air viscosity, Cc is the Cunningham correction factor with ), Knp is the particle Knudsen number with , and is the mean free path of the gas upstream of the lens.
Due to boundary-layer effects, particle trajectories depend on their initial radial locations. Five radial locations (∆ = 0.1, 0.3, 0.5, 0.7, and 0.9), defined as the ratio of the particle’s initial radial location () to the radius of the spacer ( upstream of the lens, were investigated. A total of 283 particles, ranging in diameters from 1 nm to 10 μm, were injected at each radial location to evaluate and .
2.2. Nozzle Model
To evaluate the performance of a step nozzle in focusing particles, a 2D axisymmetric model of an exit nozzle with an expansion chamber was generated and simulated using the FVM in ANSYS FLUENT (R2 2022) [24]. Figure 3 shows a schematic of this model, which consists of a spacer with a length of 60 mm and a radius of 5 mm, a capillary step with a length of Lt and a step-to-spacer radius ratio of Rt, an accelerating nozzle with a thickness of Ln and radius of 1.5 mm, and a vacuum expansion chamber. Air enters the inlet of the spacer at a fixed mass flow rate of kg/s and contracts and accelerates through the step and nozzle into a vacuum expansion chamber. A fixed pressure of 1 Pa was applied on the outlet boundaries of the vacuum expansion chamber to simulate the particle-sizing region in an AMS. The flow was assumed to be steady-state in the continuum regime, so gas rarefaction effects were not considered. The same air and particle properties used for the converging/diverging lens simulations (see Section 2.1) were applied in this model. A mesh sensitivity study (in Supplementary Materials S2) was also conducted for this model and showed that a mesh of approximately 7 million rectangular cells was sufficient for the independence of the results from further mesh refinements.
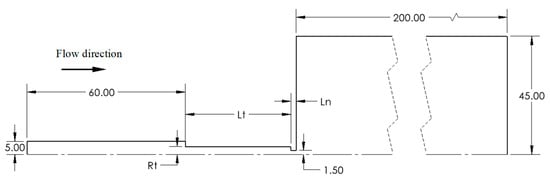
Figure 3.
Two-dimensional (2D) axisymmetric model used for nozzle simulations. Units in millimeters.
Figure 3 shows the three variable dimensions of interest of the step nozzle design: thickness of the nozzle (), length of step (, and ratio of the step radius to the spacer radius (). Six (i.e., 0.254, 0.5, 1, 2, 5, and 10 mm), nine (i.e., 10, 20, 30, 40, 50, 60, 70, 80, and 90 mm), and five (i.e., 0.4, 0.5, 0.6, 0.7, and 0.8) values were investigated. All of the other dimensions, including the spacer and vacuum expansion chamber diameters and lengths, remained fixed. To systematically evaluate the particle focusing performance, was first varied with a fixed value of = 10 mm and = 0.6. Once the optimal value was determined, it was fixed, and then was varied with the same fixed value of = 0.6. In a similar manner, once the optimal value was identified, it was fixed as well, and was finally varied. This process ensured that the most optimal combination of all three dimensions was determined.
Two criteria were used to evaluate the AFL nozzle performance: particle divergence angle in the expansion chamber, and transmission efficiency. The particle divergence angle is defined as the terminal departure angle of a particle exiting the nozzle outlet. It is calculated as the inverse tangent of the particle’s radial velocity () divided by its axial velocity () component:
where = 0 indicates that the particle travels parallel to the nozzle’s axis. The closer the divergence angle is to zero, the better the performance of the nozzle. To evaluate , 500 unique particles, ranging from 10 nm to 10 µm, were injected at a single near-axis radial location, Δ = 0.1. Particle velocities were measured at 30 mm downstream of the nozzle exit, after the particles had reached their terminal trajectory in the vacuum expansion region.
Transmission efficiency, , is defined as the ratio of the number of particles reaching the outlet of the AFL nozzle () to that injected at the inlet ():
Perfect transmission efficiency is achieved when all injected particles reach the nozzle outlet, i.e., = 1. A transmission efficiency > 0.5 is typically considered sufficient for the AFL system [11]. To calculate , 300,000 monodisperse particles were injected at 15 mm downstream of the inlet across the entire radius of the spacer. Particles were distributed across the radius of the spacer according to the following function:
where is the particle radial seeding location for particle , and is the spacer diameter. This function ensures a uniform particle mass flux across the inlet. A total of 300 particle sizes, in the diameter range 10 nm to 10 μm, were simulated, with each size injected from 1000 radial locations ( = 1000).
3. Results
3.1. Effects of Lens Half-Angle
Figure 4a shows as a function of for = 50 and = 0.1 with an injection location Δ = 0.1, comparing three values of α (30°, 90°, and 150°). For clarity, results with lens half-angles of 45, 60, 75, 105, 120, and 135 are omitted. Similar to the results obtained from previous works [9,21], decreased from nearly 1 at small (≈0.01) with minimal focusing, to zero at intermediate (0.6–1.0) with strong focusing, and to negative values at larger St, indicating axis crossing. The three curves in Figure 4a are nearly identical, showing that the effect of α is negligible for particles injected near the axis, especially at < 1.
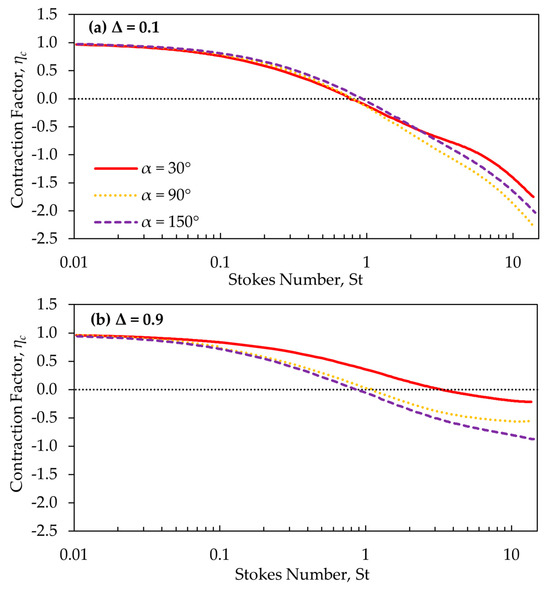
Figure 4.
ηc as a function of St at Re = 50 and Ma = 0.1, for three different values of α (30°, 90°, 150°) and for two injection locations (a) Δ = 0.1 and (b) Δ = 0.9.
Figure 4b shows the same results as Figure 4a, but for an injection location of 0.9. At this injection location, the particles travel more slowly than those injected near the axis, because of the boundary-layer effect. Similar to Δ = 0.1, minimal focusing is achieved at small (≈0.01). However, for larger values of , the curve of for an = 30° deviates significantly from that of the other angles. The convergent lens ( = 30°) focuses large particles better because it gradually converges particles toward the axis. For the straight-edge (90°) and divergent (150°) lenses, the particles follow a more abrupt converging flow, resulting in a flipped S trajectory to pass through the orifice, which causes large particles to deviate more from the axis.
Figure 5 shows as a function of α for near-axis injections (Δ = 0.1) at = 50 and different (the data for Δ = 0.1 at Re = 100 is provided in Figure S4). For Re = 50, varied within a narrow range, from 0.6 to 1.05. Converging lenses from 45° to 75° had the smallest . In the free molecular regime, is proportional to the vacuum aerodynamic diameter. Changing from a straight-edge lens ( = 90°) to a 45° converging lens would reduce the optimally focused particle size from 30 to 25 nm under the same flow conditions, a marginal impact. Interestingly, the diverging lenses ( > 90°) do not reduce when particles are injected close to the axis, contrary to the prediction by Fernández de la Mora et al. [15,16]. Therefore, diverging half-angle lens designs do not show a pronounced improvement in focusing particles <30 nm. This contradiction is mainly due to viscous flow forces being taken into consideration in our model. However, particles injected far from the axis (close to the spacer wall, Δ = 0.9), regardless of Re, exhibit a decrease in with increasing , as shown in Figures S5 and S6.
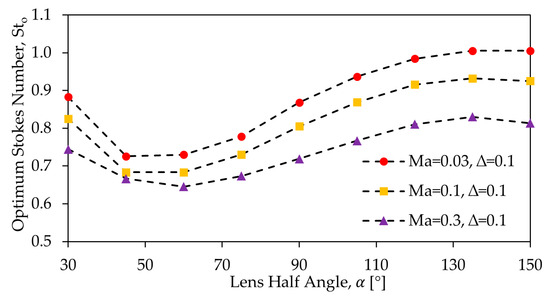
Figure 5.
as a function of α for three Ma values (0.03, 0.1, and 0.3) for near-axis particles (Δ = 0.1) at Re = 50. See Supplementary Materials S3 for Re = 100 with Δ = 0.1 in Figure S4, and for Re = 50 and 100 with Δ = 0.9 in Figures S5 and S6, respectively.
Figure 6 illustrates particle trajectories through a 90° lens and a divergent 150° lens. The 150° lens has a larger stagnation region upstream of the lens. Particles only penetrate slightly into the stagnation layer and make a flipped S-shaped turn. However, the particles do not enter the stagnation layer deep enough to make two turns, making the difference with a 90° lens small. Since α does not have a significant effect on or , especially for particles near the axis, the 90° lenses are deemed to be a better choice due to their simplicity.
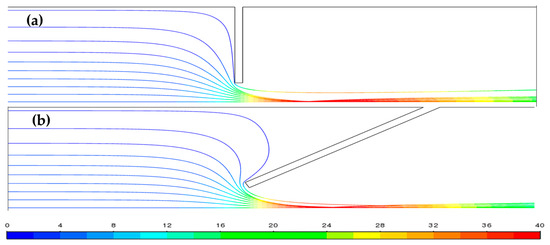
Figure 6.
Trajectories of 900 nm particles (St = 1) through (a) a straight-edge lens with = 90° and (b) a diverging lens with = 150° at Re = 50 and Ma = 0.1. The lines are colored by particle velocities [m/s].
3.2. Effect of Exit Nozzle Geometry
3.2.1. Nozzle Thickness
Figure 7a,b show the particle divergence angle, , and the transmission efficiency, , respectively, as a function of for various values of with a fixed = 10 mm and = 0.6. In these and subsequent figures (Figure 8 and Figure 9), is calculated using = 10 mm as the characteristic dimension and the flow conditions at 30 mm downstream of the inlet, where the flow is fully developed.
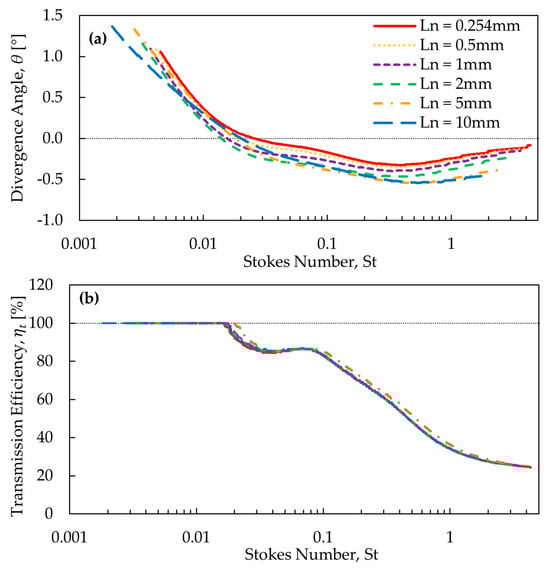
Figure 7.
Results from the nozzle simulations of (a) θ and (b) for various values of as a function of .
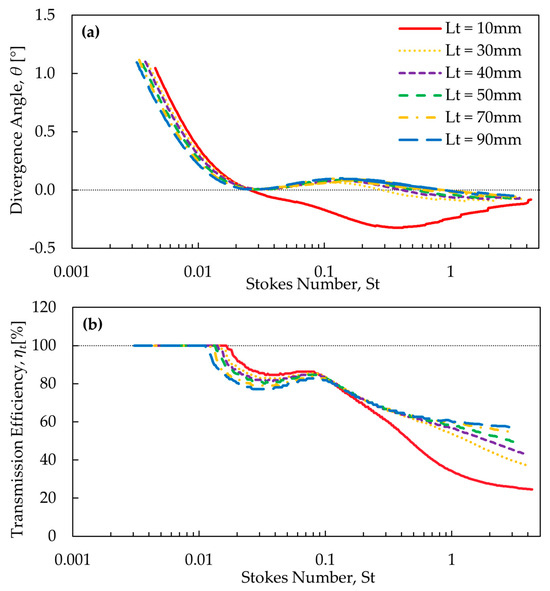
Figure 8.
Results from the nozzle simulations of (a) θ and (b) for various values of as a function of .
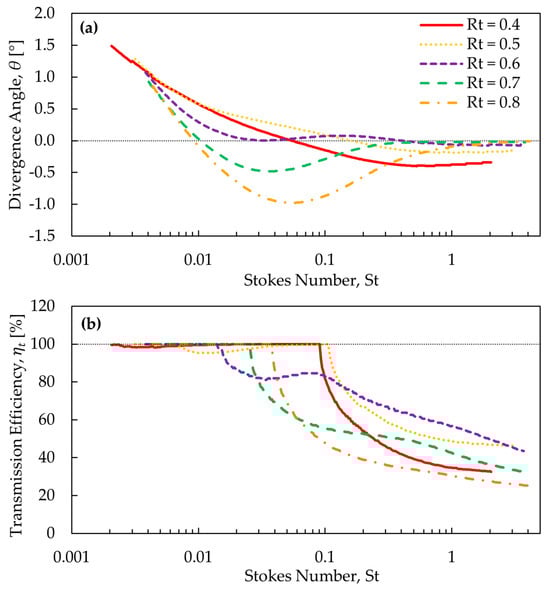
Figure 9.
Results from the nozzle simulations of (a) θ and (b) for various values of as a function of .
Figure 7a shows that the dependency of the divergence angles on is similar for all values, except for short capillaries of = 5 and 10 mm. Small particles ( < ~0.007), regardless of , have the highest divergence angle from the center axis. This is because these particles have very small mass and inertia, making them closely follow the gas flow to expand radially outward at the nozzle exit into the vacuum chamber. The divergence angle decreases rapidly as increases. Depending on , the particles in the range of ~0.01–0.03 achieve a divergence angle of zero. As further increases, the divergence angle becomes negative, and its absolute value slightly increases, then decreases at high values. A negative divergence angle means that the particles are converging toward the axis, ultimately diverging far from it in the opposite direction. Particles with a large have a large inertia and are not significantly affected by the drag forces experienced at the nozzle exit. The high inertia causes these particles to move across the axis, resulting in negative divergence angles.
Figure 7a also shows that, for St ≳ 0.02, the thinnest nozzle ( = 0.254 mm) maintains the smallest absolute divergence angle. This feature will reduce defocusing and even enable focusing of larger particles by the nozzle. The short capillaries generate lower divergence angles for smaller particles (St ≲ 0.02) but do not reduce the beam spread over a wide size range. Therefore, thin plate nozzles are recommended as the AFL exit. The thickness of 0.254 mm (i.e., 0.1 inch) is recommended for sufficient mechanical strength.
Figure 7b shows that the curves follow a similar trend, regardless of . As expected, small particles ( ≲ 0.017) maintain a 100% for all values. At ≈ 0.018, the drops below 100% to about 85% at ≈ 0.04, remains nearly constant (slightly increases) until ≈ 0.1, and then steadily decreases afterward. The near-constant values at ≈ 0.04–0.1 are directly related to the effect of the step radius, , which will be discussed in Section 3.2.3. An of ~50% is achieved at ≈ 0.4 for all values, which corresponds to a dp of ~1.1 μm in these simulations. Note that this is likely a lower-bound estimate of in an AFL, as particles are injected uniformly across the nozzle inlet in these simulations. In an actual AFL, particles will likely be focused into a small beam to some extent by upstream lenses before reaching the nozzle. Based on these results from Figure 7b, it can be concluded that has an insignificant effect on transmission efficiency. Therefore, an of 0.254 mm is deemed to be the optimal length.
3.2.2. Step Length
Figure 8a,b show and , respectively, as a function of for various values of with fixed = 0.6 and = 0.254 mm. For clarity, the results for = 20, 60, and 80 mm are omitted.
Similar to the results, for small particles with < 0.02 decreases with St to reach a zero-divergence, regardless of the value. This result indicates that neither the nozzle thickness nor the step length has a strong effect on the small particles’ behavior. Past ≈ 0.02, the behavior of the divergence angle is different for = 10 mm compared to the other values. The divergence angle for = 10 mm remains negative. However, for ≥ 20 mm it swings between positive and negative values and remains close to a zero-divergence. At these values, the divergence angle crosses the = 0 line twice, at ≈ 0.02 and ≈ 0.3–0.9, depending on .
The different behavior observed for = 10 mm at > 0.02 is due to the short step length, which does not give particles sufficient distance to reach a steady horizontal trajectory within the step region compared to longer step lengths. From Figure 8a, it can be concluded that small particle divergence can be achieved with longer step lengths. However, beyond 30 mm, there is a negligible effect of on particle divergence.
Figure 8b shows that particles with small ≲ 0.01–0.015 maintain a 100% transmission efficiency for all values. As increases, a similar behavior is observed as for the results, where the transmission efficiency drops below 100% at St values greater than 0.01, increases slightly, and then continuously decreases afterward. However, the value at which St drops and the final at the high are different depending on . = 10 mm has the most noticeable difference from all other values. The 50% transmission efficiency is achieved at different values. As increases, the value corresponding to a 50% transmission efficiency increases, with > 60 mm maintaining a value above 50%.
Based on Figure 8, the shortest step length that can achieve, on average, the best convergence with an acceptable transmission efficiency over a wide range of is 40 mm. Thus, this value is deemed optimal.
3.2.3. Step Radius
Figure 9a,b show and , respectively, as a function of for various values of at the optimal and values. In these figures, is calculated relative to for consistency with previous figures. However, the particle and flow behavior inside the step will depend on the calculated relative to the step diameter.
Figure 9a shows that the divergence angles for = 0.4 and 0.5 exhibit a different behavior from larger-radius ratios. For = 0.4 and 0.5, the divergence angle steadily decreases with the increase in and then slightly increases at high St values. However, steps with ≥ 0.6 exhibit a relatively similar oscillatory behavior. = 0.6 maintains a close-to-zero divergence angle for the widest range of , while the angles for = 0.7 and 0.8 significantly drop below zero and remain negative for a wide range of . This suggests that large step radii achieve poor focusing of medium-sized particles. Large particles ( ≳ 1) are well focused when ≥ 0.6. Based on Figure 9a, it can be concluded that an value of 0.6 can maintain the best divergence angle for the widest range of .
Figure 9b shows that, unlike and , highly depends on the value. A distinctive pattern can be noticed for small radii ( = 0.4 and 0.5), where the transmission efficiency initially drops below 100%, then rebounds to unity, and then drops once more at a higher . A similar but less pronounced pattern is observed for = 0.6; however, the rebound is incomplete. For larger , this pattern is even less noticeable or nonexistent. Transmission efficiency in these cases drops below 100% and steadily decreases. This figure also shows that the first drop occurs at different . However, when is calculated based on the step diameter, the first drop below 100% occurs at the same = 0.1 for all values (see Figure S7).
The drop pattern can be explained by near-wall interaction at the step inlet. Figure 10 shows particle trajectories for the case = 0.6 for two values of 100 nm ( = 0.034, blue) and 200 nm ( = 0.084, red). Only 20 particles for each size are plotted for visual clarity. From the left detailed region in Figure 10, after the step restriction, the 200 nm particles with initial injection locations close to the spacer wall are focused closer to the axis due to their higher inertia compared to the 100 nm particles injected at the same location. This causes the 100 nm particles to impact on the upstream vertical surface of the exit nozzle at a higher rate than the 200 nm particles, as shown in the right detailed region of Figure 10. This behavior, noticed for step radii ≤ 0.6, nearly disappears for larger , due to the smaller difference in flow velocity between the spacer and the step regions.
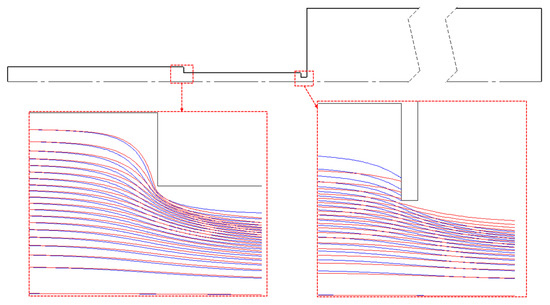
Figure 10.
Trajectories of particles with two values of 100 nm (blue) and 200 nm (red) at the step and nozzle inlets for the case = 0.6.
From Figure 9, it can be concluded that an value of 0.6 can maintain the smallest divergence angle, as well as a transmission efficiency above 50% over the widest range. Therefore, this ratio is deemed optimal. Similar to what was initially hypothesized, an initial short capillary geometry for a step, followed by a thin plate orifice for the final nozzle outlet, results in the optimal focusing effect for particles over a wide size range.
4. Discussion and Conclusions
This paper presents the first systematic evaluation of the focusing performance of aerodynamic lenses across a wide range of α, including converging, straight-edge, and diverging orifices. It was found that the impact of α on focusing performance was not significant for near-axis particles. However, convergent lenses may better focus large particles that are near the spacer walls. For the simplicity of lens fabrication and assembly, it appears that a straight-edge orifice is the best choice.
This study further optimized the step exit nozzle geometry to focus a wide size range of particles by varying key dimensions: nozzle thickness (), step length (), and ratio of step radius to the spacer radius (). Based on the particle divergence angle and particle transmission efficiency, an optimal geometry combination consisting of an = 0.254 mm, = 40 mm, and = 0.6 yielded the best results over a particle size range of 10 nm–10 μm. This optimization is particularly important for efficiently delivering large particles to the vacuum chamber with low divergence angles and high transmission efficiencies, as these particles are often defocused in the final lens stages [11].
One limitation of the nozzle optimization is that it started with a of 10 mm and a nozzle diameter of 3 mm. While Rt values were nondimensionalized, a fully nondimensionalized treatment of all parameters would provide a more general optimization framework. The results, however, suggest that the effect of and is not significant, especially on transmission efficiency. Only strongly influences both the divergence angle and transmission efficiency. Thus, only nondimensionalizing is justified. Liu et al. [10] studied a similar nozzle and found an optimal of 0.6, although they did not optimize or .
Additionally, the optimization procedure subsequently varied parameters, first optimizing with fixed and , then with fixed and , and finally . This stepwise approach may overlook the global optimum, and alternative methods such as response surface methodology or parameter interaction analysis could provide a more robust optimization strategy. Future studies should experimentally verify whether this geometry represents a truly optimal solution.
Supplementary Materials
The following supporting information can be downloaded at: https://www.mdpi.com/article/10.3390/atmos16091049/s1. S1 Flow Equations, S2 Mesh Sensitivity, and S3 Supplementary Figures. Table S1. Boundary conditions for single-lens simulations. Table S2. Grid refinement for the divergent lens model. Table S3. Grid convergence study for the convergent/divergent lens model. Table S4. Grid refinement for the nozzle model. Table S5. Grid convergence study for the nozzle model. Figure S1. Divergent lens model showing Re converging with increasing mesh quality to the Richardson extrapolation (h = 0). Figure S2. Alternate nozzle mesh study model. Figure S3. Nozzle model showing Re converging with increasing mesh quality to the Richardson extrapolation (h = 0). Figure S4. Sto as a function of α for three Ma values (0.03, 0.1, and 0.3) for near-wall particles (Δ = 0.1) at a Re of 100. Figure S5. Sto as a function of α for three Ma values (0.03, 0.1, and 0.3) for near-wall particles (Δ = 0.9) at a Re of 50. Figure S6. Sto as a function of α for three Ma values (0.03, 0.1, and 0.3) for near-wall particles (Δ = 0.9) at a Re of 100. Figure S7. Results from the nozzle simulations of ηt for various values of Rt as a function of St based on the step diameter.
Author Contributions
Conceptualization, M.H.-N. and X.W.; methodology, M.H.-N., X.W. and A.V.; software, A.V. and H.G.; formal analysis, A.V. and H.G.; investigation, A.V. and H.G.; resources, M.H.-N. and X.W.; data curation, A.V., H.G. and M.H.-N.; writing—original draft preparation, A.V.; writing—review and editing, M.H.-N. and X.W.; visualization, A.V. and H.G.; supervision, M.H.-N.; project administration, X.W.; funding acquisition, X.W. and M.H.-N. All authors have read and agreed to the published version of the manuscript.
Funding
This research received funding from the U.S. Department of Energy EPSCoR program under award number #DE-SC0021214.
Data Availability Statement
The original contributions presented in this study are included in the article. Further inquiries can be directed to the corresponding author.
Conflicts of Interest
Author Harrison Griffin was employed by Raytheon. The remaining authors declare that the research was conducted in the absence of any commercial or financial relationships that could be construed as a potential conflict of interest.
References
- Vaden, T.D.; Imre, D.; Beránek, J.; Zelenyuk, A. Extending the Capabilities of Single Particle Mass Spectrometry: I. Measurements of Aerosol Number Concentration, Size Distribution, and Asphericity. Aerosol Sci. Technol. 2011, 45, 113–124. [Google Scholar] [CrossRef]
- Su, Y.; Sipin, M.F.; Furutani, H.; Prather, K.A. Development and Characterization of an Aerosol Time-of-Flight Mass Spectrometer with Increased Detection Efficiency. Anal. Chem. 2004, 76, 712–719. [Google Scholar] [CrossRef] [PubMed]
- Murphy, D.M. The design of single particle laser mass spectrometers. Mass Spectrom. Rev. 2007, 26, 150–165. [Google Scholar] [CrossRef]
- Zelenyuk, A.; Imre, D.; Wilson, J.; Zhang, Z.; Wang, J.; Mueller, K. Airborne Single Particle Mass Spectrometers (SPLAT II & miniSPLAT) and New Software for Data Visualization and Analysis in a Geo-Spatial Context. J. Am. Soc. Mass. Spectrom. 2015, 26, 257–270. [Google Scholar] [CrossRef]
- Israel, G.W.; Friedlander, S.K. High-Speed Beams of Small Particles. J. Colloid Interface Sci. 1967, 24, 330–337. [Google Scholar] [CrossRef]
- Dahneke, B.E.; Flachsbart, H. An Aerosol Beam Spectrometer. J. Aerosol Sci. 1972, 3, 345–349. [Google Scholar] [CrossRef]
- Mallina, R.V.; Wexler, A.S.; Johnston, M.V. High-Speed Particle Beam Generation: Simple Focusing Mechanisms. J. Aerosol Sci. 1999, 30, 719–738. [Google Scholar] [CrossRef]
- Mallina, R.V.; Wexler, A.S.; Rhoads, K.P.; Johnston, M.V. High Speed Particle Beam Generation: A Dynamic Focusing Mechanism for Selecting Ultrafine Particles. Aerosol Sci. Technol. 2000, 33, 87–104. [Google Scholar] [CrossRef]
- Liu, P.; Ziemann, P.J.; Kittelson, D.B.; McMurry, P.H. Generating Particle Beams of Controlled Dimensions and Divergence: I. Theory of Particle Motion in Aerodynamic Lenses and Nozzle Expansions. Aerosol Sci. Technol. 1995, 22, 293–313. [Google Scholar] [CrossRef]
- Liu, P.; Ziemann, P.J.; Kittelson, D.B.; McMurry, P.H. Generating Particle Beams of Controlled Dimensions and Divergence: II. Experimental Evaluation of Particle Motion in Aerodynamic Lenses and Nozzle Expansions. Aerosol Sci. Technol. 1995, 22, 314–324. [Google Scholar] [CrossRef]
- Wang, X.L.; McMurry, P.H. A Design Tool for Aerodynamic Lens Systems. Aerosol Sci. Technol. 2006, 40, 320–334. [Google Scholar] [CrossRef]
- Peck, J.; Gonzalez, L.A.; Williams, L.R.; Xu, W.; Croteau, P.L.; Timko, M.T.; Jayne, J.T.; Worsnop, D.R.; Miake-Lye, R.C.; Smith, K.A. Development of an aerosol mass spectrometer lens system for PM2.5. Aerosol Sci. Technol. 2016, 50, 781–789. [Google Scholar] [CrossRef]
- Cahill, J.F.; Darlington, T.K.; Wang, X.L.; Mayer, J.; Spencer, M.T.; Holecek, J.C.; Reed, B.E.; Prather, K.A. Development of a High-Pressure Aerodynamic Lens for Focusing Large Particles (4–10 µm) into the Aerosol Time-of-Flight Mass Spectrometer. Aerosol Sci. Technol. 2014, 48, 948–956. [Google Scholar] [CrossRef]
- Huang, J.; Li, L.; Li, X.; Huang, Z.; Cheng, Z. Design of a wide-particle-size-range aerodynamic injection system with a new pre-focus structure. Atmos. Meas. Tech. 2025, 18, 2739–2749. [Google Scholar] [CrossRef]
- Fernández de la Mora, J.; Riesco-Chueca, P. Aerodynamic Focusing of Particles in a Carrier Gas. J. Fluid Mech. 1988, 195, 1–21. [Google Scholar] [CrossRef]
- Fernández de la Mora, J.; Rosell-Llompart, J.; Riesco-Chueca, P. Aerodynamic Focusing of Particles and Molecules in Seeded Supersonic Jets. In Rarefied Gas Dynamics: Physical Phenomena, Progress in Astronautics & Aeronautics; Muntz, E.P., Weaver, D.P., Campbell, D.H., Eds.; AIAA: Washington, DC, USA, 1989; Volume 117, pp. 247–277. [Google Scholar]
- Middha, P.; Wexler, A.S. Particle Focusing Characteristics of Sonic Jets. Aerosol Sci. Technol. 2003, 37, 907–915. [Google Scholar] [CrossRef]
- Wang, X.L.; Kruis, F.E.; McMurry, P.H. Aerodynamic Focusing of Nanoparticles: I. Guidelines for Designing Aerodynamic Lenses for Nanoparticles. Aerosol Sci. Technol. 2005, 39, 611–623. [Google Scholar] [CrossRef]
- Wang, X.L.; Gidwani, A.; Girshick, S.L.; McMurry, P.H. Aerodynamic Focusing of Nanoparticles: II. Numerical Simulation of Particle Motion through Aerodynamic Lenses. Aerosol Sci. Technol. 2005, 39, 624–636. [Google Scholar] [CrossRef]
- Zhang, L.; Shao, J.; Chen, X.; Zhang, J.; Si, Q. Design and evaluation of aerodynamic lens system for focusing sub-10 nm nanoparticles. Appl. Phys. A 2016, 122, 953. [Google Scholar] [CrossRef]
- Zhang, X.; Smith, K.A.; Worsnop, D.R.; Jimenez, J.; Jayne, J.T.; Kolb, C.E. A Numerical Characterization of Particle Beam Collimation by an Aerodynamic Lens-Nozzle System: Part I. An Individual Lens or Nozzle. Aerosol Sci. Technol. 2002, 36, 617–631. [Google Scholar] [CrossRef]
- Zhang, X.; Smith, K.A.; Worsnop, D.R.; Jimenez, J.L.; Jayne, J.T.; Kolb, C.E.; Morris, J.; Davidovits, P. Numerical Characterization of Particle Beam Collimation: Part II. Integrated Aerodynamic-Lens-Nozzle System. Aerosol Sci. Technol. 2004, 38, 619–638. [Google Scholar] [CrossRef]
- Jayne, J.T.; Leard, D.C.; Zhang, X.; Davidovits, P.; Smith, K.A.; Kolb, C.E.; Worsnop, D.R. Development of an Aerosol Mass Spectrometer for Size and Composition Analysis of Submicron Particles. Aerosol Sci. Technol. 2000, 33, 49–70. [Google Scholar] [CrossRef]
- ANSYS, Inc. Ansys Fluent User’s Guide, Release: 2022R2; ANSYS, Inc.: Canonsburg, PA, USA, 2022. [Google Scholar]
- Sutherland, W. The viscosity of gases and molecular force. Philos. Mag. 1893, 36, 507–531. [Google Scholar] [CrossRef]
- Slater, J.W. Examining Spatial (Grid) Convergence; Northern Peninsula Area Regional Council (NPARC) Alliance Verification and Validation Web Site: 2021. Available online: https://www.grc.nasa.gov/www/wind/valid/tutorial/spatconv.html (accessed on 10 February 2025).
Disclaimer/Publisher’s Note: The statements, opinions and data contained in all publications are solely those of the individual author(s) and contributor(s) and not of MDPI and/or the editor(s). MDPI and/or the editor(s) disclaim responsibility for any injury to people or property resulting from any ideas, methods, instructions or products referred to in the content. |
© 2025 by the authors. Licensee MDPI, Basel, Switzerland. This article is an open access article distributed under the terms and conditions of the Creative Commons Attribution (CC BY) license (https://creativecommons.org/licenses/by/4.0/).