Article

Seasonal Characteristics and Source Analysis of Water-Soluble Ions in PM2.5 in Urban and Suburban Areas of Chongqing

1
School of Environment and Resources, Chongqing Technology and Business University, Chongqing 401147, China
2
Chongqing Ecological and Environmental Monitoring Center, Chongqing 401147, China
3
Chongqing Field Scientific Observatory on the Causes of Atmospheric Complex Pollution, Chongqing 401147, China
4
Key Laboratory of Atmospheric Pollution Causes, Prevention and Control in Complex Terrain of Chengdu-Chongqing Region, Ministry of Ecology and Environment, PRCs, Chongqing 401147, China
*
Author to whom correspondence should be addressed.
Atmosphere 2025, 16(9), 1047; https://doi.org/10.3390/atmos16091047
Submission received: 5 July 2025 / Revised: 21 August 2025 / Accepted: 25 August 2025 / Published: 3 September 2025
(This article belongs to the Special Issue Air Pollution: Emission Characteristics and Formation Mechanisms)

Abstract

This study systematically investigated water-soluble inorganic ions (WSIIs) and their sources in PM2.5 in mountainous urban areas of Chongqing City. PM2.5 monitoring was conducted throughout 2023, spanning one year. The two districts under discussion are the Liang Jiang New Area (LJ) and He Chuan District (HC). The ion chromatography (Dionex Integrion HPIC) method was utilized to quantify eight ions (Cl, SO42−, NO3, Na+, K+, Mg2+, Ca2+, NH4+). The results obtained were then analyzed in conjunction with the EPA PMF 5.0 source apportionment model. The following key findings are presented: the data demonstrate that there is significant seasonal fluctuation in PM2.5 concentrations. The mean winter concentration (64 ± 27 μg/m3) was found to be 3.25 times higher than the mean summer concentration (19.7 ± 2 μg/m3). These fluctuations were primarily influenced by basin topography and unfavorable meteorological conditions. The proportion of PM2.5 mass attributable to WSII ranges from 31 to 33 percent, with the majority of this mass being attributed to secondary inorganic aerosols (SNA: SO42−, NO3, NH4+; accounting for 47–85% WSII). The annual NO3/SO42− ratio (0.69–0.80, <1) indicates that fixed sources (coal/industry) dominate, but a winter ratio >1 suggests increased contributions from mobile sources under low-temperature conditions. The sulfur oxidation rate (SOR: 0.35–0.37) is significantly higher than the nitrogen oxidation rate (NOR: 0.08–0.13), reflecting the efficient conversion of SO2 through wet, low-temperature pathways. PMF identified six sources, with secondary formation (43.8–44.3%) being the primary contributor to the overall process. In urban LJ, transportation (26.1%) and industry (13.6%) have been found to contribute significantly, while in suburban HC, combustion (15.4%) and dust (8.8%) have been determined to have notable impacts. This study recommends the implementation of synergistic control of SNA precursors (SO2, NOx, NH3), the strengthening of transportation and industrial management in LJ, and the enhancement of biomass combustion and dust control in HC.

1. Introduction

It has been demonstrated that PM2.5 has the potential to induce significant health risks, owing to its capacity to penetrate deeply into the respiratory system [1,2,3]. The chemical composition of the substance under investigation is complex and includes water-soluble inorganic ions (WSIIs). Variations in the chemical composition of the substance are observed on a regional basis, with these variations being attributable to the geographical location and meteorological conditions [4,5,6,7,8,9]. Despite the considerable research that has been conducted on major Chinese urban agglomerations, such as Beijing–Tianjin–Hebei and the Yangtze River Delta [10,11,12], it is imperative to understand the dynamics of pollution in geographically distinct areas.
Chongqing is a major economic hub in the upper Yangtze River with complex mountainous terrain [13,14]. The location of the site is at the core node of the PM2.5 pollution transmission network in the Yangtze River Economic Belt [15]. Previous studies have identified a sawtooth pattern in the annual daily variation in PM2.5 concentrations in Chongqing [16]. The Liangjiang New Area (LJ) is located in the northern part of Chongqing’s urban area, at the intersection of the “Belt and Road” and the Yangtze River Economic Belt. It is the country’s first national inland development area [17]. The region is characterized by a subtropical monsoon humid climate, with an average annual temperature of 16–18 °C and abundant rainfall. The mean annual relative humidity is approximately 70–80% [18]. As the core area for industrial and economic development in Chongqing, it has established an advanced manufacturing system supported by electronics, equipment manufacturing, automobiles, and biomedicine [19]. The area’s distinctive “industry-city integration” spatial model, which combines industrial and residential zones, classifies it as a typical industrial–residential mixed zone. The model has been demonstrated to be effective in its representation of the characteristics of high-intensity industrial emissions, transportation, and living source composite pollution.
Hechuan District (HC) is located in the northwestern part of Chongqing Municipality, at the southeastern edge of the Sichuan Basin in the upper reaches of the Yangtze River. The city is located at the confluence of the Fujiang, Qujiang, and Jialing Rivers. The region is characterized by a subtropical monsoon climate, with an average annual temperature of 18.8 °C and an annual precipitation of 1164.1 mm. The topography is characterized by a predominance of mountainous and hilly terrain, with elevated regions situated in the eastern, northern, and western regions, and comparatively lower elevations present in the southern portion [20]. The economic structure of the region exhibits characteristics indicative of an urban–rural transition, manifesting as both an important national grain and oil production base and a recipient of mechanical processing industries that are in excess within the primary urban area [21,22]. This relationship serves to establish a linkage between the urban–rural industrial chain through light textile and food processing [22]. The distinctive agricultural activity emissions (e.g., straw burning) and composite pollution sources resulting from industrial reception in this semi-urbanized area render HC a typical region for studying the mechanisms of atmospheric pollution in urban–rural transition zones.
Despite the fact that earlier studies have investigated the seasonal variation patterns of WSIIs in other regions of Chongqing, few studies on mountainous cities combine the analysis of two different types of pollution. This study was conducted over one year (January to December 2023) at two representative sites in Chongqing City. The objective of the study was to analyze the seasonal variation patterns of WSIIs in different pollution zones of mountainous cities and the formation mechanisms of secondary ions (SNA). Furthermore, the study sought to quantitatively assess the contributions of primary pollution sources using positive matrix factorization (PMF 5.0). Finally, based on the research results, targeted recommendations are provided to optimize air quality management strategies for this complex terrain area.

2. Materials and Methods

2.1. Point and Sample Collection

In this study, the LJ superstation (29°36′57″ N, 106°29′57″ E) and the HC superstation (29°59′54″ N, 106°14′30″ E) were selected as field monitoring sites for the period January to December 2023 (see spatial distribution in Figure 1). The months from March to May were designated as spring, those from June to August as summer, those from September to November as autumn, and those from December to February of the following year as winter. Given the absence of PM2.5 data for January and February 2024, the PM2.5 data from December 2023 were utilized as the winter data for 2023. Samples were collected during typical months selected based on the season (28 April–31 May; 25 July–16 August; 12 October–31 October; 8 December–31 December), with one sample collected daily during the sampling period, each lasting 23 h. Each PM2.5 sample was collected using a sampler (LECKEL GmbH, SEQ47/50, Germany) at a flow rate of 16.7 L·min−1. Before each sampling, the flow rate and airtightness of the sampler were calibrated. All instruments utilized for the calibration of flow rate, temperature, humidity, and pressure were certified by a metrology institution and were within their specified validity period. During the sampling process, a dedicated member of staff meticulously monitored the flow rate and airtightness of the pump.

2.2. Component Analysis Method

The quartz membranes collected in this study were utilized for the analysis of carbon components and water-soluble ions. The data on carbon components and water-soluble ion components were obtained by means of thermal reflection and ion chromatography, respectively. Polytetrafluoroethylene membranes were utilized for the analysis of inorganic elemental composition. Each batch of samples was prepared with field blanks, laboratory blanks, standard samples, and 10% duplicate samples. Blank samples were used to identify any contamination during the sampling and analysis process. To assess the precision of the method, duplicate samples were used to repeat the analysis. The analytical methods for each component are shown in Table 1.

2.3. PMF Model

In this study, the PMF5.0 receptor model (EPA PMF5.0) was employed for the source resolution study. The model input parameter system comprised the following four types of chemical constituents: (1) carbonaceous components: organic carbon (OC) and elemental carbon (EC); (2) eight water-soluble ions (WSI): cations (Na+, K+, Mg2+, Ca2+, NH4+) and anions (Cl, SO42−, NO3); (3) twenty inorganic elements: the elements under consideration are as follows: Al, Ca, Fe, K, Si and Ti and heavy elements such as V, Cr, Mn, Co, Ni, Cu, Zn, As, Se, Cd, Sb, Ba, Pb and Sn. The PM2.5 mass concentration is to be considered as an indicator of total mass limitation.
In establishing the model parameters, the mass concentration data for each chemical constituent and its associated uncertainty were determined as follows: the mass concentration data were obtained from the laboratory analysis results, and its uncertainty was calculated by referring to the literature [23,24] to establish the following comprehensive assessment method, which comprehensively considers multiple influencing factors such as the instrumental detection limit, analytical precision and sampling error.
In instances where the concentration falls below the detection limit,
x i j = 1 / 2 d i j
u n c = 5 / 6 d i j
In circumstances where the concentration is elevated to a level that exceeds the detection limit,
x i j = c i j
x i j 1 / 3   d i j     , u n c = 1 / 3 d i j + 0.2 c i j
x i j 1 / 3   d i j     , u n c = 1 / 3 d i j + 0.1 c i j
In the context of missing values,
x i j = c ¯ i j , u n c = 4 c ¯ i j
In this formula, x i j denotes the input concentration; d i j signifies the limit of detection; and u n c represents the uncertainty.
In the process of optimizing the PMF5.0 model parameters of the EPA, the number of source resolution factors (i.e., the number of potential pollution sources) and the number of model runs were set to an adjustable range of 1–999. In consideration of the industrial structure of the study area (with a particular focus on typical pollution sources, including car manufacturing and electronics industry clusters), the special topographical conditions of mountainous valleys, and the characteristics of residential emissions and other elements of the source spectrum, the number of potential pollution sources for the sensitivity test was limited to a range of 3–7 factors.

3. Results and Discussion

3.1. PM2.5 Mass Concentration and Seasonal Characteristics

The distribution of PM2.5 concentrations in the ambient air of Chongqing in 2023 is illustrated in Figure 2. The annual average mass concentration of PM2.5 in ambient air in Chongqing was found to be (37 ± 18) μg/m3, exhibiting a significant seasonal distribution, with the highest concentrations recorded during the winter months (64 ± 27 μg/m3). The mean concentration of PM2.5 was (31 ± 4 μg/m3) in the spring, which was the second-highest concentration recorded. In the autumn, the mean concentration was (31 ± 11) μg/m3. The mean concentration was the lowest in the summer, at (19.7 ± 2) μg/m3, which was 30.8% of that in the winter. The findings of this study demonstrate that the coefficient of variation (CV = standard deviation/mean × 100%) is significantly elevated in winter when compared to other seasons. The CV for winter is 42.2%, which is substantially higher than the CV for summer (10.2%). These results suggest that the concentration of PM2.5 is driven by instability factors, which may be closely related to the alternating effects of stationary weather and cold air activities [25,26].

3.2. Water-Soluble Inorganic Ionic Components and Seasonal Characteristics

3.2.1. Characterization of Water-Soluble Inorganic Ion Concentrations

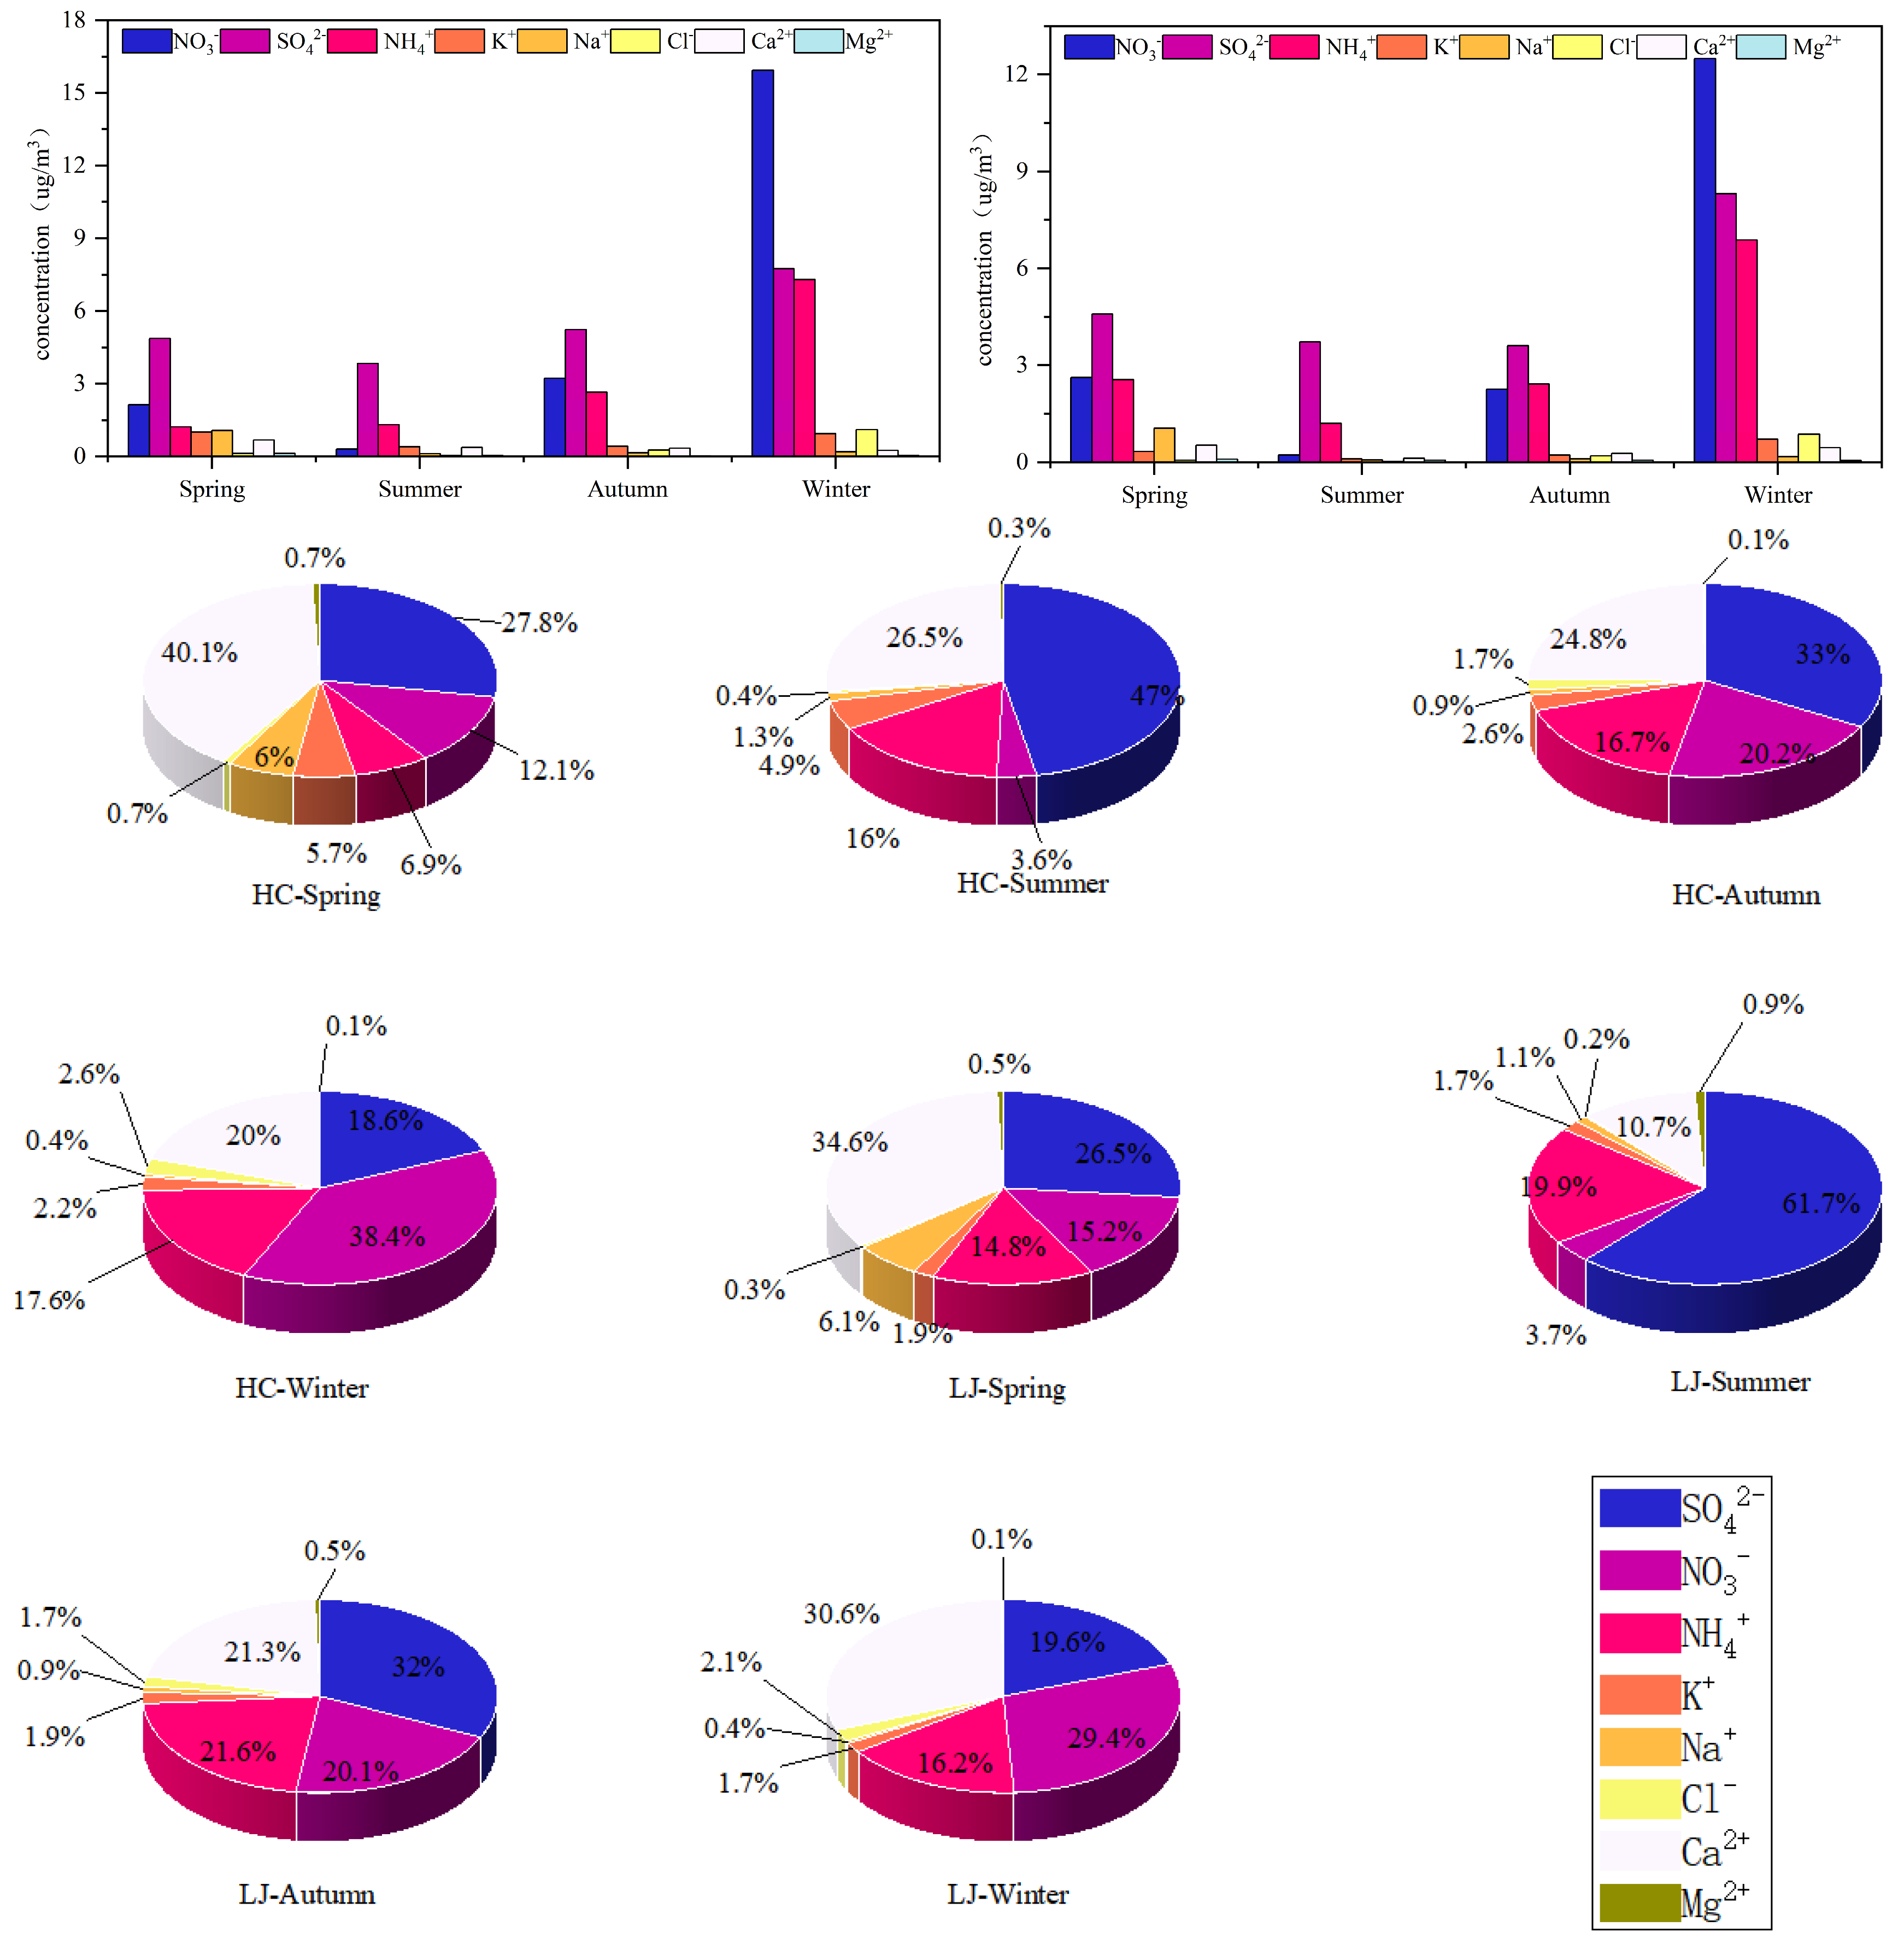
During the study period, the annual mean concentrations of total water-soluble inorganic ions (TWSII) in PM2.5 in HC and LJ of Chongqing were 16.5 μg/m3 and 16.2 μg/m3, accounting for 31% and 33% of the PM2.5 mass concentration, respectively. The TWSII components in both regions were dominated by nitrate (NO3), sulphate (SO42−), and ammonium (NH4+) (collectively SNA), which together accounted for between 47% and 85% of the total. This finding suggests that secondary inorganic pollution is a significant contributor to PM2.5 levels.
The seasonal variation characteristics are demonstrated in Figure 3, and the TWSII concentrations in both regions exhibited a significantly higher pattern in winter than in other seasons. The concentrations of TWSII in HC were found to be significantly higher during the winter months (44.2 ± 5 μg/m3) in comparison to the autumn (23.6 ± 3.4 μg/m3), spring (10.8 ± 1.8 μg/m3), and summer (5.7 ± 1 μg/m3). In the LJ, the concentrations of the substance under investigation were found to be highest in winter (38.4 ± 6 μg/m3), followed by autumn (16.3 ± 2.5 μg/m3), spring (9.7 ± 1.8 μg/m3), and summer (4.5 ± 1 μg/m3). The elevated values observed during the winter months may be attributable to the unfavorable diffusive meteorological conditions present within the lower boundary layer of the Sichuan Basin [27,28]. Conversely, the reduced concentrations experienced during the summer months are attributed to the augmented atmospheric diffusive capacity and the effects of precipitation washout [29].
The variations in temperature and humidity in Chongqing Municipality during 2023 are demonstrated in Figure 4, with elevated temperatures and high humidity during summer months and increased humidity and reduced temperatures during winter. The formation of secondary aerosols is significantly regulated by temperature and humidity conditions. The seasonal characteristics exhibited by the SNA fractions demonstrated that the SO42− concentration exhibited a higher magnitude than that of NO3 during the summer months in both regions. During periods of elevated summer temperatures, there is an observed increase in photochemical reaction activity, which, in turn, accelerates the oxidative conversion of SO2 to SO42−. Concurrently, elevated levels of humidity have been observed to augment the rate of liquid phase reaction and the water content of the particulate phase state through the aerosol hygroscopic growth effect. This, in turn, has been demonstrated to further enhance the secondary sulphate formation pathway [30,31]. The following pathways have been identified as the most prevalent:
Vapor   phase   oxidation :   O 3 + hv ( λ < 306 nm ) O ( D 1 ) + O 2
O ( D 1 ) + H 2   O 2 OH
SO 2   + OH HOSO 2   O 2   , H 2   O   H 2 SO 4
Liquid   phase   oxidation :   2 HO 2   H 2 O 2 + O 2
H 2 O 2   + HSO 3 H + + SO 4 2   + H 2   O
Nitrate is predominantly present as NH4NO3 in PM2.5, and its low summer concentration is primarily influenced by thermodynamic volatilization and photochemical degradation. The reaction formula is
NH 4 NO 3   ( s ) NH 3 ( g ) + HNO 3   ( g )
The reaction is subject to co-regulation by temperature and relative humidity (RH). As demonstrated in the relevant literature, the equilibrium constant for the decomposition of NH4NO3 is 3.03 × 10⁻¹⁷ at 25 °C. However, it has been observed that the decomposition rate is significantly increased at high temperatures during the summer months (e.g., 35 °C), resulting in a decrease in NO3 in the particulate phase [32]. The generation of HNO3 (g) was subsequently subjected to volatilization from the particulate phase at elevated temperatures, as illustrated in reaction Equation (13).
HNO 3   ( aq ) HNO 3   ( g )
In the NH4NO3-(NH4)2SO4-H2O mixed system, the presence of (NH4)2SO4 has been shown to cause the NH4NO3 decomposition constant to vary by no more than 40% [32], thus indicating that sulphate is not the dominant factor inhibiting nitrate volatilization.
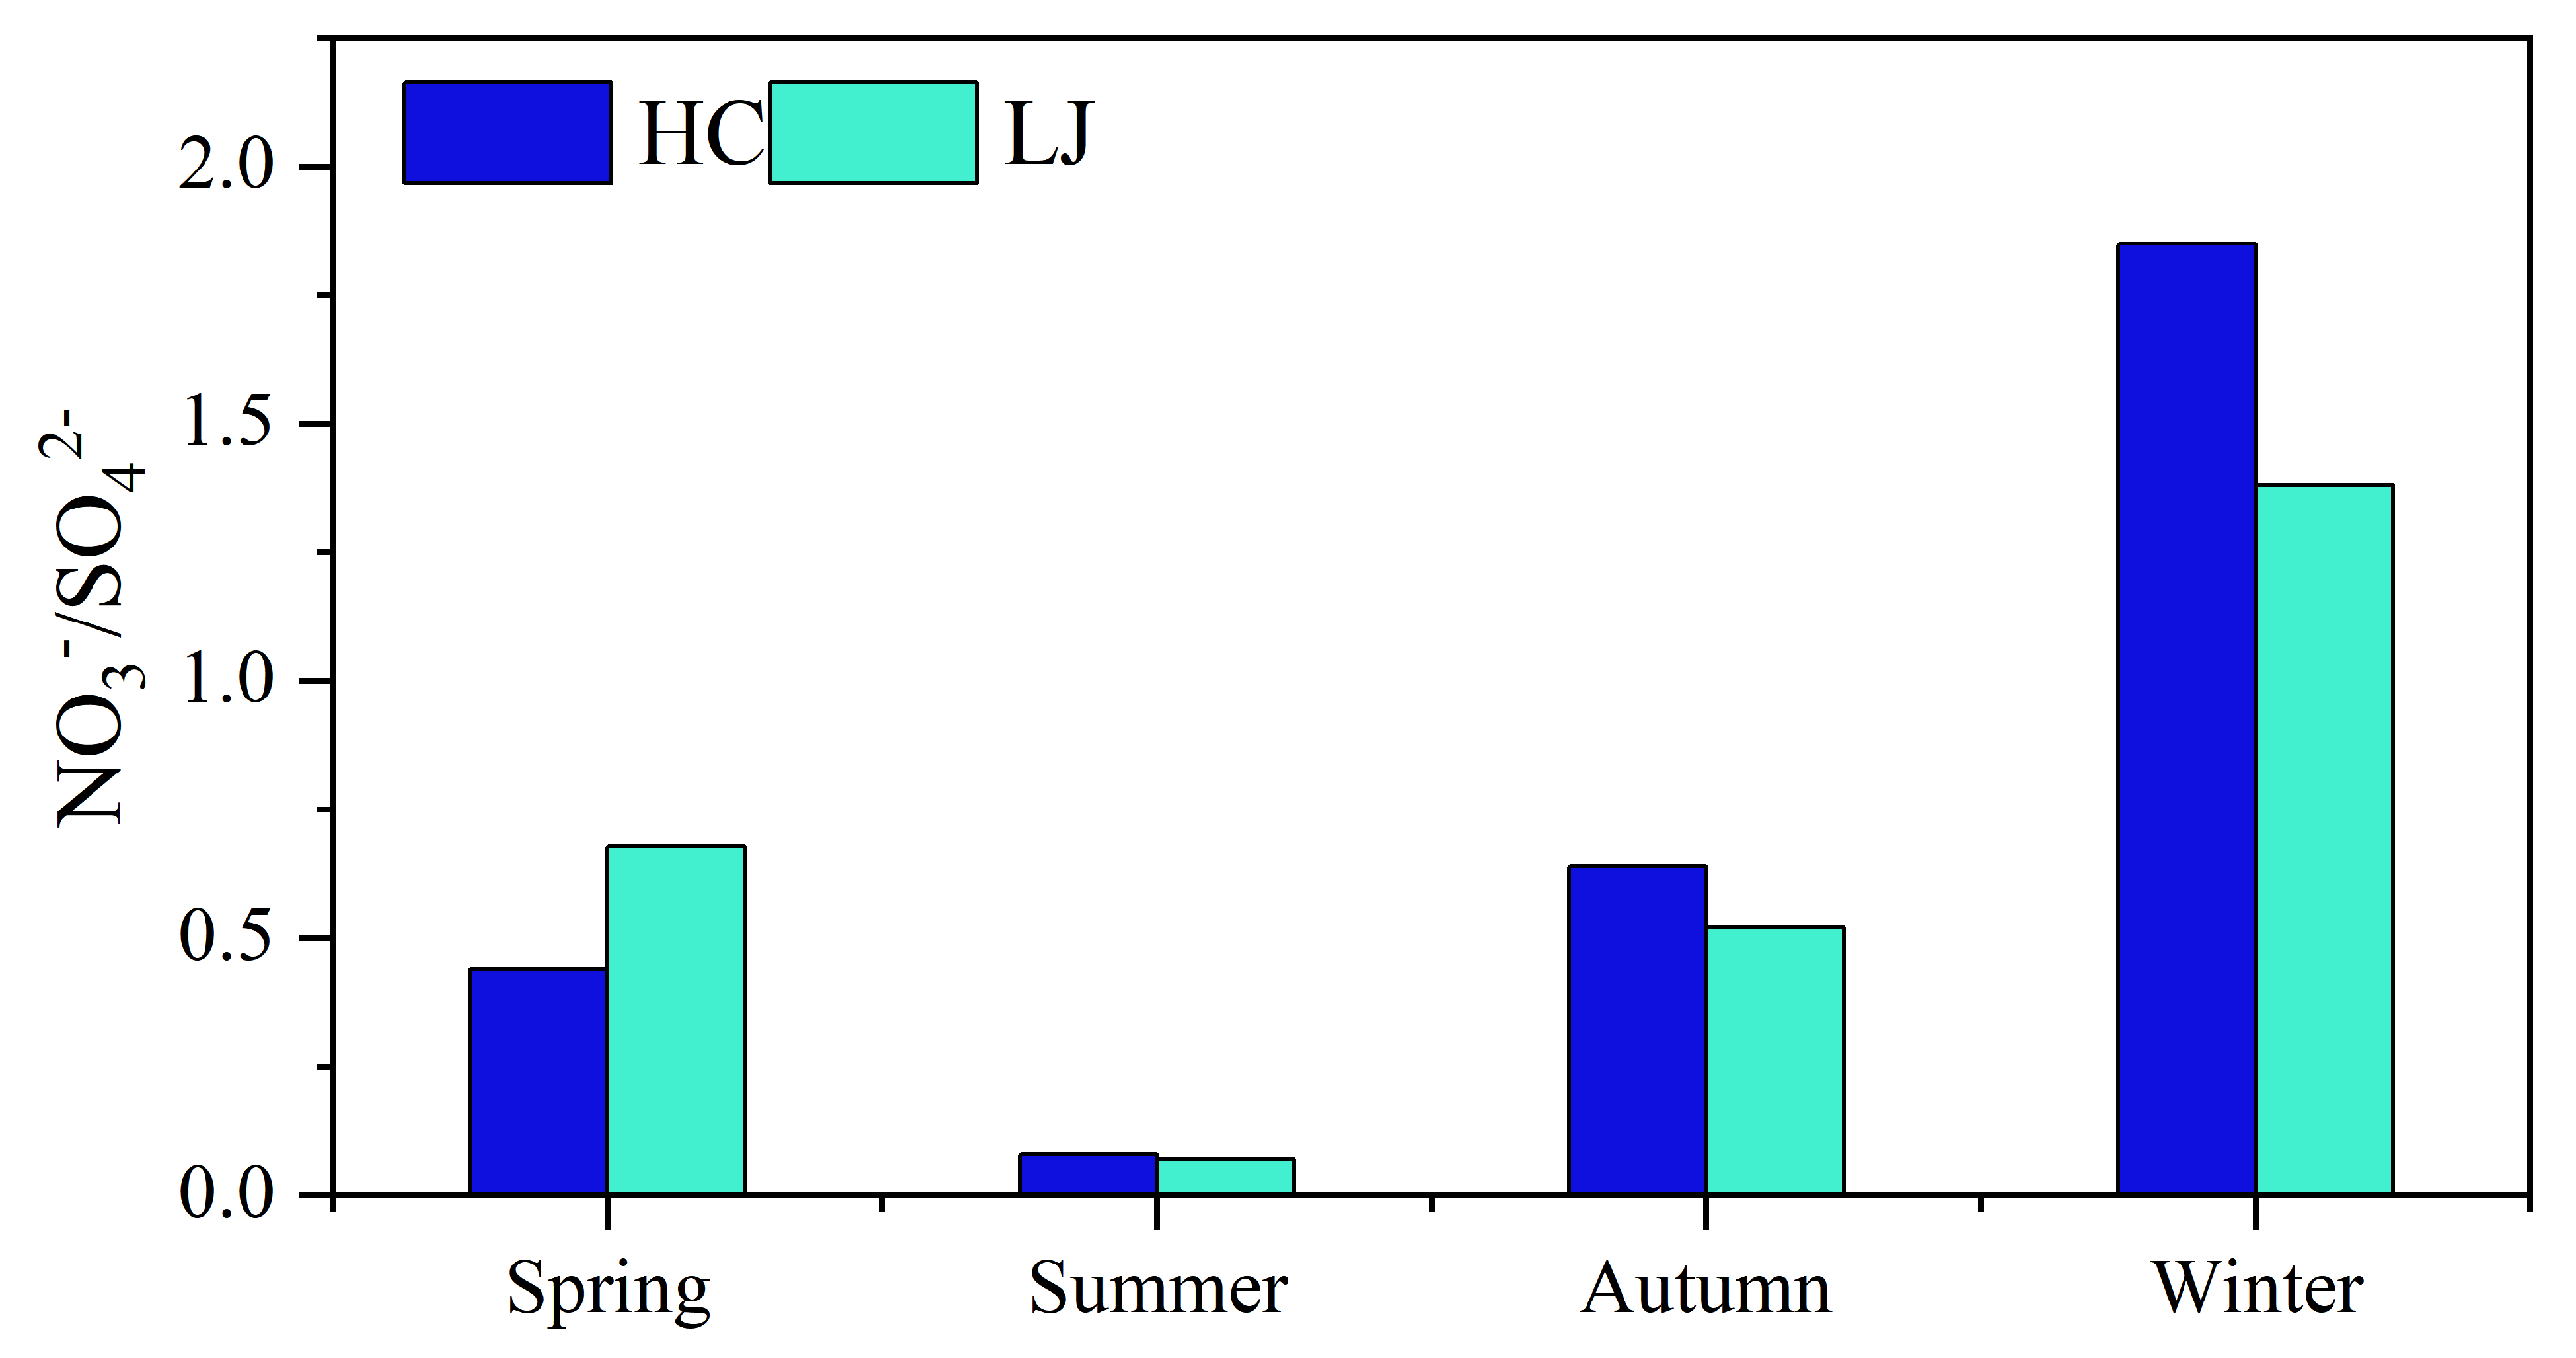
As demonstrated in the relevant literature, the NO3/SO42− mass ratio is a significant indicator in the identification of the sources of nitrogen and sulfur pollution in the atmosphere [33,34]. The ratio, when greater than 1, indicates that NO3 and SO42− originate primarily from mobile sources such as motor vehicle exhausts. When the ratio is less than 1, it signifies that stationary sources, including coal combustion and industrial emissions, contribute predominantly to both [35]. In this study, the annual mean ratios of NO3/SO42− in HC and LJ of Chongqing were 0.75 ± 0.66 and 0.66 ± 0.26, respectively (both < 1). These findings suggest that atmospheric nitrogen and sulfur pollution are predominantly influenced by emissions from stationary sources. However, a notable distinction was observed on a seasonal basis, as illustrated in Figure 5, where the winter ratio exceeded 1. The enhanced contribution from vehicle exhausts may be associated with the secondary nitrate formation mechanism under winter static meteorological conditions and low temperatures [36]. Where the winter ratio exceeded 1, the enhanced contribution from vehicle exhaust may be associated with the secondary nitrate formation mechanism under winter static meteorological conditions and low temperatures (Equation (14)). Temperatures have been shown to inhibit the decomposition of NH4NO3, thereby promoting gas-phase reaction equilibrium towards the production of solid NH4NO3 [37].
NH 3 ( g ) + HNO 3   ( g ) NH 4 NO 3   ( s )
Furthermore, the elevated levels of humidity that are characteristic of the winter months have been shown to promote the dissolution of NO2 and the oxidation processes occurring in the liquid phase. In addition, the rate of HNO3 production is accelerated (see Equations (15)–(17)), and the efficiency of secondary nitrate production is increased via the following reaction pathways [38].
NO 2 + H 2   O HNO 2 + HNO 3
2 NO 2 + H 2   O HNO 2 + HNO 3
HNO 3 ( aq ) + NH 3   ( aq ) NH 4 +   + NO 3
As demonstrated in Equation (18), the oxidation of volatile organic compounds (VOCs) under static weather conditions produces organic nitrate (RONO2), which is subsequently hydrolyzed to HNO3. During extended periods of darkness, the NO3·pathway becomes increasingly dominant in the NO3 [39].
NO 3 + VOCs RONO 2 H 2 O HNO 3 + ROH
By way of contrast, the NO3/SO42− ratios during the spring, summer, and autumn months were found to be less than 1 (0.06–0.63). This is primarily due to the shorter atmospheric residence time of NO3 compared to SO42− during the non-winter season. Additionally, the elevated temperatures characteristic of summer contribute to the thermodynamic volatilization and photochemical decomposition of NH4NO3 (reactions (12) and (13)), thereby hindering the stability of NO3 in the particulate form in PM2.5 [40].

3.2.2. Characterization of SOR and NOR Changes

The sulfur oxidation rate (SOR) and nitrogen oxidation rate (NOR) are pivotal indicators for characterizing the magnitude of secondary production of SO42− and NO3 in the atmosphere, calculated as follows:
S O R = n S O 4 2 n S O 4 2 + n S O 2
N O R = n N O 3 n N O 3 + n N O 2
In this formula, ‘n’ is used to denote the molar concentration, the concentration of the substance of each component. As demonstrated in studies [41,42,43], significant secondary transformations are indicated by SOR, NOR > 0.1, with higher values representing greater oxidation of gaseous precursors (SO2, NOx) to particulate states (SO42−, NO3) [44].
The annual average SOR values for HC and LJ were 0.26 and 0.28, respectively (Figure 6). These values are marginally higher than the mean value for the North China urban agglomeration (0.23) [45]. This finding indicates that the secondary transformations of atmospheric SO2 were active in Chongqing. The highest SOR recorded during the winter months (0.34, 0.37) was primarily attributed to two factors. Firstly, high humidity and low temperature during this season promoted liquid-phase oxidation of SO2 [46]. Secondly, there was an increase in SO2 emissions (see reactions (21)–(23)). HC has the lowest value in spring (0.21), which is related to low solar radiation and weak photochemical processes during spring precipitation. These conditions are not favorable for SO2 transformation [47]; LJ has the lowest value in autumn (0.19).
SO 2   ( g ) + H 2 O ( l ) H 2 SO 3   ( aq )
H 2 SO 3   ( aq ) + O 3   ( g ) H 2 SO 4 ( aq ) + O 2   ( g )
H 2 SO 3 ( aq ) + H 2 O 2   ( aq ) H 2 SO 4 ( aq ) + H 2 O ( l )
The annual average NOx emission rate in the two regions is 0.10 and 0.05, respectively, representing 19% and 37% of the SOR. This disparity can be attributed to the lower efficiency of NOx to NO3 compared to SO2 to SO42−. Additionally, NOx plays a pivotal role in the primary photolytic reaction of O3 production during the daylight hours, as evidenced by Equations (24) and (25) [48]. As demonstrated in Reactions (12) and (13), NH4NO3 decomposes readily at temperatures above > 25 °C [49]. This results in the lowest NOR (0.02, 0.01) during the summer months.
NO 2   + h ν NO + O
O + O 2   O 3
The simultaneous increase in SOR and NOR in winter may be related to the following synergistic mechanisms: the presence of static meteorological conditions, characterized by low wind speed, and the presence of an inversion layer have been observed to impede the diffusion of pollutants [50,51,52]. This phenomenon has been shown to extend the oxidation time of SO2 and NOx, thereby promoting the occurrence of oxidative reactions. The process of neutralization of NH3 is neutralized by acids (H2SO4, HNO3), resulting in the formation of secondary particulate matter, namely (NH4)2SO4 and NH4NO3 [53] (see Equations (32) and (33)).
Liquid   phase   oxidation :   SO 2 ( g ) + H 2 O 2   ( aq ) H 2 SO 4   ( aq )
Vapor phase oxidation:
SO 2   ( g ) + OH ( g ) HOSO 2   O 2   , H 2 O   H 2 SO 4   ( aq )
Daylight photochemical oxidation to O3:
NO 2   ( g ) + h ν NO ( g ) + O ( g )
O ( g ) + O 2   ( g ) O 3   ( g )
Nocturnal nitrate NO3 production:
NO 2 ( g ) + O 3   ( g ) NO 3   ( g ) + O 2   ( g )
NO 3   ( g ) + NO 2   ( g ) N 2 O 5   ( g ) H 2 O   2 HNO 3   ( aq )
2 NH 3 ( g ) + H 2 SO 4   ( aq ) ( NH 4   ) 2 SO 4   ( s )
NH 3 ( g ) + HNO 3   ( aq ) NH 4   NO 3   ( s )

3.2.3. Cation–Anion Balance Analysis

By the principle of charge balance, the charge quantities of anions and cations, as measured in water-soluble ionic components, are expected to be consistent. Consequently, the anion and cation charge numbers AE and CE of the water-soluble ionic component data can be calculated and compared separately to ascertain the validity of the data. Concurrently, the ratio is a pivotal metric in the study of environmental acidity.
AE = ρ SO 4 2 × 2 96 + ρ NO 3 62 + ρ Cl 35.5
CE = ρ NH 4 + 18 + ρ K + 39 + ρ Mg 2 + × 2 24 + ρ Ca 2 + × 2 40 + ρ Na + 23
As demonstrated in Figure 7, a substantial correlation between AE and CE was identified across all seasons, thereby substantiating the hypothesis that the eight measured ions constitute the predominant components of the PM2.5 ion composition. The annual average AE/CE ratios (slope of the linear regression) for HC and LJ were 0.87 and 0.89, respectively, indicating that the PM2.5 aerosols in both regions exhibit weak alkalinity. Analogous PM2.5 acidity patterns (AE/CE slope < 1) were also observed in the three small cities of Fuling, Beibei, and Wanzhou in Chongqing [54].
The majority of HC samples collected in spring and winter exhibited a balanced ratio of cations and anions, with a slope of approximately 1. In contrast, the slopes of the lines for summer and autumn were 0.82 and 0.97, respectively, suggesting weaker alkalinity. The majority of LJ samples in all four seasons demonstrate weak alkalinity.

3.3. Analysis of PM2.5 Sources

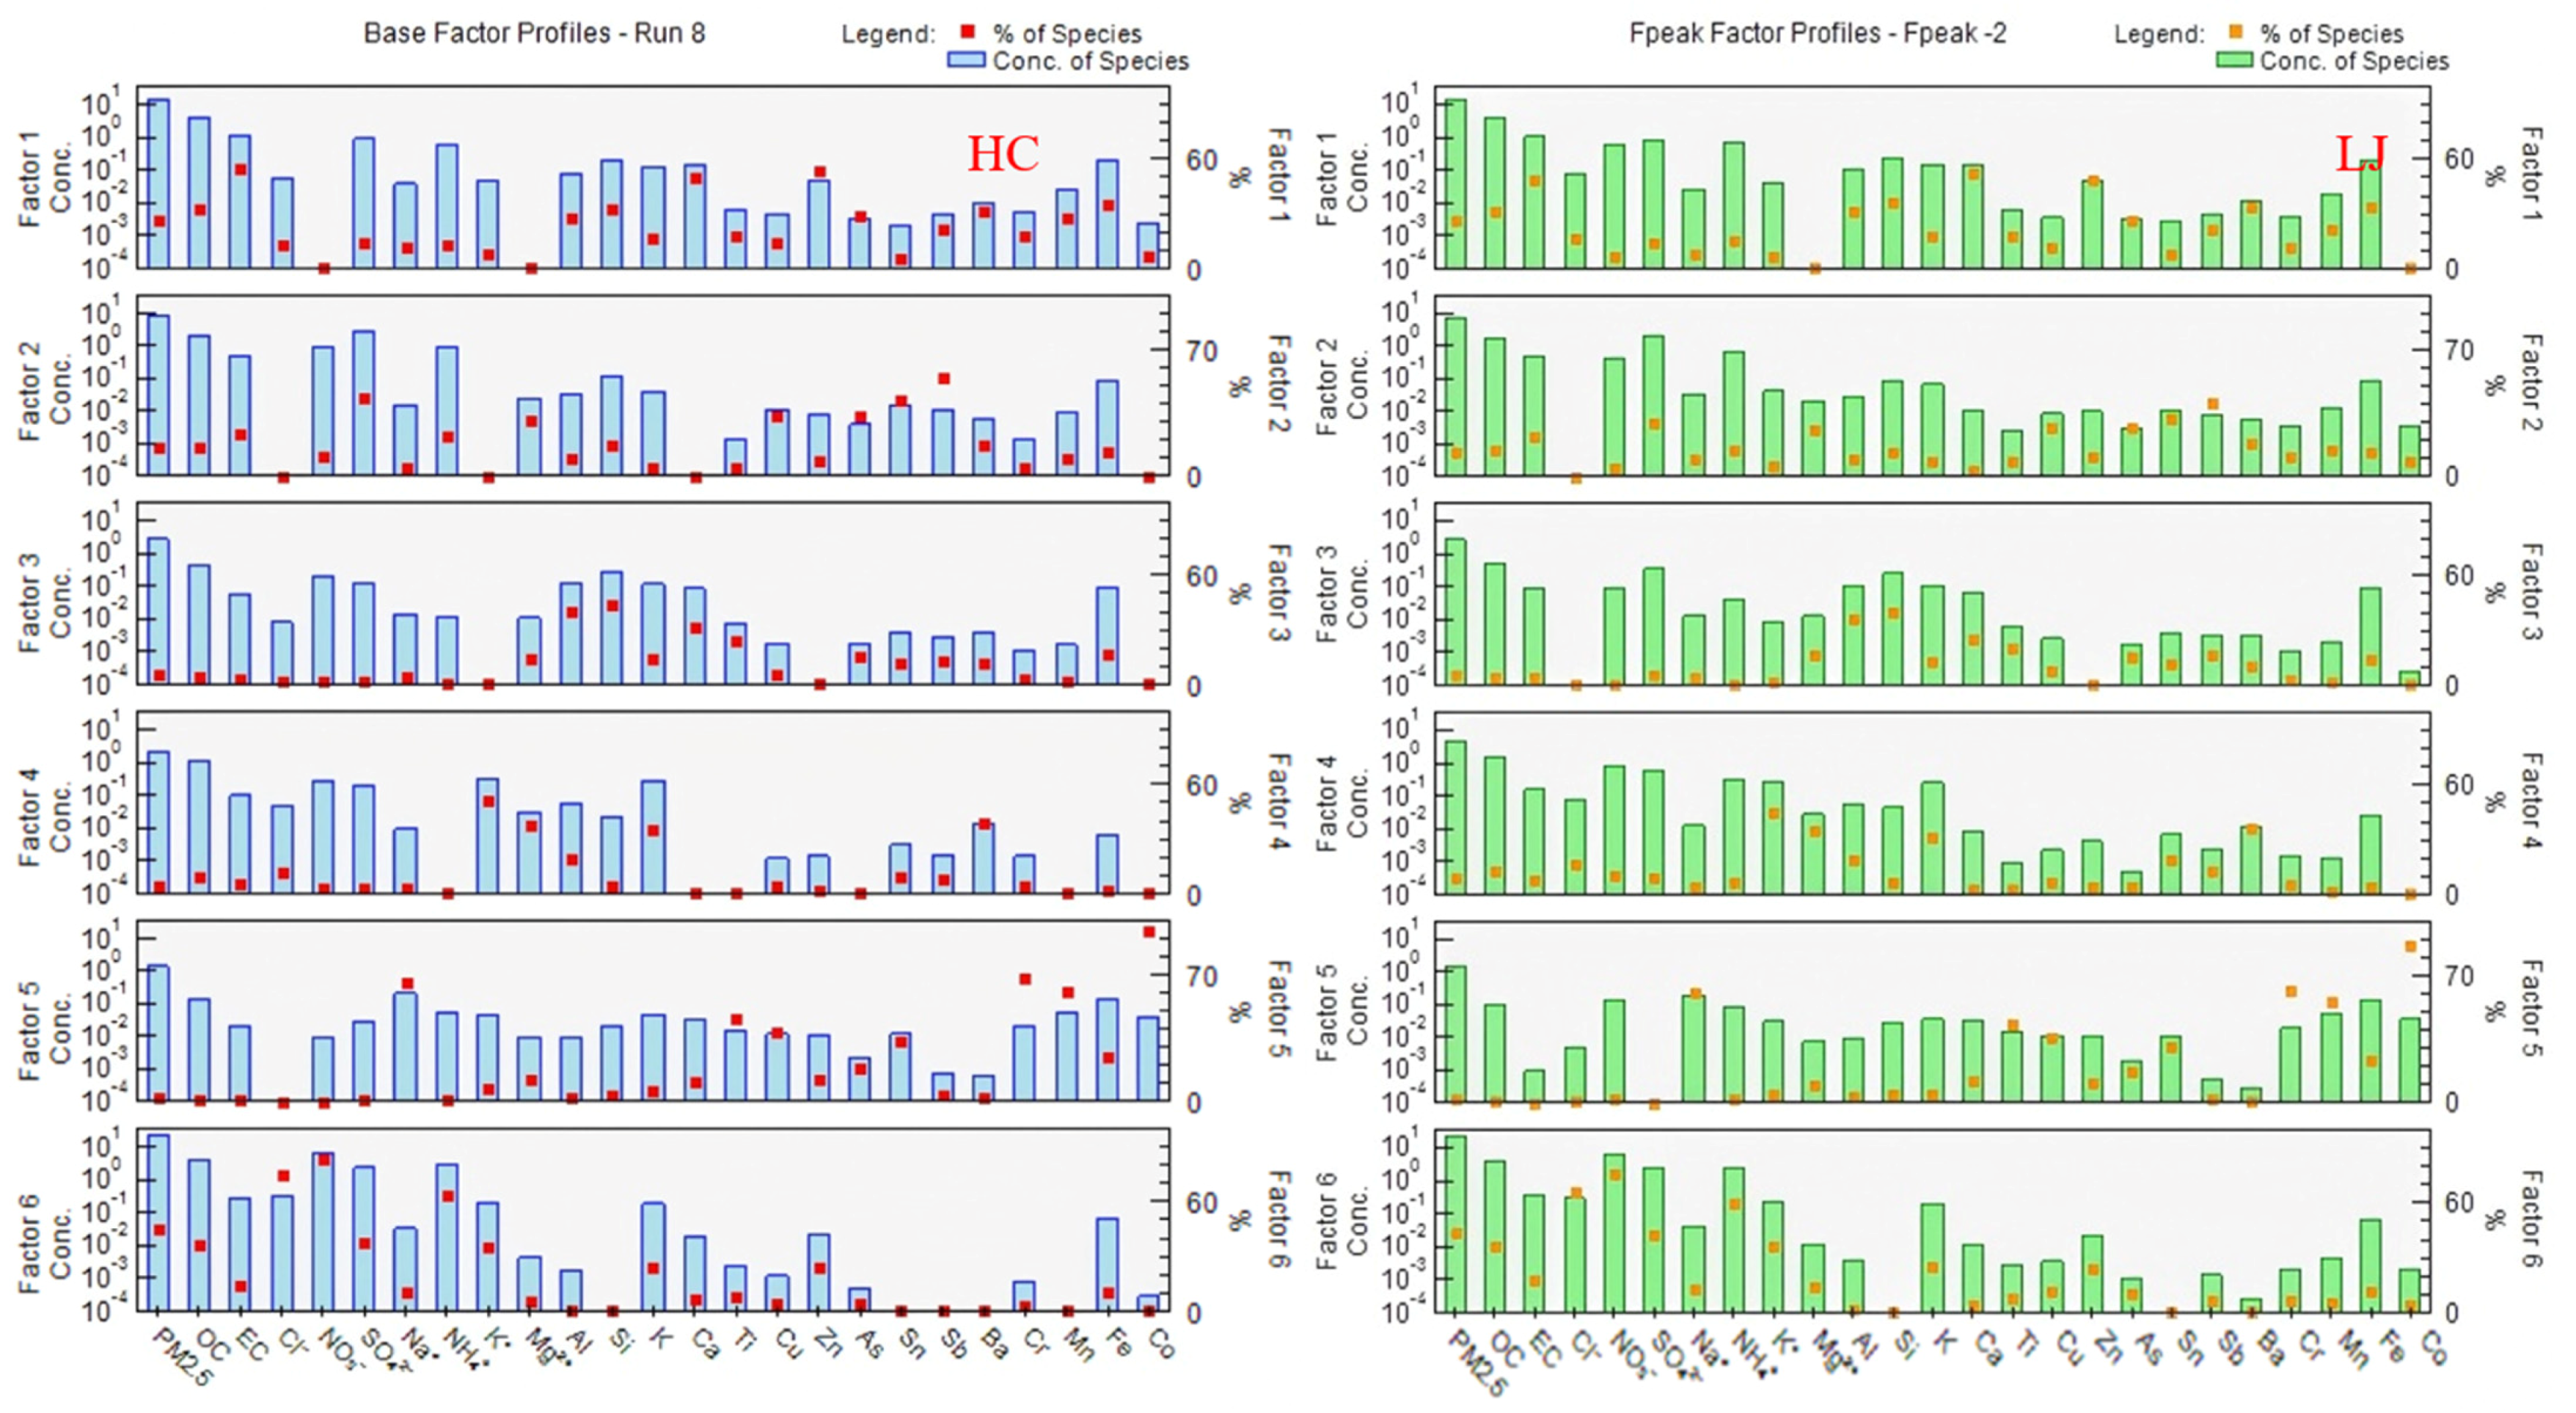
In the PMF model of this study, the dQ values for HC and LJ are both 0, and the ΔQ values are both less than 0.1%. The displacement analysis (DISP) of both models revealed no occurrence of factor exchange. For the BS displacement analysis, all variables related to factor identification were selected for displacement, and the mapping ratio between the guiding factors and basic factors was greater than or equal to 80%. According to the U.S. Environmental Protection Agency’s PMF 5.0 User Guide [55], if the mapping ratio between the guiding factor and the base factor exceeds 80%, then the uncertainty of the guiding method can be considered explainable, and the number of factors may be appropriate. Consequently, based on the BS mapping, DISP exchange, and BS-DISP analysis results, the optimal benchmark operation scheme should utilize six factors. The analyzed factor spectrum and factor contribution plots are demonstrated in Figure 8. As illustrated in the figure on the left, the HC is accompanied by six identified factors, which are classified as secondary sources and characterized by SO42−, NO3, and NH4+ [56]. Additionally, the factors are considered transport sources and are distinguished by NO3, EC, OC, Ba, Sb, and Zn [57]. The following elements are considered industrial sources: Pb, Zn, Cr, Ni, Cd, SO42−, NH4+, and Cu [58]. The following elements are considered combustion sources: K, K+, OC, and EC [59]. The following elements are considered dust sources: Si, Al, Ca, Mg, Fe, Ca2+, and Mn [60]. The figure on the right presents the LJ, with factors 1–6 representing traffic sources, industrial sources, dust sources, combustion sources, other sources, and secondary sources, respectively.
The contribution rate of the primary sources of PM2.5 in HC and LJ of Chongqing City for the entire year is demonstrated in Figure 9. The following sources were found to be the primary contributors to PM2.5 pollution sources in HC, in descending order: secondary mixed sources (44.3%), traffic sources (19.5%), combustion sources (15.4%), dust sources (8.8%), industrial sources (8.5%), and other sources (3.4%). Secondary mixed sources are found to be the most prevalent, accounting for more than 40% of the total. The following classification of pollution sources in LJ is proposed: secondary mixed sources (43.8%), traffic sources (26.1%), industrial sources (13.6%), combustion sources (8.6%), dust sources (5.2%), and other sources (2.6%). As with HC, secondary mixed sources are the primary contributors; however, the contribution of transport and industrial sources is considerably higher than in HC. The proportion of transport sources in LJ (26.1%) is considerably higher than in HC (19.5%), a discrepancy that can be attributed to the high density of the transport network and the prevalence of car ownership in a newly developed national territory. The contribution of industrial sources in LJ (13.6%) is 1.6 times higher than in HC (8.5%), reflecting the characteristics of its industrial agglomeration. Conversely, the share of combustion sources in HC (15.4%) is higher than in LJ (8.6%), which may be related to primary emissions from agricultural activities. The contribution of dust was found to be comparable in both regions, with percentages of 8.8% and 5.2% recorded in HC and LJ, respectively.

4. Conclusions and Recommendations

4.1. Conclusions

This comprehensive study systematically characterized PM2.5 water-soluble inorganic ions (WSIIs) and resolved pollution sources through year-long monitoring (2023) in two representative areas of Chongqing, utilizing ion chromatography and EPA PMF 5.0 modelling. The study’s key findings indicate significant seasonal variations in PM2.5 levels and identify secondary inorganic aerosols as the predominant source of pollution.
The PM2.5 mass concentration exhibited a significant seasonal peak in winter (64 ± 27 μg/m3), surpassing the summer levels (19.7 ± 2 μg/m3) by a factor of 3.25. This observation underscores the critical role of basin topography and adverse winter meteorology in modulating air quality. Water-soluble ions constituted 28–29% of annual PM2.5 mass, with secondary inorganic components (SNA: SO42−, NO3, NH4+) dominating total WSIIs (47–85%). The annual mean NO3/SO42− ratios (0.69–0.80, <1) indicated stationary sources as the primary emitters. However, winter ratios > 1 highlighted increased contributions from mobile sources under low-temperature conditions, which favored NH4NO3 stability. It was found that the sulfur oxidation rate (SOR: 0.35–0.37) significantly exceeded the nitrogen oxidation rate (NOR: 0.08–0.13). This finding indicates that SO2-to-sulfate conversion is more efficient under these conditions, and is enhanced by high humidity and liquid-phase reactions. In addition, it was observed that summer thermodynamic decomposition limited particulate nitrate.
PMF source apportionment has identified six primary contributors. Secondary mixed sources (43.8–44.3%) were identified as the dominant year-round factor, followed by traffic (19.5–26.1%) and industrial sources (8.5–13.6%), with combustion (8.6–15.4%) and dust (5.2–8.8%) also noted. It is crucial to note that the urban LJ area exhibited higher contributions from traffic (26.1%) and industrial sources (13.6%), reflecting its dense transportation networks and industrial agglomeration. In contrast, the peri-urban HC area demonstrated greater influence from combustion (15.4%) and dust sources (8.8%).
The findings of this study are closely related to the unique topography of Chongqing and its local emission sources, and therefore cannot be directly generalized to other regions.

4.2. Recommendations

Secondary mixing sources (43.8–44.3%) are the primary contributors to PM2.5 pollution in Chongqing. Policies should prioritize the synergistic control of SO2, NOx, and NH3, which are key precursors to sulfate, nitrate, and ammonium (SNA) aerosols. Given the considerable contribution of transportation sources (19.5–26.1%) in urban areas (LJ), it is recommended that the phase-out of old vehicles and non-road mobile machinery be accelerated; that the use of low-sulfur diesel be promoted to reduce pollutant emissions; that strengthened diesel sampling, inspections, and enforcement efforts be implemented; and that there be strict enforcement of laws against the use of substandard fuel and counterfeit products. Furthermore, it is recommended that inspections of high-emission vehicles emitting black smoke be intensified and that the popularization of new energy vehicles be accelerated. In the context of industrial sources, it is imperative to prioritize the acceleration of the implementation of ultra-low emissions retrofits and the deep treatment of exhaust gases. This is of particular importance for key industries such as thermal power, steel, and cement. Furthermore, it is imperative to implement two key replacement strategies: production capacity replacement and pollutant emission double replacement. These measures are crucial for the effective management of new high-energy-consuming and high-emission projects. This approach is instrumental in controlling emission increases at the source while ensuring the ongoing phase-out of enterprises with outdated production capacity, non-compliant environmental standards, and excessive energy consumption. Moreover, it is imperative to reduce the proportion of coal in industrial energy consumption and to promote clean energy sources such as natural gas and electricity. In suburban areas (HC), combustion sources (15.4%) are more prevalent. In the context of biomass burning, a multifaceted approach is advocated, encompassing the delineation of legal responsibilities, the augmentation of supervisory mechanisms through technical monitoring and grid patrols, and the diversification of straw utilization pathways, such as its reinstatement in agricultural fields, its conversion into electricity, or its use as a fuel source. In addition, the standardization of waste disposal and the promotion of alternative behaviors are recommended.
In future research, a comparative analysis with existing studies on cities similar to Chongqing can be conducted, and time series modelling techniques, including recurrent neural networks (RNNs) and long short-term memory (LSTM) networks [61,62], can be utilized to accurately predict PM2.5 concentrations. This will provide a scientific basis for formulating more accurate PM2.5 control strategies to meet the unique needs of regions similar to Chongqing.

Author Contributions

Methodology, J.W. and M.F.; Software, S.T. and J.W.; Formal analysis, S.T.; Investigation, S.T., J.W. and Y.Z.; Resources, J.Y. and W.H.; Data curation, J.W. and Y.Z.; Writing—original draft, S.T., M.F., W.H. and Y.Z.; Writing—review & editing, S.T., J.W., M.F. and J.Y.; Visualization, S.T.; Supervision, M.F. and J.Y.; Project administration, J.Y. and W.H.; Funding acquisition, J.Y. and W.H. All authors have read and approved the manuscript for publication.

Funding

This research was supported by the National Key Research and Development Programme of China (No. 2023YFC3709303 and No. 2023YFC3709302).

Institutional Review Board Statement

Not applicable.

Informed Consent Statement

Not applicable.

Data Availability Statement

The data presented in this study are available upon request from the corresponding author. Data cannot be released due to privacy.

Acknowledgments

Declaration of generative AI and AI-assisted technologies in the writing process: during the preparation of this work, the authors used ChatGPT 3.5 in order to improve their language. After using this tool, the authors reviewed and edited the content as needed and take full responsibility for the content of the publication.

Conflicts of Interest

The authors declare no conflict of interest.

References

  1. Ni, Y.; Shi, G.; Qu, J. Indoor PM2.5, Tobacco Smoking and Chronic Lung Diseases: A Narrative Review. Environ. Res. 2020, 181, 108910. [Google Scholar] [CrossRef] [PubMed]
  2. Bari, M.A.; Kindzierski, W.B. Fine Particulate Matter (PM2.5) in Edmonton, Canada: Source Apportionment and Potential Risk for Human Health. Environ. Pollut. 2016, 218, 219–229. [Google Scholar] [CrossRef] [PubMed]
  3. Zang, S.-T.; Wu, Q.-J.; Li, X.-Y.; Gao, C.; Liu, Y.-S.; Jiang, Y.-T.; Zhang, J.-Y.; Sun, H.; Chang, Q.; Zhao, Y.-H. Long-Term PM2.5 Exposure and Various Health Outcomes: An Umbrella Review of Systematic Reviews and Meta-Analyses of Observational Studies. Sci. Total Environ. 2022, 812, 152381. [Google Scholar] [CrossRef] [PubMed]
  4. Basu, R.; Pearson, D.; Ebisu, K.; Malig, B. Association Between PM2.5 and PM2.5 Constituents and Preterm Delivery in California, 2000–2006. Paediatr. Perinat. Epidemiol. 2017, 31, 424–434. [Google Scholar] [CrossRef]
  5. Reff, A.; Bhave, P.V.; Simon, H.; Pace, T.G.; Pouliot, G.A.; Mobley, J.D.; Houyoux, M. Emissions Inventory of PM2.5 Trace Elements across the United States. Environ. Sci. Technol. 2009, 43, 5790–5796. [Google Scholar] [CrossRef]
  6. Wallraff, J.P.; Ungeheuer, F.; Dombrowski, A.; Oehlmann, J.; Vogel, A.L. Occurrence and In Vitro Toxicity of Organic Compounds in Urban Background PM2.5. Sci. Total Environ. 2022, 817, 152779. [Google Scholar] [CrossRef]
  7. Arhami, M.; Shahne, M.Z.; Hosseini, V.; Haghighat, N.R.; Lai, A.M.; Schauer, J.J. Seasonal Trends in the Composition and Sources of PM2.5 and Carbonaceous Aerosol in Tehran, Iran. Environ. Pollut. 2018, 239, 69–81. [Google Scholar] [CrossRef]
  8. Gao, J.; Wang, K.; Wang, Y.; Liu, S.; Zhu, C.; Hao, J.; Liu, H.; Hua, S.; Tian, H. Temporal-Spatial Characteristics and Source Apportionment of PM2.5 as Well as Its Associated Chemical Species in the Beijing-Tianjin-Hebei Region of China. Environ. Pollut. 2018, 233, 714–724. [Google Scholar] [CrossRef]
  9. Wu, S.-P.; Cai, M.-J.; Xu, C.; Zhang, N.; Zhou, J.-B.; Yan, J.-P.; Schwab, J.J.; Yuan, C.-S. Chemical Nature of PM2.5 and PM10 in the Coastal Urban Xiamen, China: Insights into the Impacts of Shipping Emissions and Health Risk. Atmos. Environ. 2020, 227, 117383. [Google Scholar] [CrossRef]
  10. Si, R.; Xin, J.; Zhang, W.; Tian, Y.; Xu, X.; Wen, T.; Ma, Y.; Ma, Y.; Cao, Y.; Liu, Z. The Environmental Benefit of Beijing-Tianjin-Hebei Coal Banning Area for North China. J. Environ. Manag. 2022, 311, 114870. [Google Scholar] [CrossRef]
  11. Wang, L.; Zhang, Z.; Gu, Z. Demarcation of Coordinated Prevention and Control Regions in the Yangtze River Delta Based on Spatio-Temporal Variations in PM2.5 and O3 Concentrations. Atmosphere 2022, 13, 1300. [Google Scholar] [CrossRef]
  12. Zheng, Y.; Zeng, W.; Chang, S.; Wang, L.; Liao, C.; Zhang, Y. CO2 Synergistic Emission Reduction and Health Benefits of PM2.5 Reaching WHO-III Level in Pearl River Delta. Atmos. Environ. 2024, 326, 120441. [Google Scholar] [CrossRef]
  13. Sun, A.; Huang, Y.; Huang, C. Cascading Failure Mechanism of Major Drainage System in Mountainous City: Taking the Basin of the Main Urban Area of Chongqing as an Example, China. Ecol. Indic. 2024, 158, 111353. [Google Scholar] [CrossRef]
  14. Lv, Z.; Yang, A.; Wang, Y. Characteristics, Drivers, and Development Modes of Rural Space Commercialization under Different Altitude Gradients: The Case of the Mountain City of Chongqing. Land 2023, 12, 1028. [Google Scholar] [CrossRef]
  15. Fang, Z.; Liu, Z.; Hu, Y. Spatial Correlation Effect of Haze Pollution in the Yangtze River Economic Belt, China. PLoS ONE 2024, 19, e0311574. [Google Scholar] [CrossRef] [PubMed]
  16. Liu, Y.; Sun, Q.; Zhong, M.; Zuong, B.; Luo, K. Temporal and Spatial Distribution Characteristics of PM2.5 in Chongqing Urban Areas. Huan Jing Ke Xue = Huanjing Kexue 2016, 37, 1219–1229. [Google Scholar]
  17. Hu, M.; Zhang, H.; Tang, J.; Yan, S. Zoning and Optimization Strategies of Land Spatial Ecological Restoration in Liangjiang New Area of Chongqing Based on the Supply–Demand Relationship of Ecosystem Services. Land 2023, 12, 1255. [Google Scholar] [CrossRef]
  18. Wang, R.; Min, J.; Li, Y.; Hu, Y.; Yang, S. Analysis on Seasonal Variation and Influencing Mechanism of Land Surface Thermal Environment: A Case Study of Chongqing. Remote Sens. 2022, 14, 2022. [Google Scholar] [CrossRef]
  19. Luan, C.; Liu, R.; Zhang, Q.; Sun, J.; Liu, J. Multi-Objective Land Use Optimization Based on Integrated NSGA–II–PLUS Model: Comprehensive Consideration of Economic Development and Ecosystem Services Value Enhancement. J. Clean. Prod. 2024, 434, 140306. [Google Scholar] [CrossRef]
  20. Luo, B.-L.; Li, J.-W.; Gong, C.-M.; Zhong, S.-Q.; Wei, C.-F. Driving Forces and Their Interactions of Soil Erosion in Soil and Water Conservation Regionalization at the County Scale with a High Cultivation Rate. J. Mt. Sci. 2023, 20, 2502–2518. [Google Scholar] [CrossRef]
  21. Wang, Q. Research on Rural Industry Revitalization in Chongqing. 2022. Available online: https://link.cnki.net/doi/10.27163/d.cnki.gjlnu.2022.000184 (accessed on 24 August 2025).
  22. Tian, X. Research on the Spatial Response of Industrial Development in the Core Area of Chengdu and Chongqing. 2021. Available online: https://link.cnki.net/doi/10.27670/d.cnki.gcqdu.2021.004598 (accessed on 24 August 2025).
  23. Karakas, F.; Imamoglu, I.; Gedik, K. Positive Matrix Factorization Dynamics in Fingerprinting: A Comparative Study of PMF2 and EPA-PMF3 for Source Apportionment of Sediment Polychlorinated Biphenyls. Environ. Pollut. 2017, 220, 20–28. [Google Scholar] [CrossRef]
  24. Reff, A.; Eberly, S.I.; Bhave, P.V. Receptor Modeling of Ambient Particulate Matter Data Using Positive Matrix Factorization: Review of Existing Methods. J. Air Waste Manag. Assoc. 2007, 57, 146–154. [Google Scholar] [CrossRef]
  25. Yang, L.; Cheng, P.; Liu, X.; Zhang, H.; Cao, Y. Climatic Characterisation of Strong Convective Weather in the Longdong Region, 1970–2019. Desert Oasis Meteorol. 2023, 17, 25–31. [Google Scholar]
  26. Zhang, Y. Research on the Origin and Distribution of Offshore Wind and Wave Energy Resources Influencing Adverse Weather Constraints. 2022. Available online: https://link.cnki.net/doi/10.27314/d.cnki.gsscu.2022.000134 (accessed on 24 August 2025).
  27. Yang, J.; Wang, Y.; Xie, K.; Peng, K.; Yang, J. Analysis of Air Quality Characteristics and Pollution Source Areas in Guiyang City, 2023. Green Technol. 2024, 26, 120–128. [Google Scholar]
  28. Mu, K.; Jiang, Y.; Rao, Z.; Luo, H.; Zhang, J.; Chen, J.; Luo, X.; Feng, Q. Variation Trend and Pollution Characteristics of Ambient Air Quality in Sichuan Province from 2015 to 2022. Environ. Monit. China 2024, 40, 94–108. [Google Scholar] [CrossRef]
  29. Liu, G.N.; Zhang, J.; Hu, H.; Chen, N.; Zhang, X.; Huang, H. Seasonal Variation Characteristics of Carbonaceous Fraction in PM2.5 of Urban Expressways Area in Wuhan City. Environ. Monit. China 2025, 41, 99–110. [Google Scholar] [CrossRef]
  30. Liu, J.; Shi, J.; Jiang, M.; Cai, Z.; Yao, Q.; Han, S. Aerosol Optical Properties and Direct Radiative Forcing in Tianjin. China Environ. Sci. 2024, 44, 6590–6599. [Google Scholar] [CrossRef]
  31. Lu, R.; Cao, F.; Lin, Y.; Wu, C.; Zhang, Y. Size Distribution and Source Apportionment of Chemical Compositions in Nanjing Atmospheric Particulate Matter. Ecol. Environ. Sci. 2024, 33, 1079–1088. [Google Scholar] [CrossRef]
  32. Stelson, A.; Seinfeld, J. Thermodynamic Prediction of the Water Activity, NH4NO3 Dissociation Constant, Density and Refractive Index for the NH4NO3-(NH4) 2SO4-H2O System at 25 °C. Atmos. Environ. 1982, 16, 2507–2514. [Google Scholar] [CrossRef]
  33. Arimoto, R.; Duce, R.; Savoie, D.; Prospero, J.; Talbot, R.; Cullen, J.; Tomza, U.; Lewis, N.; Ray, B. Relationships among Aerosol Constituents from Asia and the North Pacific during PEM-West A. J. Geophys. Res. Atmos. 1996, 101, 2011–2023. [Google Scholar] [CrossRef]
  34. Wang, Y.; Zhuang, G.; Tang, A.; Yuan, H.; Sun, Y.; Chen, S.; Zheng, A. The Ion Chemistry and the Source of PM2.5 Aerosol in Beijing. Atmos. Environ. 2005, 39, 3771–3784. [Google Scholar] [CrossRef]
  35. Wu, D.; Lin, S.; Yang, H.; Du, R.; Xia, J.; Qi, B.; Liu, G.; Li, F.; Yang, M.; Gai, X. Pollution Characteristics and Light Extinction Contribution of Water-soluble Ions of PM2.5 in Hangzhou. Environ. Sci. 2017, 38, 2656–2666. [Google Scholar] [CrossRef]
  36. Zhao, W. Research on Catalytic Oxidation of NO and Mechanism of Sulfur Resistance over Supported-Perovskites. 2015. Available online: https://kns.cnki.net/kcms2/article/abstract?v=aR5N6Ks7Vo1A0MmP9oDQnZQbZTU6zBVC4vOx9ZMw0zUKFWrXaNxHmVrq6Um9wHtj1nz5Bi8_RObJJ9T55iKnv29aCb-DBHNG_Strv885NVe1ghXFJwuXcQA-hG4ftglZXvoXoxpRVQvozTkarZs-lFppIfwbr1wB26m2ph1Z56bFMKvW6aXLhgCj3Zcw09dvFtiWgfopqUo=&uniplatform=NZKPT&language=CHS (accessed on 24 August 2025).
  37. Stelson, A.; Seinfeld, J.H. Relative Humidity and Temperature Dependence of the Ammonium Nitrate Dissociation Constant. Atmos. Environ. 1982, 16, 983–992. [Google Scholar] [CrossRef]
  38. Seinfeld, J.H.; Pandis, S.N. Atmospheric Chemistry and Physics: From Air Pollution to Climate Change; John Wiley & Sons: Hoboken, NJ, USA, 2016. [Google Scholar]
  39. Brown, S.S.; Stutz, J. Nighttime Radical Observations and Chemistry. Chem. Soc. Rev. 2012, 41, 6405–6447. [Google Scholar] [CrossRef] [PubMed]
  40. Kaijie, H.; Youjiang, H.; Xin, Y.; Cheng, M.; Fuqiang, L.; Yujie, P.; Bin, L. Research on the Characteristics of Atmospheric NH3 Pollution and Influencing Factors in Shihezi City. Environ. Eng. 2024, 42, 162–170. [Google Scholar]
  41. Zu, K.; Gong, Y.; Dong, H.; Song, M.; Lu, K. Characteristics of Water-Soluble Inorganic in PM2.5 in Kunming, Based on Line Monitoring. Acta Sci. Nat. Univ. Pekin. 2025, 61, 265–276. [Google Scholar] [CrossRef]
  42. Xu, Y.; Fu, G.; Sheng, H.; Yue, L.; Sun, P.; Luo, Y.; Cao, J.; Cao, X.; Chen, Y. PM2.5 Pollution Characteristics and Source Apportionment in A Typical Industrial City of Henan Province During Autumn and Winter. Environ. Eng. 2024, 42, 136–144. [Google Scholar] [CrossRef]
  43. Wang, C.; Zhang, X.; Lei, Y.; Huang, X.; Wang, J.; Yin, L.-H.; Wang, C. Analysis of PM2.5 Components During Continuous Spring Pollution in Sichuan Basin Based on WRF-CMAQ Model. Ecol. Environ. Sci. 2024, 33, 1214–1226. [Google Scholar] [CrossRef]
  44. Li, Y.; Sha, J.; Gui, J.; Gao, W.; Fei, X.; Xu, P.; Hu, B.; Yang, A. Research on the Characteristics, Sources, and Formation Influence of Water-Soluble Inorganic Components in PM2.5 in Huaxi District, Guiyang. J. Environ. Sci. 2025, 45, 394–404. [Google Scholar] [CrossRef]
  45. Zhang, Y. Characteristics and Sources of Pm,S Components in the eastern Part of North China Plain. 2020. Available online: https://link.cnki.net/doi/10.26939/d.cnki.gbhgu.2020.000634 (accessed on 24 August 2025).
  46. Peng, Y. Pollution Characteristics, Influencing Factors and Sources of Secondary Inorganic Components in PM10 in Jinhua Urban Area. 2021. Available online: https://link.cnki.net/doi/10.27464/d.cnki.gzsfu.2021.000518 (accessed on 24 August 2025).
  47. Shen, L.; Liu, C.; Wang, H.; Diao, Y.; Shi, S.; Zhao, T. Changes of Wet Precipitation Flux and Pollutants Associated with at Chongqing Urban Station from 2008 to 2020 and Influencing Factors. Earth Environ. 2024, 52, 576–587. [Google Scholar] [CrossRef]
  48. Wang, S.; Zhang, J. The Holiday Effect of Environmental Air Quality in Urumgi City. Arid Environ. Monit. 2025, 39, 21–33. [Google Scholar]
  49. Wang, M.; Li, Y.; You, Z.; Ni, Y.; Luo, L. Analysis of the Causes of Synergistic O3 and PM2.5 Pollution in Winter in Haikou, a Clean Air Region. Environ. Chem. 2025, 44, 890–902. [Google Scholar]
  50. He, S.; Wang, C.; Cheng, S. Characteristics and Influencing Factors of Double-High PM2.5-O3 Composite Pollution in Baoding City. Environ. Sci. 2025, 46, 1285–1301. [Google Scholar] [CrossRef]
  51. Wang, G.; Xie, Y.; Yang, X.; Wei, J.; Yong, J.; Guo, H. Characteristics of Changes and Traceability Analysis of Atmospheric Pollutants in Shaanxi Province, 2017–2022—Taking PM2.5 and O3 as an Example. J. Environ. Sci. 2025, 45, 276–292. [Google Scholar] [CrossRef]
  52. Li, Y.; Liu, M.; Guan, C.; Shi, J. Characterization and Prediction of near-Surface PM2.5 and O3 Pollution in the Yangtze River Delta Region. Acta Sci. Circumst. 2025, 45, 1–12. [Google Scholar] [CrossRef]
  53. Lu, L.; Wu, G. Advances in Affecting Factors of Ammonia Emission in Farmland. J. China Agric. Univ. 2019, 24, 149–162. [Google Scholar]
  54. Huang, Y.; Zhang, L.; Peng, C.; Chen, Y.; Li, T.; Yang, F. Pollution Characteristics of Water-Soluble Inorganic Ions in PM2.5 from a Mountainous City in Southwest China. Atmosphere 2022, 13, 1713. [Google Scholar] [CrossRef]
  55. Environmental Protection Agency. EPA Positive Matrix Factorization (PMF) 5.0 Fundamentals and User Guide; USEPA Office of Research and Development: Research Triangle Park, NC, USA, 2008. [Google Scholar]
  56. Taghvaee, S.; Sowlat, M.H.; Mousavi, A.; Hassanvand, M.S.; Yunesian, M.; Naddafi, K.; Sioutas, C. Source Apportionment of Ambient PM2.5 in Two Locations in Central Tehran Using the Positive Matrix Factorization (PMF) Model. Sci. Total Environ. 2018, 628, 672–686. [Google Scholar] [CrossRef] [PubMed]
  57. Hopke, P.K.; Dai, Q.; Li, L.; Feng, Y. Global Review of Recent Source Apportionments for Airborne Particulate Matter. Sci. Total Environ. 2020, 740, 140091. [Google Scholar] [CrossRef]
  58. Feng, X.; Feng, Y.; Chen, Y.; Cai, J.; Li, Q.; Chen, J. Source Apportionment of PM2.5 During Haze Episodes in Shanghai by the PMF Model with PAHs. J. Clean. Prod. 2022, 330, 129850. [Google Scholar] [CrossRef]
  59. Li, X.; Yang, K.; Han, J.; Ying, Q.; Hopke, P.K. Sources of Humic-like Substances (HULIS) in PM2.5 in Beijing: Receptor Modeling Approach. Sci. Total Environ. 2019, 671, 765–775. [Google Scholar] [CrossRef] [PubMed]
  60. Liu, Y.; Zheng, M.; Yu, M.; Cai, X.; Du, H.; Li, J.; Zhou, T.; Yan, C.; Wang, X.; Shi, Z. High-Time-Resolution Source Apportionment of PM2.5 in Beijing with Multiple Models. Atmos. Chem. Phys. 2019, 19, 6595–6609. [Google Scholar] [CrossRef]
  61. Gao, X.; Li, W. A Graph-Based LSTM Model for PM2.5 Forecasting. Atmos. Pollut. Res. 2021, 12, 101150. [Google Scholar] [CrossRef]
  62. Skrobek, D.; Krzywanski, J.; Sosnowski, M.; Kulakowska, A.; Zylka, A.; Grabowska, K.; Ciesielska, K.; Nowak, W. Implementation of Deep Learning Methods in Prediction of Adsorption Processes. Adv. Eng. Softw. 2022, 173, 103190. [Google Scholar] [CrossRef]
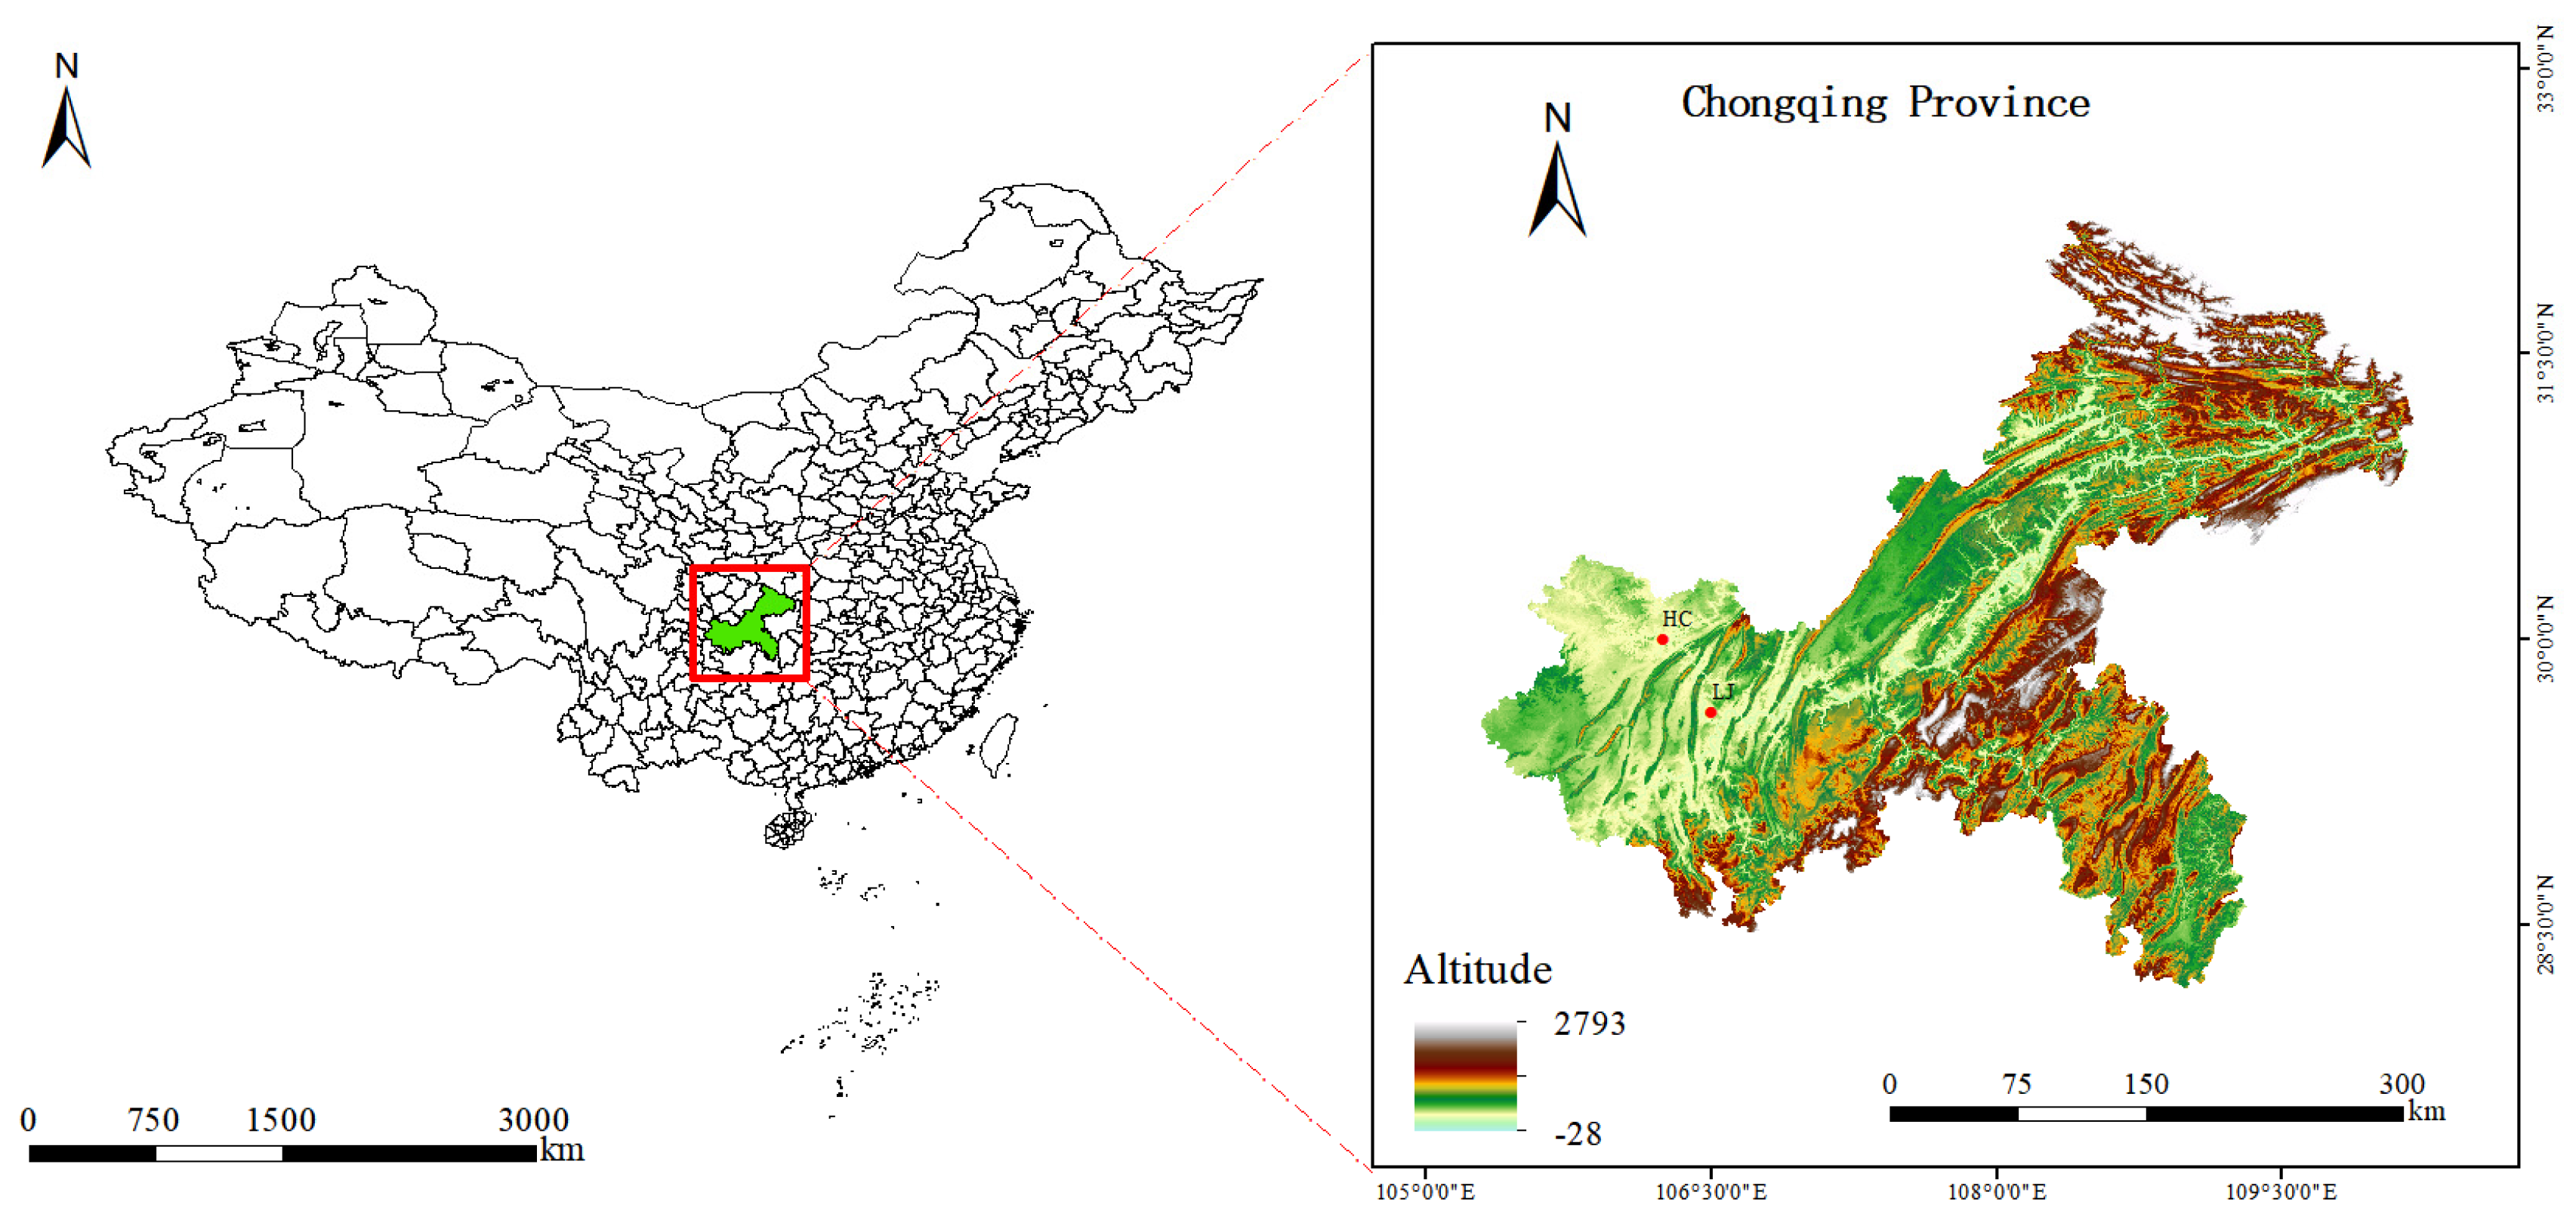
Figure 1. Sampling locations in LJ and HC, Chongqing, China.
Atmosphere 16 01047 g001
Figure 2. Chongqing PM2.5 seasonal pollution distribution map.
Atmosphere 16 01047 g002
Figure 3. Seasonal changes in the concentration and fraction of each water-soluble ion in PM2.5.
Atmosphere 16 01047 g003
Figure 4. The 2023 Chongqing annual average temperature and humidity map.
Atmosphere 16 01047 g004
Figure 5. Characteristics of seasonal changes in the NO3/SO42− ratio in two regions.
Atmosphere 16 01047 g005
Figure 6. Characteristics of seasonal changes in SOR and NOR in the two regions.
Atmosphere 16 01047 g006
Figure 7. Plot of cation concentration vs. anion concentration in four seasons.
Atmosphere 16 01047 g007
Figure 8. PMF modelling analysis of factor spectrum and factor contributions.
Atmosphere 16 01047 g008
Figure 9. Main contribution of PM2.5 sources in HC and LJ, Chongqing, for the whole year.
Atmosphere 16 01047 g009
Table 1. Analysis methods for each component.
Analysis ProjectInstrumentationReference MethodComponent
carbon componentDRI model 2015, United StatesQX/T 70-2007OC, EC
water-soluble ionsDionex Integrion HPIC, United StatesHJ 799-2016F, Cl, SO42−, NO3
HJ 800-2016Na+, K+, Mg2+, Ca2+, NH4+
elemental compositionBRUKER S8 Tiger, GermanyHJ 830-2017Al, Ca, Fe, K, Mg, Na, P, Si, Li, Be, Ti, V, Cr, Mn, Co, Ni, Cu, Zn, As, Se, Mo, Cd, Sb, Ba, Pb, Sc, Sn
Disclaimer/Publisher’s Note: The statements, opinions and data contained in all publications are solely those of the individual author(s) and contributor(s) and not of MDPI and/or the editor(s). MDPI and/or the editor(s) disclaim responsibility for any injury to people or property resulting from any ideas, methods, instructions or products referred to in the content.