Abstract
In response to the urban heat island challenge, various mitigation measures have been explored, with water spray systems emerging as a cost-effective and efficient solution for urban outdoor cooling. However, the influential factors of a water spray system on cooling efficiency have not been fully understood, thus hindering the application of the water spray system. This study delves into the following two questions: (1) what is the cooling performance of a water mist spray in a hot and humid urban climate? (2) What are the effects of different influencing factors? To answer these two questions, the computational fluid dynamics (CFD) simulations are used to modelthe cooling process of water mist spray inside an ideal two-dimensional street canyon with an aspect ratio of 1. A sound validation for the water spray cooling was conducted prior to the following CFD simulations. Results show that for given values of the water flow rate (i.e., 9.0 L/min) and the spray nozzle height (i.e., 3 m), a maximum temperature reduction of about 4.6 °C can be achieved at pedestrian height. Raising the installation height is more effective in maintaining the cooling zone proportion than decreasing the water flow rate. The clockwise recirculation inside the street canyon disappears with the upward airflow weakened when the spray nozzle is installed in the middle of the street canyon.
1. Introduction
The urban heat island (UHI) is a phenomenon in which urban areas are warmer than their surrounding suburbs, due to differences in the underlying surfaces, such as impervious asphalt and cement floors, dense urban high-rise buildings, and anthropogenic heat emissions [1]. The UHI effect can lead to health problems such as heat stroke, dehydration, cardiovascular disease and respiratory problems [2,3]. Against the global warming background, the UHI effect leads to the increasement of extreme heat events, which should be noticeable. Furthermore, one study indicates that the urban heat island effect is stronger in summer than in winter [4], and that the high temperature also exacerbated the energy consumption of building cooling, ranging from 10% to 120%, globally [5]. Thus, it is necessary to adopt low-energy measures to mitigate the influence of extreme hot weather on human health.
In recent years, lots of studies have studied the micro-climate in urban environments [6,7,8,9]. Until now, multiple mitigation measures have been adopted for urban cooling, including increasing the albedo of the city, planting vegetation, and installing water-based technologies [10,11,12,13,14,15]. Among these technologies, the water spray system is an active cooling technology in outdoor scenarios, due to its high evaporative cooling efficiency. Water spray systems outperform conventional cooling methods in several key aspects. Unlike reflective surfaces, which require material modifications for passive cooling, water spray systems enable immediate and adjustable temperature control. In contrast to vegetation (demanding extended growth periods) or other water-based technologies (space-intensive with limited cooling capacity), mist technology offers space-efficient installation while achieving superior cooling efficiency through optimized evaporative processes. The powerful cooling effect of spray has led to its widespread application in fire-related fields. Zhang et al. investigate the cooling effect of spray on smoke and temperature in indoor fire safety [16]. Additional research focuses on the effectiveness of water mist systems in protecting large wooden structures, successfully maintaining indoor temperature and gas concentration within acceptable ranges, with minimal water consumption [1]. Furthermore, the research has been conducted on the impact of water mist systems on smoke backlayering length under longitudinal ventilation conditions, revealing that the combined use of water mist and longitudinal ventilation more effectively limits the smoke backlayering length [17]. For example, international exhibitions hosted in Osaka (1970), Seville (1992), Aichi (2005), and Shanghai (2010) promoted the use of water spray systems in the built environment. The water spray systems could be installed at a specific location and absorb the heat from the ambient air quickly, by evaporation [18]. In addition, the sprayed mist from the water spray system can remove dust and pollen in the air, keep insects away, and reduce solar radiation in the long-wave ranges of near-infrared and mid-infrared [19]. Nicoletta Lotrecchiano, analyzing blood heavy-metal concentrations in human subjects has documented the significant impacts of airborne heavy metals on human health [20]. Spray dust suppression may serve to mitigate the dispersion of these health-detrimental heavy metals. It has been discovered that when the spray pressure reaches 6 MPa, the droplet effectively curbs dust accumulation on the working surface, thus significantly mitigating dust diffusion [21]. Another study examines the performance of spray fans in indoor environments, finding significant cooling effects in high-temperature settings at low air velocities (e.g., 0–2 m per second) [22]. Therefore, the water spray system is a more flexible, economic and effective way of mitigating urban overheating.
In recent years, the related research on spray cooling has gradually increased. A systematic sensitivity analysis is conducted to study the effect of numeric parameters [23]. It was found that when the temperature was 35 °C and the RH was 45%, using the field measurement at the 2010 Shanghai World Expo, the application of the water spray system could reduce the surrounding air temperature by 5–7 °C, while in the hot and dry climate of the Xi’an World Expo, the cooling effect of the water spray system was 2 °C higher than that of the Shanghai [24]. The measurement results show that the water spray system cooled down the air temperature by 8.2 °C, and the average RH only increased 7% under 30 °C average temperature and 45% RH [25]. Moreover, Zhang et al. established bus station models with spray systems on the roof, and found the spray system could help decrease body temperature by 2~3 °C in hot weather in which air temperature exceeds 30 °C [26]. The above studies clearly demonstrate that the spray system is a promising method in alleviating UHI effect at micro-scale.
Owing to the rapid development of numerical simulation, computational fluid dynamics (CFD) has been a popular approach to model the dynamic interaction between spray droplets and air. Compared to the field measurement, the CFD approach is more cost-effective and has high temporal and spatial resolution. The CFD simulation of a courtyard spray system was conducted in the Rotterdam urban area, and found that the temperature at pedestrian level could drop by up to 5 °C under the inlet boundary condition of 29.7 °C and 33% RH [27]. Another study in Korea Daegu, where the background temperature reaches 40 °C in August in the afternoon, showed a 3 °C volume average temperature drop in the residential area installed with spray systems using the CFD model [28]. Another study [29] found that combining shade and mist strategy can lower the physiological equivalent temperature (PET) by a maximum of 14.43 °C and heat stress levels by 2 to 3 categories, under the condition of 29.7 °C and 33% RH.
The evaporative cooling of spray systems is an effective cooling measure, but its effectiveness is influenced by complex interactions between various climate variables and spray parameters. One important focus in spray cooling research is finding out what factors affect spray systems’ performance, such as droplet diameter [30], air temperature and RH [31], spray installation height [32], and wind direction [33]. Huang et al. observed that droplet diameters exceeding 40 μm significantly diminish cooling potential, with cooling effectiveness becoming negligible at 100 μm [34]. In addition, adding other components to the water may enhance the cooling efficiency of the spray. For instance, Ge et al. found that when 1.5% alcohol concentration was used as the evaporating liquid, the temperature could be further reduced by 2.27 °C and the humidity could be further increased by 12.5% [35]. One study investigated three operational parameters, such as the height of the nozzles from the ground, the implementation of an upper shield, and the presence of a side shielding, and found that the key parameter that significantly impacts the system’s performance is the presence of the side shielding [36]. Moreover, cooling effectiveness is most pronounced and readily quantifiable under calm wind conditions and in leeward zones [37]. There is plenty of recent research studying the cooling performance of spray systems [38,39,40,41,42,43]. However, there is still a lack of universal research that has comprehensive parameter analysis. In this study, an idealized two-dimensional street canyon with an aspect ratio of one is constructed, to investigate the universal effects of different parameters on the cooling performance of the spray nozzle. Moreover, the interaction between wind field and the spray nozzle is studied.
The rest of the paper is organized as follows: Section 2 presents the methodology part of this study, including the turbulence models and DPM models. Section 3 shows the CFD validation. The detailed description for the studied cases is shown in Section 4, and results analyses for these cases are given in Section 5. Finally, Section 6 concludes this paper.
2. Methodology
Reynolds-averaged Navier–Stokes (RANS) equations are employed in this research. The realizable k-ε model is used for the closure terms of Navier–Stokes equations, which has been proved to be reliable for evaporative cooling simulations [44]. The governing equations for the k-ε model in the neutral atmosphere are given as follows [45]:
where Equations (1) and (2) are continuity and momentum equations, respectively. represents density of fluid. is time-averaged velocity for i direction, while and and are their respective fluctuating velocities. is the dynamic viscosity of the fluid. P stands for the atmospheric pressure. denotes the Kronecker delta function (if i = j, , else ). are the Reynolds stresses.
The governing equations are the Navier–Stokes equations, while Equations (3) and (4) represent the turbulence model’s closure equations:
where
In Equations (3) and (4), and denote the turbulent Prandtl numbers for k and ε, which are equal to 1.0 and 1.2, respectively. is the kinetic eddy viscosity. is the portion of turbulence kinetic energy generated by the mean velocity gradients, while represents the portion of turbulence kinetic energy generated by buoyancy. and are model constants which are equal to 1.9 and 1.44, respectively. is also a constant which determines what degree ε is affected by the buoyancy, and it is calculated by . S denotes the modulus of the average tensor of the rate of strain.
The energy equation is given by Equation (5):
where is the effective conductivity. is the diffusion flux of species j. Meanwhile, the three terms of the right side of Equation (5) represents energy transfer due to conduction, species diffusion, and viscous dissipation, respectively.
In this paper, the discrete phase model (DPM) is utilized to simulate the momentum, mass and heat transfer between the droplets and the continuous fluid. The trajectory of droplets is predicted by integrating the force balance equation. Meanwhile, four laws are set for droplets include heating, evaporation and boiling. The particle force balance equation could be written as [45]:
where is the mass of the droplet, and is the density of the droplet. represents the velocity of the fluid. denotes the droplet velocity. is the drag force. is the droplet relaxation time. represents an additional force, but it is not considered in this paper.
The heat balance of the droplet is given by the follow equation:
where , and are the droplet heat capacity, droplet temperature and droplet surface area, respectively. T is the air temperature. h represents the convective heat transfer coefficient. In addition, denotes the latent heat.
The mass transfer mechanisms are modeled as below:
where is the molar flux of vapor and denotes mass transfer coefficient. and are the vapor concentration at the droplet surface and in the fluid, respectively. A is the pre-exponential factor and d is the droplet diameter. E is the activation energy. R is the universal gas constant. The Spalding mass number, , can be computed from . Here, and denote the vapor mass fraction at the droplet surface and in the fluid, respectively.
Equations (8) and (9) are the vapor mass exchange caused by difference in vapor concentration between the droplet surface and the continual fluid. Equations (8) and (9) are only activated when the vaporization proceeds, i.e., and the volatile portion of droplet remains, where the is the vaporization and denotes the boiling point. Moreover, Equation (10) is the Arrhenius expression to simulate the thermolysis process.
3. CFD Validation
The wind tunnel experiment conducted by Sureshkumar et al. was used in this paper for CFD validation [46]. The experiment used an open-circuit wind tunnel with uniform air flow speed. The test section of the wind tunnel was 1.9 m long and had a cross-section of 0.585 m 0.585 m. The experiment measured the dry bulb temperature (DBT) and wet bulb temperature (WBT) of the air flow at the inlet and outlet planes. The wind tunnel experimental setup is illustrated in Figure 1, and it can be seen that the spray nozzle was installed on the inlet plane.
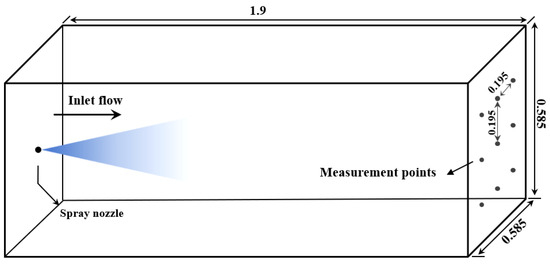
Figure 1.
Illustration of the wind tunnel experiment setup of Sureshkumar et al. [46] (dimensions in meters). This figure draws on the work of Montazeri (2015) [44].
For validation purposes, the case of nozzle outlet diameter, nozzle pressure and wind speed of 4 mm, 3 bar and 3 m/s, respectively, is used in this paper. Moreover, the water vapor mass ratio is 5.5 × 10⁻³, and the background temperature is 39 °C, which are the same as those during the wind tunnel experiment.
Since the turbulent characteristics of the flow were not reported in Sureshkumar et al. [46], it is assumed that the turbulence intensity of the inlet flow is 10% [44]. The turbulent kinetic energy (k) and the turbulent dissipation rate ε are calculated using Equations (11) and (12). is the turbulent length scale, and is computed from the hydraulic diameter of the domain (DH, 0.585 m) as [44]. is a constant (0.09).
The standard wall function in the ANSYS 2020 R1 Fluent is used. Moreover, a no-slip boundary condition is applied. When the droplet hits the wall, it will reflect back. The pressure-outlet boundary condition is utilized for the outlet, and the droplets will escape at the outlet.
The Rosin–Rammler model is utilized to describe the size distribution of droplets, and the smallest and largest droplet diameters are 74 and 518 μm, respectively. The average droplet diameter and diffusion parameter of the Rosin–Rammler distribution are 369 μm and 3.67, respectively. The temperature of the sprayed water is 36 °C. According to the recommendation, the total number of droplet streamlines is 300, and each streamline contains 20 different particle sizes [46]. The spherical drag law is used to estimate the drag coefficient acting on the droplets. This setting assumes that the surface tension on the droplet–fluid interface is strong enough to resist the influence of air dynamics on the droplet shape [47]. Droplet collisions and droplet decomposition are not considered.
The comparison results of CFD simulation and the wind tunnel experiment are shown in Figure 2. Three parameters, i.e., DBT, WBT, and specific enthalpy (h) are compared here. It can be seen that the relative errors are all within 10%, except for one measurement point for the WBT. In particular, the relative error of the DBT simulation is basically within 5%, which indicates that our CFD simulation has high fidelity. The CFD validation of wind flow inside an idealized 2D street canyon and the grid sensitivity test are presented in Appendix A.
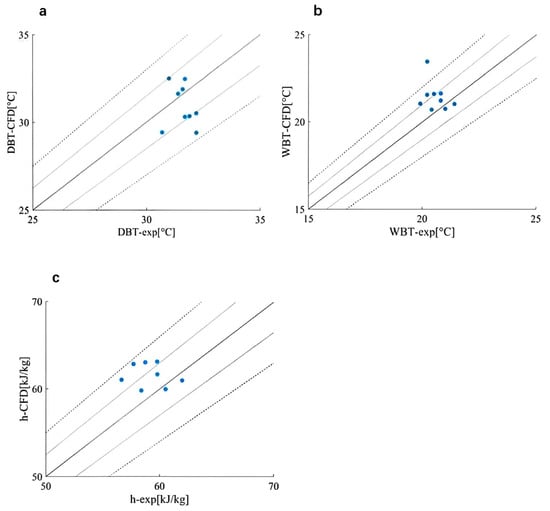
Figure 2.
CFD simulation results (-CFD) compared to wind tunnel experiments (-exp). (a) DBT (b) WBT and (c) h. The light-colored and dashed lines represent 5% and 10% relative error lines, respectively.
4. CFD Model Description
4.1. Computational Geometry
Figure 3 illustrates the computational domain of the full-scale two-dimensional (2D) canyon streets in this study. It can be seen that there are four uniform street canyons, in which the target street is located between the third and fourth building. Moreover, the spray nozzle is mounted in the middle of the target street. The building height (H), building width (Wb), and street width are 24 m, 20 m and 24 m, respectively, which makes the aspect ratio of 1. The approaching wind is set to be perpendicular to the street canyon from the left, from where the wind flow passes through two street canyons, and it is fully developed before reaching the target building.
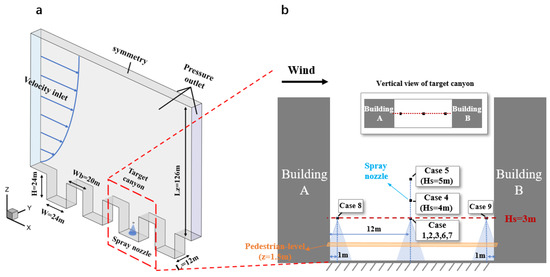
Figure 3.
(a) Computational domain and geometry. The target canyon with spray nozzle is indicated by the red frame. (b) Illustration of spray nozzle locations of nine case settings.
4.2. Computational Grid
Before performing the validation, a grid sensitivity analysis was undertaken, using three distinct grid configurations, i.e., grids with minimum sizes of 0.2 m (medium grid, Figure 4a), 0.1 m (fine grid, Figure 4b), and 0.05 m (finest grid, Figure 4c). Examination of Figure A3 reveals that the finest grid configuration fails to demonstrate a significant enhancement in simulation outcomes, as measured by the normalized streamwise velocity (U/). Hence, we have opted for a fine grid with a minimum size of 0.1 m for our CFD simulations, taking into account both computational resources and the desired level of modelling accuracy. The computational grid is discretized by the cubical cells. The total grid number reaches 1,982,400. The minimum grid size is 0.1 m near the wall and the maximum grid size is 3.58 m, which results in the smallest and the biggest grid volume being 5 and 2.15 , respectively. The expansion ratio for the grid system is below 1.1.
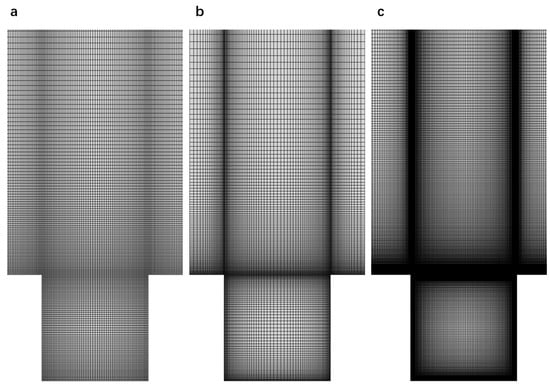
Figure 4.
Computational grid. (a) Medium (0.2 m), (b) fine (0.1 m), (c) finer (0.05 m).
4.3. Boundary Condition
Figure 3 shows the inlet boundary condition in this paper, which is indicated in blue on the left side of Figure 1. At the inlet, vertical profiles for the wind speed ()), kinetic energy () and turbulence dissipation rate () are imposed by the following equations:
where the is the reference height (=24 m), and represents the wind speed at reference height (). The roughness height () is set to 3 m. , the model constant () and the von Karman constant () are defined as 0.22, 0.09 and 0.41 respectively. () is the friction velocity calculated by Equation (16). Furthermore, a constant air temperature of 311.15 K is set at the inlet. For simulating evaporative cooling, three different background relative humidity (RH) conditions are taken into consideration, i.e., RH = 50%, RH = 60%, and RH = 70%.
As shown in Figure 3, symmetry, wall and pressure-outlet boundary conditions are used for the top, bottom and lateral sides of the domain, respectively. For the outlet of the domain (right side), the pressure-outlet boundary condition is implemented. In addition, the standard wall functions are employed to the domain bottom, where the value is above 15. A non-slip smooth wall is imposed for the wall boundary condition. For the discrete phase, the escape boundary condition is imposed for the wall and outlet, which means droplets would escape from the boundary with the same momentum.
4.4. Numerical Settings
For pressure–velocity coupling, the SIMPLEC method is used. Second-order discretization schemes are employed for pressure, convection and viscous terms of equations. The discrete phase model (DPM) is applied to simulate the droplet evaporation and transportation in the airflow. The coupled approach is utilized to solve the droplet momentum, heat, and mass transfer equations. In addition, the source terms of the discrete phase would update with the continuous phase iteration, and the discrete phase iterates once after five continuous phase iterations. In order to solve the motion equations for the discrete phase, the higher- (i.e., trapezoidal) of the lower- (i.e., implicit) order tracking schemes will be automatically switched. The residuals of continuity, momentum, temperature, and droplet are all falls of below 10−4, with the wind components and droplet numbers stable for 500 iterations with all modelling components stable for 500 iterations.
In order to study the effects of spray water amount, installation height, and environment RH on the cooling potential of water spray, this paper designed a total of nine different cases, as shown in Table 1. Taking Case 1 as an example, the total water output of the nozzle is 0.02 L per minute, the diameter of the nozzle is 0.004 m, and the water mist sprayed out of the nozzle forms a hollow cone. As in the CFD validation case, the Rosin–Rammler model is used. Droplet collisions and droplet decomposition are not considered. Considering the practical use in reality, the smallest and largest droplet diameters considered in the model are 10 and 60 μm, respectively. The average droplet diameter and diffusion parameter n of the Rosin–Rammler distribution are 20 μm and 3.5, respectively [44]. The temperature of the sprayed water is 20 °C. The water droplet velocity at the outlet is 15 m/s. The other settings are the same as the CFD validation case in Section 3. Background RH and spray nozzle parameters of different cases are indicated in Table 1.

Table 1.
Summarization of nine cases.
5. Results and Analysis
This section discusses the wind field, temperature distribution and RH within the target street canyon for the different case settings in Table 1.
5.1. Wind Field Without Mist Spray
Figure 5 presents the wind velocity contour plots with streamlines for the vertical and horizontal planes. In Figure 5a, a clock-wise recirculation is found in the center vertical plane. The velocity magnitude in the street canyon ranges from 0 to 1.6 m/s. In Figure 5b, it can be seen that the wind direction is from the windward wall to the leeward wall, and the wind velocity magnitude is below 1.23 m/s, with the highest wind velocity at the center of the horizontal plane.
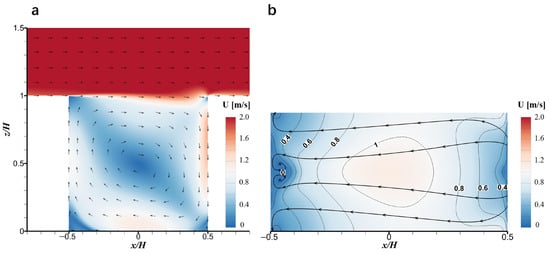
Figure 5.
Contour plots of wind velocity U imposed on the streamlines for (a) the central vertical plane, and (b) horizontal plane at pedestrian level (z = 1.5 m).
5.2. Temperature and RH Distribution of Case 1
As shown in Figure 6, this study compares the changes in air temperature and humidity at pedestrian level (z = 1.5 m), within an urban street canyon, with a spray system. Since the study does not account for the impact of solar radiation and ground reflection on the street canyon temperature, the temperature distribution within the street canyon remains uniform, at 38 °C, in the absence of the spray system. Similarly, the RH within the street canyon is also uniformly distributed, showing no significant variation. The distribution of air temperature and humidity within the street canyon are displayed when the spray system is operational. The spray system is installed at a height of z = 3 m in the center of the street canyon, with a vertical downward water output rate of 1.2 L per minute. Based on the wind field distribution within the street canyon shown in Figure 5a,b, the water droplets emitted by the spray system are influenced by the wind, and move downwind within the street canyon. During this movement, the water droplets continuously evaporate, increasing the water vapor content in the air and, consequently, raising the RH. Therefore, in the downstream direction of the spray system, the RH at pedestrian level (z = 1.5 m) reaches its maximum value, 81%, representing a 21% increase. Conversely, in the upstream direction of the spray system, the increase in RH is smaller (<4%), due to the water droplets moving downstream. The distribution of RH exhibits symmetry around the axis y = 6 m. During the process of water droplet evaporation, heat is absorbed from the air, resulting in a decrease in air temperature. The areas where air temperature decreases align closely with the regions of increased RH, indicating that water droplet evaporation is the primary factor influencing air temperature and humidity changes. In areas where RH significantly increases, the air temperature can decrease by up to 4.4 °C. Figure 6 illustrates the fact that installing a spray system at the center of an urban street canyon effectively improves the air temperature conditions at pedestrian level, particularly in the downstream direction (x < 0), achieving a cooling effect of 2 °C or more.
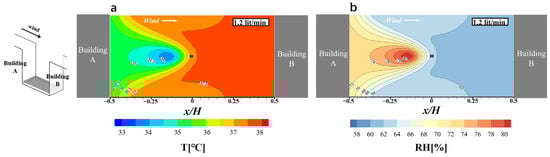
Figure 6.
Air temperature (a) and RH (b) distribution in a horizontal plane at a height of 1.5 m above ground level with spray (right).
5.3. Influences of Water Flow Rate
In this section, under an environmental humidity of RH = 60%, we studied the effect of varying nozzle water output on spray cooling performance. To explore the impact of different water outputs on the microclimate of a street canyon, three different spray devices were set up, with water outputs of 0.6 L/min, 0.9 L/min, and 1.2 L/min (Figure 6). The spray devices remained at a fixed position in all three cases, located at the center of the street canyon at a height of z = 3 m, spraying vertically downward. Compared with Figure 7, it is evident that the 1.2 L/min spray nozzle resulted in the highest RH increase, indicating that larger water output leads to a more pronounced cooling effect.
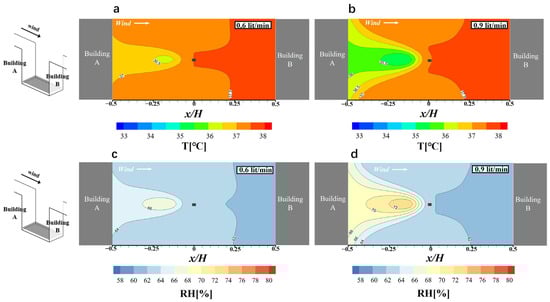
Figure 7.
Contour plots of temperature (a,b) and RH (c,d) distribution at pedestrian height for water flow rate of 0.6 L/min (a,c) and 0.9 L/min (b,d).
The background relative humidity and temperature are 60% and 38 °C, respectively. The mist spray is fixed at the center of the street canyon facing downward, and the height is 3 m above the ground. The water flow rate is 0.6 L/min, 0.9 L/min, and 1.2 L/min. Figure 7 presents the temperature and RH distribution at pedestrian level (i.e., 1.5 m) under a water flow rate of 0.6 and 0.9 L/min. In general, the RH increase and temperature drop occur in the downstream region, and they barely change in the upstream region. Moreover, the area where RH increases correspond to the temperature drop area. As the water flow rate increases, the cooling effect becomes more pronounced. The maximum temperature drops for water flow rates of 0.6 L/min, 0.9 L/min, and 1.2 L/min are 1.8 °C, 3 °C and 4.4 °C, respectively. Correspondingly, the maximum RH increases are 7.2%, 13.8% and 21.2%, respectively.
Figure 7a,b show that the area where the temperature drops by more than 1 °C is significantly increased when the water flow rates change from 0.6 L/min to 0.9 L/min. Similarly, by comparing Figure 6 and Figure 7b, we can find that the area where the temperature drops by more than 2 °C is evidently increased when the water flow rates change from 0.9 L/min to 1.2 L/min. In this case, we controlled the nozzle water output and observed the RH and temperature changes within the street canyon at different water outputs. At a nozzle water output of 0.6 L/min, Figure 7a,c show that the RH inside the street canyon reaches a maximum of 67.2%, and the temperature can decrease by up to 1.8 °C. This indicates that at this water output, the spray system effectively lowers the temperature within the street canyon, while maintaining suitable humidity levels.
Increasing the nozzle water output to 0.9 L/min, Figure 7b,d reveal that the RH inside the street canyon reaches a maximum of 73.8%, and the temperature can decrease by up to 3 °C. Simultaneously, we observe a significant expansion of the area where the temperature decreases by more than 1 °C (a lower-temperature region enclosed by the 37 °C isotherm). This suggests that at this water output, the spray system can more effectively reduce the temperature within the street canyon, with a broader impact.
Restoring the nozzle water output to 1.2 L/min, Figure 6a,b show that the RH inside the street canyon reaches a maximum of 81%, and the temperature can decrease by up to 4.4 °C. Notably, the area where the temperature decreases by more than 2 °C significantly expands (a lower-temperature region enclosed by the 36 °C isotherm). This indicates that at this water output, the spray system can greatly lower the temperature within the street canyon, with an even wider influence.
By comparing the experimental results at different water flow rates, we can draw a conclusion: increasing the water output is beneficial for lowering temperatures. In other words, the higher the nozzle water output, the lower the temperature within the street canyon, resulting in better cooling effects. However, it is essential to note that excessive RH can cause discomfort to humans.
Figure 8 shows the contour plots of vertical velocity distribution on the central vertical plane for cases with different water flow rates. In general, the vertical velocity is negative on the windward side and positive on the leeward side, which means that the airflow inside the street canyon follows clockwise recirculation.
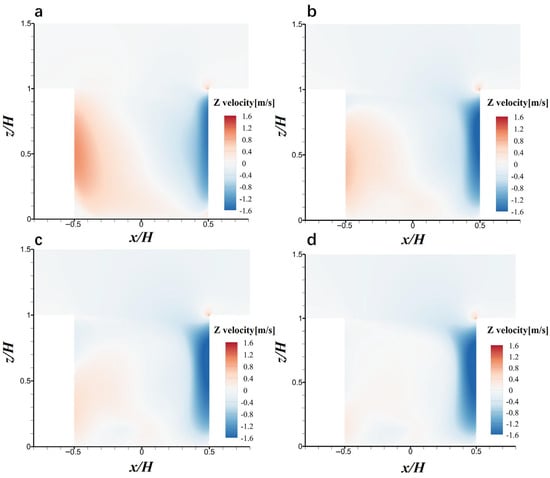
Figure 8.
Contour plots of vertical wind velocity (w) for (a) case without spray nozzle, (b) water flow rate of 0.6 L/min, (c) 0.9 L/min and (d) 1.2 L/min on the central vertical plane.
As the nozzle water flow rate increases, the downward airflow on the windward side is not greatly influenced. However, the upward airflow on the leeward side is significantly weakened. For the case without a spray nozzle (Figure 8a), the maximum value of the upward airflow on the leeward side is around 1 m/s. When the water flow rates of the nozzle spray () rises to 0.6, 0.9, and 1.2 L/min, the maximum values of the upward airflow gradually decrease to around 0.70, 0.44, and 0.24 m/s, respectively. Moreover, the height range of the maximum value gradually decreases to 5.8~12.8 m, 4.5~8.8 m and 2.5~5.4 m, respectively. Further, the proportion of upward airflow on the leeward side of the street canyon largely decreases with the increase in water flow rate. Meanwhile, as the water flow rate increases, the clockwise recirculation inside the street canyon disappears, with the upward airflow weakened. This could explain an interesting phenomenon: while higher water flow rate leads to increased RH in the downwind area of the nozzle, the upwind area experiences relatively less moisture accumulation (i.e., Figure 6b and Figure 7c,d). This discrepancy may be caused by the increased momentum exchange between water droplets and air as water flow rate increases, which weakens the water transportation from leeward side to windward side, through the recirculation.
5.4. Influences of Spray Nozzle Height
As in the previous section, the background RH and temperature are 60% and 38 °C, respectively. The water flow rate is 1.2 L/min, and the spray nozzle is placed at the center of the street canyon, facing downward. Figure 9 shows the temperature (a, b) and RH (c, d) distribution for different spray nozzle heights, i.e., 4 m and 5 m above the ground. Figure 6a (Hs = 3 m) and Figure 9c,d indicate that as the spray height increases, the RH in the downwind area gradually decreases. Figure 6b and Figure 8a,b demonstrate that with the spray-device height increase, the temperature in the downwind area gradually rises. When the spray height increases from 3 m to 4 m, the minimum temperature rises to 35 °C. Then the spray height increases from 4 m to 5 m, and the minimum temperature rises to 36.5 °C, only 1.5 °C cooler than the ambient temperature of 38 °C. This suggests that as the spray nozzle become higher, the mist cooling effect at pedestrian level weakens. The maximum RH increase for the spray nozzle height of 3 m, 4 m, and 5 m is 21.2%, 13.9% and 6.4%, respectively. Nevertheless, it is interesting to find that the area where the temperature drops above 1 °C does not change for these three nozzle heights. By comparing Figure 6b and Figure 9a, it can be found that the area where the temperature drops above 2 °C does not change for nozzle heights of 3 m and 4 m.
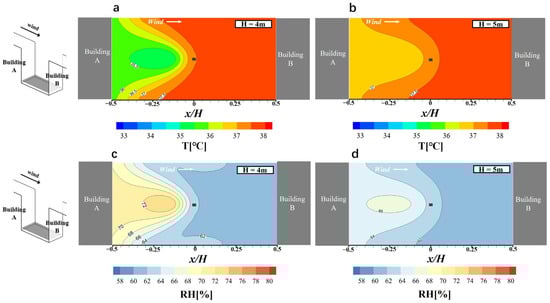
Figure 9.
Contour plots of temperature (a,b) and RH (c,d) distribution at pedestrian height for spray nozzle heights of 4 and 5 m.
Figure 10 shows the contour plots of vertical velocity distribution on the central vertical plane when the nozzle installation height is 4 m and 5 m. When the nozzle is installed at 4 m and 5 m, the maximum value of the upward airflow vertical velocity on the leeward side is 0.28 m/s and 0.51 m/s, respectively. Comparing Figure 10a with Figure 8d, it can be seen that the weakening of the upward airflow on the leeward side is very obvious when the nozzle installation height is 3 m and 4 m. However, as can be seen from Figure 10b, when the nozzle installation height is 5 m, the upward airflow on the leeward side becomes stronger than that of 3 m and 4 m (Figure 8d and Figure 10a). It can be concluded that when the spray nozzle is installed at a lower position, it has a greater impact on the airflow flow at the bottom right of the street canyon, thereby weakening the upward airflow at the leeward side. However, this influence is not so obvious when the nozzle is installed at a higher position.
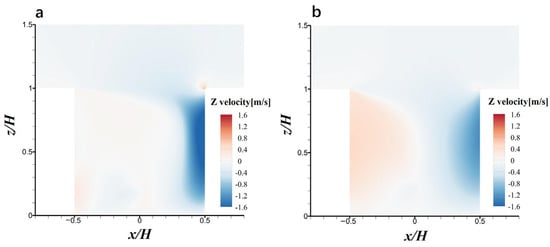
Figure 10.
Contour plots of vertical wind velocity (w) distribution on the central vertical plane for installation height of (a) 4 m and (b) 5 m.
5.5. Influences of the Background RH
Figure 11 displays the contour plots of air temperature (a, b) and RH change (c, d) at pedestrian height for different background RH (i.e., 50% and 70%). The RH change is obtained by subtracting the RH value after the water spray from their respective background RH value. Generally, the lower background RH leads to greater water vapor evaporation and better cooling effects.
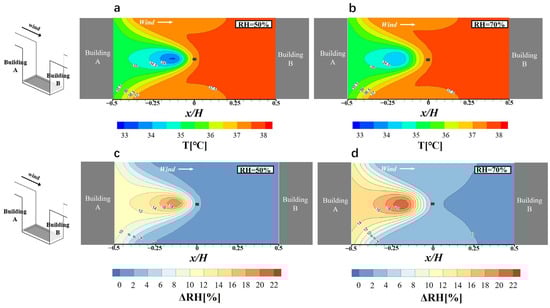
Figure 11.
Contour plots of temperature (a,b) and RH (c,d) changes (ΔRH) distribution at pedestrian height for the background RH of 50% and 70%.
Figure 6b and Figure 11c,d reveal that the background RH increases from 50% to 70%. The RH value in the region where the x/H value is negative rises significantly, particularly in the area close to the water spray nozzle, showing a significant RH increase. For instance, the maximum ΔRH value reaches up to 21.6% (i.e., the RH = 91.6%) when the background RH reaches 70% (Figure 11d). The RH variation patterns are similar under different background RH values (i.e., Figure 6b and Figure 11c,d). When the background RH increases from 50% to 70%, the region where ΔRH values are larger than 12% expands significantly, while those between 0 and 2% diminish. Meanwhile, the maximum ΔRH value rises from 19.6% to 21.6% when the background RH increases from 50% to 70%. Further, by comparing Figure 6a and Figure 11a,b, it can be found that there is no remarkable difference for the temperature distribution pattern under three different background RH conditions. The minimum temperatures under 50%, 60% and 70% background RH are 33.4 °C, 33.6 °C, and 34 °C, respectively. Thus, it can be concluded that when the spray nozzle is used under high background RH conditions, the cooling effect of the spray decreases, leading to a higher RH value.
5.6. Influences of Spray Nozzle Location
In this section, the background RH and temperature are 60% and 38 °C, respectively. The water flow rate is 1.2 L/min, and the height of the spray nozzle is 3 m, with the nozzle facing downward. Figure 12 shows the distribution of temperature and RH at pedestrian height when the spray nozzle is installed 1 m away from buildings A and B, inside the street canyon. The temperature decrease at pedestrian height is mainly caused by the water vapor evaporation. Thus, the cooling regions coincide with the RH increase regions, which are directly below the spray nozzle. The lowest temperature and the highest RH of both them are 34.5 °C and 76% for left- and right-spray nozzle location (Figure 12a vs. Figure 12b, Figure 12c vs. Figure 12d), respectively. Compared to Figure 6a, this lowest temperature value is smaller than that when the nozzle is installed in the middle of the street canyon. However, the temperature decreasing areas in Figure 12a,b are obviously smaller than that when the nozzle is installed in the middle of the street canyon (Figure 6a). It can be found in Figure 12b,d that the strip-shaped area appears where the temperature drops by 0.5–1 °C and the humidity increases by 2–4%. This can be attributed to the clockwise recirculation of the airflow movement inside the street canyon.
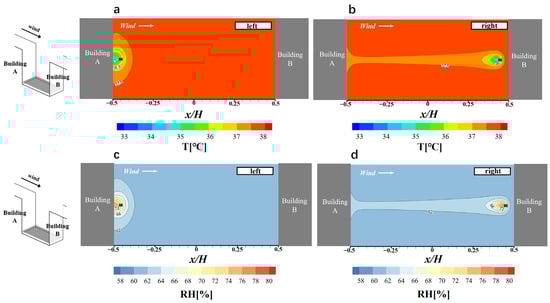
Figure 12.
Contour plots of temperature (a,b) and RH (c,d) distribution at the pedestrian height for spray nozzle installed 1 m away from the wall (a) on the left and (b) on the right side of the street canyon.
Figure 13a,b correspond to the contour plots of velocity wind distribution in the z direction on the central vertical plane when the nozzle is installed on the left and right sides, respectively. The maximum values of the upward airflow on the windward sides are 0.68 m/s and 1 m/s when the nozzle is installed on the left and right sides, respectively. Comparing this with Figure 8a, it can be seen that when the nozzle is installed on the left side, the upward airflow on the windward side is somewhat weakened, and there is a noticeable downward airflow below the nozzle. Moreover, the downward airflow on the right side is also significantly weakened, with its maximum value only being 0.92 m/s when the nozzle is installed on the left side (with 1.5 m/s, in Figure 8a). However, as can be seen from Figure 13b, when the nozzle is installed on the right side, the vertical wind field in the street canyon is basically the same as that of Figure 8a, indicating that this installation position has a smaller impact on the wind field. Figure 14 shows the contour plots of ΔRH distribution on the central vertical plane when the nozzle is installed in different positions. It is obvious that when the nozzle is installed in the middle of the street canyon, the water injected by the nozzle is affected by the clockwise wind field in the street canyon. The water vapor can spread well into the downwind area, and rise along the leeward wall to the height of building height (Hs), so that it can be transported to the windward side. However, when the nozzle is installed near the wall on the left and right sides, the water injected by the nozzle cannot participate well in the clockwise wind field in the street canyon, causing the moisture to be trapped in the area below the nozzle. As a result, it cannot produce a good cooling effect at pedestrian height.
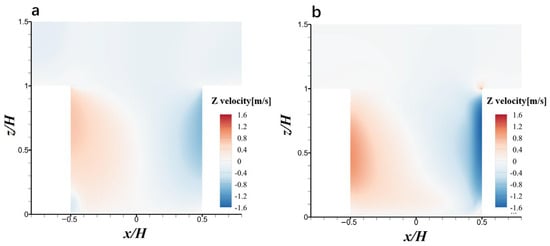
Figure 13.
Contour plots of vertical wind velocity (w) distribution on the central vertical plane for spray nozzle installed 1 m away from the wall (a) on the left and (b) on the right side of the street canyon.
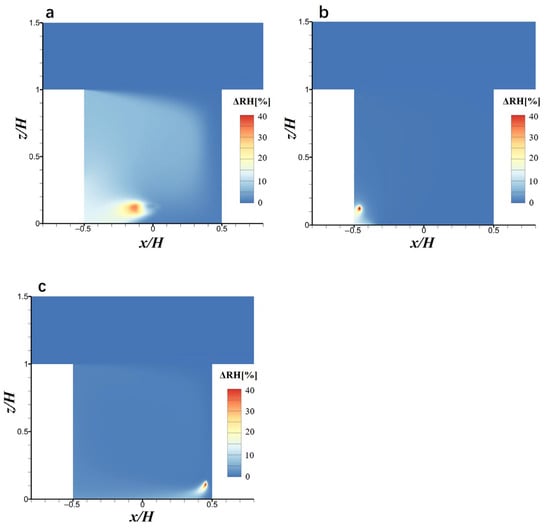
Figure 14.
Contour plots of ΔRH distribution on the central vertical plane for spray nozzle installed 1 m away from the wall (a) on the middle, (b) on the left, and (c) on the right side of the street canyon.
5.7. Comparison Between Nozzle Height and Water Flow Rate
Figure 15 shows the area percentages of different temperature changes at pedestrian height. As can be seen from Figure 15, increasing or decreasing the background humidity does not significantly impact the area percentage (i.e., Case 1 vs. Case 6 and 7). However, reducing the water flow rate of spray nozzles leads to a decrease in the maximum cooling effect and a decline in the area where the temperature drops by more than 0.7 °C (i.e., Case 1 vs. Cases 2 and 3), although the area percentage where the temperature drops by 0.2–0.7 °C slightly increases when reducing the water flow rate. This is likely caused by the strong upward airflow on the leeward side and downward airflow on the windward side, which results in better moisture transport to the windward side of the street canyon. Additionally, raising the height of the nozzles causes a decrease in the maximum temperature change and an overall decline in the area percentage (i.e., Case 1 vs. Cases 4 and 5). For Case 8 and Case 9, when the spray nozzles are installed near Buildings A and B, their cooling areas significantly reduce compared to Case 1, which is consistent with previous observations.
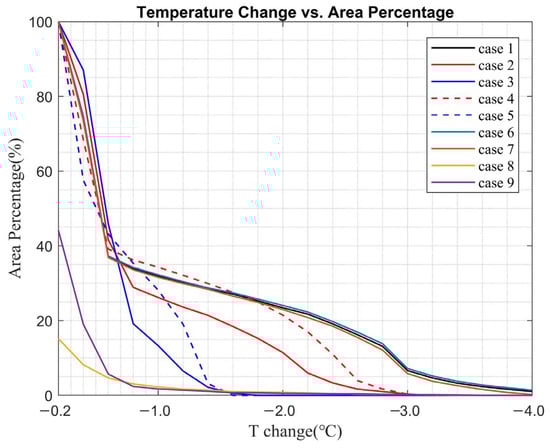
Figure 15.
Plots of area percentages of different T changes at pedestrian height for nine cases.
6. Discussion
Mist cooling systems offer a viable strategy for urban heat mitigation, particularly in hot and dry climates where low RH facilitates effective evaporative cooling, with demonstrated average temperature reductions of 8 °C under optimal conditions, according to field studies [25]. The technology’s effectiveness is highly climate-dependent, performing best in arid regions while facing limitations in humid environments where excessive moisture accumulation can elevate RH by 15–25%, potentially compromising thermal comfort [25]. High humidity (typically above 60% RH) negatively impacts human health and comfort, in multiple ways. Our results consistently demonstrated that elevated ambient humidity conditions adversely affect spray cooling effectiveness, but the water spray system can still cool down the ambient air, even in a high-humidity environment.
The findings of this study collectively demonstrate that water spray systems represent an effective and economically viable mitigation strategy for addressing UHI effects at the micro-scale level. For example, increasing water volume may lead to significant humidity elevation. While considering the cooling effect, particular attention must be paid to the impact of rising RH on thermal comfort. Alternatively, in high-RH environments, elevating nozzle height can be prioritized over increasing water volume, to maintain effective cooling coverage while mitigating humidity buildup. Operational and maintenance costs of the misting system must also be carefully considered, with particular attention to water quality management. Additionally, implementing automated on/off controls for the spray system serves as an effective energy-saving measure to optimize operational efficiency and reduce long-term costs. While this study identifies key physical drivers of spray cooling efficiency (ΔT, ΔRH) under idealized conditions, it does not provide a quantitative cost–benefit assessment. Economic feasibility for real-world applications depends, critically, on site-specific factors including installation complexity, local utility costs, maintenance requirements, and climatic context, which fall beyond the scope of this fundamental investigation. Future studies should integrate the physical performance relationships established here with detailed engineering economic models to evaluate large-scale deployment feasibility across diverse urban settings and climates.
Simulation studies on spray cooling provide theoretically optimized approaches through mathematical models and CFD tools; however, practical application requires adjustments based on multidimensional factors such as environmental dynamics, robustness of the control system, economic costs, and human thermal comfort. Current research lacks direct comparisons between CFD predictions of spray system cooling effects (e.g., temperature reduction magnitude, UTCI improvements) and actual field measurement data from the same urban location and spray system. This absence of direct comparison is primarily due to the significant difficulty in obtaining high-resolution field measurement data for urban spray systems, a challenge commonly faced by the authors of this paper and the broader research community. While Montazeri et al. (2015) did not directly compare CFD results with field measurements of spray cooling effectiveness in an actual urban setting, their CFD results showed good agreement with wind tunnel measurements, with errors within 10% for DBT and 5% for WBT [44]. This agreement provides a basis for the credibility of using this CFD model to simulate the spray evaporation process.
Although the proposed model demonstrates good agreement with experimental data, it has several limitations. First, the spray evaporation process was simulated under idealized conditions, neglecting real-world factors such as wind direction and speed change, and droplet coalescence. Second, the 2D simplification of the street canyon may not fully capture complex 3D flow dynamics, such as vertically-oriented vortices, facade-induced secondary currents, and asymmetric wind field patterns, which may modify the wind filed, thereby impacting cooling efficiency.
7. Conclusions and Future Work
The two-dimensional street canyon represents a prevalent configuration within modern urban building clusters. This study establishes a model of such a canyon, incorporating a spray system to investigate factors influencing its cooling potential. Findings derived from this idealized two-dimensional street canyon model can be generalized to diverse real-world environments. Consequently, this research offers valuable insights for urban policymakers seeking mitigation strategies against UHI effect in analogous street canyon configurations and wind speed contexts. For instance, recommendations include positioning spray systems near the canyon centerline, rather than adjacent to the lateral walls, and under conditions of elevated humidity requiring spray reduction, prioritizing an increase in installation height over directly decreasing the water flow rate. The integration of such cooling technologies into urban planning frameworks offers significant potential for fostering sustainable urban development and enhancing climate resilience. Particularly in the context of rising global temperatures and increasing climate variability, these systems could play a crucial role in improving thermal comfort and overall quality of life for urban dwellers.
This study examines the impact of spray device evaporative cooling on the microclimate at pedestrian level height within a two-dimensional street canyon. Although the wind-thermal environment of two-dimensional street canyons, the cooling effectiveness of spray systems, and their influencing factors have been extensively investigated, the specific effects resulting from their combined interaction remain relatively unexplored. This gap constitutes the innovative focus of the present research. Employing CFD simulations, the study focuses on the effects induced by factors such as varying installation heights of the spray devices and water flow rates. Sun et al. employed CFD simulations to investigate the cooling effect of spray systems within a single idealized courtyard structure [48]. Our study shares similarities with the work of Sun et al., as both explore factors influencing cooling performance using idealized models, and neither considers solar radiation.
Through a systematic analysis of key operational parameters—including water flow rate, nozzle installation height, and ambient RH—the research evaluates cooling performance under controlled wind conditions (unidirectional airflow at 3 m/s). The findings yield the following conclusions:
- (1)
- Increasing the water flow rate significantly enhances the cooling efficiency within street canyons. Specifically, a stepwise increment of 0.3 L/min (e.g., from 0.6 to 1.2 L/min) reduces the minimum air temperature by 1.3 °C, while increasing the maximum RH by 7% in the canyon microenvironment.
- (2)
- Higher installation heights of spray nozzles can lead to a weakening of the mist cooling effect at pedestrian levels. For instance, the spray nozzle is raised for each meter (i.e., from 3 m to 5 m), the lowest temperature increases by 1.45 °C, and the maximum RH decreases by 7.4% inside the street canyon.
- (3)
- Elevated ambient RH enhances both humidification and cooling effects. Experimental results demonstrate that a 10% increase in background RH (from 50% to 70%) corresponds to a 0.3 °C increase in the minimum air temperature at pedestrian level, accompanied by an expansion of the humidified area within the street canyon.
- (4)
- When spray nozzles are installed adjacent to either windward- or leeward-side buildings, the resulting cooling and humidification effects are localized primarily beneath the spray nozzles. Notably, this configuration leads to a 0.9 °C rise in minimum temperature and a 5.2% reduction in maximum RH in surrounding areas, beyond the immediate spray zone.
- (5)
- Raising the installation height is more effective in maintaining the cooling zone proportion than decreasing the water flow rate.
Results demonstrate that spray cooling systems offer a practical micro-scale approach to economically alleviate UHI effects. The installation height and water flow rate of spray nozzles significantly influence their cooling potential at pedestrian-level height. This observation aligns with the findings of Montazeri (2017) derived from simulations of real urban areas [27], further validating the pivotal role of height and flow rate in the spray cooling mechanism.
As documented in the literature review (2019), over 82% and 75% of the surveyed articles directly employed temperature variation and humidity variation, respectively, as metrics to quantify cooling potential [49]. However, it is acknowledged that these metrics are relatively independent, and cannot comprehensively assess thermal comfort in the manner of integrated indices such as PET or the Temperature–Humidity Index (THI). Consequently, this limitation exists within the present research. Future work will incorporate these novel integrated indices.
It is recognized that the current analysis is confined to a single wind-direction scenario, and fails to account for solar radiation effects. Therefore, our future research will prioritize incorporating additional influencing factors for spray cooling, such as implementing diurnal variations in solar radiation, modifying street-canyon aspect ratios, and testing diverse wind speed/direction combinations. We explicitly plan to extend this work to 3D simulations in future research. This will allow us to systematically quantify the influence of the factors such as vertical vortices, secondary currents, and asymmetry, and validate/refine the findings from the current 2D study against more realistic scenarios. These enhancements will substantially improve the generalizability of our findings and deepen our understanding of the underlying mechanisms governing evaporative cooling performance.
This study employs the RANS turbulence model (specifically, the realizable k-ε model), as it satisfies the fundamental requirements for validating simulations of street canyons with water spray, while conserving computational resources. Nevertheless, future work will conduct a comparative accuracy assessment using the transient Large Eddy Simulation (LES) model. This aims to evaluate its capability for more precisely resolving microclimatic conditions within the street canyon. The comparative analysis is anticipated to provide a critical basis for selecting simulation models according to varying research objectives.
Author Contributions
Conceptualization, Y.D.; methodology, H.C.; software, H.M.; validation, H.C.; formal analysis, H.C.; investigation, H.C.; resources, H.M.; data curation, H.C.; writing—original draft preparation, H.C.; writing—review and editing, Y.D.; visualization, H.C.; supervision, Y.D.; project administration, Y.D.; funding acquisition, Y.D. All authors have read and agreed to the published version of the manuscript.
Funding
This research was funded by the National Natural Science Foundation of China (42405073) and the Guangdong Basic and Applied Basic Research Foundation (2023A1515010879).
Data Availability Statement
The data presented in this study are available on request from the corresponding author due to privacy.
Conflicts of Interest
The authors declare no conflict of interest.
Correction Statement
This article has been updated to include a Data Availability Statement. This change does not affect the scientific content of the article.
Appendix A. CFD Validation

Figure A1.
The image of wind tunnel experiments (left) and the sketch of the street canyon for validation (right).

Figure A2.
A comparative analysis of CFD results and wind tunnel measurements for the vertical profiles located at the centerline of the street canyon (depicted as Line A in Figure A1), focusing on (a) the normalized streamwise velocity (U/) and (b) a partial magnification of this velocity.

Figure A3.
The grid sensitivity analysis for the vertical profiles located at the target canyon.
The wind tunnel test was performed at the University of Gavle, in Sweden [50,51]. A total of 25 rows of meticulously crafted building models were strategically positioned within the operational segment of the wind tunnel, which featured dimensions of 1.25 m in length, 5 cm in width, and 12 cm in height (refer to Figure A1 in Appendix A, for visual clarification). Figure A1 and Figure A2 originate from Yang et al. This agreement signifies the accuracy and reliability of the CFD model employed. Examination of Figure A3 reveals that the finest grid configuration fails to demonstrate a significant enhancement in simulation outcomes, as measured by the normalized streamwise velocity (U/). Hence, we have opted for a fine grid with a minimum size of 0.1 m for our CFD simulations, considering both computational resources and the desired level of modelling accuracy.
References
- Ko, Y.J.; Elsagan, N. Investigation of the performance of fire suppression systems in protection of mass timber residential buildings. Indoor Built Environ. 2023, 32, 230–241. [Google Scholar] [CrossRef]
- Gomez-Acebo, I.; Llorca, J.; Dierssen, T. Cold-related mortality due to cardiovascular diseases, respiratory diseases and cancer: A case-crossover study. Public Health 2013, 127, 252–258. [Google Scholar] [CrossRef] [PubMed]
- Guo, Y.; Gasparrini, A.; Armstrong, B.; Li, S.; Tawatsupa, B.; Tobias, A.; Lavigne, E.; Zanotti Stagliorio Coelho, M.d.S.; Leone, M.; Pan, X.; et al. Global Variation in the Effects of Ambient Temperature on Mortality A Systematic Evaluation. Epidemiology 2014, 25, 781–789. [Google Scholar] [CrossRef] [PubMed]
- Zhou, H.Z.; Zhu, N.; Wang, Q.Q. Modelling and simulation of the urban heat island effect in a tropical seaside city considering multiple street canyons. Indoor Built Environ. 2021, 30, 1124–1141. [Google Scholar] [CrossRef]
- Li, X.; Zhou, Y.; Yu, S.; Jia, G.; Li, H.; Li, W. Urban heat island impacts on building energy consumption: A review of approaches and findings. Energy 2019, 174, 407–419. [Google Scholar] [CrossRef]
- Chen, L.; Mak, C.M. Integrated impacts of building height and upstream building on pedestrian comfort around ideal lift-up buildings in a weak wind environment. Build. Environ. 2021, 200, 107963. [Google Scholar] [CrossRef]
- Chen, L.; Mak, C.M.; Hang, J.; Dai, Y. Influence of elevated walkways on outdoor thermal comfort in hot-humid climates based on on-site measurement and CFD modeling. Sustain. Cities Soc. 2024, 100, 105048. [Google Scholar] [CrossRef]
- Chen, L.; Mak, C.M.; Hang, J.; Dai, Y.; Niu, J.; Tse, K.T. Large eddy simulation study on pedestrian-level wind environments around elevated walkways and influential factors in ideal urban street canyons. Build. Environ. 2023, 235, 110236. [Google Scholar] [CrossRef]
- Li, W.; Mak, C.M.; Cai, C.; Fu, Y.; Tse, K.T.; Niu, J. Wind tunnel measurement of pedestrian-level gust wind flow and comfort around irregular lift-up buildings within simplified urban arrays. Build. Environ. 2024, 256, 111487. [Google Scholar] [CrossRef]
- Dong, W.; Ma, D.P.; Lin, S.; Ye, S.; Wang, S.W.; Shen, L.; Chen, D.; Qiu, Y.Y.; Yang, B.; Cheng, T.L.; et al. The Dual Role of Urban Vegetation: Trade-Offs Between Thermal Regulation and Biogenic Volatile Organic Compound Emissions. Atmosphere 2025, 16, 385. [Google Scholar] [CrossRef]
- Junk, J.; Lett, C.; Trebs, I.; Hipler, E.; Torres-Matallana, J.A.; Lichti, R.; Matzarakis, A. Quantifying the Effects of Climate Change on the Urban Heat Island Intensity in Luxembourg-Sustainable Adaptation and Mitigation Strategies Through Urban Design. Atmosphere 2025, 16, 462. [Google Scholar] [CrossRef]
- Ming, T.Z.; Hu, Y.W.; Shi, T.H.; Li, Y.W.; Hu, S.J.; Yang, D.; Lv, B.; Peng, C.; Chen, Y.H. Effect of Blue-Green Infrastructure in Mitigating Microenvironmental Heat Islands: Field- and Simulation-Based Insights. Atmosphere 2025, 16, 134. [Google Scholar] [CrossRef]
- Taleghani, M.; Berardi, U. The effect of pavement characteristics on pedestrians’ thermal comfort in Toronto. Urban Clim. 2018, 24, 449–459. [Google Scholar] [CrossRef]
- Tomasso, L.P.; Studer, K.; Bloniarz, D.; Escandon, D.; Spengler, J.D. Development of Visualization Tools for Sharing Climate Cooling Strategies with Impacted Urban Communities. Atmosphere 2025, 16, 258. [Google Scholar] [CrossRef]
- Zhou, J.S.; Guo, C.; Hu, M.Q.; Tang, Y.N.; Zhou, L.J.; Chen, X.; Wang, Q.Q.; Zhu, X.T. How Did Plant Communities Impact Microclimate and Thermal Comfort in City Green Space: A Case Study in Zhejiang Province, China. Atmosphere 2025, 16, 390. [Google Scholar] [CrossRef]
- Zhang, C.F. Effects of water spray on smoke layer in buildings with natural venting. Indoor Built Environ. 2023, 32, 200–213. [Google Scholar] [CrossRef]
- Gao, Z.H.; Wang, P.; Cai, J.J.; Liu, M.G.; Li, L.J. Influence of the water spray particle diameter and flow rate on the smoke flow and the back-layering in tunnels with longitudinal ventilation. Indoor Built Environ. 2024, 33, 843–858. [Google Scholar] [CrossRef]
- Haeussermann, A.; Hartung, E.; Jungbluth, T.; Vranken, E.; Aerts, J.-M.; Berckmans, D. Cooling effects and evaporation characteristics of fogging systems in an experimental piggery. Biosyst. Eng. 2007, 97, 395–405. [Google Scholar] [CrossRef]
- Dombrovsky, L.A.; Solovjov, V.P.; Webb, B.W. Attenuation of solar radiation by a water mist from the ultraviolet to the infrared range. J. Quant. Spectrosc. Radiat. Transf. 2011, 112, 1182–1190. [Google Scholar] [CrossRef]
- Lotrecchiano, N.; Montano, L.; Bonapace, I.M.; Giancarlo, T.; Trucillo, P.; Sofia, D. Comparison Process of Blood Heavy Metals Absorption Linked to Measured Air Quality Data in Areas with High and Low Environmental Impact. Processes 2022, 10, 1409. [Google Scholar] [CrossRef]
- Zhang, C.; Yuan, S.; Zhang, N.; Li, C.; Li, H.; Yang, W. Dust-suppression and cooling effects of spray system installed between hydraulic supports in fully mechanized coal-mining face. Build. Environ. 2021, 204, 108106. [Google Scholar] [CrossRef]
- Meng, X.J.; Lv, Y.H.; Yang, H.G.; Wang, Y. The cooling effect of a spray fan in an indoor hot environment. Indoor Built Environ. 2021, 30, 851–858. [Google Scholar] [CrossRef]
- Xia, L.L.; Montazeri, H.; Blocken, B. On the accuracy of Eulerian-Lagrangian CFD simulations for spray On the accuracy of Eulerian-Lagrangian CFD simulations for spray evaporation in turbulent flow evaporation in turbulent flow. Int. J. Therm. Sci. 2025, 208, 109461. [Google Scholar] [CrossRef]
- Huang, C.; Ye, D.; Zhao, H.; Liang, T.; Lin, Z.; Yin, H.; Yang, Y. The research and application of spray cooling technology in Shanghai Expo. Appl. Therm. Eng. 2011, 31, 3726–3735. [Google Scholar] [CrossRef]
- Ulpiani, G.; Di Giuseppe, E.; Di Perna, C.; D'Orazio, M.; Zinzi, M. Thermal comfort improvement in urban spaces with water spray systems: Field measurements and survey. Build. Environ. 2019, 156, 46–61. [Google Scholar] [CrossRef]
- Zhang, M.; Xu, C.; Meng, L.; Meng, X. Outdoor comfort level improvement in the traffic waiting areas by using a mist spray system: An experiment and questionnaire study. Sustain. Cities Soc. 2021, 71, 102973. [Google Scholar] [CrossRef]
- Montazeri, H.; Toparlar, Y.; Blocken, B.; Hensen, J.L.M. Simulating the cooling effects of water spray systems in urban landscapes: A computational fluid dynamics study in Rotterdam, The Netherlands. Landsc. Urban Plan. 2017, 159, 85–100. [Google Scholar] [CrossRef]
- Kim, J.; Kang, J. Evaluating the efficiency of fog cooling for climate change adaptation in vulnerable groups: A case study of Daegu Metropolitan City. Build. Environ. 2022, 217, 109120. [Google Scholar] [CrossRef]
- Zhao, Y.; Zhao, K.; Zhang, X.; Zhang, Y.; Du, Z. Assessment of combined passive cooling strategies for improving outdoor thermal comfort in a school courtyard. Build. Environ. 2024, 252, 111247. [Google Scholar] [CrossRef]
- Yamada, H.; Yoon, G.; Okumiya, M.; Okuyama, H. Study of Cooling System with Water Mist Sprayers: Fundamental Examination of Particle Size Distribution and Cooling Effects. Build. Simul. 2008, 1, 214–222. [Google Scholar] [CrossRef]
- Yoon, G.; Yamada, H.; Okumiya, M. Study on a Cooling System Using Water Mist Sprayers: System Control Considering Outdoor Environment. In Proceedings of the Program and Abstracts of the 32nd International Conference Korea-Japan Joint Symposium on Human-Environment System, Cheju, Korea, 29–30 November 2008; pp. 104–107. Available online: https://www.google.com/url?sa=t&source=web&rct=j&opi=89978449&url=https://researchmap.jp/yoonlab/published_papers/21864538/attachment_file.pdf&ved=2ahUKEwitht_dhrePAxVxhf0HHTFNNMEQFnoECBcQAQ&usg=AOvVaw0pA7AGi4-u-mEBA0II6pTn (accessed on 13 May 2025).
- Salman, A.S.; Abdulrazzaq, N.M.; Tikadar, A.; Oudah, S.K.; Khan, J.A. Parametric study of heat transfer characteristics of enhanced surfaces in a spray cooling system: An experimental investigation. Appl. Therm. Eng. 2021, 183, 115824. [Google Scholar] [CrossRef]
- Peel, M.C.; Finlayson, B.L.; McMahon, T.A. Updated world map of the Koppen-Geiger climate classification. Hydrol. Earth Syst. Sci. 2007, 11, 1633–1644. [Google Scholar] [CrossRef]
- Huang, C.; Cai, J.; Lin, Z.F.; Zhang, Q.R.; Cui, Y.Z. Solving model of temperature and humidity profiles in spray cooling zone. Build. Environ. 2017, 123, 189–199. [Google Scholar] [CrossRef]
- Ge, L.M.; Gao, Y.; Meng, X. Effect of ethanol addition on enhancing the cooling performance improvement of spray system. Case Stud. Therm. Eng. 2024, 63, 105357. [Google Scholar] [CrossRef]
- Coccia, G.; Summa, S.; Di Giuseppe, E.; D'Orazio, M.; Zinzi, M.; Di Perna, C. Experimental evaluation of a water spray system for semi-outdoor spaces: Analysis of the effect of the operational parameters. Build. Environ. 2023, 241, 110456. [Google Scholar] [CrossRef]
- Farnham, C.; Nakao, M.; Nishioka, M.; Nabeshima, M.; Mizuno, T. Study of mist-cooling for semi-enclosed spaces in Osaka, Japan. In Proceedings of the Conference on Urban Environmental Pollution—Overcoming Obstacles to Sustainability and Quality of Life, Boston, MA, USA, 20–23 June 2010; pp. 228–238. [Google Scholar]
- Bao, J.; Wang, Y.; Xu, X.; Niu, X.; Liu, J.; Qiu, L. Analysis on the influences of atomization characteristics on heat transfer characteristics of spray cooling. Sustain. Cities Soc. 2019, 51, 101799. [Google Scholar] [CrossRef]
- Fahed, J.; Kinab, E.; Ginestet, S.; Adolphe, L. Impact of urban heat island mitigation measures on microclimate and pedestrian comfort in a dense urban district of Lebanon. Sustain. Cities Soc. 2020, 61, 102375. [Google Scholar] [CrossRef]
- Kim, J.; Kang, J. AI based temperature reduction effect model of fog cooling for human thermal comfort: Climate adaptation technology. Sustain. Cities Soc. 2023, 95, 104574. [Google Scholar] [CrossRef]
- Li, Y.; Hong, B.; Wang, Y.; Bai, H.; Chen, H. Assessing heat stress relief measures to enhance outdoor thermal comfort: A field study in China's cold region. Sustain. Cities Soc. 2022, 80, 103813. [Google Scholar] [CrossRef]
- Mao, H.; Meng, Q.; Li, S.; Qi, Q.; Wang, S.; Wang, J. Cooling effects of a mist-spraying system on ethylene tetrafluoroethylene cushion roofs in hot-humid areas: A case study in Guangzhou, China. Sustain. Cities Soc. 2021, 74, 103211. [Google Scholar] [CrossRef]
- Shi, W.; Yang, H.; Ma, X.; Liu, X. Techno-economic evaluation and environmental benefit of hybrid evaporative cooling system in hot-humid regions. Sustain. Cities Soc. 2023, 97, 104735. [Google Scholar] [CrossRef]
- Montazeri, H.; Blocken, B.; Hensen, J.L.M. Evaporative cooling by water spray systems: CFD simulation, experimental validation and sensitivity analysis. Build. Environ. 2015, 83, 129–141. [Google Scholar] [CrossRef]
- ANSYS Fluent 12. 0 Theory Guide; ANSYS Inc.: Canonsburg, PA, USA, 2009. [Google Scholar]
- Sureshkumar, R.; Kale, S.R.; Dhar, P.L. Heat and mass transfer processes between a water spray and ambient air—I. Experimental data. Appl. Therm. Eng. 2008, 28, 349–360. [Google Scholar] [CrossRef]
- Morsi, S.A.; Alexander, A.J. An investigation of particle trajectories in two-phase flow systems. J. Fluid Mech. 1972, 55, 193–208. [Google Scholar] [CrossRef]
- Sun, H.; Zhong, H.; Dik, A.; Ding, K.M.; Jimenez-Bescos, C.; Calautit, J.K. Numerical investigation of evaporative cooling strategies on the aero-thermal performance of courtyard buildings in hot-dry climates. Build. Environ. 2024, 258, 111588. [Google Scholar] [CrossRef]
- Ulpiani, G. Water mist spray for outdoor cooling: A systematic review of technologies, methods and impacts. Appl. Energy 2019, 254, 113647. [Google Scholar] [CrossRef]
- Yang, H.; Lam, C.K.C.; Lin, Y.; Chen, L.; Mattsson, M.; Sandberg, M.; Hayati, A.; Claesson, L.; Hang, J. Numerical investigations of Re-independence and influence of wall heating on flow characteristics and ventilation in full-scale 2D street canyons. Build. Environ. 2021, 189, 107510. [Google Scholar] [CrossRef]
- Zhang, K.; Chen, G.; Wang, X.; Liu, S.; Mak, C.M.; Fan, Y.; Hang, J. Numerical evaluations of urban design technique to reduce vehicular personal intake fraction in deep street canyons. Sci. Total Environ. 2019, 653, 968–994. [Google Scholar] [CrossRef]
Disclaimer/Publisher’s Note: The statements, opinions and data contained in all publications are solely those of the individual author(s) and contributor(s) and not of MDPI and/or the editor(s). MDPI and/or the editor(s) disclaim responsibility for any injury to people or property resulting from any ideas, methods, instructions or products referred to in the content. |
© 2025 by the authors. Licensee MDPI, Basel, Switzerland. This article is an open access article distributed under the terms and conditions of the Creative Commons Attribution (CC BY) license (https://creativecommons.org/licenses/by/4.0/).