Article

A Study of the Low-Ozone Episode over Scandinavia and Northwestern Russia in March 2025

1
Central Aerological Observatory, Dolgoprudny, 141700 Moscow, Russia
2
Obukhov Institute of Atmospheric Physics of the Russian Academy of Science, 119017 Moscow, Russia
3
Department of Science, Technology and Innovation (DSTI) of Russian State Hydrometeorological University, 195196 Saint Petersburg, Russia
4
Institute of Ecology, Biotechnology and Nature Management, Kazan Federal University, 420008 Kazan, Russia
5
Faculty of Geography, Lomonosov Moscow State University, 1119991 Moscow, Russia
6
Atmospheric Physics Department, Saint Petersburg University, 199034 Saint Petersburg, Russia
7
Voeikov Main Geophysical Observatory, 194021 Saint Petersburg, Russia
*
Author to whom correspondence should be addressed.
Atmosphere 2025, 16(9), 1033; https://doi.org/10.3390/atmos16091033
Submission received: 30 May 2025 / Revised: 26 August 2025 / Accepted: 29 August 2025 / Published: 30 August 2025
(This article belongs to the Section Atmospheric Techniques, Instruments, and Modeling)

Abstract

Following a very cold first half of the Arctic stratosphere winter of 2024–2025, the stratospheric polar vortex weakened from late February. The increase in the polar lower stratosphere temperature led to a decrease in the polar stratospheric cloud (PSC) type I (NAT) volume from ~80 million km3 to zero. The polar vortex weakening and temperature increase continued in early March, when major sudden stratospheric warming occurred. Although the polar cap total column ozone (TCO) significantly increased during this period, an ozone mini-hole formed over Scandinavia and northwestern Russia, with TCO values as low as 220–240 Dobson units, according to satellite observations and ground-based measurements over St. Petersburg and Moscow on 5–6 March 2025. Chemistry-transport model calculations using MERRA2 reanalysis data were performed to investigate the role of chemical ozone depletion and dynamical processes in the low TCO values in early March. Model experiments show that dynamical processes played a predominant role in the formation of low TCO values, but the role of chemical processes was not negligible. Associated with the TCO anomaly, the difference relative to the standard ozone level in the UV indices over Moscow, St. Petersburg and Helsinki reached up to 60–100%.

1. Introduction

The interannual variability of the springtime Arctic ozone is determined by the dynamic conditions of the lower stratosphere [1,2]. Polar stratospheric clouds (PSCs) form during winters with a persistent stratospheric polar vortex with low temperatures, on the particles of which ozone-depleting compounds are activated. If the low temperature of the polar lower stratosphere persists until the spring (solar irradiance begins to penetrate the polar stratosphere), and chemical destruction of the ozone occurs, this can lead to a significant decrease in the total ozone content [1].
The greatest depletion of the Arctic ozone layer was observed in the spring of 2020; see, e.g., [3,4,5,6]. Due to severe ozone depletion (up to 90% in the lower stratosphere over some polar stations [7]), ground-based measurements showed significant increases in surface UV radiation (UVR) in March and early April 2020, increasing on some days by up to 140% [8]. Since solar zenith angles were low, UVR levels stayed within average safe limits. However, after winter, skin is more sensitive to UVR, so even slight increases in spring should be considered [9].
Strong Arctic ozone depletion (e.g., as that in the spring of 2011 [10]) lead to increased UVR in the mid–high latitudes of the Northern Hemisphere, which persist until the summer months [11].
The global ozone layer is expected to recover to pre-1980 levels by around the middle of the 21st century, assuming global compliance with the Montreal Protocol [1]. However, dynamic conditions may be conducive to strong ozone destruction in the Arctic as far as the late 21st century due to a decrease in the temperature of the stratosphere caused by the continuous increase in greenhouse gas concentrations [12,13,14]. In addition to the destruction of ozone in the polar stratosphere, ozone mini-holes (OMHs) form in the mid–high northern latitudes. These OMHs are related to anticyclones with an elevated tropopause; see, e.g., [15]. Typically, the duration of such anomalies is several days. OMHs are formed more often in winter than in summer [16]. OMHs can sometimes be long-lasting and large-scale, such as the one associated with the record-breaking blocking anticyclone over western Russia and Eastern Europe in the summer of 2010 [17,18,19]. The other example is the OMH associated with the European heatwave in August 2003 [20]. The stratosphere–troposphere exchange can lead to quick variations (hours to days) in the ozone abundance in the lower stratosphere and the upper troposphere. Particularly it was shown that intermittent reduction in the stratospheric ozone over northern Europe at the beginning of November 2018 was caused by intrusion of tropospheric air which was initially uplifted by a storm in the northern Atlantic [21].
In addition to dynamic processes [22,23], chemical processes of ozone destruction at high altitudes also played a role in the formation of OMHs in some cases, e.g., in northern Siberia in January–March 2016 [24]. It was shown that ozone depletion did not have a significant impact on surface UVR levels (estimated as UV index) in the case of this OMH, primarily due to low solar zenith angles [25]. A significant increase in the maximum values of the UV index (characterizing the levels of UVR affecting human health) from ~6 to ~8 was detected for the OMH on 22–24 May 2021, over the Southern Urals and the Southern Volga region [26].
A link between increased erythemal UVR values and decreased ozone content related to OMHs has been shown, for example, in Austria [27] and Germany [28]. In the US, EU and other countries (including Russia), the incidence of one of the most dangerous types of cancer—melanoma—continues to rise [29,30]. One of the main causes of this type of cancer is excess levels of UVR; see, e.g., [29]. A link between the reduction in the ozone layer, the increase in surface UVR and the risk of melanoma was identified for the period 1980–1990 based on an analysis of diagnostic data from more than 2.4 million Canadian residents [31].
As a result of ongoing climate warming, the likelihood of longer blocking anticyclones is increasing [32], which may lead to more frequent formation of OMHs in the Euro-Atlantic sector [33]. Diverging changes for the sizes of low-ozone episodes over Europe are projected in future [34]. Thus, studying the roles of both dynamic and chemical processes in the formation of ozone layer anomalies remains a challenging scientific task, given the vital importance of the ozone layer in protecting the biosphere from dangerous levels of UV radiation.
The winter circulation in the Arctic stratosphere persists usually until late March; therefore, this period is often called the “winter season.” The 2024–2025 winter season in the Arctic stratosphere (i.e., in December–January and early February) was characterized by a very cold, persistent stratospheric polar vortex, similar to the 2019–2020 winter, which was associated with the record destruction of the ozone layer. Warming of the polar stratosphere began in the second half of February 2025. A reversal of zonal circulation in the middle stratosphere occurred in early March, leading to an early final Sudden Stratospheric Warming (SSW) event.
However, at the beginning of March 2025, an area of significantly reduced total column ozone (TCO) formed over northwestern Russia and Scandinavia, with the lowest values close to the commonly used boundary level of the ozone hole in Antarctica: 220 Dobson units (DU). Such low TCO values are very rare in the Arctic.
In this paper, we investigate for the first time the role of dynamic and chemical processes in the formation of a significant ozone anomaly in early March 2025, characterized by the second lowest TCO value for Moscow since 1986 and the first one for St. Petersburg since the early 1980s. In addition, the impact of this ozone layer anomaly on surface UVR levels over St. Petersburg, Moscow and Helsinki in comparison to climate mean values was investigated.
The remainder of this paper is organized as follows: Section 2 describes the employed data and methods of analysis. The obtained results on parameters of the low-ozone episode in March 2025, revealed dynamic processes in the Arctic stratosphere, including formation of the minor and major SSW events in February–March 2025, and surface UVR changes are described in Section 3. The discussion and conclusions are given in Section 4.

2. Methods, Data and Model Experiments

2.1. Dynamical Processes of Stratosphere

Dynamical processes in the extratropical boreal troposphere and stratosphere that can impact the ozone layer were analyzed using daily data of NCEP [35] and ERA5 reanalysis [36]. The horizontal resolution of NCEP reanalysis is 2.5° × 2.5°, and the upper boundary is at the pressure level of 10 hPa (~30 km). The horizontal resolution of the ERA5 reanalysis data is 0.25° × 0.25°, and the upper boundary is at the pressure level of 1 hPa (~50 km).
An overall good agreement across modern reanalyses was found in the representation of the most abrupt phenomena of the boreal winter stratospheric circulation variability with a strong impact on ozone layer—SSW events [37].

2.2. Total Column Ozone Satellite Observations and Ground-Based Measurement Data

The TCO anomaly was analyzed using satellite observations, ground-based measurements and ERA5 reanalysis data.
The overpass data of the Ozone Monitoring Instrument (OMI) aboard NASA’s Aura satellite (since 2004), Ozone Mapping and Profiler Suite (OMPS) aboard the Suomi NPP satellite (since 2011), GOME aboard the ERS-2 satellite (since 1995) and the Total Ozone Mapping Spectrometer (TOMS) aboard the Nimbus-7 satellite (since 1979) were employed over Russia’s largest cities: Moscow (55.4° N 37.5° E) and St. Petersburg (60° N 30.3° E). The GOME data are available from the Institute of Environmental Physics, University of Bremen, Germany (https://www.iup.uni-bremen.de/gome/wfdoas/overpass, accessed on 25 May 2025) and the others from NASA’s Ozone Watch (https://ozonewatch.gsfc.nasa.gov, accessed on 25 May 2025). Overpass data products (8th version) provide satellite ozone measurements acquired over a set of ground stations. As overpass satellite datasets contain up to 4 measurements per day, the daily averages were analyzed.
Global daily TCO data measured by the TOMS, GOME and OMI satellite instruments have comprised the basic TCO datasets since the late 1970s up to the present. These data have been validated in comparison with the reference ground-based measurements, updated via improvement of algorithms s and successfully used in numerous studies of ozone layer variability and recovery in recent decades; see, e.g., WMO, 2022 [1].
Additionally, ERA5 reanalysis TCO, vertical ozone distribution, geopotential, zonal and meridional wind daily data with a longitude–latitude resolution of 0.25° × 0.25° were used to analyze temporal variability, spatial peculiarities of the ozone anomaly and the dynamical processes that contributed to its formation.
The change in the ozone layer in January–March 2025, was analyzed over the capital of Finland, Helsinki (60.2° N 25° E) in addition to Moscow and St. Petersburg using OMI/Aura satellite and ERA5 reanalysis data. Helsinki is located about 300 km west of St. Petersburg.
The employed TCO daily climate means were calculated using TOMS measurements over the period before large ozone anomalies (1978–1988) observed in the Arctic since the beginning of the 1990s.
The TCO anomaly investigated in the present study was characterized by very low TCO values, which were only slightly above the accepted conventional threshold of the ozone hole at 220 DU (periodically observed in the Antarctic stratosphere and much more rarely in the Arctic stratosphere). Therefore, it is denoted hereafter as a low-ozone episode or an ozone mini-hole.

2.2.1. DOAS Measurements

Regular ground-based DOAS observations of atmospheric ozone content based on zenith sky measurements of scattered visible radiation have been carried out near St. Petersburg (Peterhof, 59.88° N 29.82° E) since 2004 [38,39]. The measurements are performed using a spectral complex for automated acquisition of solar radiation scattered from the zenith, designed on the basis of a commercial HR4000 spectrometer from Ocean Optics, Inc. (http://oceanoptics.com accessed on 24 May 2025). The scattered radiation spectra are acquired in the visible region of ~400–610 nm with a spectral resolution of ~0.6 nm. The measured spectra of scattered radiation are interpreted using the traditional technique of differential absorption, DOAS [40], in combination with numerical modeling of radiative transfer in the atmosphere. The spectrum window 428–515 nm is used to determine the effective ozone content along the solar radiation propagation path (or the so-called slant content). The obtained effective (slant) contents are transformed into the desired vertical contents (total content in the vertical column of the atmosphere) using modeled coefficients, the so-called air mass factors (AMFs). The AMF coefficients are calculated using the atmospheric radiative transfer model (SCIATRAN [41]), based on given a priori information about the state and composition of the atmosphere (standard average annual model U.S. Standard Atmosphere). The total errors for the ground-based method used are, according to our estimates, ~10%.
The results of DOAS measurements of total ozone content in the St. Petersburg region in January–March 2025 were analyzed. DOAS measurements are presented in two data series, namely, at sunrise and sunset. For comparison, data from satellite measurements by the OMI are also presented. As in the OMI data, the minimum ozone content for the considered period of DOAS measurements was registered on March 6 and amounted to ~220 DU at sunset and ~230 DU at sunrise on March 7 (~220 DU as measured by the OMI on March 6 at daytime, ~10:30 UTC). When discussing marked discrepancies between the results of DOAS measurements at sunrise and sunset and daytime OMI data, one should take into account the large spatial extent of the effective zone of twilight ground-based sounding and its shift in the direction towards the Sun. Such a shift can be ~200 ÷ 800 km to the east or west of the observation station in the DOAS measurements for February–March in St. Petersburg. Under conditions of large spatiotemporal variability of the TCO field, the noted feature of the measurement method can lead to discrepancies in the compared data.

2.2.2. M-124 Filter Ozonometers

The total column ozone data from M-124 filter ozonometers at two stations at the Voeikov Main Geophysical Observatory (MGO) and in the Central Aerological Observatory (CAO) near Moscow were also analyzed. Both stations are located ~20 km from the center of St. Petersburg and Moscow. The M-124 ozonometer is the main instrument used in the ozone monitoring network in Russia [42]. Measurements using direct and diffused to zenith solar radiation have been carried out with this instrument in recent decades.
Measurements from the M-124 ozonometer at St. Petersburg have been used, along with other ground-based measurements from more than 30 European stations, to study the Arctic ozone anomaly of spring 2020 [6].
The calibration and quality control of M-124 ozonometers is carried out at the MGO using the Dobson ozone spectrophotometer, which has been used in comparison with the European regional standard. The relative error in measuring the TOC is ±5% for direct sunlight and light from the zenith of a clear sky, and ±7% at low solar altitudes (5–14°) [43,44].

2.3. Chemistry-Transport Model Experiments

Experiments were carried out on the global chemistry-transport model of the Russian State Hydrometeorological University (RSHU CTM) to assess the relative roles of chemical and dynamic processes in the formation of the investigated ozone anomaly. The temporal evolution of the Arctic stratospheric gases was simulated using meteorological fields from Modern-Era Retrospective Analysis for Research and Applications version 2 (MERRA-2) reanalysis data [45], as in [46]. Therefore, meteorological fields (particularly stratospheric polar vortex temporal variability and spatial structure) in the CTM at each time step correspond to the MERRA-2 reanalysis.
The employed version of the CTM is based on the Institute of Numerical Mathematics and RSHU chemistry climate model (INM RAS—RSHU CCM) [47]. The CTM has a 5° × 4° longitude–latitude resolution, 31 vertical sigma levels from the surface up to ~60 km and includes 74 oxygen, hydrogen, nitrogen, chlorine, bromine, carbon and sulfate species. The chemical reactions of these species were calculated according to [48].
Polar stratospheric cloud (PSC) formation and evolution were treated as a NAT STS (super cooled ternary solution) (H2O/HNO3/H2SO4) based on the parameterization described in [49] and ice. PSCs’ surface variability, depending on the temperature, pressure and partial pressures of the relevant gases—including denitrification and dehydration through sedimentation—was taken into account according to [50]. CTM experiments were performed over the period of January–March 2025.
The initial model conditions were taken from historical calculations using the chemistry–climate model of the INM RAS—RSHU [47] for the period from 1979 to 2019.
Assimilation of MERRA2 data of surface pressure, temperature, zonal and meridional wind speeds and absolute air humidity was carried out in STM using the method of successive refinements [51]. For each model node, 16 nearest points of the MERRA2 horizontal grid were taken into account (with a longitude–latitude resolution of 1.25° × 1.25°).
The weights of each of these 16 values were calculated proportionally to the square of the distance from the model grid node to the MERRA2 grid node [52]. The vertical velocity was calculated on the model grid from the continuity equation. All chemical components were calculated in the model without assimilation of reanalysis data.
Model numerical experiments were performed for three scenarios. The first scenario included all processes influencing the variability in ozone content (PSC scenario): the gas-phase, heterogeneous processes on sulfate aerosol and heterogeneous processes on the surface of PSCs.
In the second scenario, the chemical processes of ozone formation and destruction were not taken into account (NoCHEM scenario) for any of the model points north of 52° N. In this experiment, the variability in ozone content was determined only via dynamic processes.
The third scenario did not include chemical processes involving polar stratospheric clouds (the NoPSC scenario). However, gas-phase chemical processes and heterogeneous processes on the surface of the stratospheric sulfate aerosol were taken into account in the calculations. The results of calculations for this scenario allow the role of the formation and evolution of PSCs in ozone destruction to be assessed in comparison with purely dynamic effects (the NoCHEM scenario) and with gas-phase and heterogeneous processes on sulfate aerosol.

2.4. Surface UV Radiation

We simulated the surface erythemal UV radiation and UV resources to characterize the favorable and unfavorable impacts of UV radiation on human health for different types of skin at noon conditions [53] for the period of the low-TOC episode in March 2025. The online tool for these calculations is available at http://momsu.ru/uv/ (accessed on 24 May 2025). The main principle for the UV resources attribution lies in the evaluation of conditions with UV deficit and UV excess. UV excess conditions can be evaluated using the minimum erythemal dose (MED) for different skin types, while a minimum vitamin D dose production threshold can be estimated using Equation (2) from [53], while additionally accounting for the open body fraction parameter. As a result, we quantified the UV optimum category as the range of conditions between these two thresholds. All the simulations were based on detailed lookup tables for a wide range of geophysical parameters using the 8-stream DISORT model available in the TUV model [54]. All simulations described in this paper were performed for skin type 2 and a standard open skin fraction 0.25. A detailed description of this approach can be found in [53,55]. In addition, UV indices were used in the analysis. The UV index is a widely used measure that is equal to erythemally weighted irradiance expressed in Wm-2 multiplied by 40 [56].
Simulations were performed both for clear sky and typical cloudy conditions. The application of UVR estimated in clear sky conditions is a common approach in such calculations, in order to evaluate the highest UVR level while avoiding the uncertainties caused by the temporal variability and spatial structure of clouds as well as the effects of cloud types on UVR.

3. Results

3.1. Temperature of Polar Stratosphere

One of the characteristics of the strength of the stratospheric polar vortex and the favorable conditions for the onset of chemical destruction of the ozone layer in the late winter season is the volume of air masses with temperatures sufficient for the formation of PSCs (hereafter Vpsc). The Arctic is characterized by PSCs type I (NAT), formed at temperatures below about 195 K (−78 °C) [57].
In addition to providing a media for activating ozone-depleting compounds, the PSCs participate in denitrification that can delay chlorine deactivation and consequently prolong the ozone layer reduction. There are three distinct forms of PSCs: Nitric Acid Trihydrate (NAT, HNO3-H2O), Supercooled Ternary Solution (STS, H2SO4-HNO3-H2O), and ICE (H2O).
Over the past few decades, the most severe ozone depletion in the Arctic occurred in the following winter seasons: 1996–97, 2010–11, 2015–16 and the record-breaking 2019–2020; see, e.g., [1,4,10]. Figure 1 displays the Arctic minimum lower temperature variability in the winter season of 2024–2025, in comparison with the other winters with the strong ozone layer depletion and values of Vpsc type I (NAT) and Vpsc type II (ICE). The minimum temperature in the lower polar cap stratosphere was lower than the climatological mean over the whole 2024–2025 winter season until late March (Figure 1a).
Such low temperatures led to the formation of a large Vpsc. In December 2024, the monthly mean volume of PSCs was the third-highest after December 2015 and December 2019; in January 2025, it was the second-highest after January 2016; and that in February 2025 was the largest among the winter seasons under consideration, with a total of ~90 million km3 (Figure 1b). In March 2025, as a result of the minor and major SSW events, the PSC NAT volume was significantly reduced to ~10 million km3.
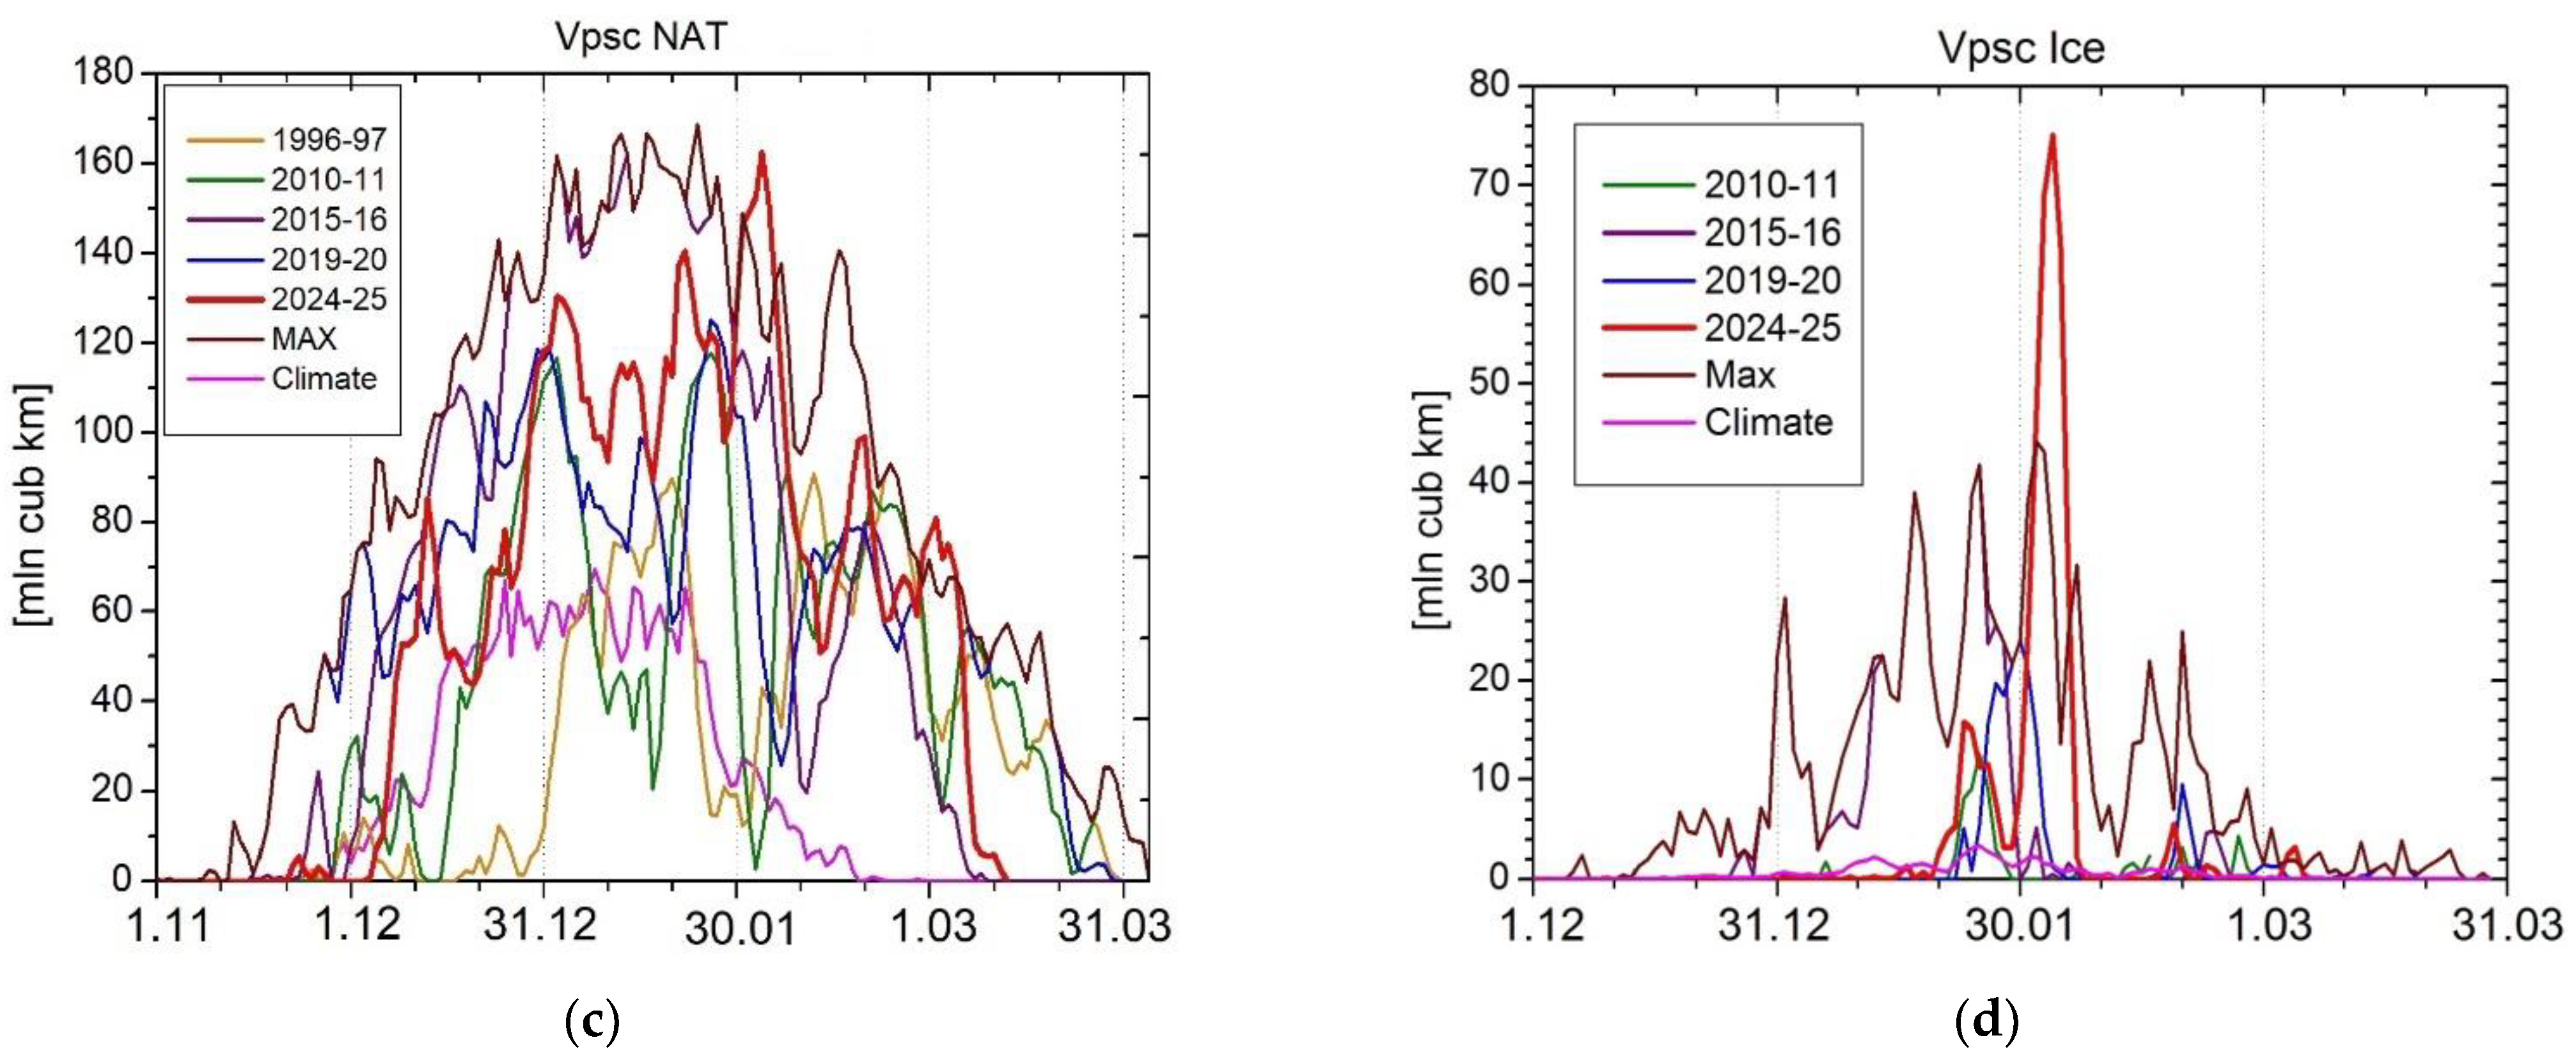
The lowest minimum temperature was observed in early February 2025, when it dropped below 188 K (−83 °C) for about a week. During this time, the Vpsc NAT exceeded the corresponding values of winter seasons with the largest destruction of the ozone layer—including 2019–2020—and reached record-breaking values of about 160 million km3, the highest since 1979 (Figure 1c).
Such low temperatures in the polar lower stratosphere allowed for the formation of PSC type II ICE consisting of ice particles (Figure 1d). The maximum Vpsc ICE value reached ~75 million km3 and exceeded the maximum values for all years of observation by almost 2 times.
The Arctic ozone anomaly of the winter of 2019–2020 was the strongest one over the entire period of observation, as a result of a strong and persistent stratospheric polar vortex observed until late March 2020. The minimal polar cap temperature rapidly increased and reached climate mean values in late March 2025 due to weakening of the stratospheric polar vortex in late February—and especially in early March 2025, as a result of the major SSW—whereas it was 15–20 degrees lower during March 2020 (Figure 1a). As a result, the monthly mean PSC type I NAT volume value was reduced by over two-fold in March 2025 in comparison to March 2020 (Figure 1b). Therefore, due to the weaker monthly polar cap ozone destruction, the TCO mean was higher in March 2025 than in March 2020: 414 DU and 323 DU, respectively.

3.2. Ozone Layer

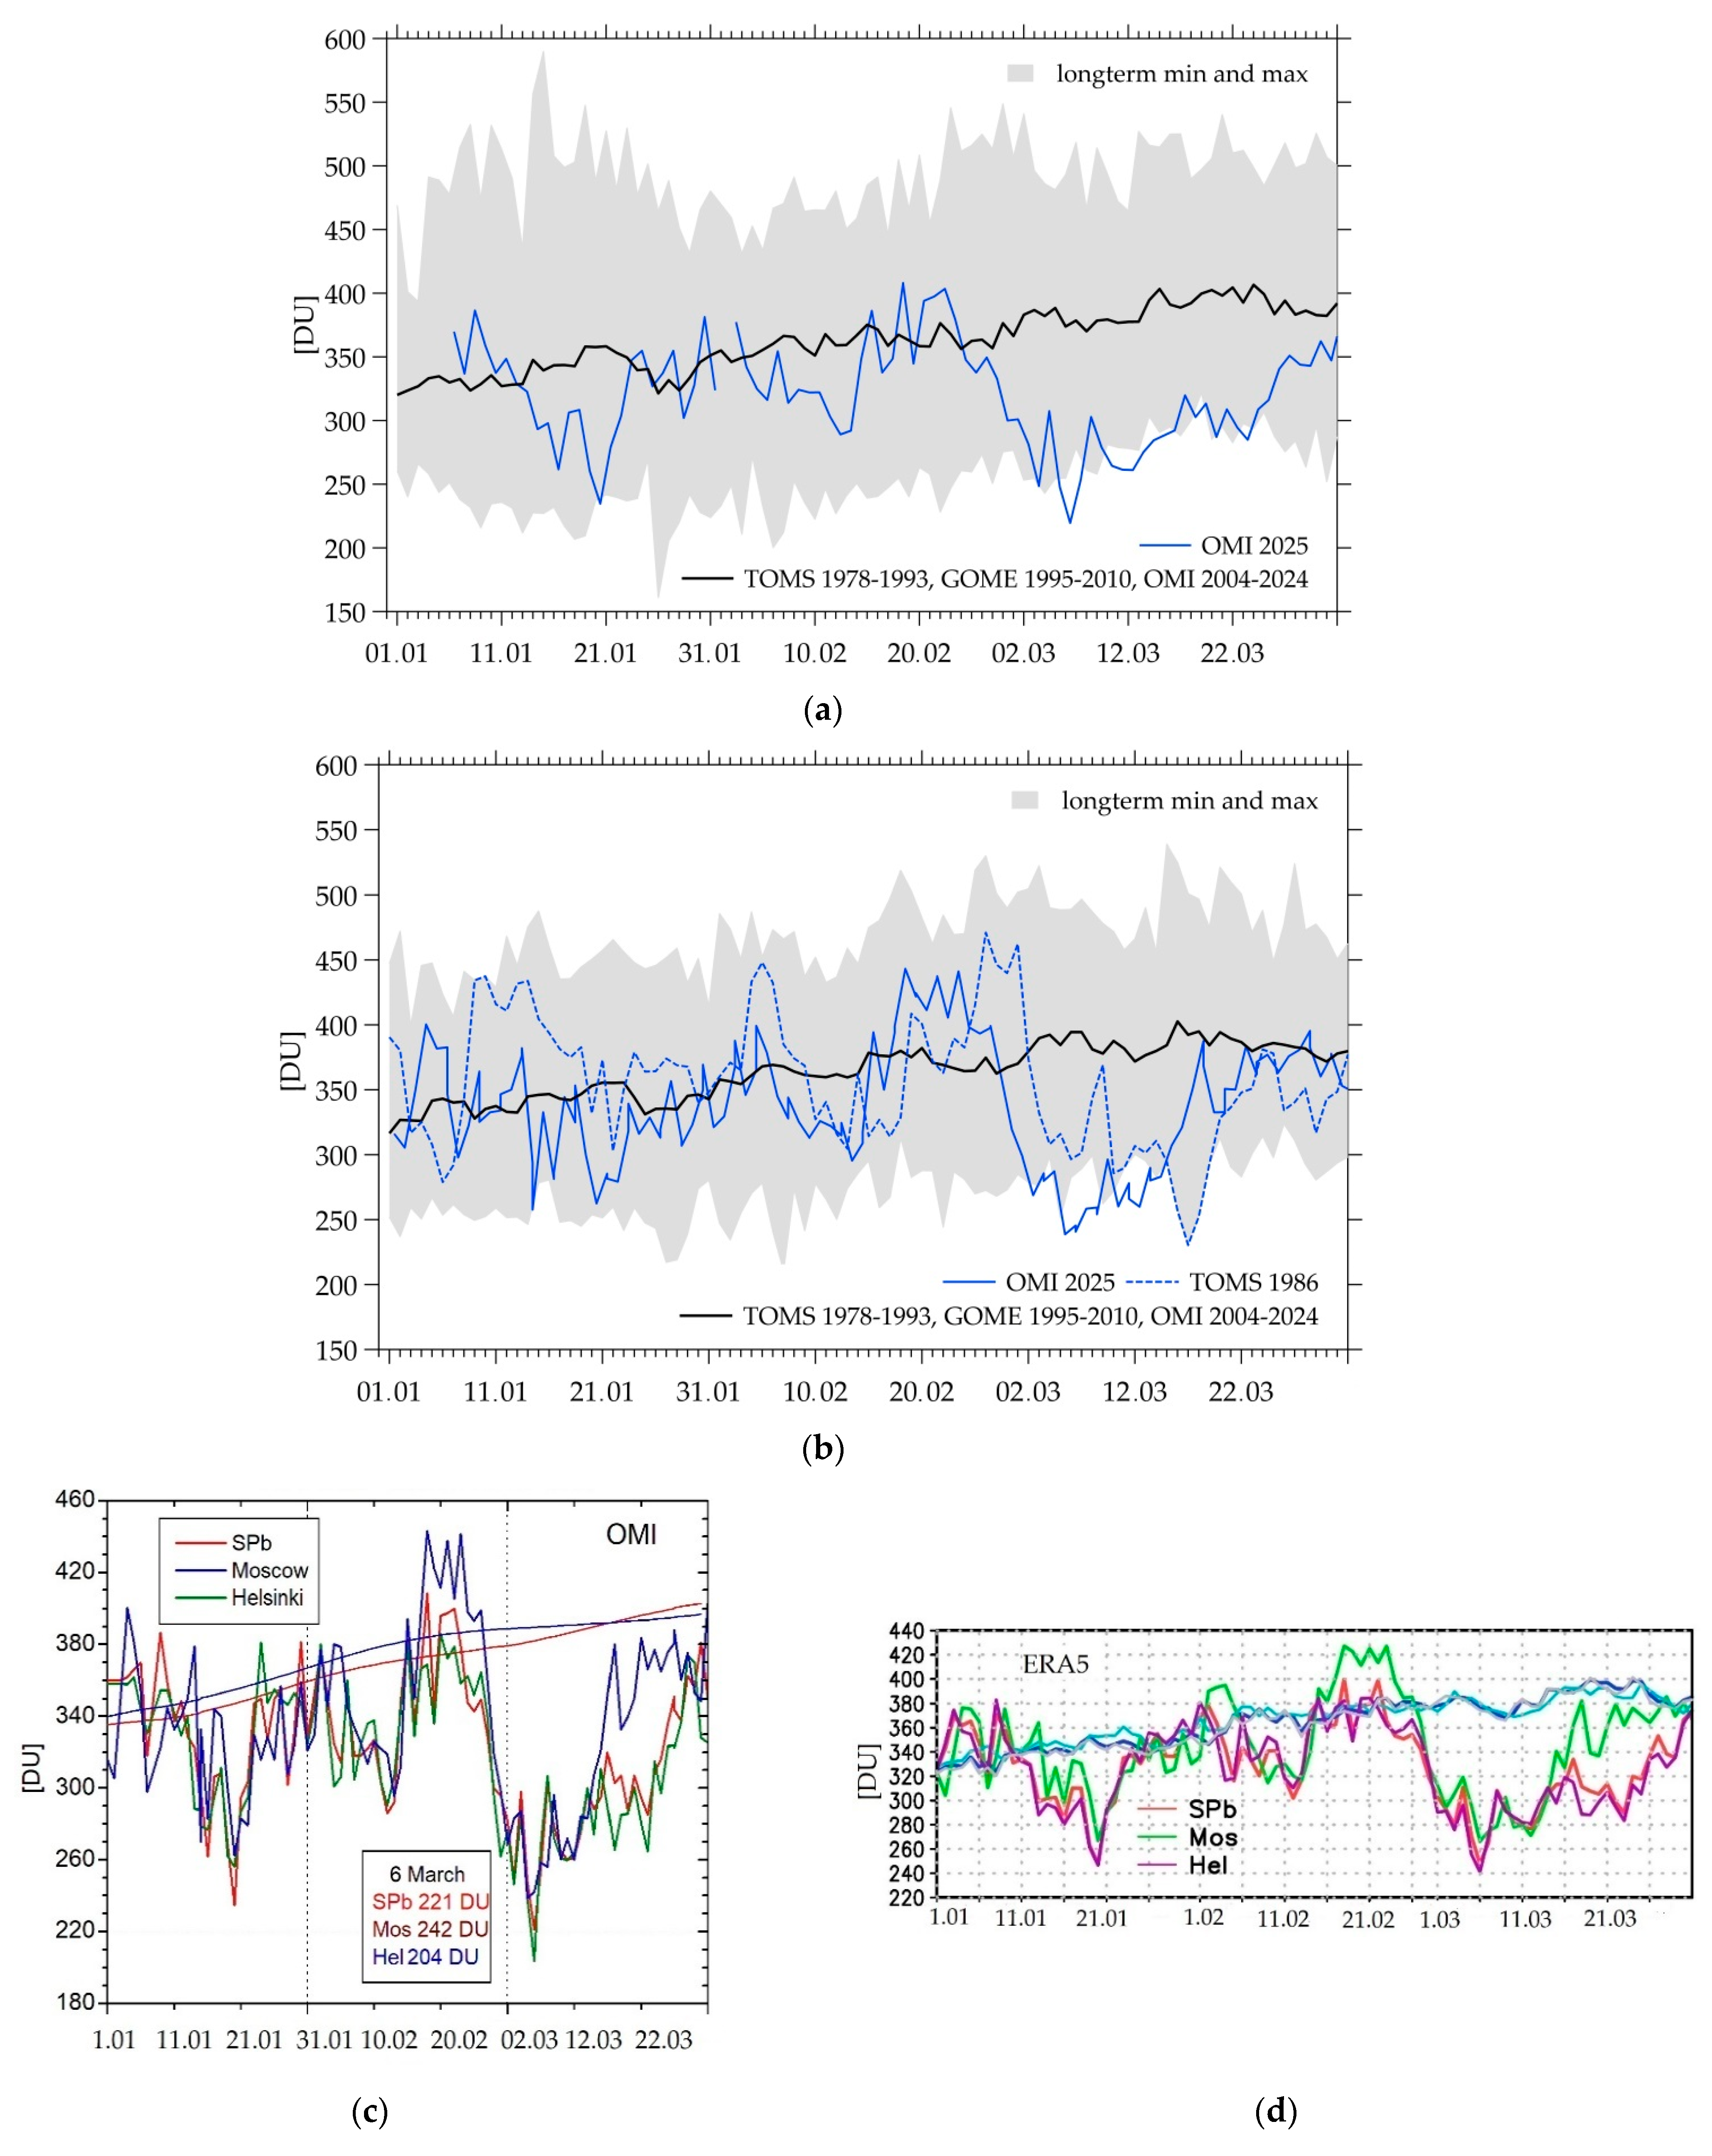
The characteristics of the ozone layer anomaly over St. Petersburg, Moscow and Helsinki in early March 2025 are discussed further using the satellite and ERA5 reanalysis TCO data (Figure 2). Analysis of TCO measurement data from the TOMS instrument for the period from 1979 to 1993, GOME instrument (1995–2010) and OMI (2002–2025) showed that the lowest spring TCO values of about 220 DU were observed in St. Petersburg in early March 2025 (Figure 2a).
The lowest TCO values of ~230 DU in Moscow were observed on 17 March 1986. The value of 240 DU on 6 March 2025 in the OMI data is the second-lowest in terms of satellite observational data after 1986 (Figure 2b). Thus, the minimum TCO value of 221 DU on 6 March 2025 for St. Petersburg is a record for spring, and the value for Moscow (240 DU) is close to the record value of 230 DU for the entire period of operation of the TOMS, GOME and OMI satellite instruments. The TCO anomaly for St. Petersburg and Moscow according to OMI data on 6 March 2025 differed by ~40% (or ~3 standard deviation units) relative to the average values for the period 1978–1988.
OMI TCO data for Helsinki, St. Petersburg and Moscow display rather similar temporal variability over January–March 2025, with three periods of decreased TCO respective to climate means (Figure 2c). The first one was observed in the middle of January, over about a week, with the lowest values being 240–260 DU. The second period was in early February, over about 7–10 days, with the lowest values being 290–300 DU. The third period was observed in the first half of March, with the lowest values on 6 March being 221 DU in St. Petersburg, 242 DU in Moscow and 204 DU in Helsinki.
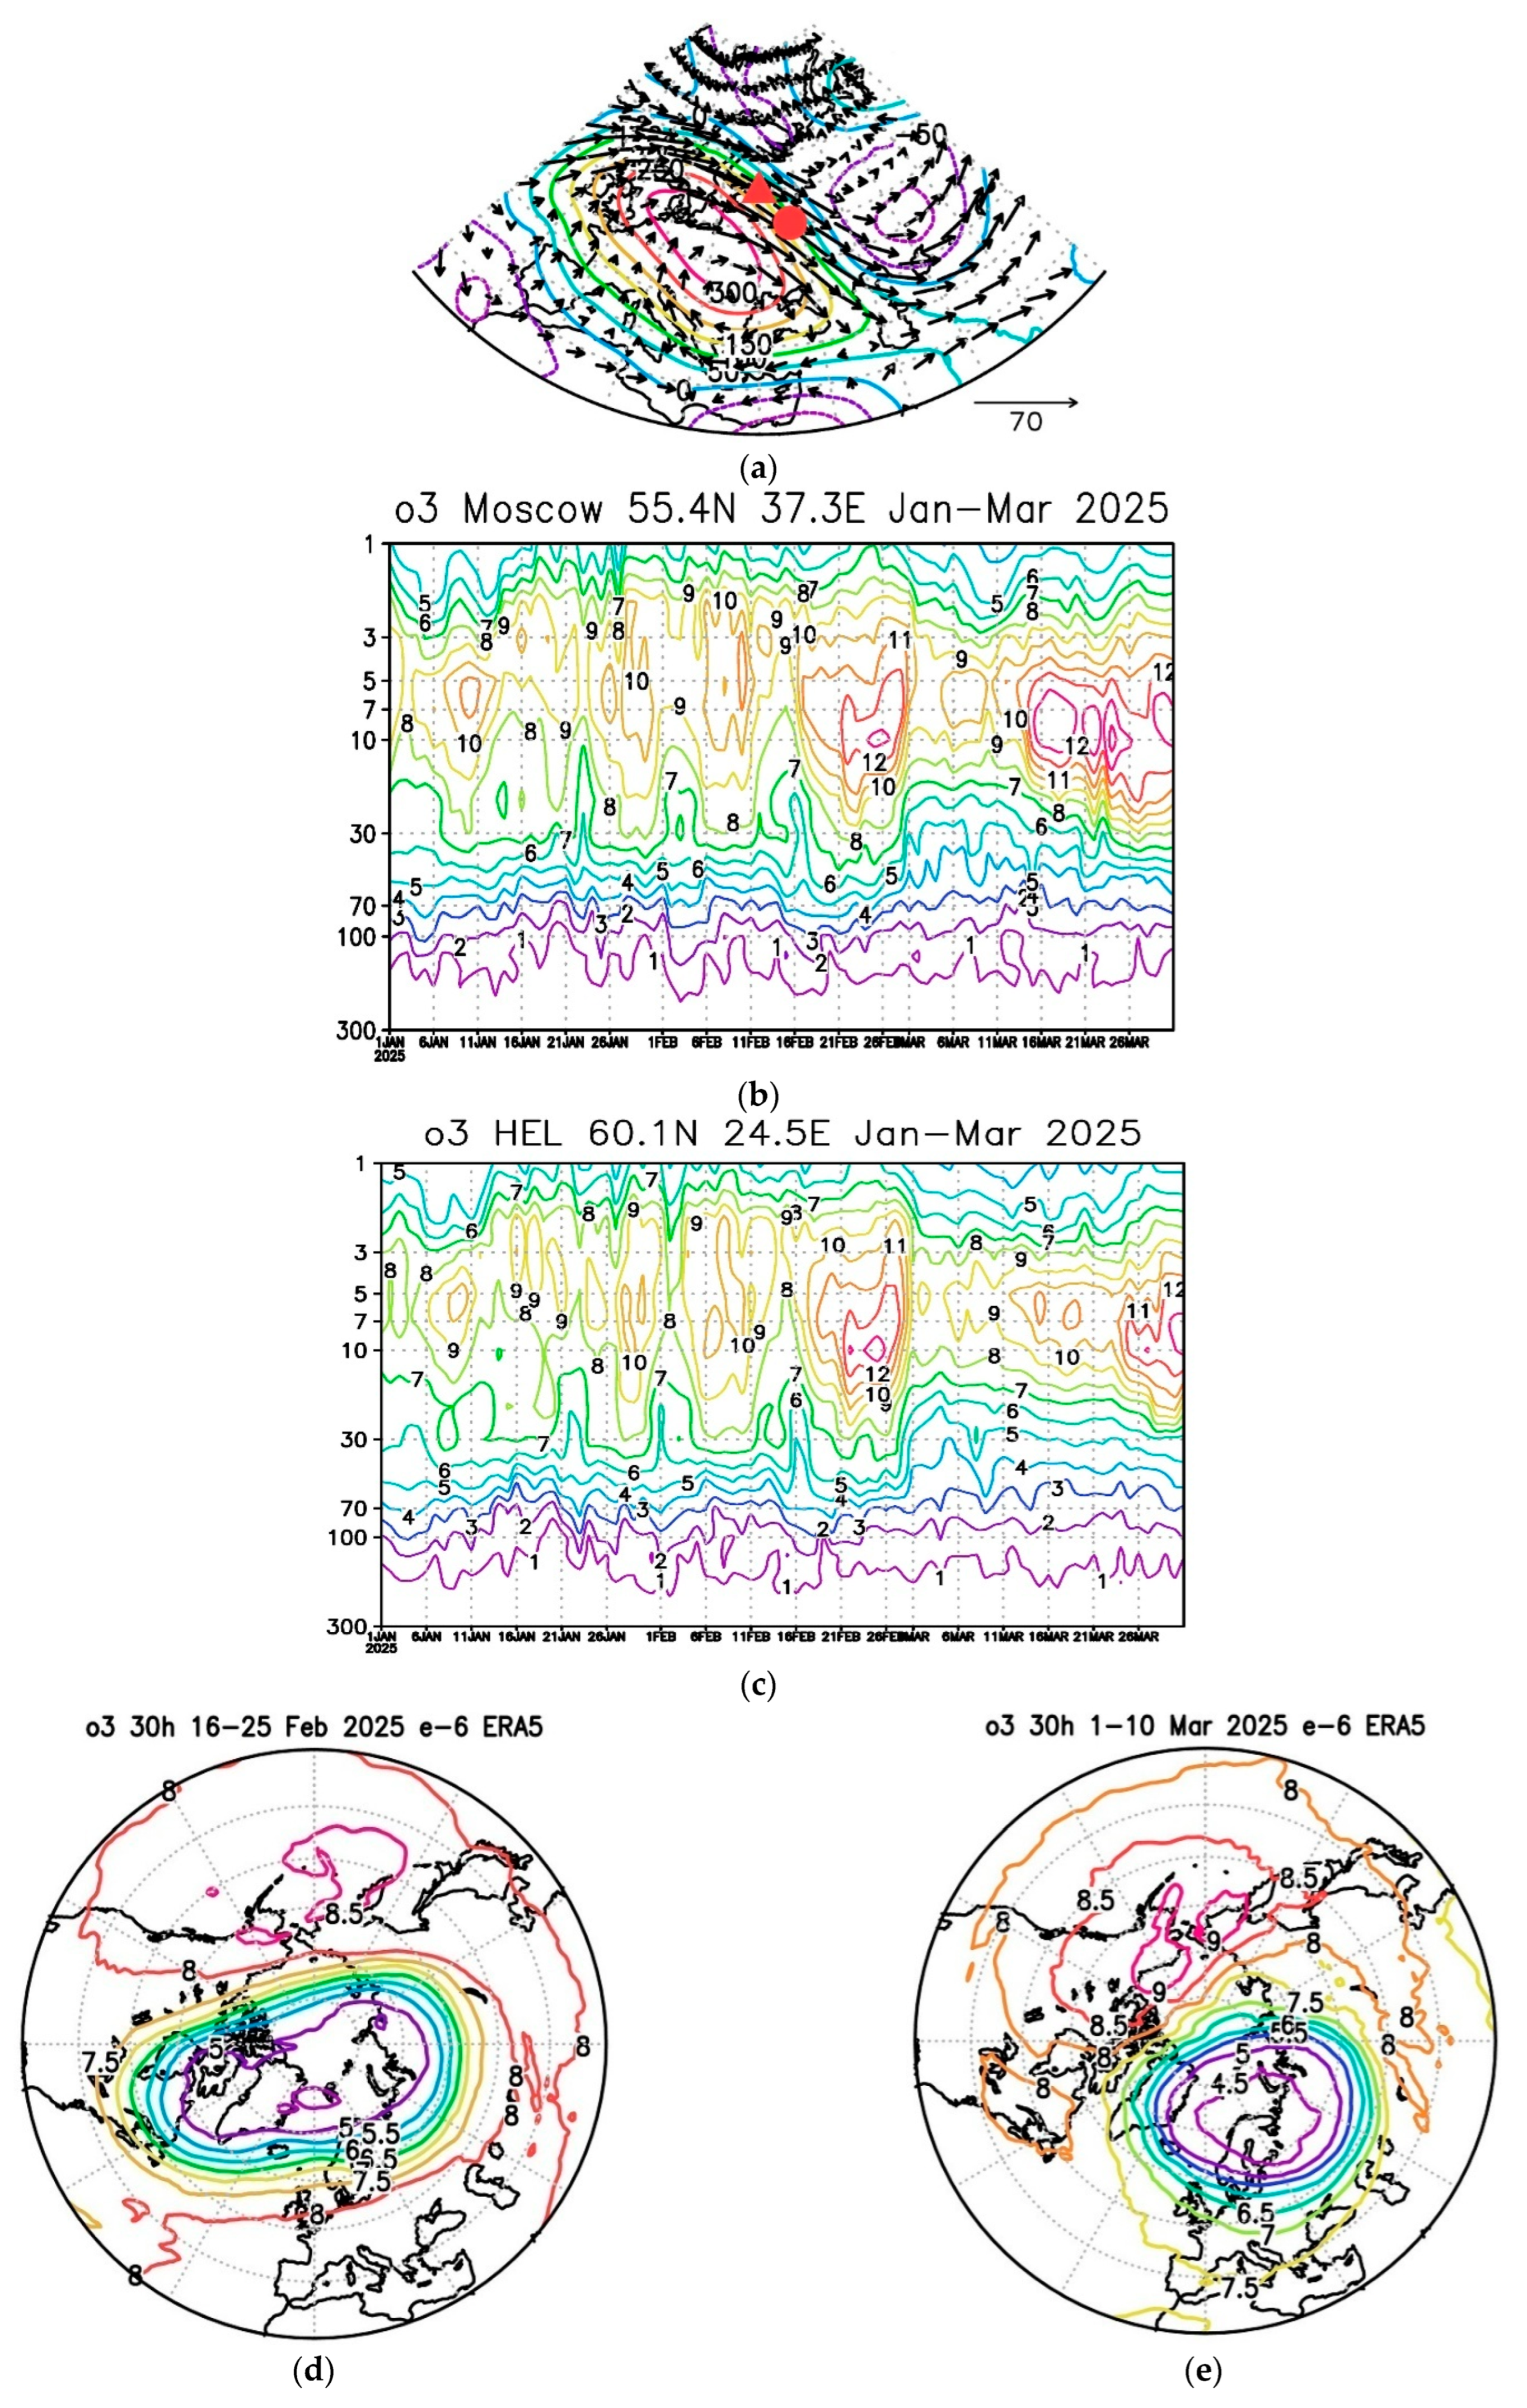
ERA5 TCO over the same cities is characterized by similar temporal variability in January–March 2025, comparable to OMI TCO minimum values nearby on 20 January and in early February but with higher minimum values: 240–260 DU on 6 March (Figure 2d).
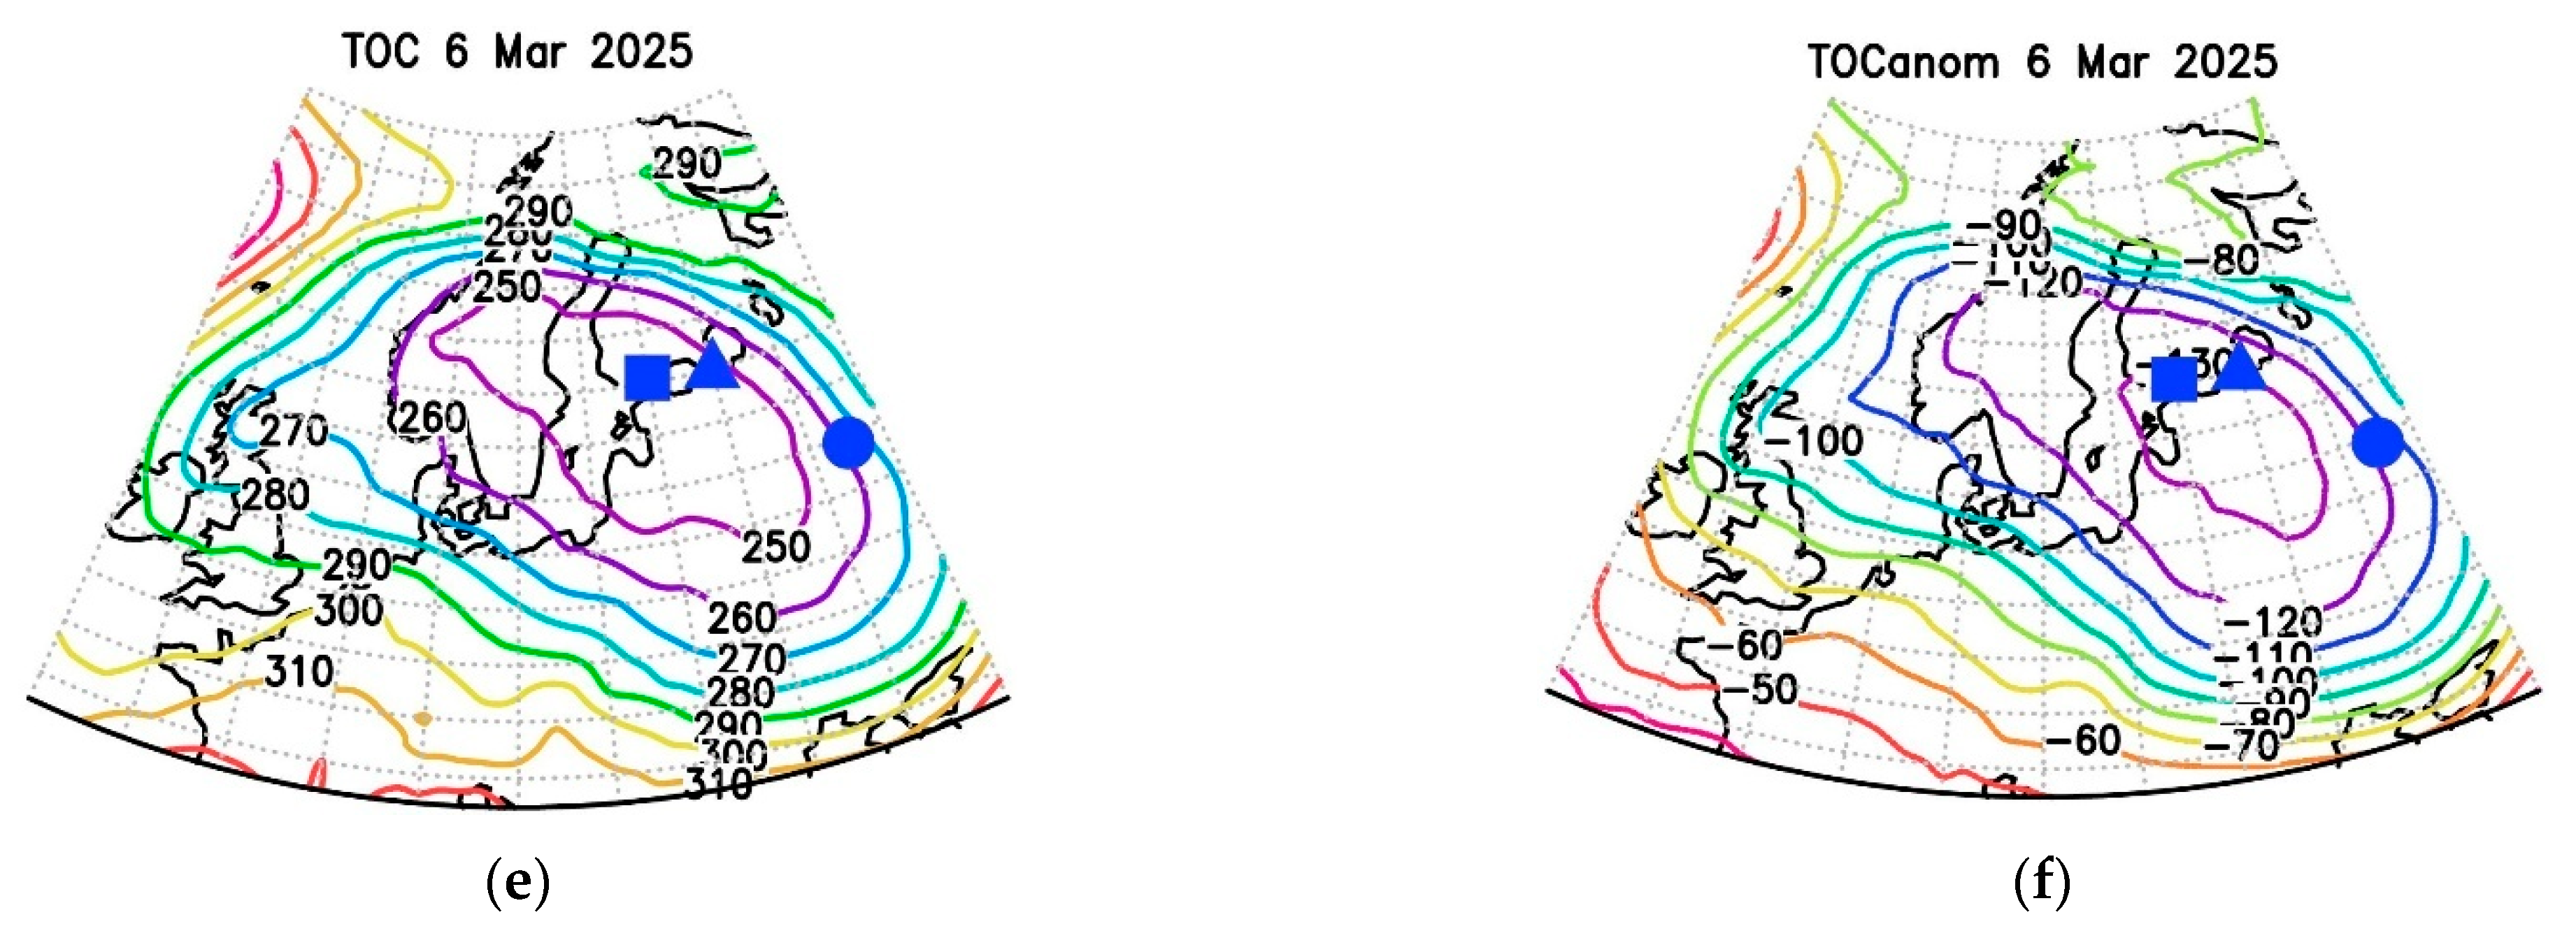
According to ERA5 reanalysis data, if St. Petersburg and Helsinki were located near the center of the TCO anomaly in early March, then Moscow was on its eastern periphery (Figure 2e). The TCO values for the cities under investigation were about 250–260 DU and 120–130 DU (or 35%) lower than the climate mean values (Figure 2f).
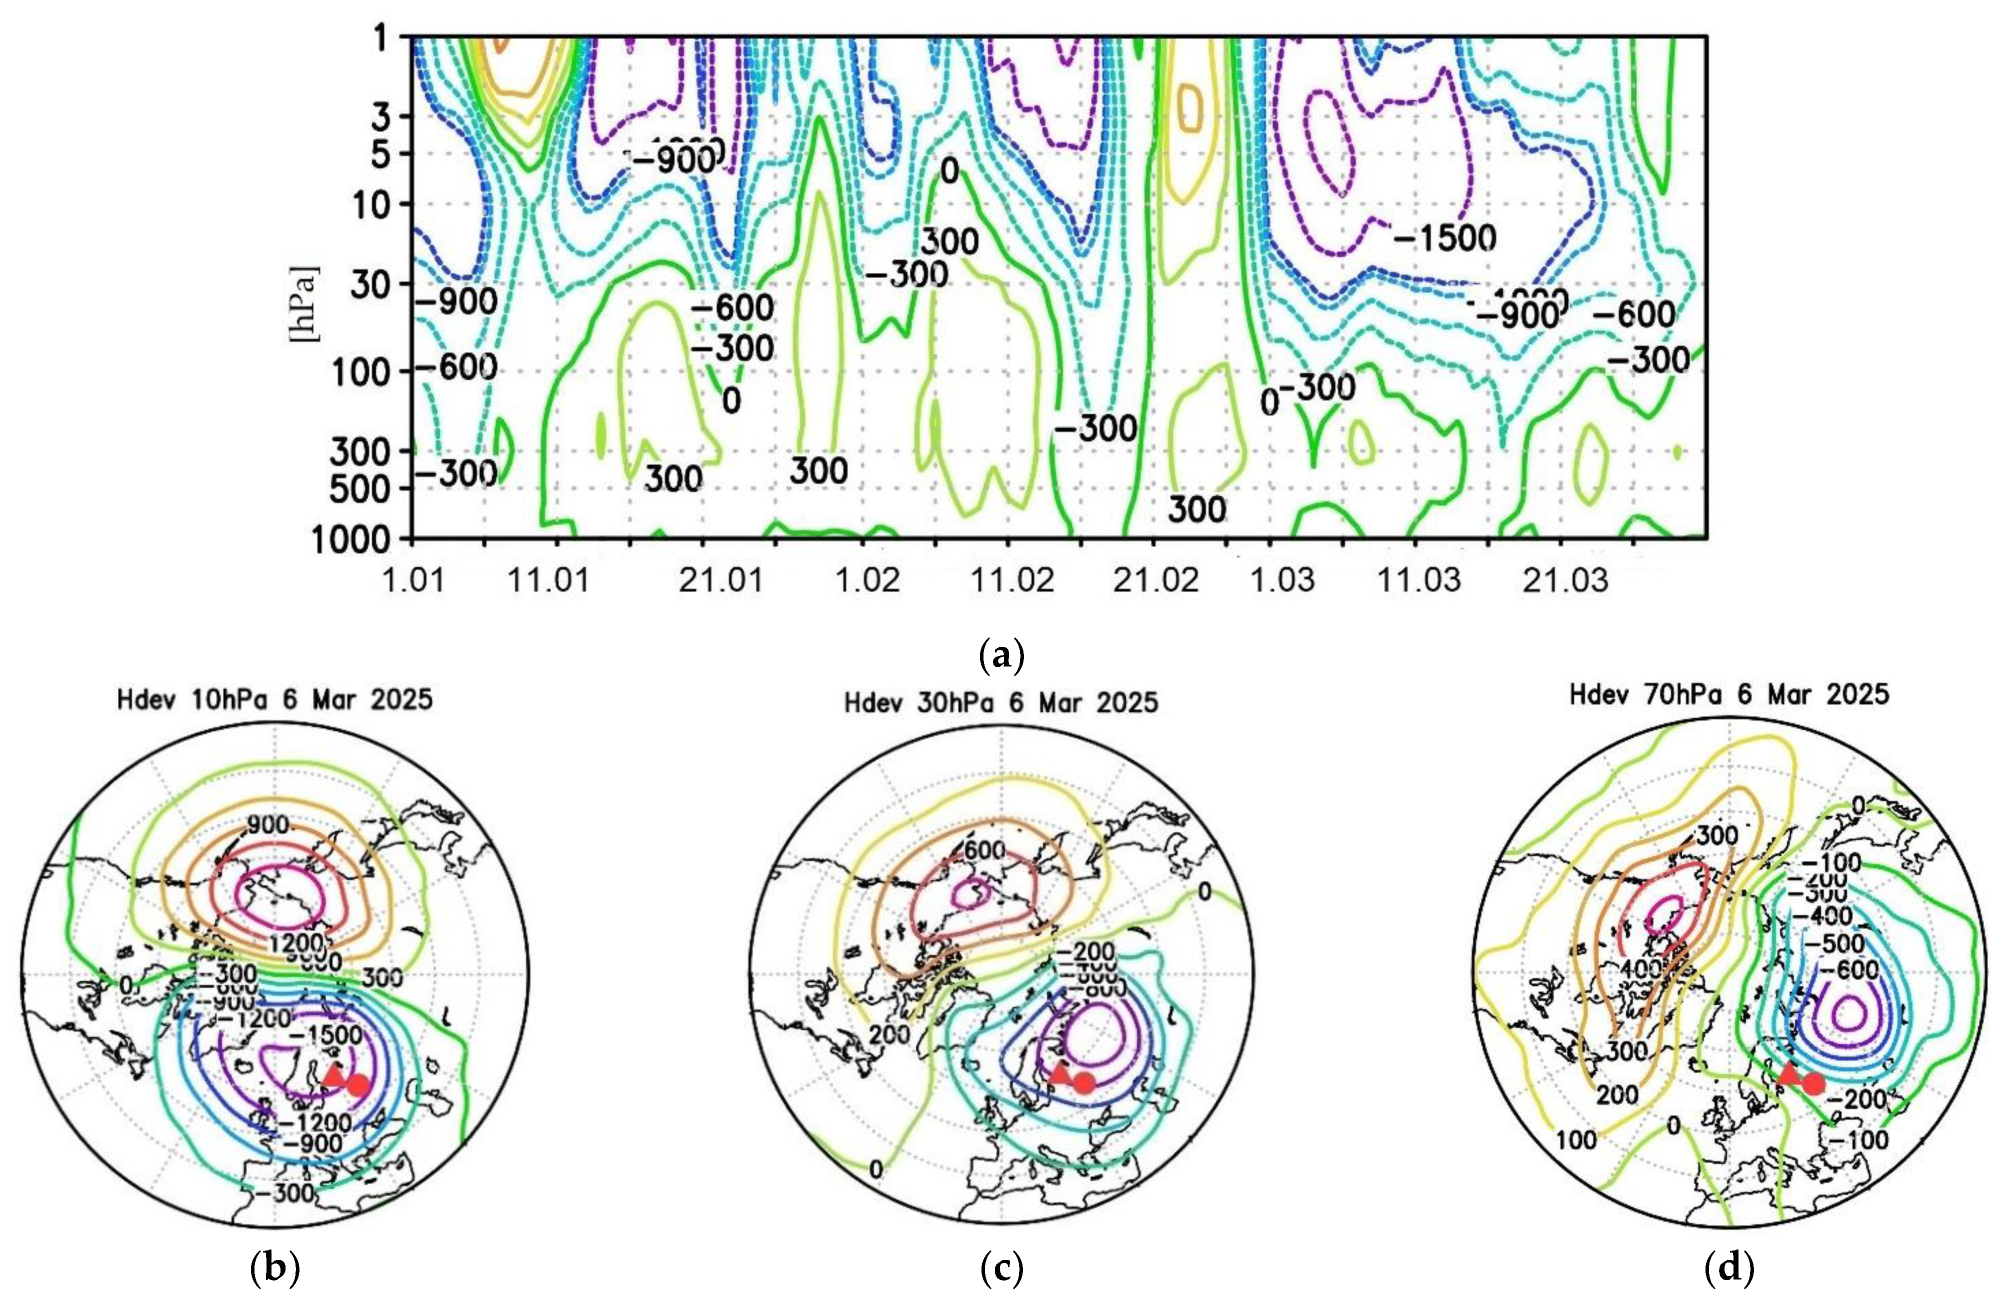
Further, the dynamic conditions under which the ozone anomaly formed in early March over Scandinavia and Northwest Russia were analyzed. Figure 3a shows a deviation in geopotential height from the zonal mean from the surface to the pressure level of 1 hPa (~50 km) that includes the heights of the troposphere–stratosphere over St. Petersburg in January–March 2025. The negative values of the deviation in geopotential height and positive values in the troposphere were observed from the beginning of March. The negative values in the stratosphere correspond to the polar vortex and positive values in the troposphere to the anticyclone. The period of lowest TCO values in early March is characterized by strengthening of the tropospheric anticyclone. Hence, the analyzed TCO anomaly coincides with time of the polar vortex in the stratosphere and anticyclone in the troposphere that, in turn, are characterized by decreased ozone content. Similar features of the vertical structure of the deviation in geopotential height from the zonal mean in early March were observed over Helsinki and Moscow.
The stratospheric polar vortex in the period of the lowest TCO values for the investigated cities on 6 March 2025 was characterized by an eastward shift in the range of altitudes of the lower–middle stratosphere (Figure 3b–d). If St. Petersburg and Moscow at the pressure level 10 hPa (~30 km) were near the vortex center, at 30 hPa they would be westward of the center, and at 70 hPa they would already be on the western edge of the stratospheric polar vortex. This spatial structure of the stratospheric polar vortex displays the shifting type of major SSW event that was observed in early March 2025.
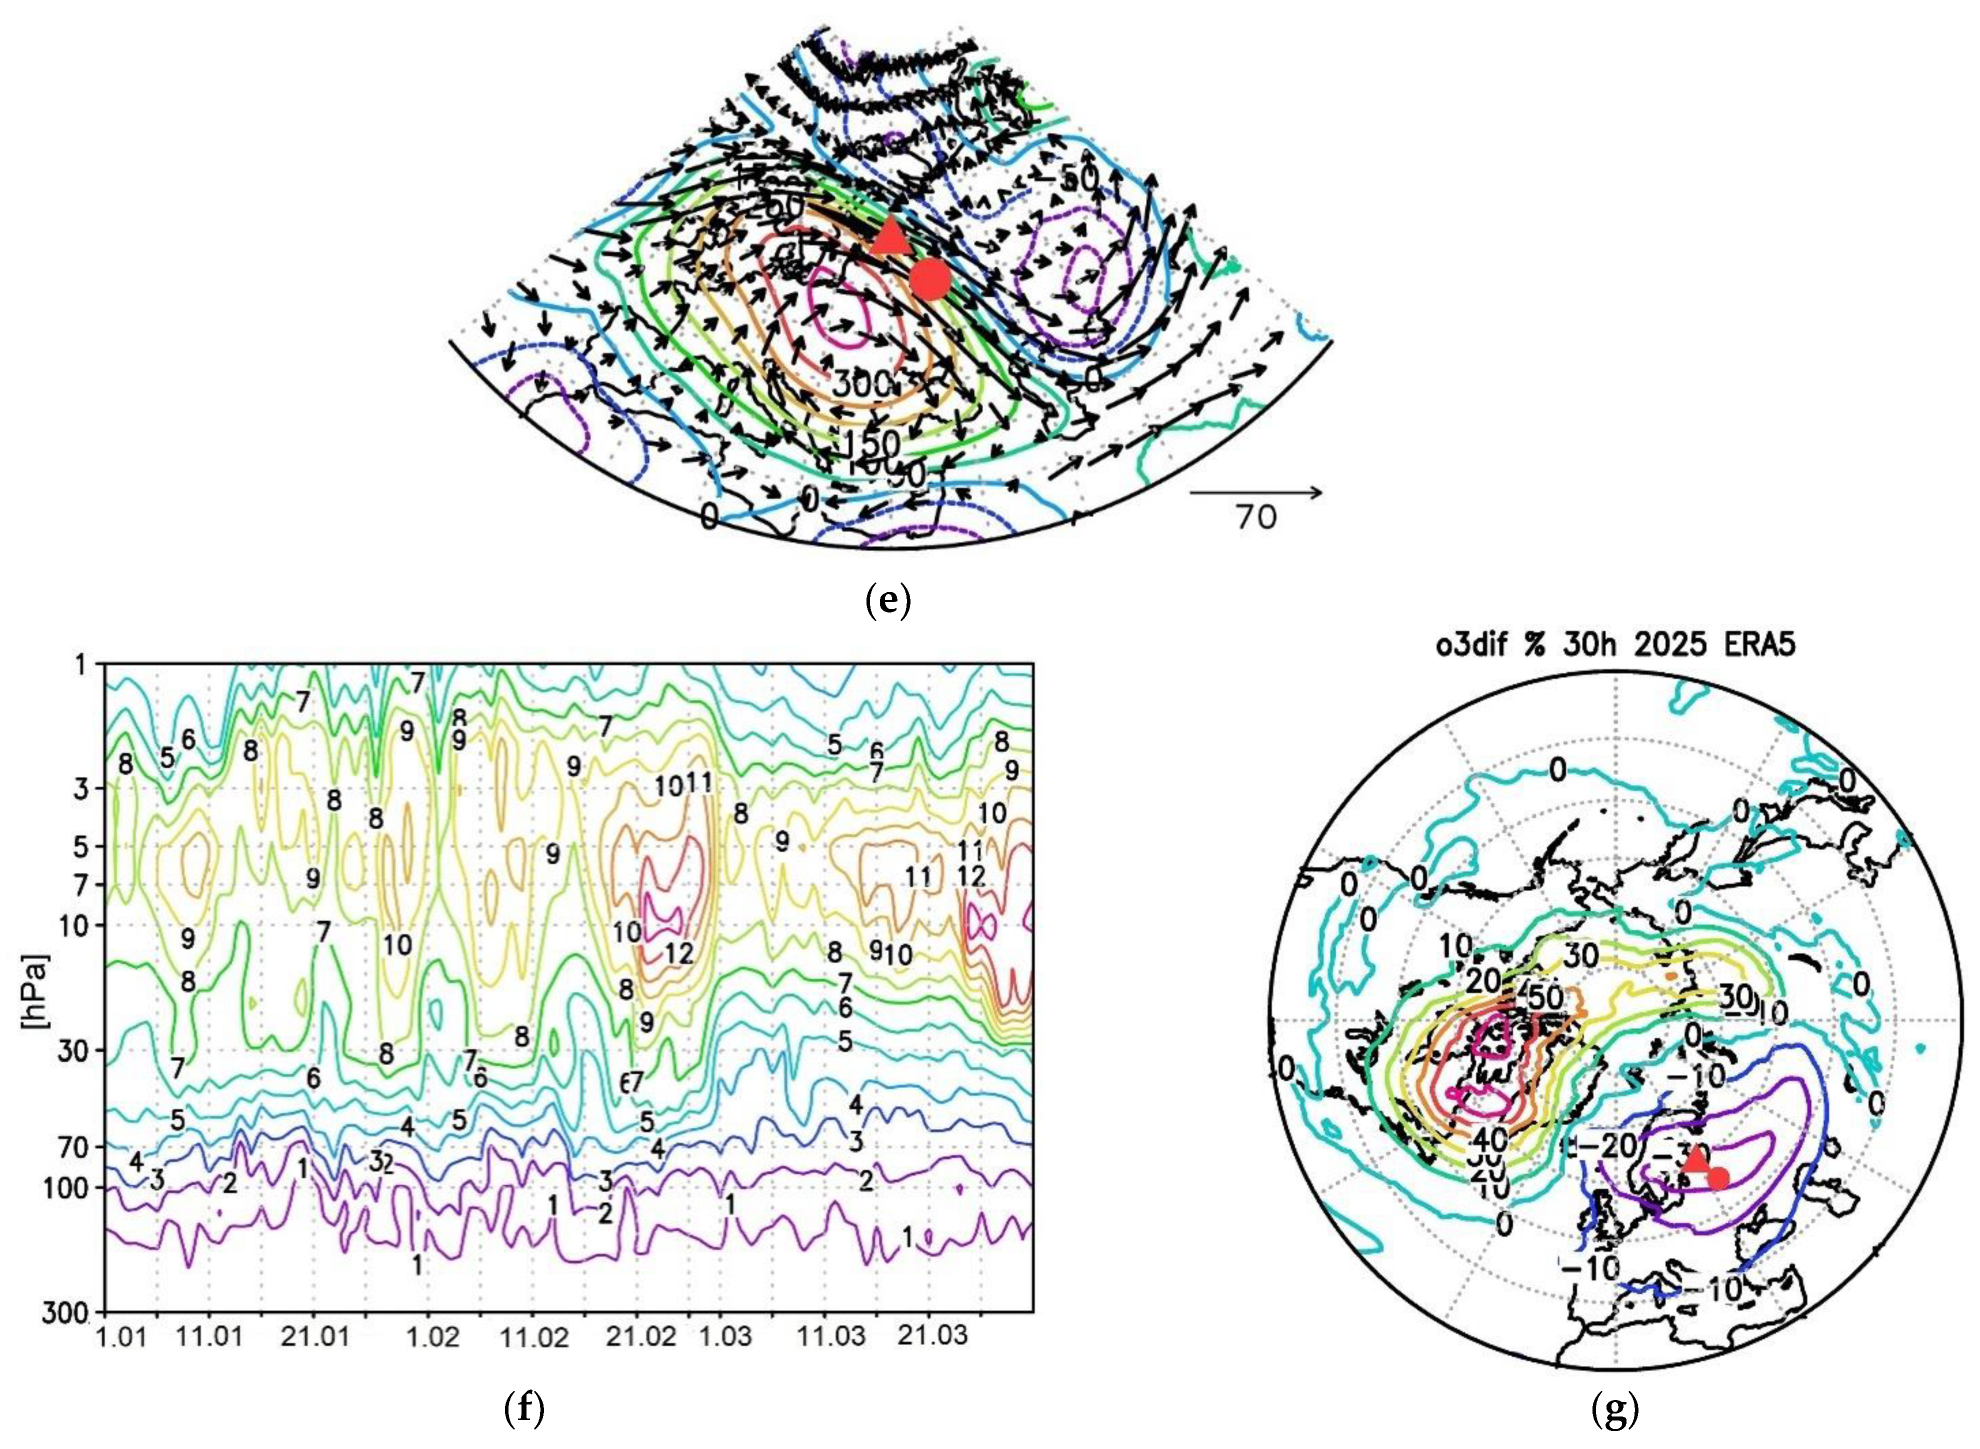
The deviation in geopotential height and vector wind averaged over 5–7 March 2025, at a pressure level of 500 hPa is illustrated by Figure 3e. The positive values also correspond to the anticyclone. An air mass transfer from lower latitudes was observed along the western and further northern periphery of the anticyclone. It is plausible that this air mass transfer with reduced ozone content contributed to the formation of the analyzed TCO anomaly, as is often the case when ozone mini-holes form; see, e.g., [26].
The analysis of changes in the ozone vertical distribution in the area of the studied ozone anomaly over St. Petersburg, Moscow and Helsinki during January–March 2025 was carried out using ERA5 reanalysis data of the ozone mixing ratio.
Over St. Petersburg, after a period with relatively weak variability in January and early February, a significant increase in ozone concentrations was observed in the mid- February with a maximum in the middle stratosphere near the pressure level of 10 hPa. Then, a sharp decrease in ozone concentrations occurred from late February until mid-March, when an increase began (Figure 3f).
The period of decreasing ozone concentrations over the entire range of stratospheric altitudes coincides with the period of the analyzed TCO anomaly. Similar variability in the vertical distribution of ozone is observed for Moscow and Helsinki (Figure A2c,d).
A comparison of ozone concentrations over a 10-day period before the formation of the TCO anomaly (16–25 February) and during its observation (1–10 March) shows that the greatest decrease in ozone concentrations over Scandinavia and northwestern Russia reached to up to 30% (Figure 3g). The difference was more than 20% near the level of maximum ozone concentrations in the middle stratosphere at 10 hPa. During the formation of the studied ozone anomaly, the greatest increase in ozone concentration (up to 50%) was observed over Eastern Canada and the northeastern United States.

3.3. Ground-Based Total Column Ozone Measurements

The results of DOAS measurements of total ozone content in the St. Petersburg region in January–March 2025 are shown in Figure 4. DOAS measurements are presented by two data series for sunrise and sunset. For comparison, the figure also includes data from satellite measurements by the OMI. As in the OMI data, the minimum ozone content for the considered period of DOAS measurements was registered on March 6 and amounted to ~220 DU at sunset and ~230 DU at sunrise on March 7 (~220 DU as measured by the OMI on 6 March at daytime, ~10:30 UTC). When discussing marked discrepancies between the results of DOAS measurements at sunrise and sunset and daytime OMI data, one should take into account the large spatial extent of the effective zone of twilight ground-based sounding and its shift in the direction towards the Sun. Such a shift can be ~200 ÷ 800 km to the east or west of the observation station in the case of DOAS measurements for February–March in St. Petersburg. Obviously, under conditions of large spatiotemporal variability of the TCO field, the noted feature of the measurement method can lead to discrepancies in the compared data.

M-124 Filter Ozonometer Observations

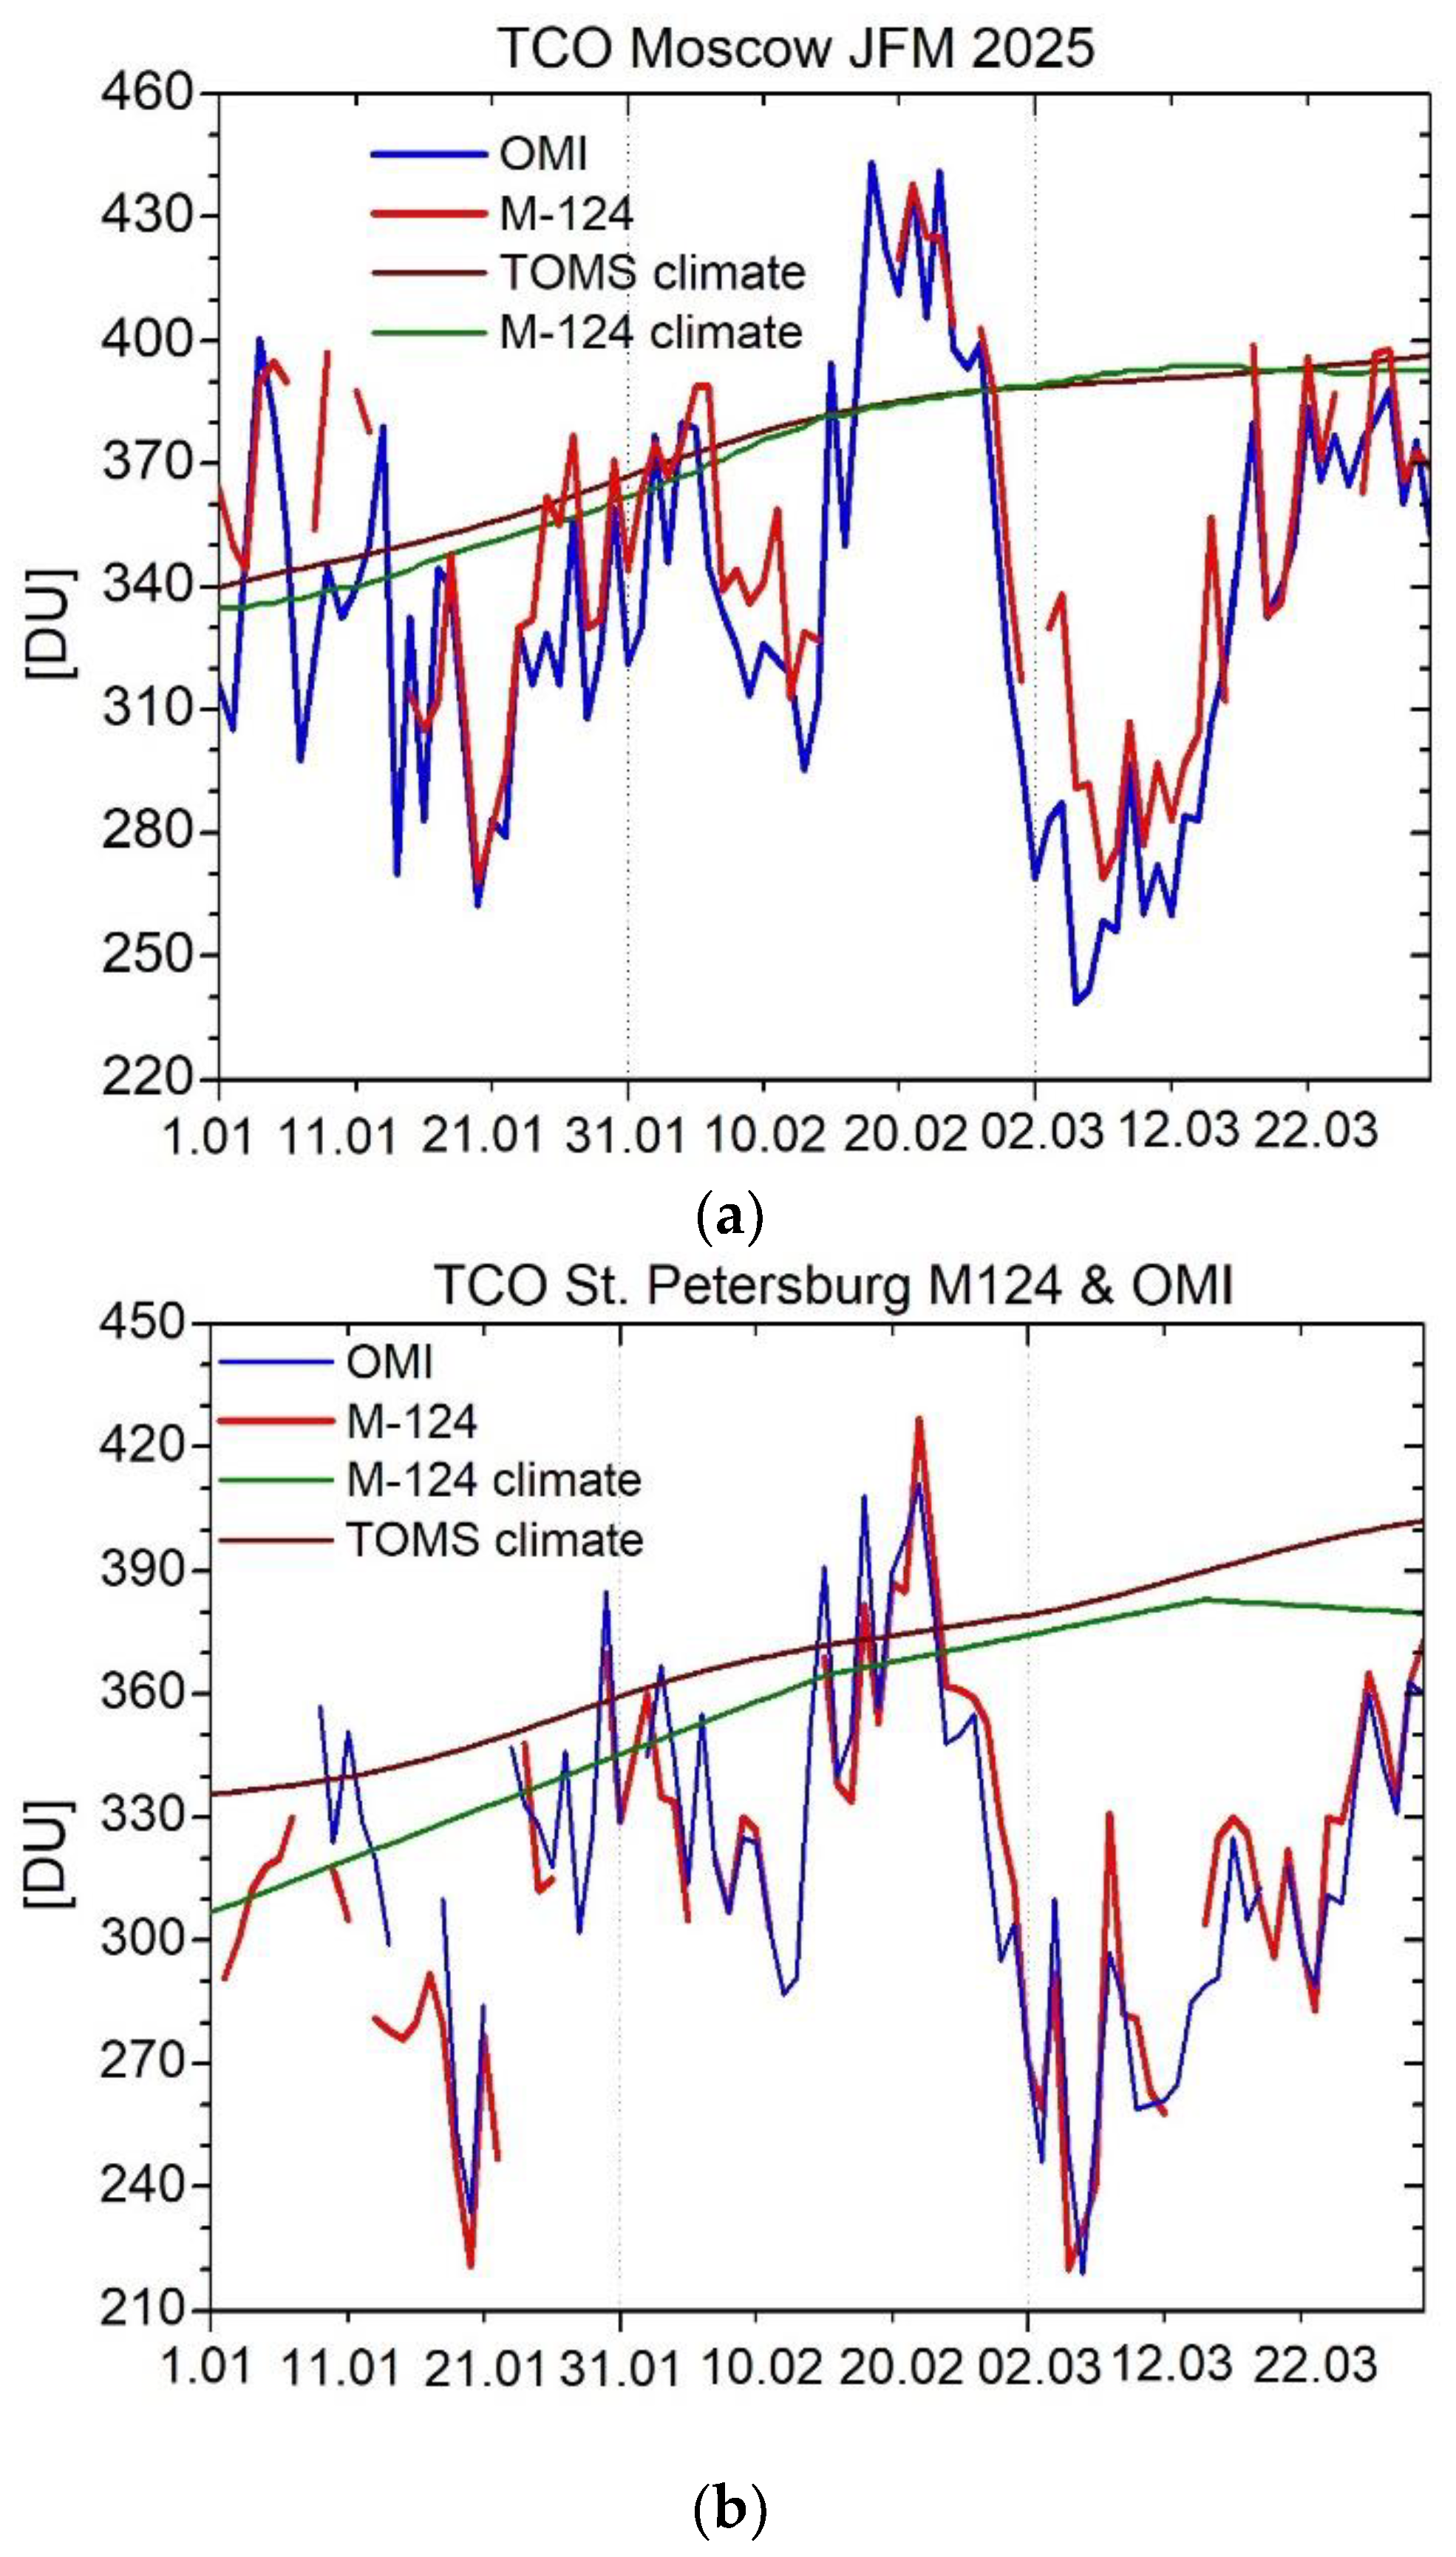
A comparison of ground-based ozone measurements and satellite ozone measurements is presented in Figure 5. The results of measurements using the M-124 ozonometer in Dolgoprudny in the Central Aerological Observatory near Moscow generally correspond to the OMI measurement data during January–March 2025 (Figure 5a). Taking into account the errors of both measuring instruments, it can be stated that there is good agreement between the data; although, in most cases, the ozonometer results exceed the OMI data. The maximum difference between M-124 data and OMI data was observed on 9 January and 5 March and amounted to ~52 DU.
The data series of both instruments demonstrate a similar time course of TOC, showing that the total ozone content over Moscow was below the average long-term values on most days in January–March 2025. The lowest TOC values were observed in the second half of January and the first half of March. The minimum values of the M-124 ozonometer observed on 7 March are 269 DU, approximately 10 DU greater than the OMI measurement values. From 7 March to 10 March 2025, daily TOC values (240–287 DU) over the European part of Russia were lower than climate means by 28–38%.
The results of TCO measurements using the M-124 ozonometer in the Voeikov MGO near St. Petersburg generally correspond to the OMI measurement data during January–March 2025 (Figure 5b). The minimum values of the M-124 ozonometer TCO values were 220 DU on 20 January and 5 March.
Analysis of monthly mean TCO data of the M-124 ozonometer in St. Petersburg revealed that these values were below climate means in January–March 2025. The monthly anomaly in January and March was the largest over the last 10 years and below climate means by 10% and 20%. The largest daily negative deviations of TCO from the climate means reached 33% on 20 January and 43% on 5 March.

3.4. Modeling Results

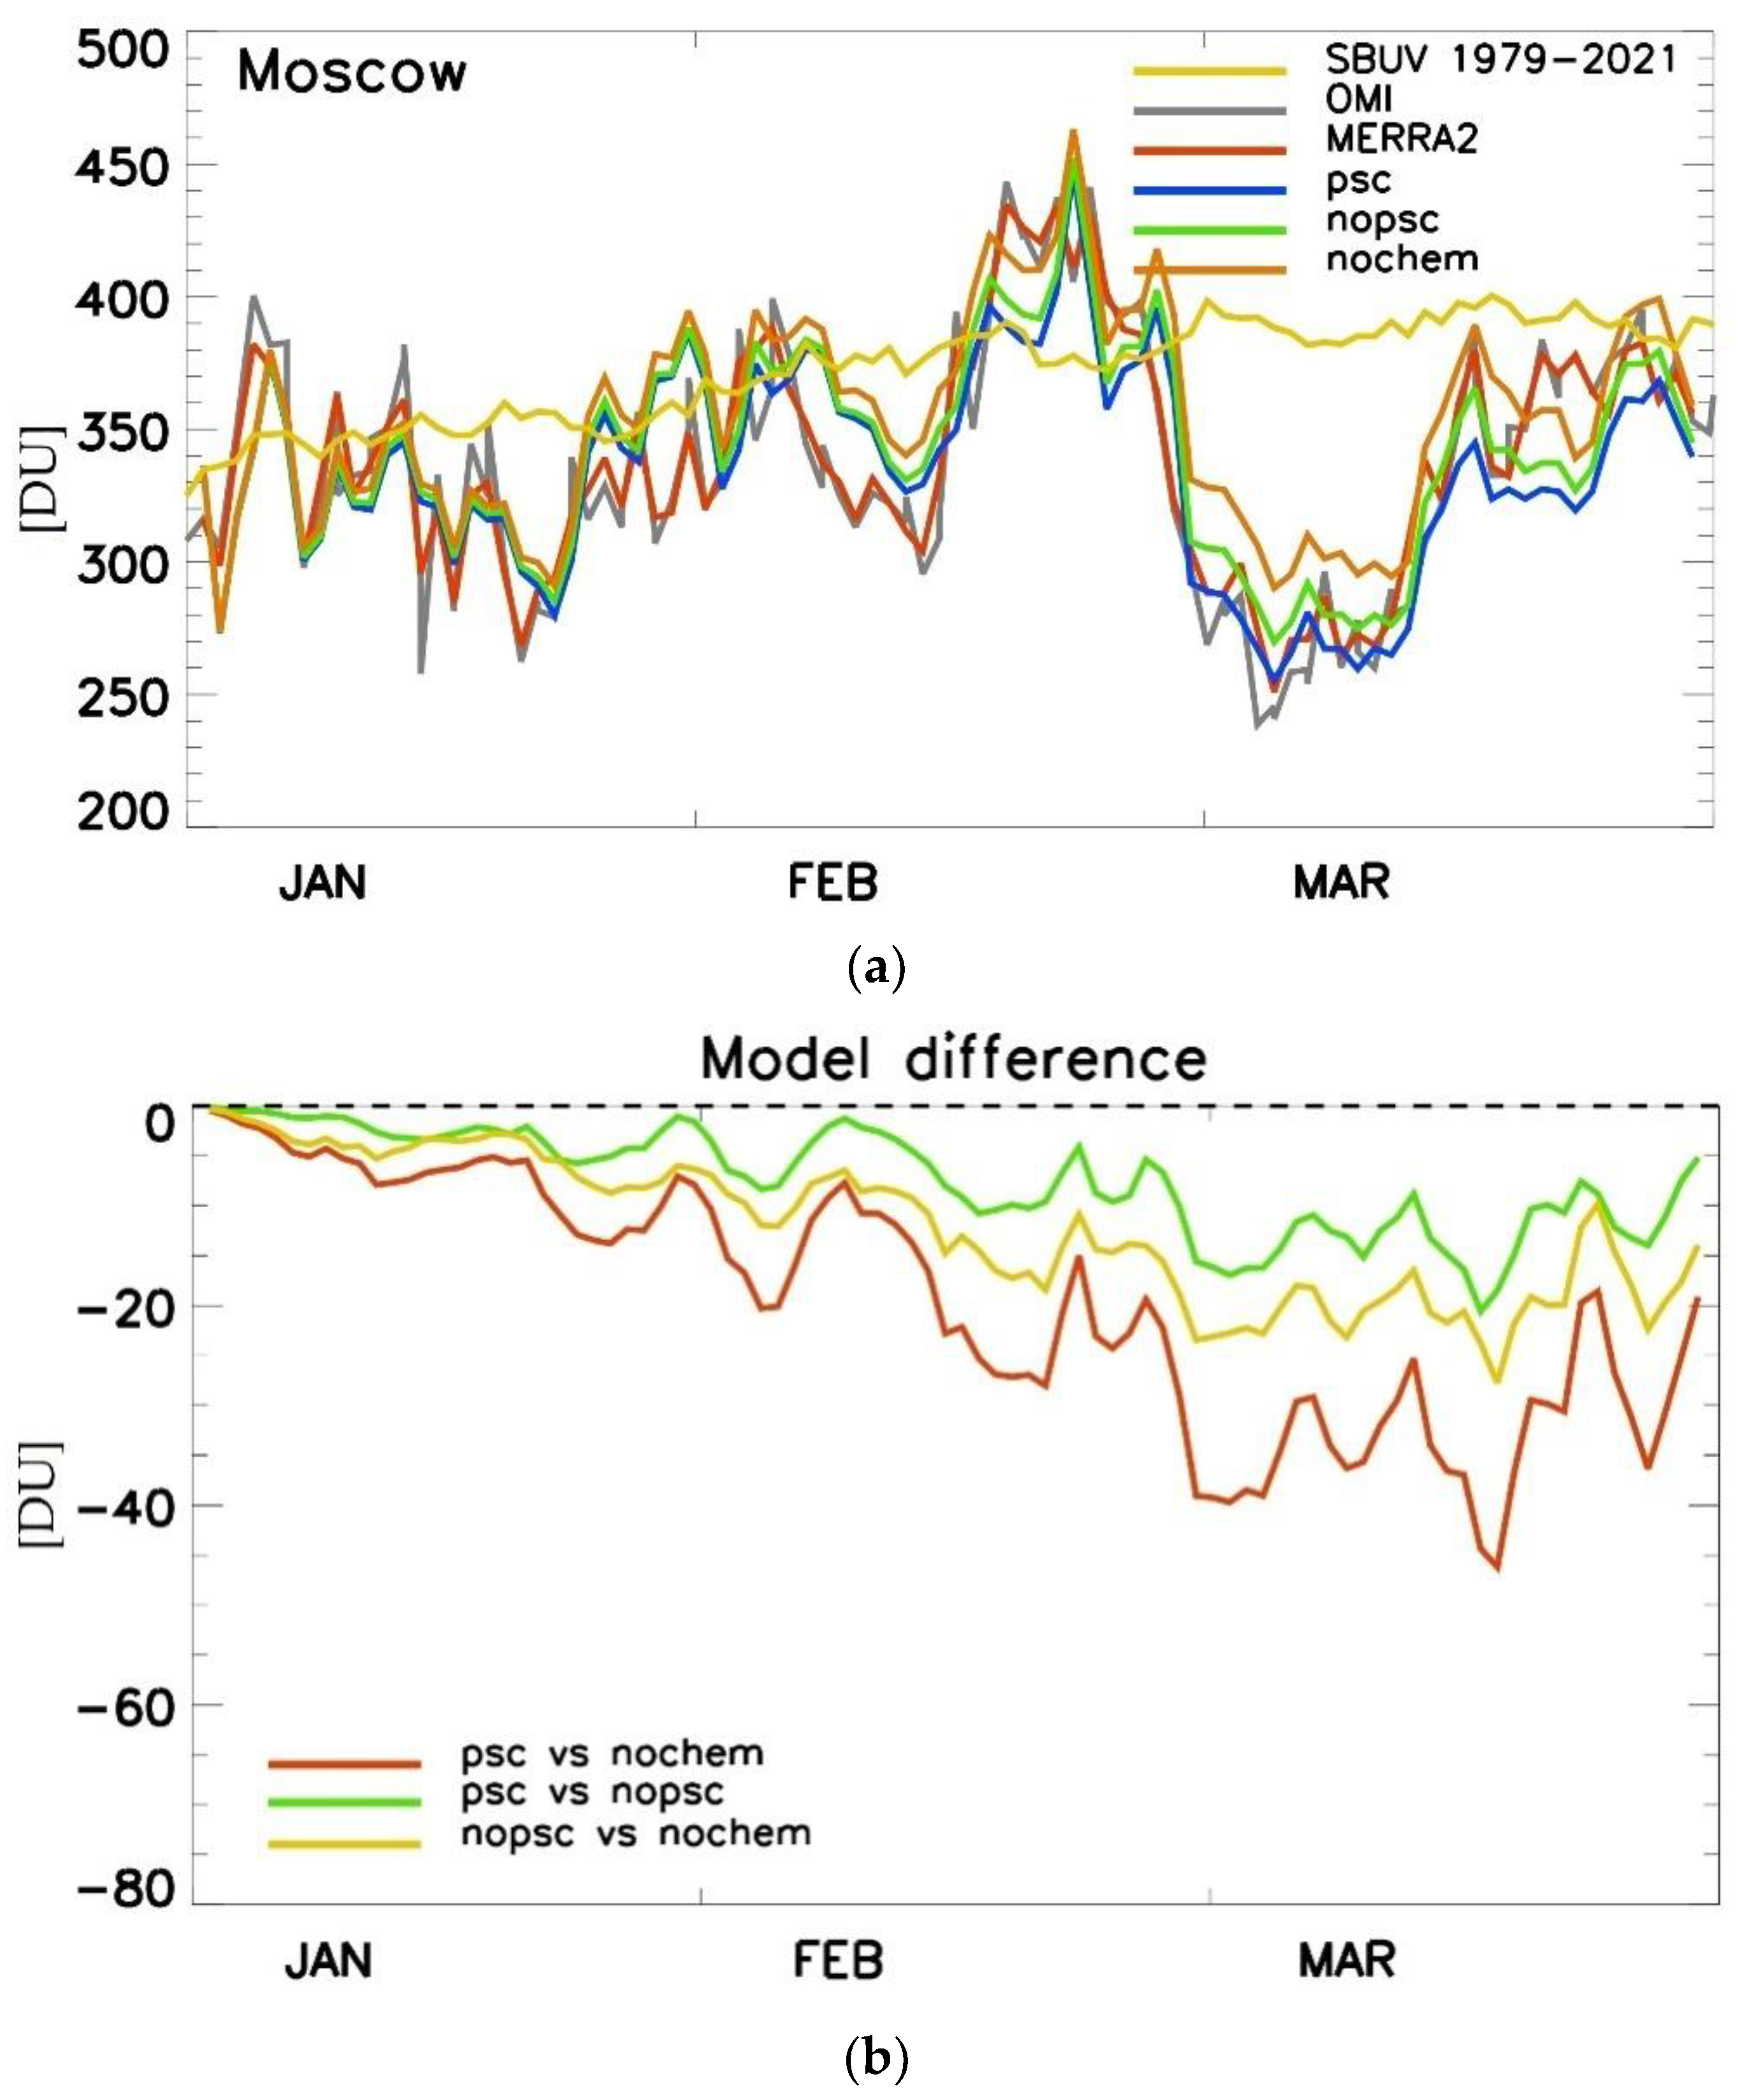
The results of model calculations of changes in TCO over St. Petersburg for three scenarios in comparison with SBUV climatology data for 1979–2021, OMI satellite measurements and MERRA2 reanalysis are presented in Figure 6. A comparison of the results for the scenario with all influencing factors (PSC scenario) with OMI and MERRA2 data demonstrates that the model qualitatively reproduced all the observed features of changes in TCO over St. Petersburg but underestimated the amplitudes of short-term changes. In particular, the values of TCO were overestimated at the minimum in mid-January and underestimated at the maximum in mid-February. In March, when the maximum TCO anomalies were observed, the results from modeling, OMI measurements and MERRA2 reanalysis were quite similar. Comparison with the SBUV climatology shows that TCO values were below the long-term average in all three months. Even the maximum TCO in mid-February was still slightly below that of the SBUV climatology.
A comparison of the results of the basic PSC experiment with calculations in the noCHEM and noPSC scenarios over St. Petersburg is shown in Figure 6. It can be seen that the main factor determining the anomalies of TCO (including a minimum in January, maximum in February and, finally, minimum in March) are the abovementioned dynamic processes. In the noCHEM scenario, no chemical processes in the winter–spring period north of 52° N are taken into account, and the periods of the decrease in TCO correspond well to the OMI measurements and MERRA2 reanalysis data (Figure 6a). The influence of chemical processes without accounting for heterogeneous activation on polar stratospheric clouds (noPSC scenario) begins to be noticeable from the end of January, gradually increasing and reaching its maximum in mid-March (yellow line, Figure 6b). The influence of PSCs (green curve, Figure 6b) also begins to be noticeable from the end of January and has several peaks of maximum influence at the beginning and middle of February and at the beginning and middle of March. The maximum decrease in total columnar ozone occurs at the second minimum of March, observed on the 10th–15th.
Figure 7 indicates the results of similar calculations for Moscow. A comparison with the results for St. Petersburg shows that the role of dynamic processes is even more pronounced over Moscow than over St. Petersburg. This is evident from the fact that the results of calculations in the noCHEM scenario without any chemical reactions are already quite close to the OMI measurement data and MERRA2 reanalysis (orange line in Figure 7a). In addition, the results of calculations in the PSC baseline scenario (blue line in Figure 7, top) in the first half of March practically coincide with the MERRA2 reanalysis data, and in other periods they are closer to the measurement and reanalysis data than for St. Petersburg.
A comparison of the calculation results for three scenarios for Moscow also demonstrates the major role of dynamical processes in the formation of the observed variability in TCO (Figure 7b). This is expressed in smaller differences between the scenarios, especially for the baseline PSC scenario (red line). The influence of chemical processes without PSCs (noPSC scenario) is also 1.5 times less than for St. Petersburg. The influence of PSCs (green line) is more uniform than for St. Petersburg, although the maximum influence in early and mid-February and March is also visible.
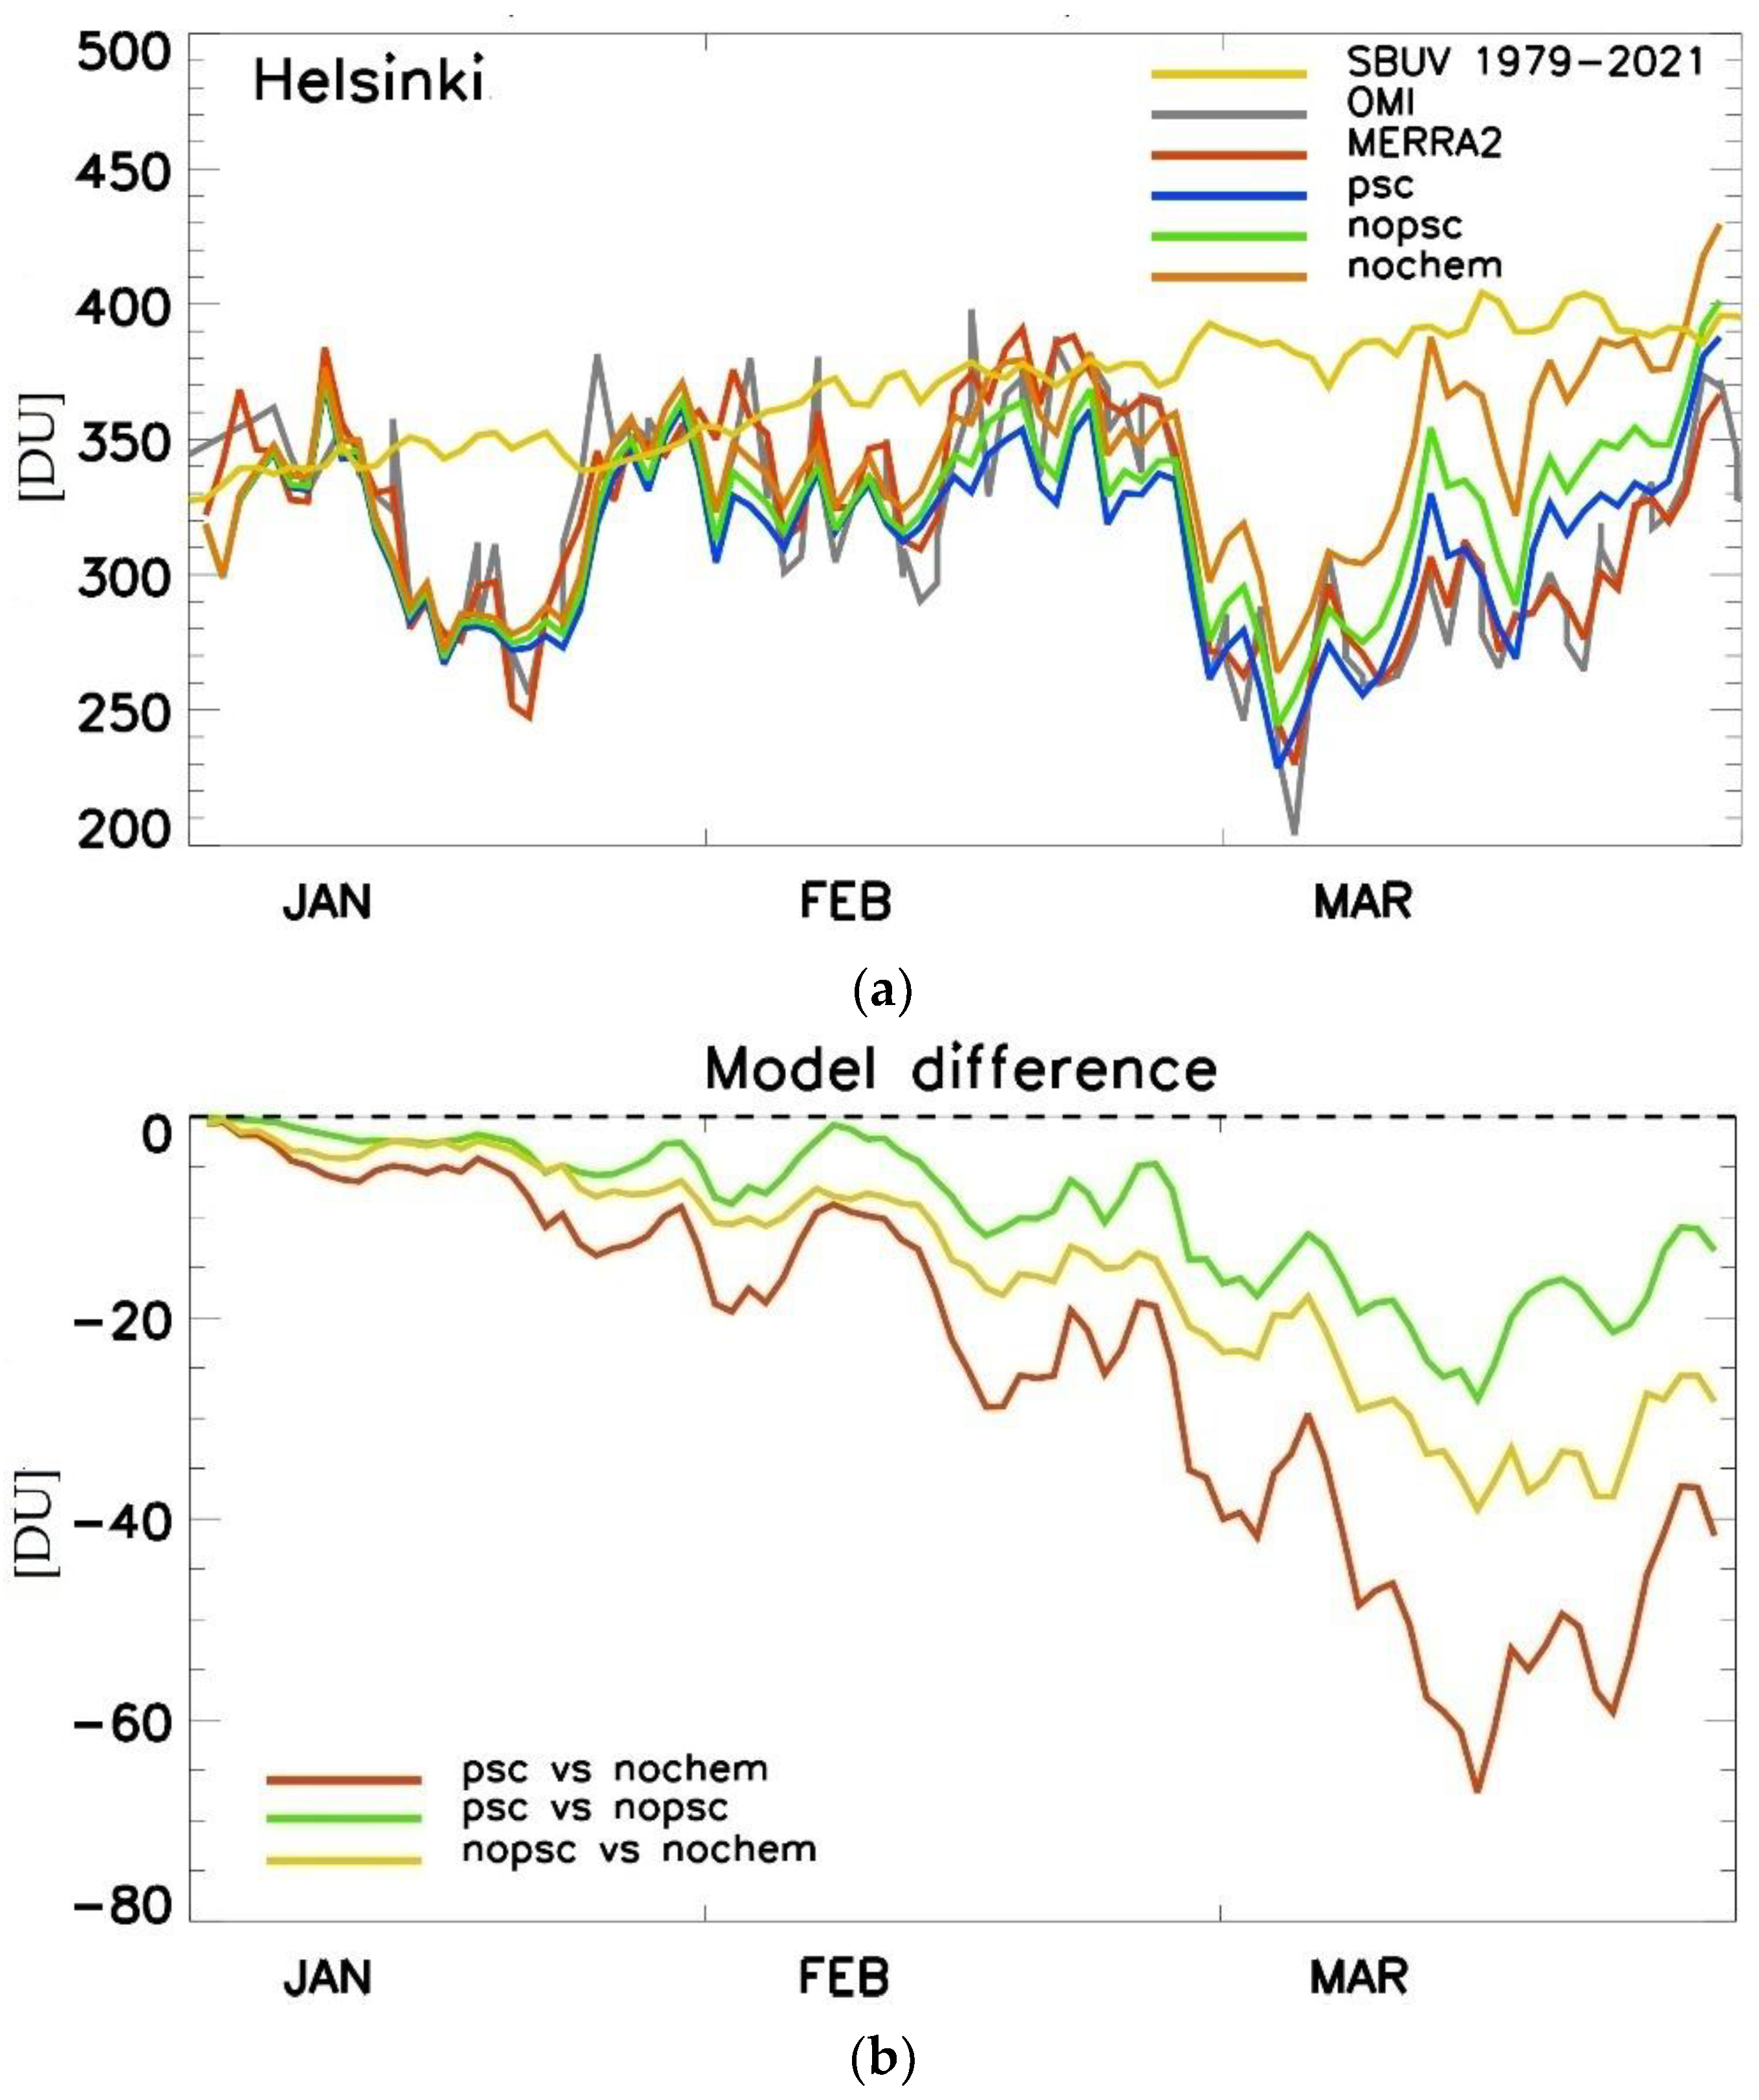
The agreement between the calculations for the PSC baseline scenario and the OMI measurement data and MERRA2 reanalysis for Helsinki is slightly better than for St. Petersburg, which is close in distance (~300 km), while the same features of underestimation of the variation amplitudes are also observed (Figure 8a). The influence of chemical processes for Helsinki is similar to that of St. Petersburg (yellow curve, Figure 8b), and the influence of PSCs is slightly greater than for St. Petersburg (green curve, Figure 8b).
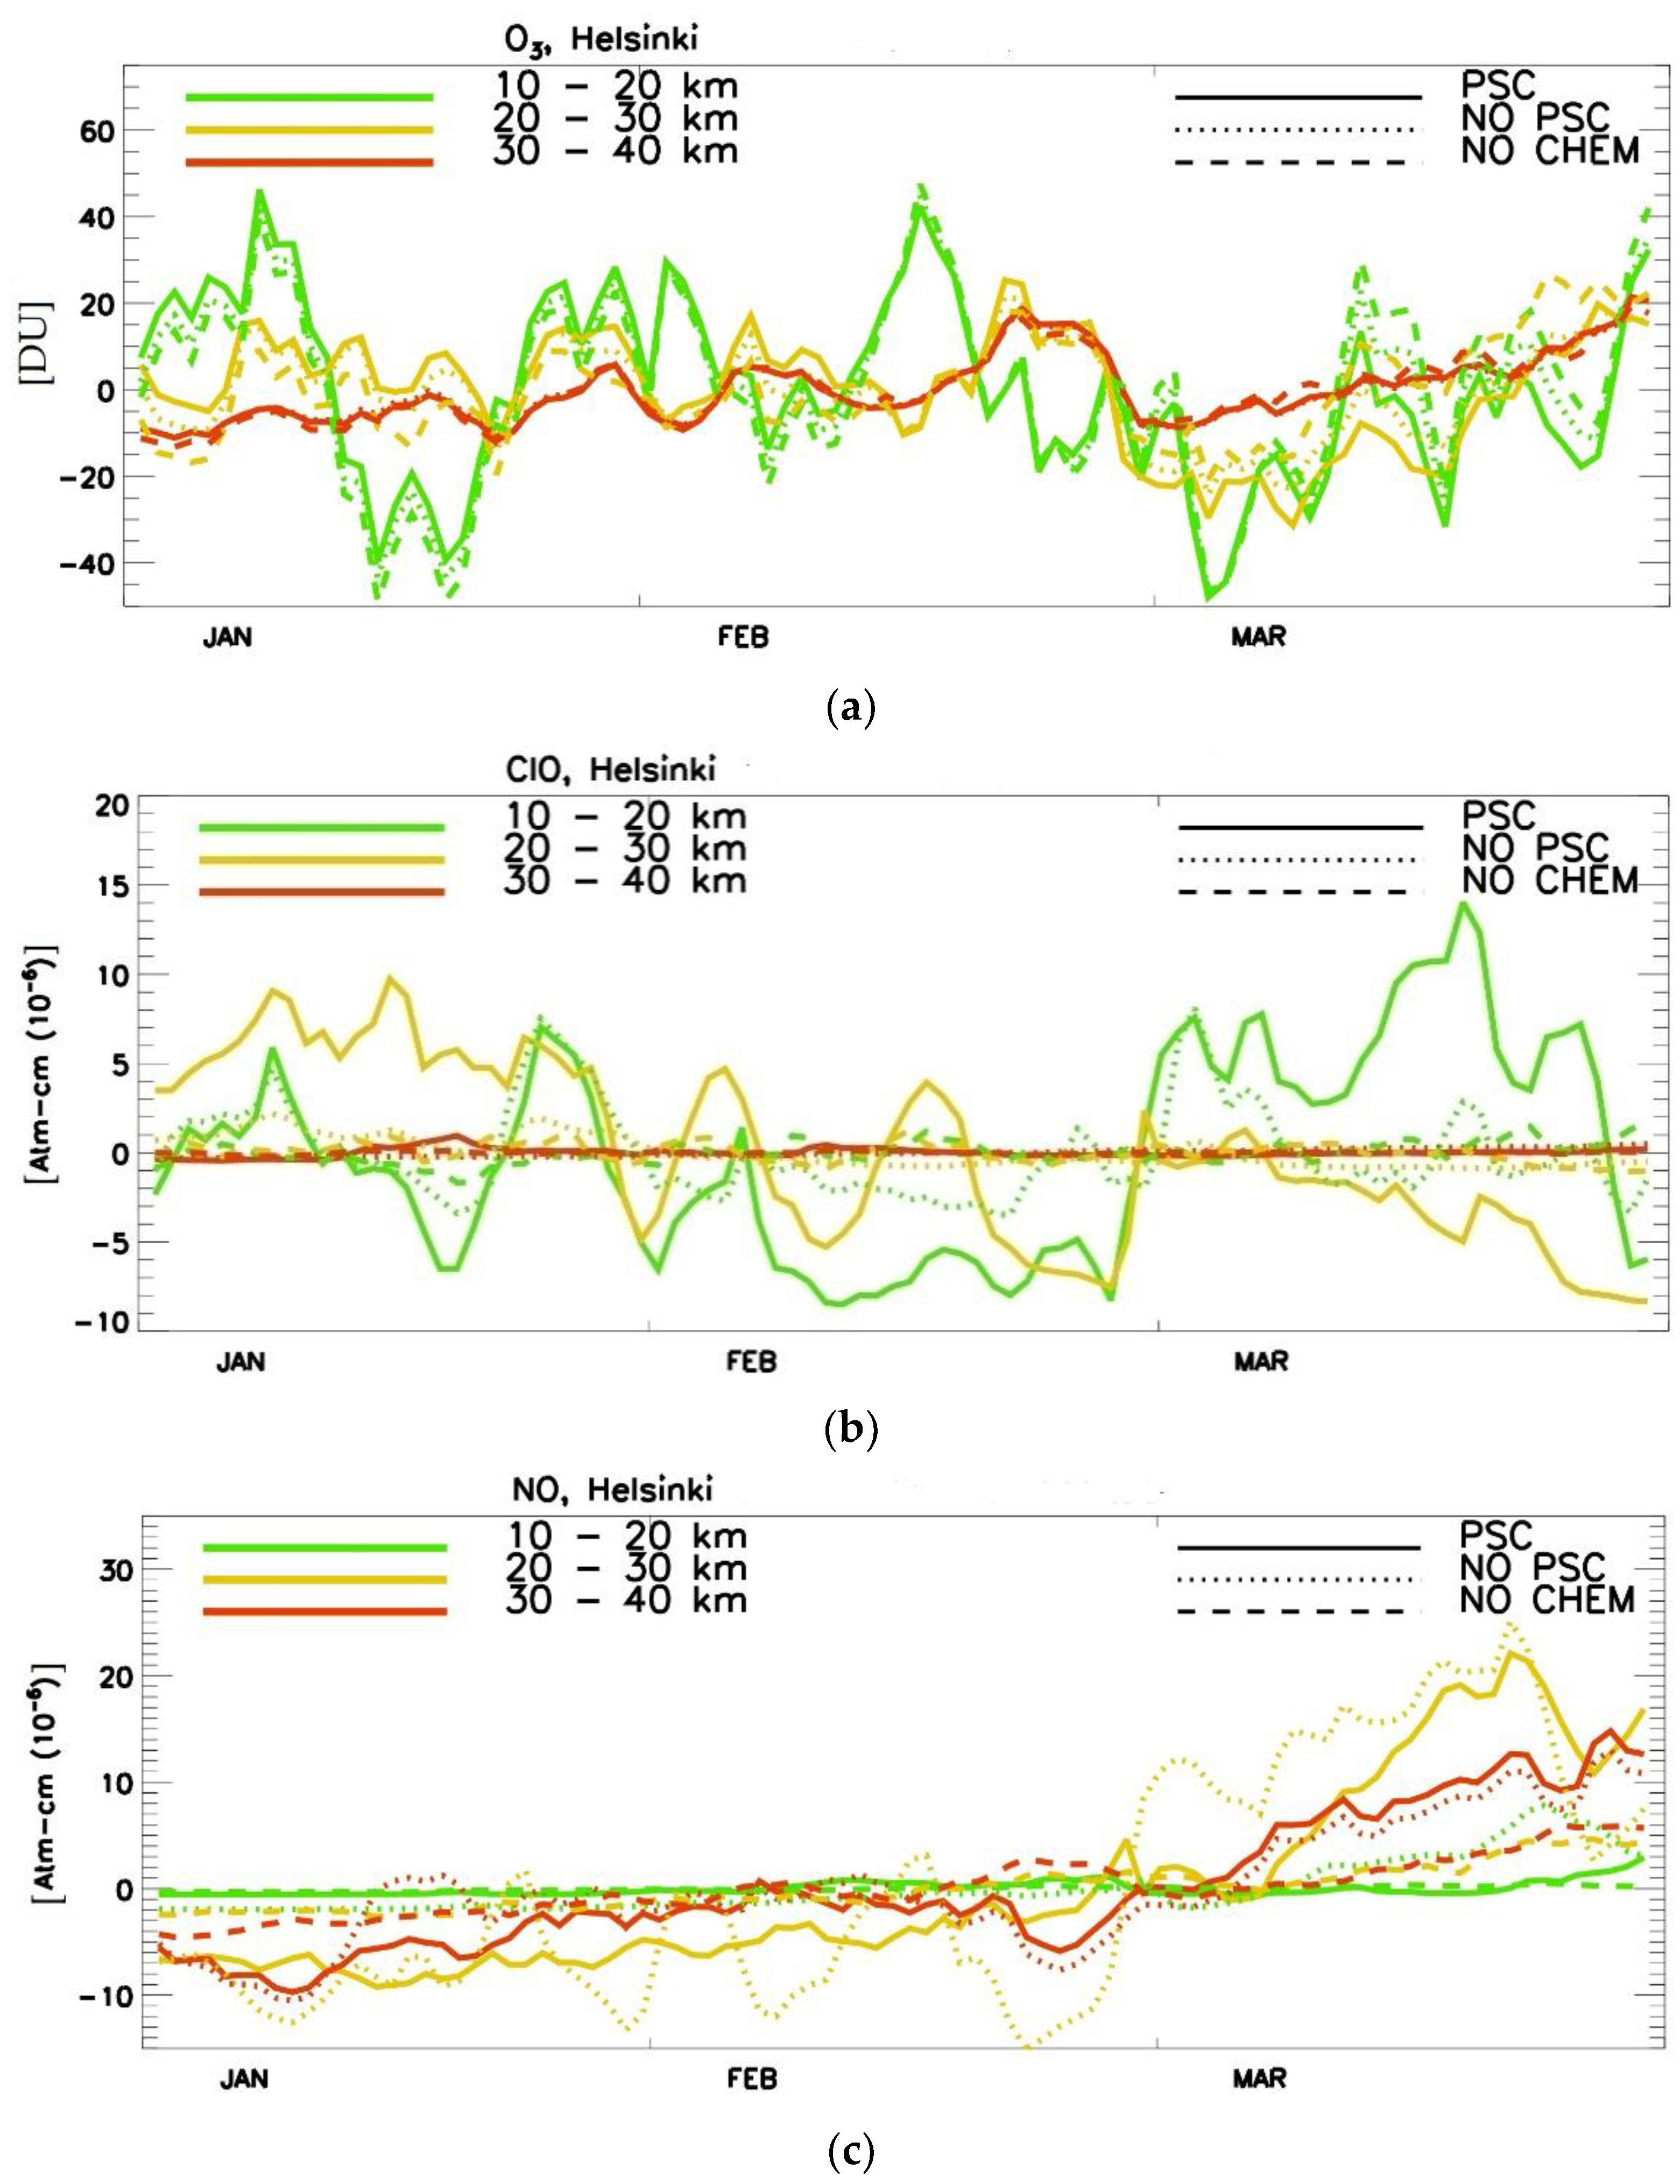
Ozone values across all altitude ranges over St. Petersburg in January-February show minor difference for three different scenarios (Figure 9a), indicating the predominant influence of atmospheric dynamics and a minor influence of chemistry. This is further supported by the fact that there is an increase in ClO at altitudes of 20–30 km in January in the PSC scenario compared to other scenarios (Figure 9c). Ozone levels at these altitudes in the PSC scenario are even slightly higher than in scenarios without PSC and chemistry (Figure 9a). At altitudes of 10–20 km, and also in February at altitudes of 20–30 km, the ClO values for the PSC scenario vary sometimes being higher and sometimes lower than average. However, for altitudes of 10–20 km in February the ClO values are consistently below average. In contrast, for scenarios without PSC, ClO values are close to average, but this has practically no effect on the difference in ozone between scenarios (Figure 9a). This confirms the predominant influence of dynamics on ozone variability over St. Petersburg in January–February. Furthermore, the minima and maxima of ozone and ClO (in the PSC scenario) changes generally align well, indicating the dominant influence of atmospheric transport on their variability. In January–February, nitrogen oxides typically show values below average, with low day-to-day variability (Figure 9c). In March, ClO values at altitudes of 10–20 km increase significantly above average values. In the PSC scenario, high values persist until the end of the month, while in the scenario without PSC, high ClO values are only registered in early March, coinciding with the time when the minimum total ozone values were recorded (Figure 9a). Consequently, in mid-March processes involving polar stratospheric clouds play a significant role along with dynamics at altitudes of 10–20 km. In the PSC scenario at altitudes of 20–30 km ClO steadily decreases in March and remains below average values. This indicates that at these altitudes, ozone variability is not related to chlorine catalytic destruction. Conversely, nitrogen oxide content at these altitudes is significantly above average in March for scenarios with chemistry, creating potential for ozone destruction in nitrogen catalytic cycles.
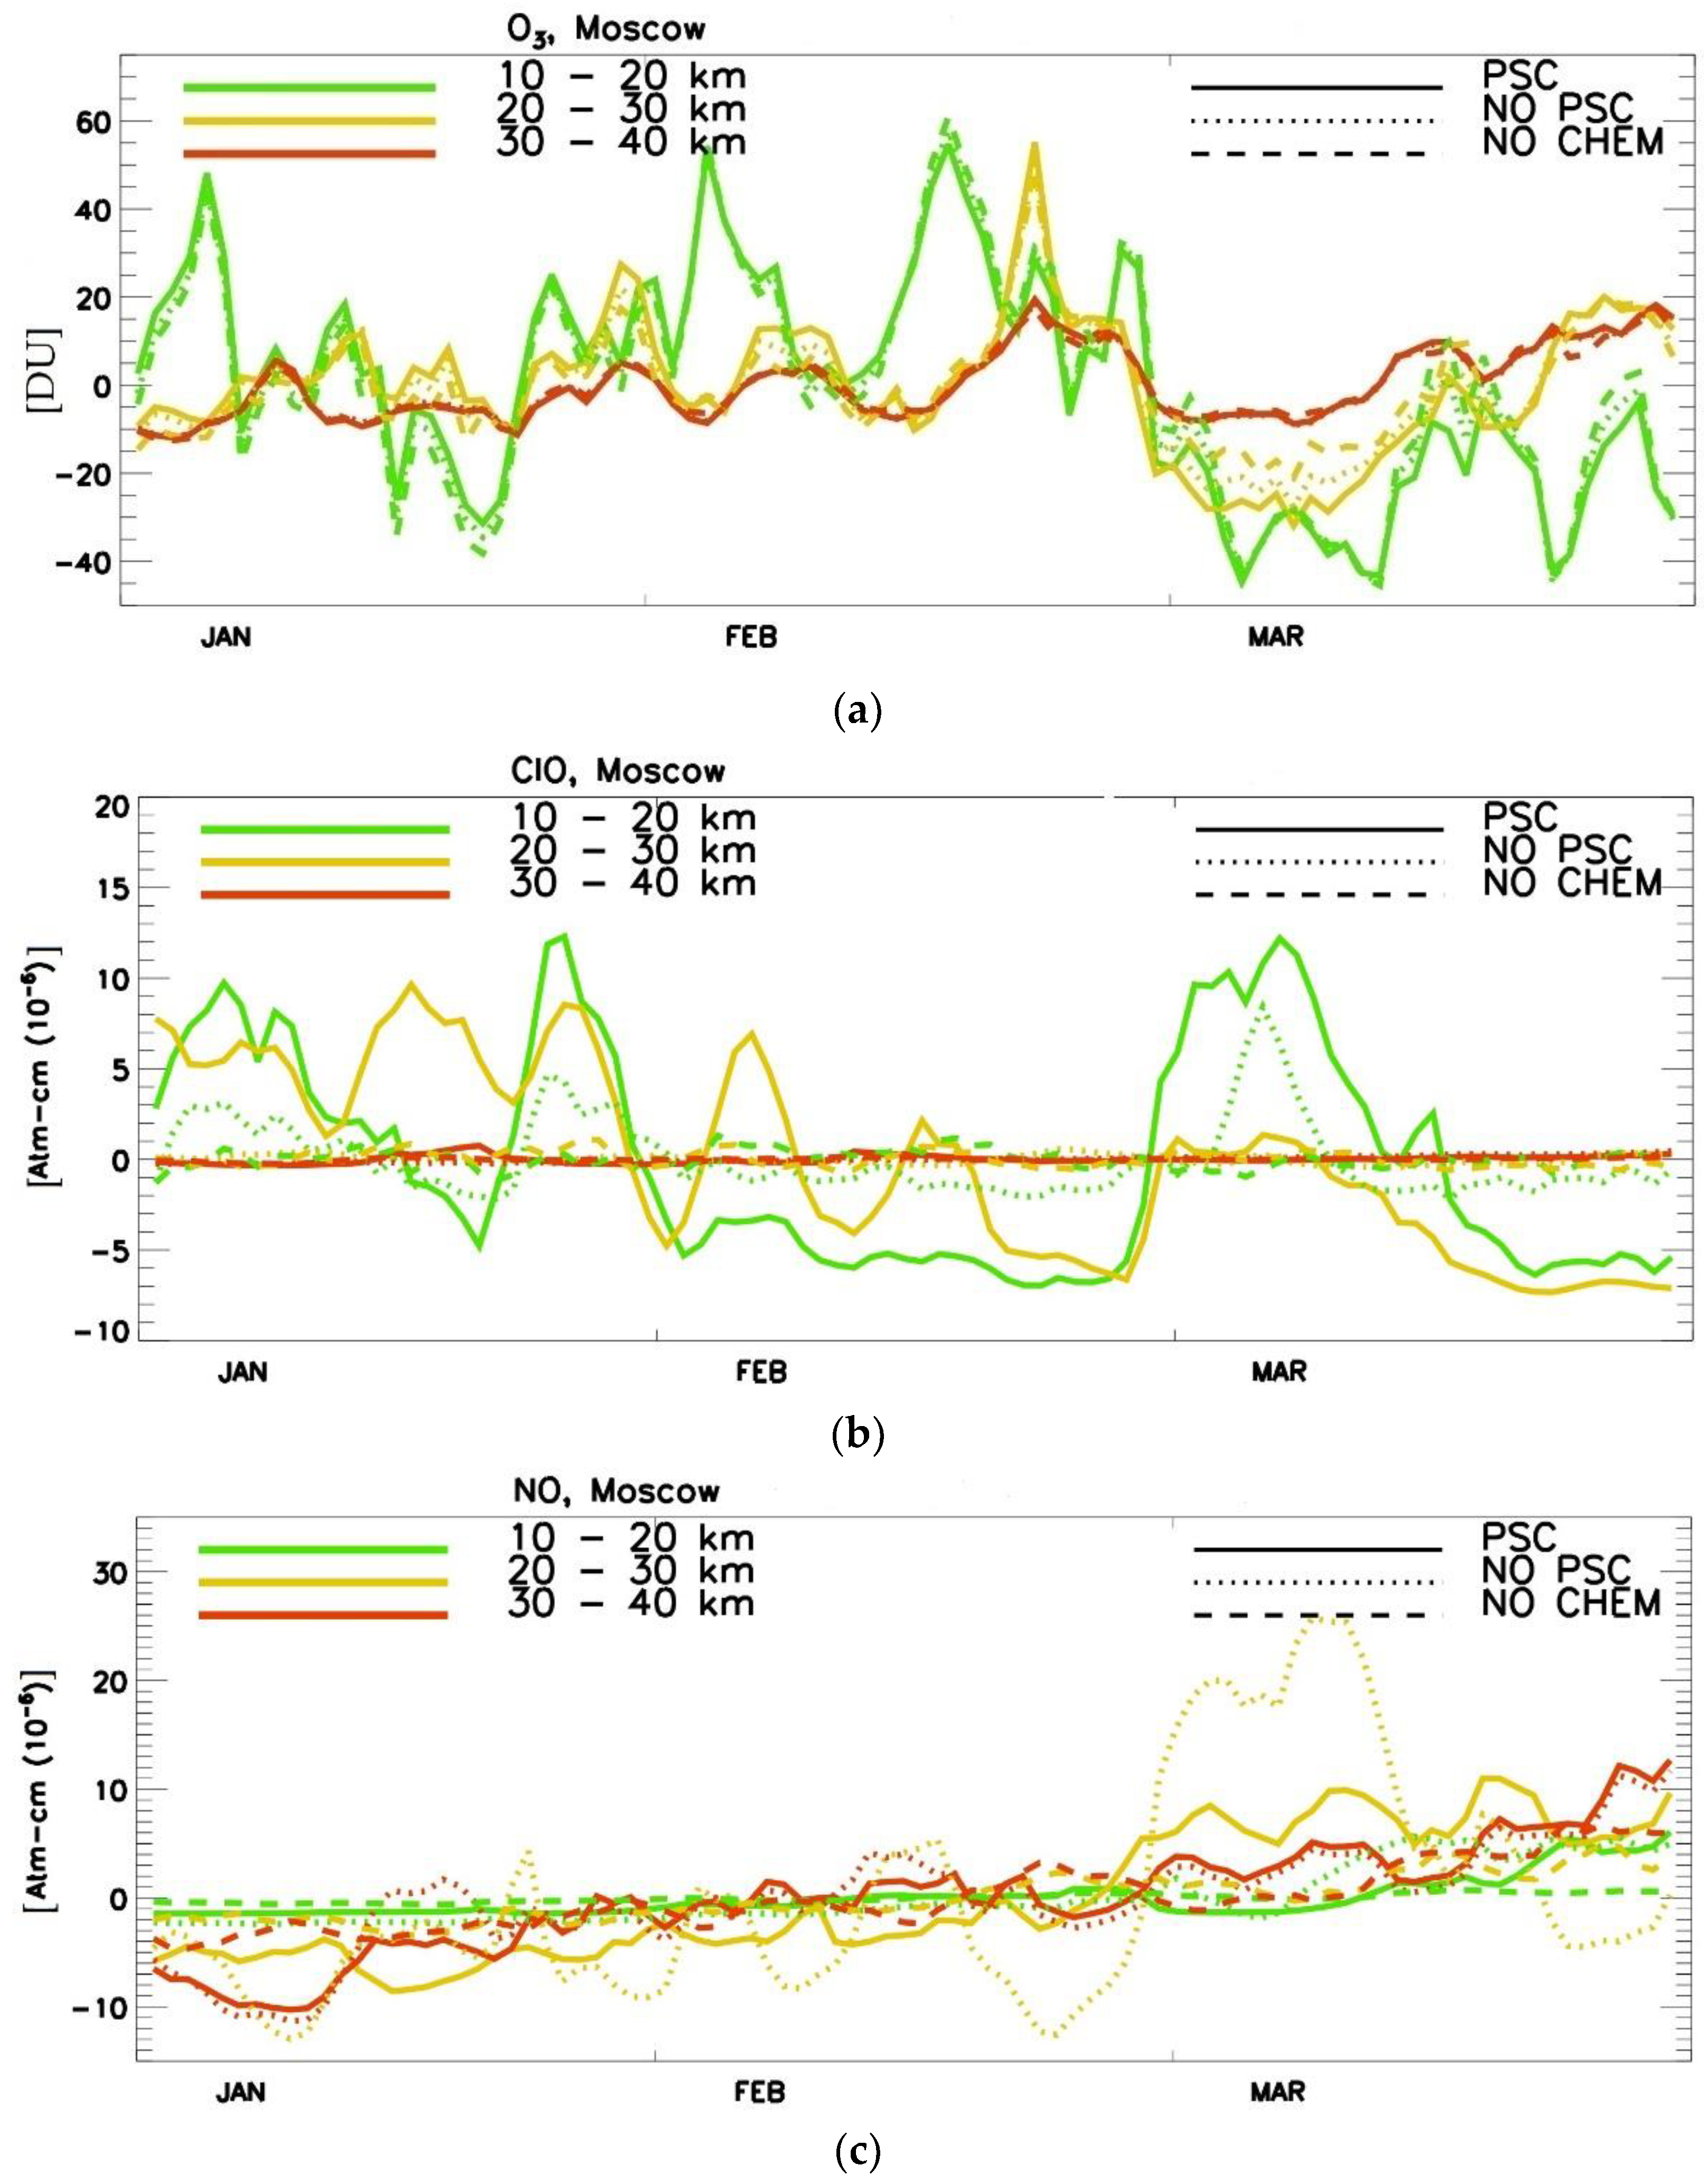
In Moscow (Figure 10), the main features of ozone, chlorine, and nitrogen variability characteristic of St. Petersburg are maintained. Atmospheric dynamics play a dominant role in January and February, but March has its own unique characteristics. For both the PSC and NO PSC scenarios, maximum ClO values are observed in early March, However, in the middle and latter half of the month, ClO values drop sharply for both scenarios. This suggests that ozone depletion potential is created through chemical reactions involving PSCs and without PSCs. Unlike in St. Petersburg, ozone values at altitudes of 10–20 km in Moscow show no differences between these scenarios (Figure 10a). This indicates that in Moscow, the dynamic processes have an even more significant influence than in St. Petersburg.
For Helsinki, the picture is similar to that of St. Petersburg (Figure 3a).

3.5. Surface UV Radiation Analysis

The ozone decrease can lead to a dramatic growth in UV irradiance. Further UV changes associated with reduced TCO over northwestern Russia and Scandinavia in the late winter season 2024–2025 were studied. Using the online tool for simulating UV resources [55], we estimated the corresponding level of UV irradiance at noon and determined the categories of UV resources. Table 1 presents the calculated UV indices and the categories of UV resources at the monthly minimum ozone level for the months during the ozone mini-hole events in 2025 in clear sky and typical cloudy conditions. We also estimated UV indices at the standard ozone level for the days considered and their relative difference from the UV indices in conditions with minimum TCO. More detailed analysis was carried out for Moscow as St. Petersburg and Helsinki, due to their northern position, have very small solar elevations in January and February and, hence, very little UV irradiance.
A significant drop was observed in the ozone level during the mini-hole events during all three months; however, the most pronounced reduction was observed in March. These changes in total ozone provide a significant increase in erythemal UV irradiance from 24 to 27% in January and February up to almost 70% in March in Moscow. The growth in solar elevation in March and the decrease in ozone has led to the change in UV categories from UV deficiency in winter months to UV optimum category for skin type 2 and the standard open skin factor of 0.25. This UV optimum category provides a UV level with which it is possible to obtain vitamin D while maintaining safe levels of harmful erythemal radiation.
For 5 March 2025, in the comparisons between UV levels of the three cities, we mark the UV optimum category of Helsinki similar to that of Moscow’s conditions due to its stronger ozone decrease despite its northern location. In St. Petersburg, UV deficiency conditions are still observed.
Note that the typical cloudiness during these months—with a cloud modification factor of about 0.5–0.7 according to the climatic dataset [53]—led to a decrease in UV radiation but did not change the UV category in these particular cases (see Table 1).
As noted in the Introduction, the largest increase in UV radiation in the Arctic was recorded in late March and early April 2020 over Northern Canada [9]. Changes in surface UV radiation for conditions on 6 April for St. Petersburg, Moscow and Helsinki were assessed as an example using the minimum TCO values observed on 6 March 2025. The possibility of repeating winter seasons with strong ozone layer destruction as in spring 2020 was taken into account, as well as the possibility of forming areas of low ozone content comparable to those observed in March 2025. The estimates show an increase in UV indices relative to climate (standard) values by approximately 2 times up to 4.5–4.9 for clear sky conditions (Table 2), which corresponds to the moderate UV excess category of UV resources. Note that the obtained UV indices correspond to high values observed in summer conditions in Moscow [58] and require the adoption of protective measures, including limiting exposure to the open sun, using sunscreens, etc., especially for people with the most sensitive skin types.
This is especially important considering, as already mentioned in the introduction, that even a relatively small increase in UV radiation in the spring (in particular, at the beginning of April) due to a decrease in TCO in Northern and Central Europe must be taken into account. The necessary protective measures must also be taken since the human body becomes more sensitive to such an increase after the winter period [9].

4. Discussion and Conclusions

The interannual and intraseasonal variability of the polar winter stratosphere remains a challenge for the research community, despite advances in the study of middle atmosphere dynamics, chemical processes, and ozone layer variability achieved in the past few decades; see, e.g., [1,2].
Although the first signs of a decline in ozone-depleting compounds have been identified since the early 2000s, dynamic conditions conducive to the severe destruction of the ozone layer may form in the polar stratosphere in some years, such as the record-breaking destruction of the ozone layer in the Arctic in the late winter of 2020. Moreover, the Arctic stratosphere has shown a cooling trend due to the increase in carbon dioxide in recent years—see, e.g., [1,59]—which may enhance ozone depletion.
During the first half of the Arctic winter of 2025, the stratospheric polar vortex exceeded the corresponding values of the winter of 2020. Without the minor SSW event in late February and the major SSW event in early March, ozone depletion in the spring of 2025 could exceed 2020 levels.
This study analyzes the ozone anomaly formed over Scandinavia and northwestern Russia in March 2025 with minimum TCO values differing by ~40% (or ~3 standard deviation units) relative to the average values for the period 1978–1988 and close to the accepted conventional threshold of the ozone hole in Antarctica at 220 DU.
The modeling results demonstrated that dynamic processes play the main role in the anomalous TCO values in early 2025. Chemical reactions also contribute to ozone destruction, with maximum chemical destruction observed in mid-March. The influence of heterogeneous chemical processes on polar stratospheric clouds is less significant than the influence of gas-phase chemical reactions and heterogeneous chemical processes on sulfate aerosol. However, chemical processes on PSCs make a noticeable contribution to short-term ozone minima, particularly in early March and especially in mid-March 2025.
The analysis of model-calculated changes in different altitude ranges revealed that the main changes are observed in the lowest stratosphere (10–20 km), especially in the early and midwinter of 2025. The chlorine oxide content is higher at altitudes of 20–30 km in early winter and increases at altitudes of 10–20 km in the second half. The nitric oxide content—which, on the one hand, determines the intensity of nitrogen catalytic destruction of ozone and, on the other hand, characterizes denitrification, which prevents the neutralization of halogen destruction of ozone—increases from February to March. However, in scenarios with PSCs, the nitric oxide content is significantly lower than in scenarios without PSCs. This suggests that the competition between nitrogen and chlorine ozone destruction contributed to the formation of decreased TCO values.
The estimates of changes in UV radiation in the two largest cities in northwestern Russia—Moscow and St. Petersburg—and the largest city of Finland—Helsinki—in March 2025 show a significant increase due to the observed ozone anomaly. However, the absolute UV values lie within UV deficiency or UV optimum categories and remain safe. The same minimum TCO values, if observed for a month later at the beginning of April, would lead to dangerous values for the moderate UV excess category, requiring the adoption of restrictive and protective measures to avoid the negative impact of increased levels of UV radiation on human health.
Overall, the main conclusions from the present study can be formulated as follows:
-
In comparison with the other winters, the stratospheric polar vortex in December 2024–February 2025 was very cold and persistent. The very low temperatures inside the stratospheric polar vortex in February 2025 led to the formation of PSC type I (NAT) with monthly mean volume exceeding the corresponding values of all winters with strong ozone loss, including February 2020. The lowest temperatures of the Arctic low stratosphere in early February allowed PSC type II (ICE) to form over several days, with values exceeding the records over all the years of observation. This type of PSC is the rarest in the Arctic; see [57].
-
The minor SSW in late February and the major SSW events in early March prevented the possible strong ozone depletion in the spring of 2025, which very likely could exceed the levels of spring 2020 with the record ozone loss observed in the Arctic over the whole period of observation.
-
The low-ozone episode over Scandinavia and northwestern Russia in early March 2025 was characterized by the record-breaking values of total ozone of 221 DU over St. Petersburg and very low values for Helsinki and Moscow, according to the OMI (204 DU and 242 DU, respectively).
-
Low total column ozone values in early March 2025 were confirmed using a ground-based M-124 ozonometer, DOAS measurements in St. Petersburg and a M-124 ozonometer in Moscow, as well as ERA5 reanalysis data. The largest daily negative deviations of M-124 ozonometer TCO measurements from the climate mean values for St. Petersburg and Moscow in early March 2025 reached about 40%.
-
The decrease in TCO values due to tropopause elevation and transport of low-ozone air masses along the anticyclone western periphery, as well as chemical ozone loss in the polar lower stratosphere, were the main processes responsible for the ozone mini-hole formation.
-
Chemistry-transport model experiments showed that dynamical processes played a predominant role in the low TCO values for St. Petersburg, Moscow and Helsinki in the late winter of 2025, but the role of chemical processes is not negligible.
-
Despite the reduced TCO values in early March 2025, the increase in UV radiation over Moscow, St. Petersburg and Helsinki reached up to 60–100%, and the absolute values remained safe, mainly due to the low solar zenith angle.
Finally, the obtained results show that ozone layer variability over extratropical northern hemisphere latitudes in the late winter season still requires the continuation and development of ground-based and satellite ozone observations, as well as analysis of dynamic and chemical processes contributing to the formation of ozone anomalies.

Author Contributions

All authors had valuable contributions in the writing of the text, data analysis and visualization of the results, including in providing the data of chemistry-transport modeling, S.S.; analysis of Arctic stratosphere dynamics and ozone layer changes, P.V. and V.G.; estimation of surface UV-B radiation changes, N.C.; analysis of the total column ozone according to TOMS, OMI, OMPS satellite measurements, T.B., P.V. and D.I.; ground-based DOAS measurements, D.I.; and M-124 ozonometer measurements in St. Petersburg, A.S.; and Moscow, N.I. All authors have read and agreed to the published version of the manuscript.

Funding

Investigation of Arctic stratospheric dynamics; ozone layer changes using NCEP, ERA5 and MERRA2 reanalysis data; and chemistry–climate modeling was supported by the Russian Science Foundation (project #24-17-00230). The analysis of surface UV-B radiation/UV resources changes was supported by Lomonosov Moscow State University research #121051400081-7.

Institutional Review Board Statement

Not applicable.

Informed Consent Statement

Not applicable.

Data Availability Statement

The data presented in this study are available on request from the corresponding author. The data are not publicly available due to privacy.

Acknowledgments

NCEP reanalysis data were provided by the Climate Prediction Center (NOAA), ERA5 reanalysis datasets by the Copernicus Climate Change Service, MERRA2 reanalysis data by the National Aeronautics and Space Administration (NASA) and total column ozone of the OMI, GOME OMPS and TOMS satellite instruments by NASA’s Earth science data site. DOAS measurements data were acquired using the scientific equipment of the “Geomodel” research center of St. Petersburg State University. Numerical modeling was performed using a chemistry- transport model developed within the framework of the state task of the Ministry of High Education and Science of Russia for the Russian State Hydrometeorological University (project FSZU-2023-0002). Numerical experiments were performed on the RSHU cluster with the support of the Russian Science Foundation project #23-77-30008. The authors are grateful to the four anonymous referees for their useful comments and suggestions.

Conflicts of Interest

The authors declare no conflicts of interest.

Abbreviations

The following abbreviations are used in this manuscript:
OMHOzone mini-hole
TCOTotal column ozone
PSCPolar stratospheric cloud
CTMChemistry-transport model
SSWSudden stratospheric warming
UVIUltraviolet solar radiation index
UVRUltraviolet solar radiation
DOASDifferential optical absorption spectroscopy

Appendix A

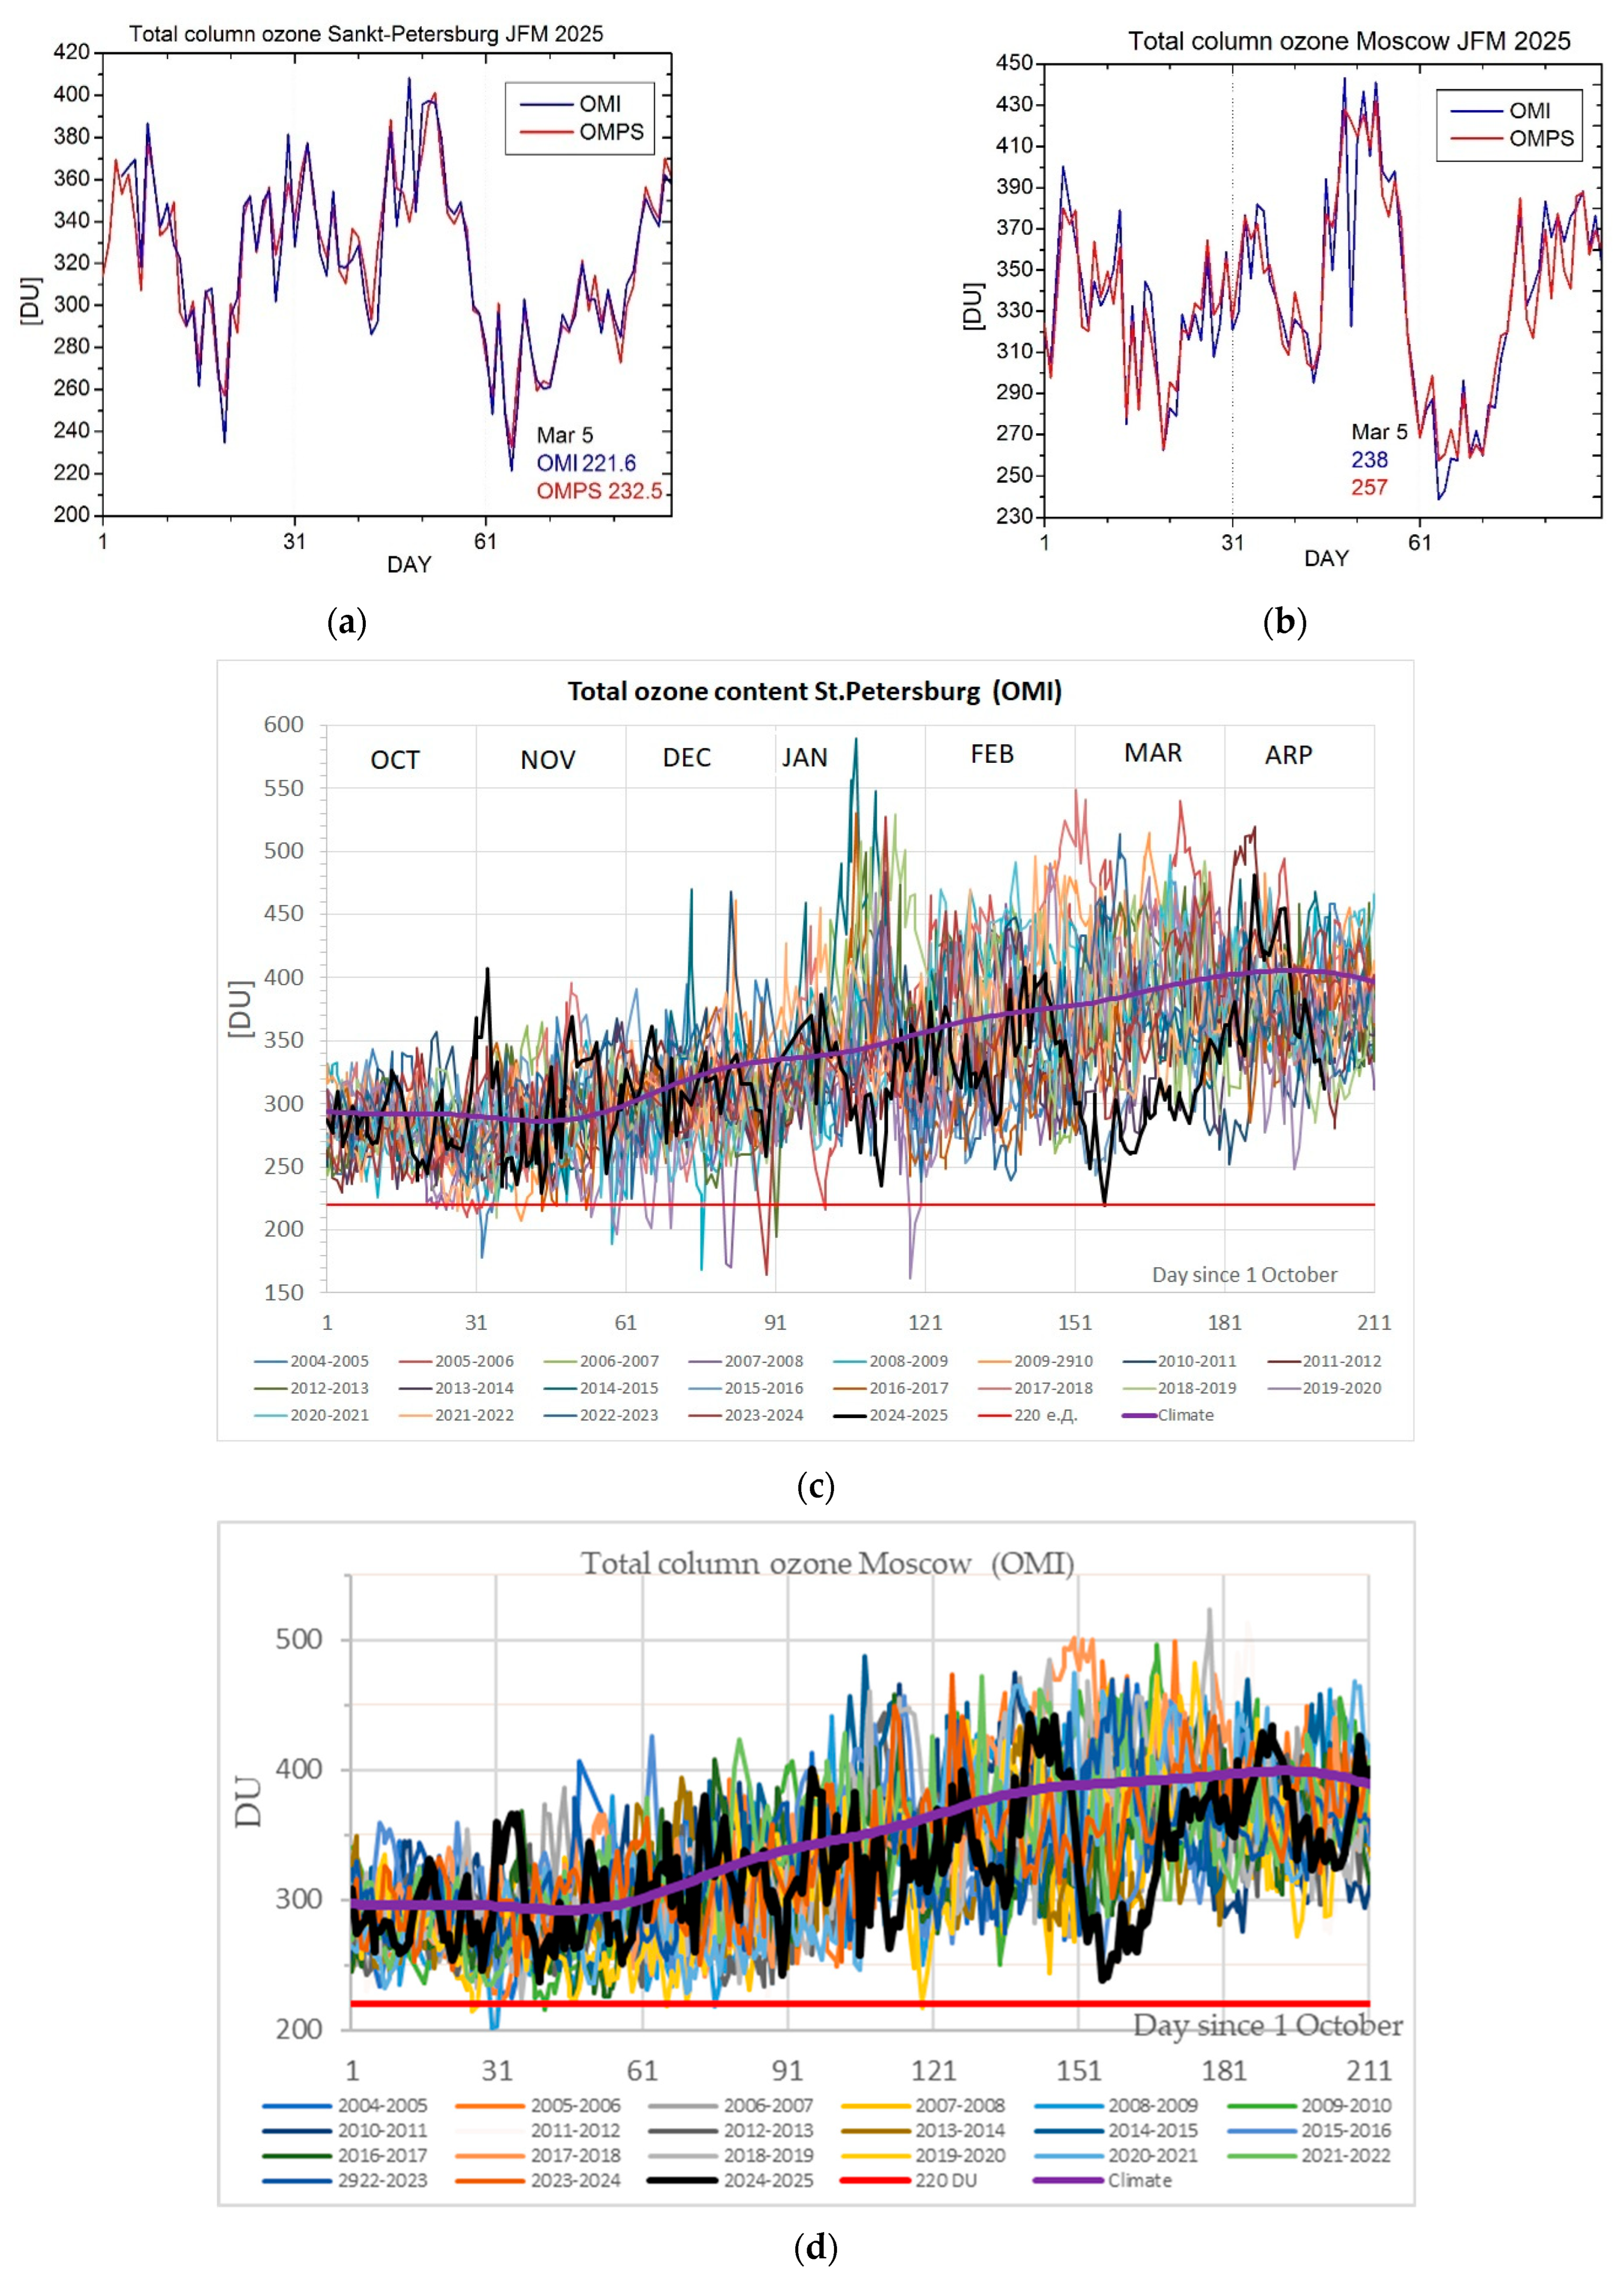
Figure A1. (a,b) TCO satellite data of OMI and OMPS instruments (overpass product) over St. Petersburg and Moscow in January–March 2025. (c,d) TCO from OMI satellite instrument over St. Petersburg and Moscow in January–March from 2002 to 2025.
Atmosphere 16 01033 g0a1
Figure A2. (a) Geopotential height deviation from the zonal mean (contours) and vector wind at a pressure level of 500 hPa over Northern Europe and northwestern Russia averaged over 5–7 March 2025. (b,c) Ozone mixing ratio (10−6) at Moscow (55.4° N 37.3° E) and Helsinki (60.1° N 24.5° E) from 1 January to 31 March, 2025 (ERA5 reanalysis data). (d,e) Ozone mixing ratio at 30 hPa averaged over 16–25 February and 1–10 March 2025. Latitudes are from 30° N.
Atmosphere 16 01033 g0a2
Figure A3. (a) TCO anomaly variability in January–March 2025 for different altitudes and scenarios over Helsinki (60.3° N 25° E) (DU); (b) ClO column anomaly (atm-cm 10−6); (c) NO column anomalies (atm-cm 10−6). TCO anomalies were calculated relative to January–March 2025 mean.
Atmosphere 16 01033 g0a3

References

  1. World Meteorological Organization (WMO). Scientific Assessment of Ozone Depletion: 2022, GAW Report 278; WMO: Geneva, Switzerland, 2022; p. 509. [Google Scholar]
  2. Baldwin, M.; Birner, T.; Brasseur, G.; Burrows, J.; Butchart, N.; Garcia, R.; Geller, M.; Gray, L.; Hamilton, K.; Harnik, N.; et al. 100 Years of Progress in Understanding the Stratosphere and Mesosphere. Meteorol. Monogr. 2019, 59, 27.1–27.61. [Google Scholar] [CrossRef]
  3. Lawrence, Z.D.; Perlwitz, J.; Butler, A.H.; Manney, G.L.; Newman, P.A.; Lee, S.H.; Nash, E.R. The remarkably strong Arctic stratospheric polar vortex of winter 2020: Links to record-breaking Arctic Oscillation and ozone loss. J. Geophys. Res. Atmos. 2020, 125, e2020JD033271. [Google Scholar] [CrossRef]
  4. Manney, G.L.; Livesey, N.J.; Santee, M.L.; Froidevaux, L.; Lambert, A.; Lawrence, Z.D.; Millán, L.F.; Neu, J.L.; Read, W.G.; Schwartz, M.J.; et al. Record-Low Arctic Stratospheric Ozone in 2020: MLS Observations of Chemical Processes and Comparisons with Previous Extreme Winters. Geophys. Res. Lett. 2020, 47, e2020GL089063. [Google Scholar] [CrossRef]
  5. Smyshlyaev, S.P.; Vargin, P.N.; Motsakov, M.A. Numerical modeling of ozone loss in the exceptional Arctic stratosphere winter spring of 2020. Atmosphere 2021, 12, 1470. [Google Scholar] [CrossRef]
  6. Petkov, B.H.; Vitale, V.; Di Carlo, P.; Drofa, O.; Mastrangelo, D.; Smedley, A.R.; Diémoz, H.; Siani, A.M.; Fountoulakis, I.; Webb, A.R.; et al. An unprecedented Arctic ozone depletion event during spring 2020 and its impacts across Europe. J. Geophys. Res. Atmos. 2023, 128, e2022JD037581. [Google Scholar] [CrossRef]
  7. Wohltmann, I.; von der Gathen, P.; Lehmann, R.; Maturilli, M.; Deckelmann, H.; Manney, G.L.; Davies, J.; Tarasick, D.; Jepsen, N.; Kivi, R.; et al. Near-complete local reduction of Arctic stratospheric ozone by severe chemical loss in spring 2020. Geophys. Res. Lett. 2020, 47, e2020GL089547. [Google Scholar] [CrossRef]
  8. Bernhard, G.H.; Fioletov, V.E.; Grooß, J.U.; Ialongo, I.; Johnsen, B.; Lakkala, K.; Manney, G.L.; Müller, R.; Svendby, T. Record Breaking Increases in Arctic Solar Ultraviolet Radiation Caused by Exceptionally Large Ozone Depletion in 2020. Geophys. Res. Lett. 2020, 47, e2020GL090844. [Google Scholar] [CrossRef] [PubMed]
  9. Czerwińska, A.E.; Krzyścin, J.W. Climatological aspects of the increase of the skin cancer (melanoma) incidence rate in Europe. Int. J. Climatol. 2019, 40, 3196–3207. [Google Scholar] [CrossRef]
  10. Manney, G.L.; Santee, M.L.; Rex, M.; Livesey, N.J.; Pitts, M.C.; Veefkind, P.; Nash, E.R.; Wohltmann, I.; Lehmann, R.; Froidevaux, L.; et al. Unprecedented Arctic ozone loss in 2011. Nature 2011, 478, 469–475. [Google Scholar] [CrossRef] [PubMed]
  11. Karpechko, A.Y.; Backman, L.; Thölix, L.; Ialongo, I.; Andersson, M.; Fioletov, V.; Heikkilä, A.; Johnsen, B.; Koskela, T.; Kyrölä, E.; et al. The link between springtime total ozone and summer UV radiation in Northern Hemisphere extratropics. J. Geophys. Res. 2013, 118, 8649–8661. [Google Scholar] [CrossRef]
  12. von Gathen, P.; Kivi, R.; Wohltmann, I.; Salawitch, R.; Rex, M. Climate change favours large seasonal loss of Arctic ozone. Nat. Commun. 2021, 12, 3886. [Google Scholar] [CrossRef]
  13. Vargin, P.N.; Kostrykin, S.V.; Volodin, E.M.; Pogoreltsev, A.I.; Wei, K. Arctic stratosphere circulation changes in XXI century in simulations of INM CM5. Atmosphere 2022, 13, 25. [Google Scholar] [CrossRef]
  14. Vargin, P.; Kostrykin, S.; Koval, A.; Rozanov, E.; Egorova, T.; Smyshlyaev, S.; Tsvetkova, N. Arctic stratosphere changes in the 21st century in the Earth system model SOCOLv4. Front. Earth Sci. 2023, 11, 1214418. [Google Scholar] [CrossRef]
  15. Peters, D.; Egger, J.; Entzian, G. Dynamical aspects of ozone mini-hole formation. Meteorol. Atmos. Phys. 1995, 55, 205–214. [Google Scholar] [CrossRef]
  16. James, P.M. A Climatology of ozone mini-holes over the Northern Hemisphere. Int. J. Climatol. 1998, 18, 1287–1303. [Google Scholar] [CrossRef]
  17. Sitnov, S.A.; Mokhov, I.I. Satellite-derived peculiarities of total ozone field under atmospheric blocking conditions over the European part of Russia in summer 2010. Russ. Meteorol. Hydrol. 2016, 41, 28–36. [Google Scholar] [CrossRef]
  18. Schneidereit, A.; Schubert, S.; Vargin, P.; Lunkeit, F.; Zhu, X.; Peters, D.; Fraedrich, K. Large scale flow and the long-lasting blocking high over Russia: Summer 2010. Mon. Weather Rev. 2012, 140, 2967–2981. [Google Scholar] [CrossRef]
  19. Shaposhnikov, D.; Revich, B.; Bellander, T.; Bedada, G.B.; Bottai, M.; Kharkova, T.; Kvasha, E.; Lind, T.; Pershagen, G. Long-Term Impact of Moscow Heat Wave and Wildfires on Mortality. Epidemiology 2015, 26, e21–e22. [Google Scholar] [CrossRef]
  20. Orsolini, Y.J.; Nikulin, G. A low-ozone episode during the European heatwave of August 2003. Q. J. R. Meteorol. Soc. 2006, 132, 667–680. [Google Scholar] [CrossRef]
  21. Sofiev, M.; Kouznetsov, R.; Hänninen, R.; Sofieva, V.F. Technical note: Intermittent reduction of the stratospheric ozone over northern Europe caused by a storm in the Atlantic Ocean. Atmos. Chem. Phys. 2020, 20, 1839–1847. [Google Scholar] [CrossRef]
  22. Sitnov, S.A.; Mokhov, I.I. Relationship of the ozone mini-hole over Siberia in January 2016 to atmospheric blocking. Dokl. Earth Sci. 2021, 500, 772–776. [Google Scholar] [CrossRef]
  23. Nikiforova, M.P.; Vargin, P.N.; Zvyagintsev, A.M. Ozone Anomalies over Russia in the Winter-Spring of 2015/2016. Russ. Meteorol. Hydrol. 2019, 44, 23–32. [Google Scholar] [CrossRef]
  24. Timofeyev, Y.M.; Smyshlyaev, S.P.; Virolainen, Y.A.; Garkusha, A.S.; Polyakov, A.V.; Motsakov, M.A.; Kirner, O. Case study of ozone anomalies over northern Russia in the 2015/2016 winter: Measurements and numerical modelling. Ann. Geophys. 2018, 36, 1495–1505. [Google Scholar] [CrossRef]
  25. Chubarova, N.E.; Timofeev, Y.M.; Virolainen, Y.A.; Polyakov, A.V. Estimates of UV indices during the periods of reduced ozone content over Siberia in winter-spring 2016. Atmos. Ocean. Opt. 2019, 32, 177–179. [Google Scholar] [CrossRef]
  26. Vargin, P.N.; Fomin, B.A.; Semenov, V.A. Influence of ozone mini-holes over Russian territories in May 2021 and March 2022 revealed in satellite observations and simulation. Atmos. Ocean. Opt. 2023, 36, 578–589. [Google Scholar] [CrossRef]
  27. Schwarz, M.; Baumgartner, D.J.; Pietsch, H.; Blumthaler, M.; Weihs, P.; Rieder, H.E. Influence of low ozone episodes on erythemal UV-B radiation in Austria. Theor. Appl. Climatol. 2018, 133, 319–329. [Google Scholar] [CrossRef]
  28. Laschewski, G.; Matzarakis, A. Long-Term Changes of Positive Anomalies of Erythema-Effective UV Irradiance Associated with Low Ozone Events in Germany 1983–2019. Environments 2023, 10, 31. [Google Scholar] [CrossRef]
  29. Jhappan, C.; Noonan, F.; Merlino, G. Ultraviolet radiation and cutaneous malignant melanoma. Oncogene 2003, 22, 3099–3112. [Google Scholar] [CrossRef]
  30. Herzen Moscow Research Institute of Oncology. Malignant Neoplasms in Russia in 2023 (Morbidity and Mortality); Kaprin, A.D., Starinsky, V.V., Shakhzadova, A.O., Eds.; Herzen Moscow Research Institute of Oncology: Moscow, Russia, 2024; ISBN 978-5-85502-298-8. Available online: https://oncology-association.ru (accessed on 31 July 2025). (In Russian)
  31. Pinault, L.; Fioletov, V. Sun Exposure, Sun Protection and Sunburn Among Canadian Adults; Catalogue No. 82-003-X. Health Reports; Statistics Canada: Ottawa, ON, Canada, 2017; Volume 28, pp. 12–19. [Google Scholar] [PubMed]
  32. Mokhov, I.I.; Timazhev, A.V. Atmospheric blocking and changes in its frequency in the 21st century simulated with the ensemble of climate models. Russ. Meteorol. Hydrol. 2019, 44, 369–377. [Google Scholar] [CrossRef]
  33. Barriopedro, D.; Anto, M.; Garcia, J.A. Atmospheric blocking signatures in total ozone and ozone miniholes. J. Clim. 2010, 23, 3967–3983. [Google Scholar] [CrossRef]
  34. Crespo-Miguel, R.; Ordóñez, C.; García-Herrera, R.; Schnell, J.; Turnock, S. Large-scale ozone episodes in Europe: Decreasing sizes in the last decades but diverging changes in the future. Sci. Total Environ. 2024, 949, 175071. [Google Scholar] [CrossRef]
  35. Kalnay, E.; Kanamitsu, M.; Kistler, R.; Collins, W.; Deaven, D.; Gandin, L.; Iredell, M.; Saha, S.; White, G.; Woollen, J.; et al. The NCEP/NCAR 40-year reanalysis project. Bull. Am. Meteorol. Soc. 1996, 77, 437–470. [Google Scholar] [CrossRef]
  36. Hersbach, H.; Bell, B.; Berrisford, P.; Hirahara, S.; Horányi, A.; Munoz-Sabater, J.; Nicolas, J.; Peubey, C.; Radu, R.; Schepers, D.; et al. The ERA5 global reanalysis. Q. J. R. Met. Soc. 2020, 146, 1999–2049. [Google Scholar] [CrossRef]
  37. Ayarzagüena, B.; Palmeiro, F.M.; Barriopedro, D.; Calvo, N.; Langematz, U.; Shibata, K. On the representation of major stratospheric warmings in reanalyses. Atmos. Chem. Phys. 2019, 19, 9469–9484. [Google Scholar] [CrossRef]
  38. Ionov, D.V.; Timofeyev, Y.M.; Poberovskii, A.V. Spectroscopic measurements of O3 and NO2 atmospheric content: Correction of ground-based method and comparison with satellite data. Atmos. Ocean Opt. 2015, 28, 526–532. [Google Scholar] [CrossRef]
  39. Ionov, D.V.; Privalov, V.I. The Differential Spectroscopy Technique DOAS in the Problem of Determining the Total Ozone Content from Measurements of Ground-Based UV Spectrometer UFOS. Atmos. Ocean. Opt. 2022, 35, 1–7. [Google Scholar] [CrossRef]
  40. Platt, U.; Stuz, J. Differential Optical Absorption Spectroscopy (DOAS); Principles and Applications; Springer: Berlin/Heidelberg, Germany, 2008; ISBN 978-3-540-21193-8. [Google Scholar]
  41. Rozanov, V.V.; Buchwitz, M.; Eichmann, K.-U.; de Beek, R.; Burrows, J.P. SCIATRAN—A new radiative transfer model for geophysical applications in the 240–2400 nm spectral region: The pseudo-spherical version. Adv. Space Res. 2002, 29, 1831–1835. [Google Scholar] [CrossRef]
  42. Nerobelov, G.; Timofeyev, Y.; Virolainen, Y.; Polyakov, A.; Solomatnikova, A.; Poberovskii, A.; Kirner, O.; Al-Subari, O.; Smyshlyaev, S.; Rozanov, E. Measurements and modelling of total ozone columns near St. Petersburg, Russia. Remote Sens. 2022, 14, 3944. [Google Scholar] [CrossRef]
  43. Dorokhov, V.M.; Ivlev, G.A.; Privalov, V.I.; Shalamyansky, A.M. Technical equipment of ground-based stations for total ozone measurements in Russia and prospects of modernization. Atmos. Ocean Opt. 2014, 27, 566–572. [Google Scholar] [CrossRef]
  44. Guide to Instruments and Methods of Observation. Volume I—Measurement of Meteorological Variables, WMO-No.8. 2018. Available online: https://community.wmo.int/en/activity-areas/imop/wmo-no_8 (accessed on 31 July 2025).
  45. Gelaro, R.; McCarty, W.; Suárez, M.J.; Todling, R.; Molod, A.; Takacs, L.; Randles, C.A.; Darmenov, A.; Bosilovich, M.G.; Reichle, R.; et al. The Modern-Era Retrospective Analysis for Research and Applications, Version 2 (MERRA-2). J. Clim. 2017, 30, 5419–5454. [Google Scholar] [CrossRef] [PubMed]
  46. Smyshlyaev, S.P.; Galin, V.Y.; Blakitnaya, P.A.; Jakovlev, A.R. Numerical Modeling of the Natural and Manmade Factors Influencing Past and Current Changes in Polar, Mid-Latitude and Tropical Ozone. Atmosphere 2020, 11, 76. [Google Scholar] [CrossRef]
  47. Galin, V.Y.; Smyshlyaev, S.P.; Volodin, E.M. Combined chemistry-climate model of the atmosphere. Izv. Atmos. Ocean. Phys. 2007, 43, 399–412. [Google Scholar] [CrossRef]
  48. Smyshlyaev, S.P.; Dvortsov, V.L.; Geller, M.A.; Yudin, V.A. A two-dimensional model with input parameters from a general circulation model: Ozone sensitivity to different formulations for the longitudinal temperature variation. J. Geophys. Res. Space Phys. 1998, 103, 28373–28387. [Google Scholar] [CrossRef]
  49. Carslaw, K.S.; Luo, B.; Peter, T. An analytic expression for the composition of aqueous HNO3-H2SO4 stratospheric aerosols including gas phase removal of HNO3. Geophys. Res. Lett. 1995, 22, 1877–1880. [Google Scholar] [CrossRef]
  50. Smyshlyaev, S.P.; Galin, V.Y.; Shaariibuu, G.; Motsakov, M.A. Modeling the variability of gas and aerosol components in the stratosphere of polar regions. Izv. Atmos. Ocean. Phys. 2010, 46, 265–280. [Google Scholar] [CrossRef]
  51. Gilchrist, B.; Cressman, G. An experiment in objective analysis. Tellus 1954, 6, 309–318. [Google Scholar] [CrossRef]
  52. Cressman, G. An operational objective analysis system. Mon. Wea. Rev. 1959, 87, 367–374. [Google Scholar] [CrossRef]
  53. Chubarova, N.; Zhdanova, Y. Ultraviolet resources over Northern Eurasia. J. Photochem. Photobiol. B Biol. 2013, 127, 38–51. [Google Scholar] [CrossRef] [PubMed]
  54. Madronich, S.; Flocke, S. Theoretical estimation of biologically effective UV radiation at the Earth’s surface. In Solar Ultraviolet Radiation—Modeling, Measurements and Effects; Zerefos, C., Bais, A.F., Eds.; NATO ASI Series, 152; Springer: Berlin, Germany, 1997; pp. 23–48. [Google Scholar]
  55. Chubarova, N.; Zhdanova, Y.; Nezval, Y. A new parameterization of the UV irradiance altitude dependence for clear-sky conditions and its application in the on-line UV tool over Northern Eurasia. Atmos. Chem. Phys. 2016, 16, 11867–11881. [Google Scholar] [CrossRef]
  56. Vanicek, K.; Frei, T.; Litynska, Z.; Shmalwieser, A. UV-Index for the Public; COST-713 Action: Brussels, Belgium, 2000; p. 27. [Google Scholar]
  57. Zhang, J.; Zhao, Z.; Wang, W.; Wang, Y. Ozone depletion modulated by Arctic polar stratospheric cloud types. Geophys. Res. Lett. 2025, 52, e2024GL114037. [Google Scholar] [CrossRef]
  58. Chubarova, N.Y. UV variability in Moscow according to long-term UV measurements and reconstruction model. Atmos. Chem. Phys. 2008, 8, 3025–3031. [Google Scholar] [CrossRef]
  59. Smith, K.L.; Polvani, L.M. The surface impacts of Arctic stratospheric ozone anomalies. Environ. Res. Lett. 2014, 9, 074015. [Google Scholar] [CrossRef]
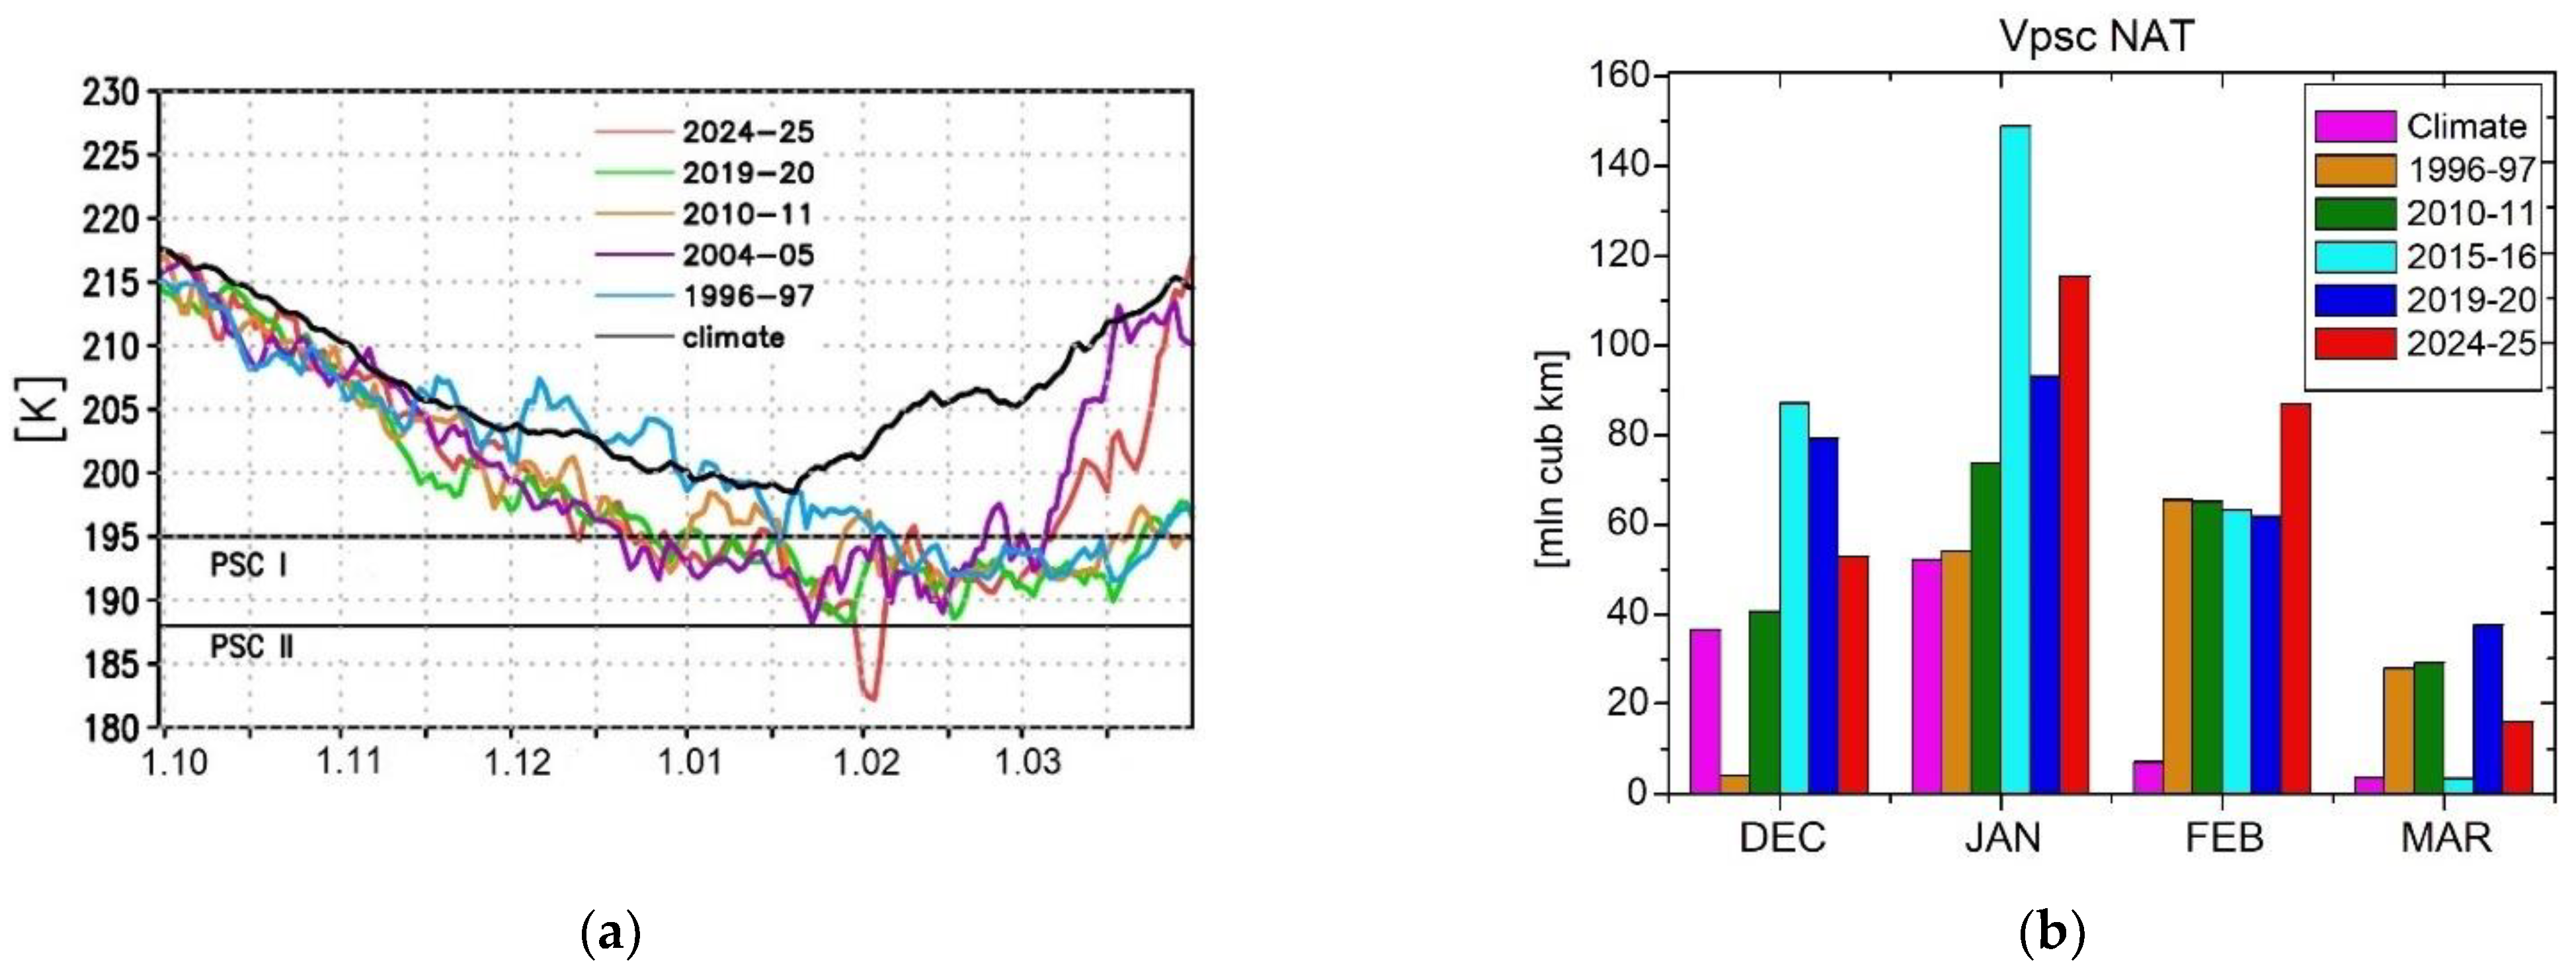
Figure 1. (a) Minimum temperature means at 70° N–90° N at 70 hPa from October 1 to March 31 of the winter seasons 1996–1997, 2010–2011, 2015–2016, 2019–2020 and 2024–2025. Horizontal dashed black lines correspond to PSC type I (NAT) and PSC type II (ICE) formation threshold values. The abscissa axis corresponds to dates in the format day/month. (b) Monthly mean of Vpsc NAT of December, January, February and March of the same winter seasons and the climate mean over 1979–2024 (MERRA2 reanalysis data). (c) Daily Vpsc NAT values in December–March of the same winter seasons. (d) Vpsc ICE in December–March of the winter seasons 2010–2011, 2015–2016, 2019–2020 and 2024–2025. The “MAX” curve corresponds to maximal values of Vpsc NAT and Vpsc ICE values over the period from 1979 to 2024. The “Climate” curve corresponds to the climate mean over 1979–2024 (MERRA2 reanalysis data).
Atmosphere 16 01033 g001aAtmosphere 16 01033 g001b
Figure 2. (a) TCO from TOMS, GOME and OMI satellite instruments over St. Petersburg in January–March from 1979 to 2025 (Dobson units, hereafter DU). Black solid curve—long term means from the TOMS, GOME and OMI over 1979–2005. (b) The same as (a) but over Moscow. (c) TCO at St. Petersburg (SPb), Moscow and Helsinki over January–March 2025 (OMI data); thin red and blue curves correspond to SPb and Moscow TCO climate means. (d) The same as (c) but with ERA5 reanalysis data. (e) TCO over Northern Europe and northwestern Russia on 6 March 2025. (f) The same as (e) but with the TCO anomaly from the climate mean (ERA5 data). Helsinki, St. Petersburg and Moscow are marked with a blue square, triangle and circle, respectively.
Atmosphere 16 01033 g002aAtmosphere 16 01033 g002b
Figure 3. (a) Altitude–time cross-section of geopotential height deviation from the zonal mean at St. Petersburg (60° N 30° E) in January–March 2025. (bd) Geopotential height deviation from the zonal mean (gpm) on 6 March 2025, at 10 hPa, 30 hPa and 70 hPa, respectively. St. Petersburg and Moscow are marked with a red triangle and circle, respectively. (e) Geopotential height deviation from the zonal mean (contour) and vector wind at 500 hPa over Northern Europe and northwestern Russia on 6 March 2025. Latitudes are from 30° N to 80° N; longitudes are from 30° W to 80° E. (f) Altitude–time cross-section of ozone mixing ratio (10−6) at St. Petersburg. (g) Ozone mixing ratio difference (%) at 30 hPa between averaged values over 1–10 March and 16–25 February 2025. Latitudes are from 30° N.
Atmosphere 16 01033 g003aAtmosphere 16 01033 g003b
Figure 4. Total column ozone ground-based DOAS-measurements and satellite OMI data near St. Petersburg (Peterhof, 59.9° N 29.8° E) in January–March 2025. The green curve corresponds to DOAS Peterhof measurement means over 2009–2024.
Atmosphere 16 01033 g004
Figure 5. (a,b) TCO measured by M-124 ozonometer and satellite instrument OMI over Moscow and St. Petersburg from 1 January to 31 March 2025. The green curve corresponds to M-124 daily climate mean over 1974–1984 and the brown curve to the TOMS satellite instrument means over 1978–1988.
Atmosphere 16 01033 g005
Figure 6. (a) TCO variability over St. Petersburg, January–March 2025: SBUV mean over 1979–2021 (yellow), OMI data (gray), MERRA2 data (red), CTM basic scenario (PSC) (blue), CTM scenario without PSC processes included (noPSC) (green), CTM scenario without chemical ozone destruction (noCHEM) (orange). (b) The difference in the total column ozone calculated using the model for St. Petersburg.
Atmosphere 16 01033 g006
Figure 7. (a) Total column ozone variability over Moscow, January–March 2025: SBUV mean over 1979–2021 (yellow), OMI data (gray), MERRA2 data (red), CTM basic scenario (PSC) (blue), CTM scenario without PSC processes included (noPSC) (green), CTM scenario without chemical ozone destruction (noCHEM) (orange). (b) The difference in the total column ozone calculated using the model for Moscow.
Atmosphere 16 01033 g007
Figure 8. (a) TCO variability over Helsinki, January–March 2025: SBUV mean over 1979–2021 (yellow), OMI data (gray), MERRA2 data (red), CTM basic scenario (PSC) (blue), CTM scenario without PSC processes included (noPSC) (green), CTM scenario without chemical ozone destruction (noCHEM) (orange). (b) The difference in the TCO calculated using the model for Helsinki for three scenarios.
Atmosphere 16 01033 g008
Figure 9. (a) TCO anomaly variability in January–March 2025 for different altitudes and scenarios over St. Petersburg (60° N 30.3° E) (DU); (b) ClO column anomaly (atm-cm 10−6); (c) NO column anomalies (atm-cm 10−6). TCO anomalies were calculated relative to January–March 2025 mean.
Atmosphere 16 01033 g009
Figure 10. (a) TCO anomaly variability January–March 2025 for different altitudes and scenarios over Moscow (55.7° N 37.5° E) (DU); (b) ClO column anomaly (atm-cm 10−6); (c) NO column anomalies (atm-cm 10−6). TCO anomalies were calculated relative to January–March 2025 mean.
Atmosphere 16 01033 g010
Table 1. UV indices and the categories of UV resources at the monthly minimum ozone level for the months during the ozone mini-hole events in 2025 and UV indices at typical ozone content in Moscow in clear sky and typical cloudy conditions. All the simulations were conducted using the climatological input parameters for these days according to [55]. The two lower table panels are the same but for St. Petersburg and Helsinki on 5 March 2025, using TCO OMI data. Note that the UV resources category was determined for skin type 2 and the 25% open skin factor.
Ozone Minimum 2025, DUOzone Standard, DUAerosol at 380 nmUV Surface AlbedoUV Index at Minimum Ozone
Clear/Cloudy
UV Index at Standard Ozone
Clear /Cloudy
UV Index Difference Relative to the Standard Ozone Level, %UV Resources Category at Minimum Ozone 2025
Clear/Cloudy
Moscow (55.7° N 37.5° E)
20 Jan262.4340.50.20.350.6/0.30.4/0.227%UV deficiency/UV deficiency
13 Feb295.4369.30.20.371.1/0.60.9/0.524%UV deficiency/UV deficiency
5 March238.7385.10.30.272.5/1.71.5/1.068%UV optimum/UV optimum
St. Petersburg (60° N 30° E)
5 March2213820.30.271.6/1.01/0.660%UV deficiency/UV deficiency
Helsinki (60° N 25° E)
5 March2043820.30.272.0/1.31/0.7100%UV optimum/UV optimum
Table 2. The potential UV indices on 6 April in Moscow, St. Petersburg and Helsinki in clear sky and typical cloud conditions. The dangerous UV index values and the categories of UV resources are shown in red. Note that the UV resources category was determined for skin type 2 and the 25% open skin factor.
Ozone Mini-
mum 2025, DU
Ozone Standard, DUAerosol at 380 nmUV Surface AlbedoUV Index at Minimum Ozone
Clear/Cloudy
UV Index at Standard Ozone
Clear/Cloudy
UV Index Difference Relative to Standard Ozone
Level, %
UV Resources Category at Minimum Ozone 2025
Clear/Cloudy
6 April 2025
Moscow240340.50.20.354.9/3.43.2/2.353%Moderate UV excess/moderate UV excess
St. Peters-
burg
2214040.20.374.5/3.12.3/1.796%Moderate UV excess/moderate UV excess
Helsinki204385.10.30.274.8/3.52.3/1.7110%Moderate UV excess/moderate UV excess
Disclaimer/Publisher’s Note: The statements, opinions and data contained in all publications are solely those of the individual author(s) and contributor(s) and not of MDPI and/or the editor(s). MDPI and/or the editor(s) disclaim responsibility for any injury to people or property resulting from any ideas, methods, instructions or products referred to in the content.