Article

Seasonal Variations and Correlations of Optical and Physical Properties of Upper Cloud-Aerosol Layers in Russia Based on Lidar Remote Sensing

1
Engineering Research Center of Environmental Laser Remote Sensing Technology and Application of Henan Province, Nanyang Normal University, Nanyang 473061, China
2
Key Laboratory of Natural Disaster and Remote Sensing of Henan Province, Nanyang Normal University, Nanyang 473061, China
3
Perception and Effectiveness Assessment for Carbon-Neutrality Efforts, Engineering Research Center of Ministry of Education, Institute for Carbon Neutrality, Wuhan University, Wuhan 430072, China
*
Author to whom correspondence should be addressed.
Atmosphere 2025, 16(9), 1015; https://doi.org/10.3390/atmos16091015
Submission received: 24 June 2025 / Revised: 26 August 2025 / Accepted: 27 August 2025 / Published: 28 August 2025
(This article belongs to the Section Aerosols)

Abstract

Cloud-aerosol interactions represent a critical uncertainty in climate systems. Using 2006–2021 CALIPSO products, we investigated upper tropospheric clouds and aerosol layers across four Russian regions: Western Plains, West Siberian Plain, Central Siberian Plateau, and Eastern Mountains. Top Cloud Optical Depth (TCOD), Top Depolarization Ratio of clouds (TDRc), and Layer Level (LLc) exhibit pronounced seasonal and diurnal variations, peaking during summer and nighttime when convection intensifies. Upper aerosol layers show low Total Aerosol Optical Depth (TAOD) and Color Ratio (CRa), often displaying multi-layered structures influenced by spring–summer dust transport and biomass burning. We constructed a correlation matrix of 49 parameter pairs (7 cloud × 7 aerosol parameters), revealing moderate positive correlations between cloud and aerosol layer heights under coexistence conditions. TDRc showed weak linear but strong nonlinear relationships with aerosol parameters, indicating complex coupling mechanisms beyond simple linear models. Nighttime observations demonstrated superior signal-to-noise ratios and correlation coefficients compared to daytime measurements. These findings enhance understanding of cloud-aerosol coupling at middle-high latitudes, providing parameterization constraints for improving global climate model representations of these processes.

1. Introduction

Clouds and aerosols fundamentally modulate Earth’s radiation budget through scattering and absorption processes, driving climate variability across temporal scales ranging from synoptic weather patterns to long-term climate evolution [1,2,3,4,5]. These components serve as pivotal regulators of both short-term meteorological phenomena and decadal-to-centennial climate trends, establishing their significance as key drivers of global climate change [6,7,8]. The interactions between clouds and aerosols constitute particularly complex and critical processes that profoundly influence atmospheric radiative forcing and broader climate system dynamics [9,10]. Through their coupled effects on cloud microphysical properties and planetary energy balance, cloud-aerosol interactions represent fundamental mechanisms governing Earth’s climate sensitivity [11,12,13].
China’s DQ-1 (Atmosphere 1), the world’s first active laser carbon dioxide monitoring satellite, is equipped with an ACDL lidar system. It has achieved high-precision global observations of XCO2 (with an accuracy of 0.02 ± 1.4 ppm) and direct quantitative monitoring of key point sources (such as power plants) with an estimation bias of approximately 2%. This breakthrough overcomes the limitations of passive optical satellites in observing nighttime, high-latitude, and heavily polluted regions, providing revolutionary data support for global carbon cycle research and emission [14,15]. Recent advances in cutting-edge remote sensing technologies have significantly enhanced our understanding of the vertical optical properties of clouds and aerosols. The EarthCARE (Earth Cloud, Aerosol and Radiation Explorer) mission, a joint ESA-JAXA initiative, has achieved substantial scientific breakthroughs by deploying high spectral resolution lidar technology for quantitative observations of cloud and aerosol properties and their radiative impacts [16]. Similarly, NASA’s ACE (Aerosol-Cloud Explorer) mission employs high spectral resolution lidar to measure critical optical parameters, including aerosol scattering, extinction, and absorption coefficients, thereby advancing research in aerosol, cloud, and ecosystem interactions [17]. Ground-based and airborne platforms have also contributed significant technological innovations. Fang et al. successfully utilized high temporal and spatial resolution Ka-band microwave cloud radar to characterize the vertical structures of optically thick, dense, and multi-layered cloud systems [18]. The research team led by Cristofer Jimenez at the Leibniz Institute for Tropospheric Research in Leipzig, Germany, developed high temporal resolution dual-field-of-view polarimetric lidar techniques to retrieve comprehensive liquid cloud microphysical properties—including extinction coefficients, effective droplet radii, liquid water content, and droplet number concentrations—alongside sub-cloud aerosol characteristics such as extinction coefficients and cloud condensation nuclei concentrations, enabling detailed investigations of liquid cloud evolution under varying aerosol conditions [19]. Building upon these advances, Nanchao Wang et al. implemented dual-field-of-view high spectral resolution lidar (Dual-FOV HSRL) systems that incorporate molecular channels to derive vertical profiles of cloud microphysical properties without requiring thermodynamic assumptions, facilitating more robust analyses of cloud-aerosol interactions [9].
Current global cloud and aerosol research predominantly focuses on densely populated subtropical, tropical, and warm temperate regions, while cold and temperate zones remain significantly under-investigated despite their integral role in global climate assessments [6,20]. Russia’s vast territory encompasses diverse climate regimes, including temperate continental climate across most regions, temperate monsoon climate along the eastern Pacific coast, and boreal climate throughout northern areas. This climatic diversity provides an ideal natural laboratory for investigating cloud and aerosol optical properties under boreal and temperate conditions. Addressing this research gap, the present study focuses on Russian regions to examine cold and temperate upper tropospheric clouds and their interactions with aerosol layers. By integrating 16 years of CALIPSO data (2006–2021), we present the first comprehensive seasonal and diurnal analysis of high clouds (≥5 km altitude) and aerosol layer optical-physical parameters across four major Russian geographical regions: the Western Plains, West Siberian Plain, Central Siberian Plateau, and Eastern Mountains. Our approach constructs a novel 49-parameter correlation matrix for diurnal analysis, representing a methodological advancement that transcends the limitations of traditional linear correlation approaches and enables more sophisticated characterization of cloud-aerosol coupling mechanisms [4,21].

2. Research Methods

2.1. Study Area Overview

The Russian Federation spans 41° N–82° N across the Eurasian continent, encompassing diverse climatic zones from temperate continental (western plains) to continental permafrost (Central Siberian Plateau) and temperate monsoon (eastern Pacific coast). With 45% forest cover and 65% permafrost area, Russia provides an ideal natural laboratory for investigating boreal-temperate cloud-aerosol interactions. The region’s significance is amplified by accelerated Arctic warming at 2–3 times the global average rate (IPCC AR6). Based on dominant physiographic characteristics, we delineated four study regions (Figure 1): Western Plains (Region A, East European Plain), West Siberian Plain (Region B, central-western lowlands), Central Siberian Plateau (Region C, elevated terrain with extensive permafrost), and Eastern Mountains (Region D, mountainous Pacific coastal zone) [22,23,24].

2.2. Data and Methods

CALIPSO’s Cloud-Aerosol Lidar with Orthogonal Polarization (CALIOP) provides unique atmospheric profiling capabilities through active nadir-viewing lidar measurements [25]. CALIOP transmits laser pulses and measures backscattered signals to reconstruct vertical atmospheric profiles with 30 m vertical resolution and ~5 km horizontal resolution after along-track averaging [26,27]. The system employs dual-wavelength measurements (532 nm and 1064 nm) for particle size characterization, with polarization detection at 532 nm enabling cloud-aerosol discrimination through depolarization analysis [27]. CALIPSO maintains 16-day global coverage, providing comprehensive datasets for seasonal and interannual analyses [26]. The Level 2, 5 km cloud-aerosol profile products undergo rigorous quality assurance procedures, ensuring reliable data quality for upper atmospheric cloud-aerosol interaction studies [28].
We analyzed seven key optical and geometric parameters (Table 1): Top Cloud/Aerosol Optical Depth (TCOD/TAOD), Color Ratio (CRc/CRa), Top Depolarization Ratio (TDRc/TDRa), Top Base/Top Height (TBHc/TBHa, THc/THa), Top Thickness (TTc/TTa), and Layer Level (LLc/LLa).
Top Cloud Optical Depth (TCOD) and Top Aerosol Optical Depth (TAOD) represent fundamental optical parameters quantifying the extinction effects of atmospheric particles on solar radiation. These parameters are derived through rigorous retrieval algorithms that account for and exclude the contributions of molecular scattering, water vapor absorption, and ozone extinction, thereby isolating the particle-induced extinction properties [29,30]. The magnitude of optical depth reflects the integrated effects of particle number density, size distribution, and vertical extent on atmospheric radiative transfer processes. Top Base Height (TBH) and Top Height (TH) constitute essential geometric parameters describing the vertical boundaries of cloud and aerosol layers. These parameters typically exhibit strong positive correlations, as variations in layer base altitude often correspond to proportional changes in layer top altitude, indicating coherent vertical displacement of atmospheric features. Top Thickness (TT) serves as a fundamental physical parameter characterizing the vertical extent of atmospheric layers, with larger values indicating geometrically thicker high-altitude clouds or elevated aerosol layers. Layer Level (LL) represents a structural parameter quantifying the number of distinct vertical layers, with higher values corresponding to more complex multi-layered atmospheric configurations. Top Depolarization Ratio (TDR) quantifies the degree of particle non-sphericity through polarimetric measurements, with values directly related to particle morphology, size characteristics, and number concentration. Higher TDRc values indicate increasingly irregular particle geometries and enhanced non-spherical scattering properties. Color Ratio (CR) represents a spectral optical parameter derived from dual-wavelength measurements, serving as a proxy for particle size distribution, with larger values typically indicating smaller mean particle sizes [30,31].
For the convenience of the research, we averaged the relevant data of the seven indicators from 2006 to 2021, and finally plotted based on the average value. Among these, TCOD, TAOD, CRc, CRa, TDRc, TDRa, LLc, and LLa are obtained directly from CALIPSO products, while TTc and TTa are calculated using the following equations:
T T c = T H c T B H c
T T a = T H a T B H a
Quality control included altitude thresholds (≥5 km) and removal of invalid records. We computed 16-year climatological means (2006–2021) for temporal analysis and aggregated data onto 1° × 1° grids for spatial consistency. Correlation analysis examined 49 parameter combinations (7 cloud × 7 aerosol) separately for day/night observations using Pearson’s correlation coefficient (R). Multiple regression models (linear, polynomial, logarithmic, power-law, exponential) were evaluated, with optimal models selected based on minimum error criteria.
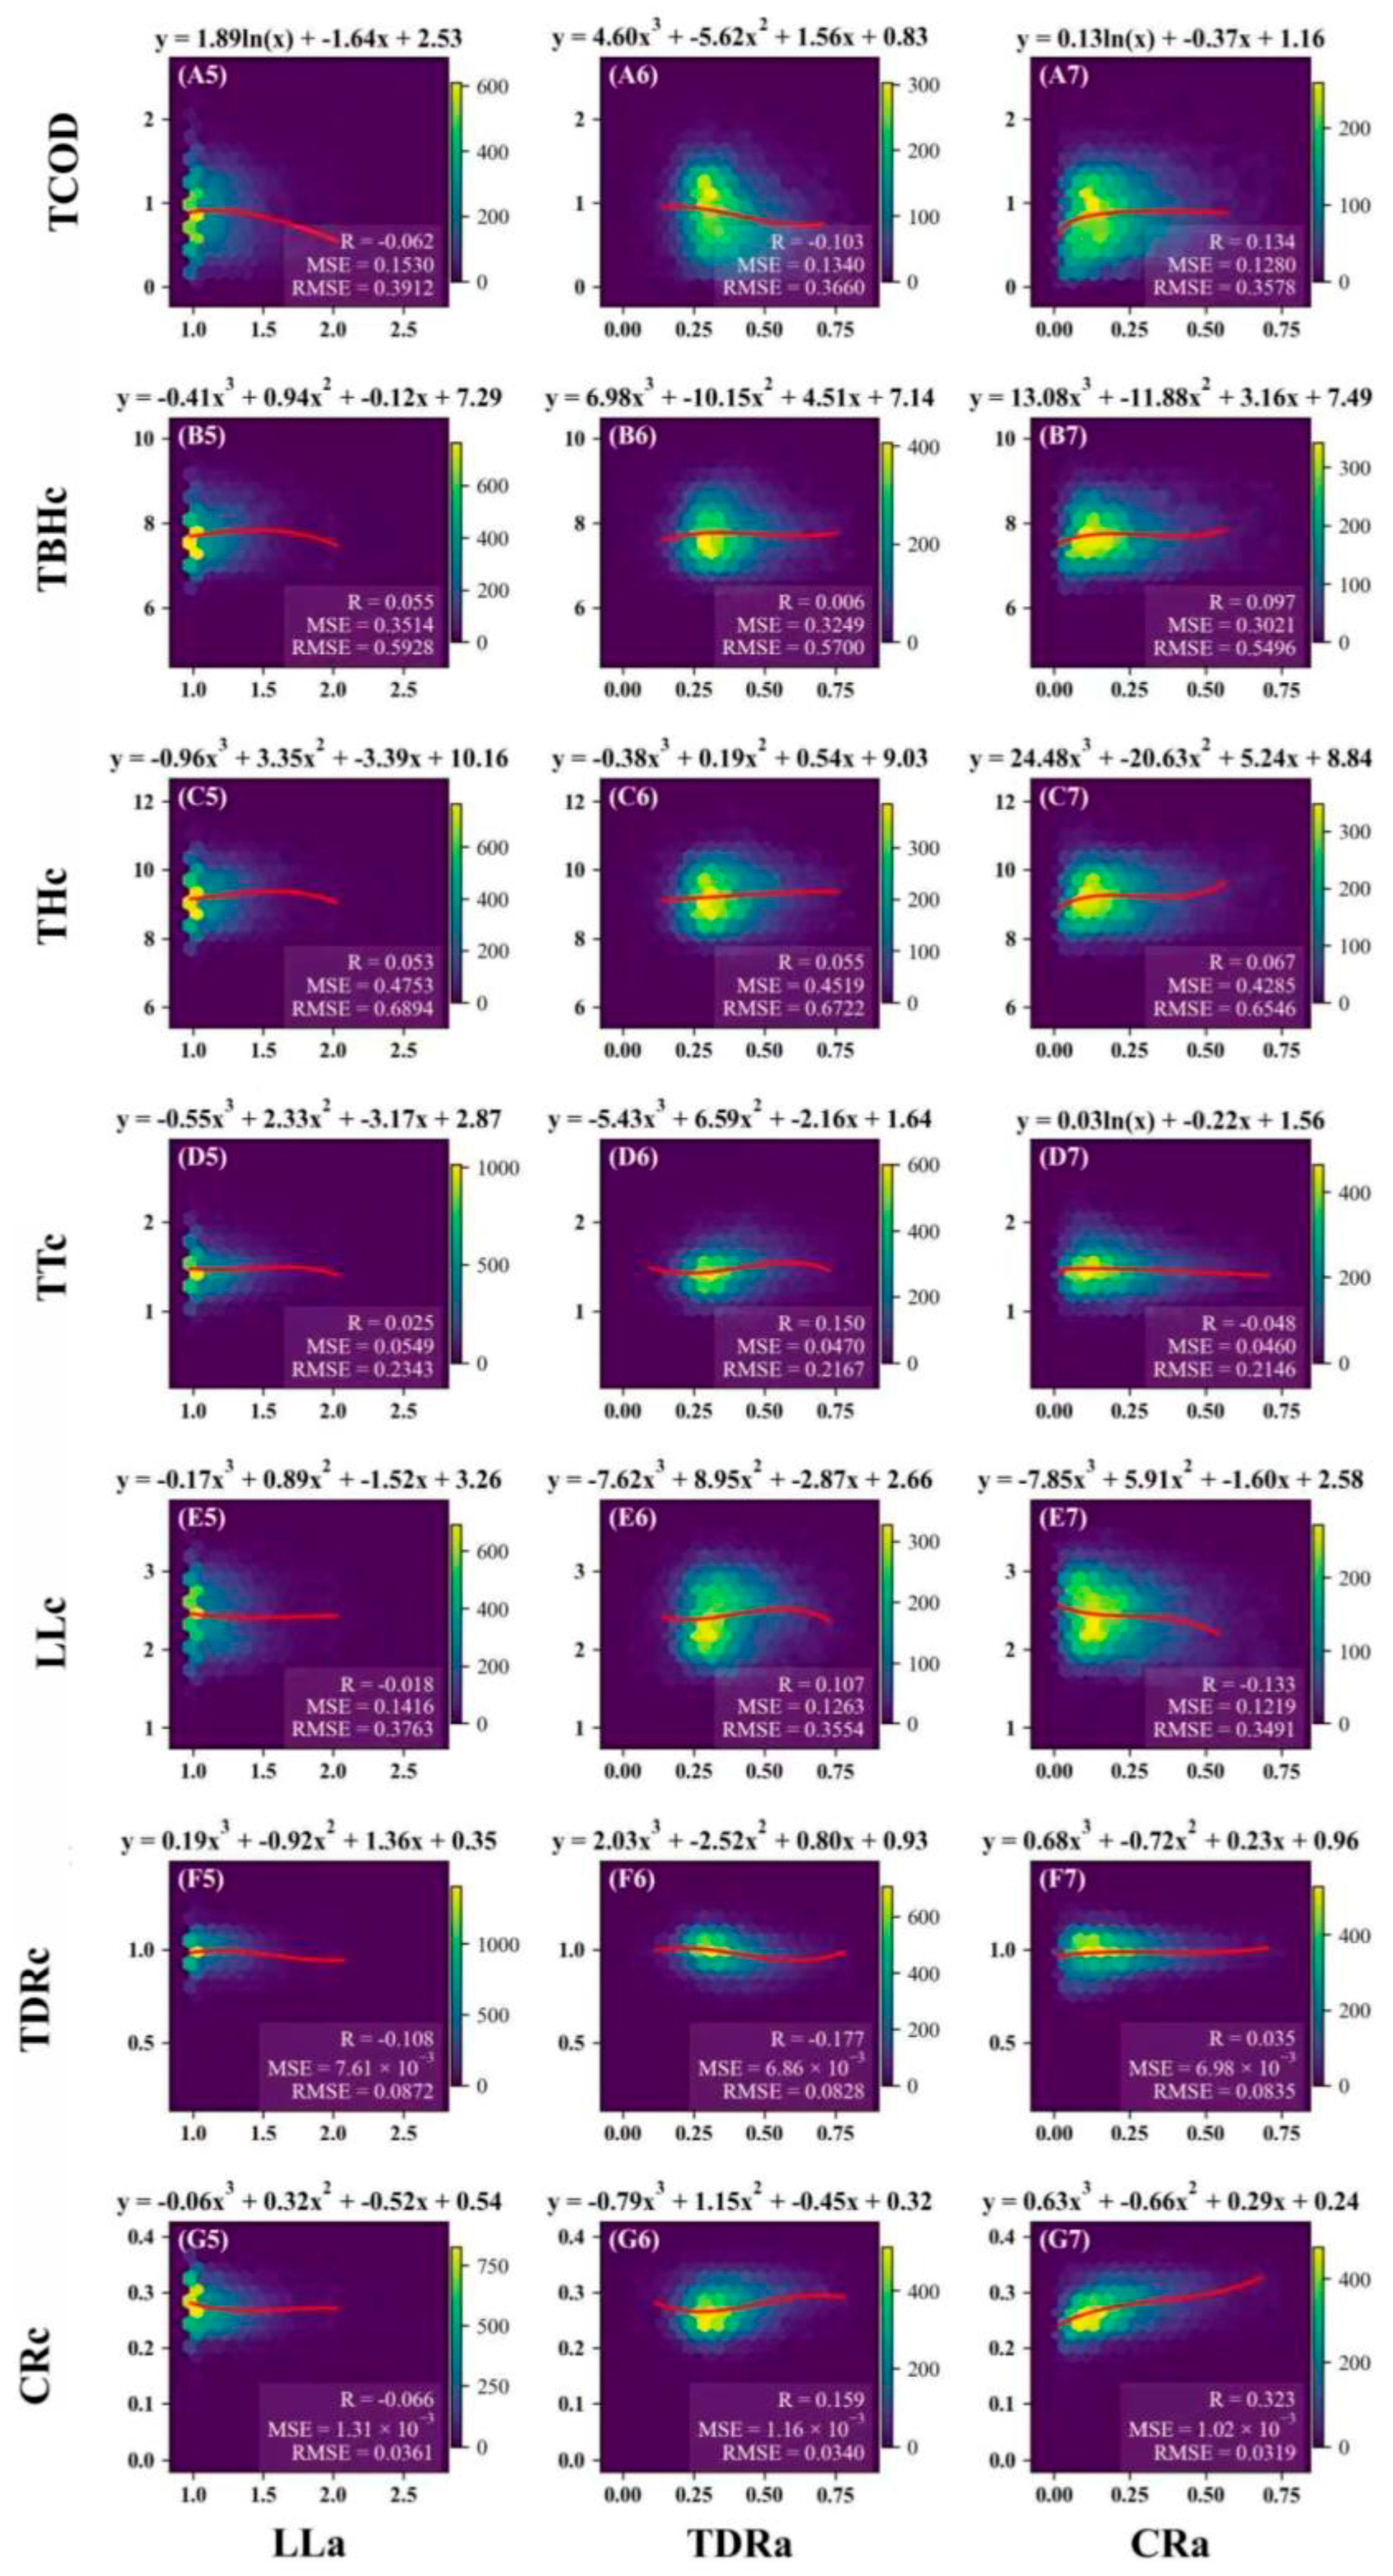
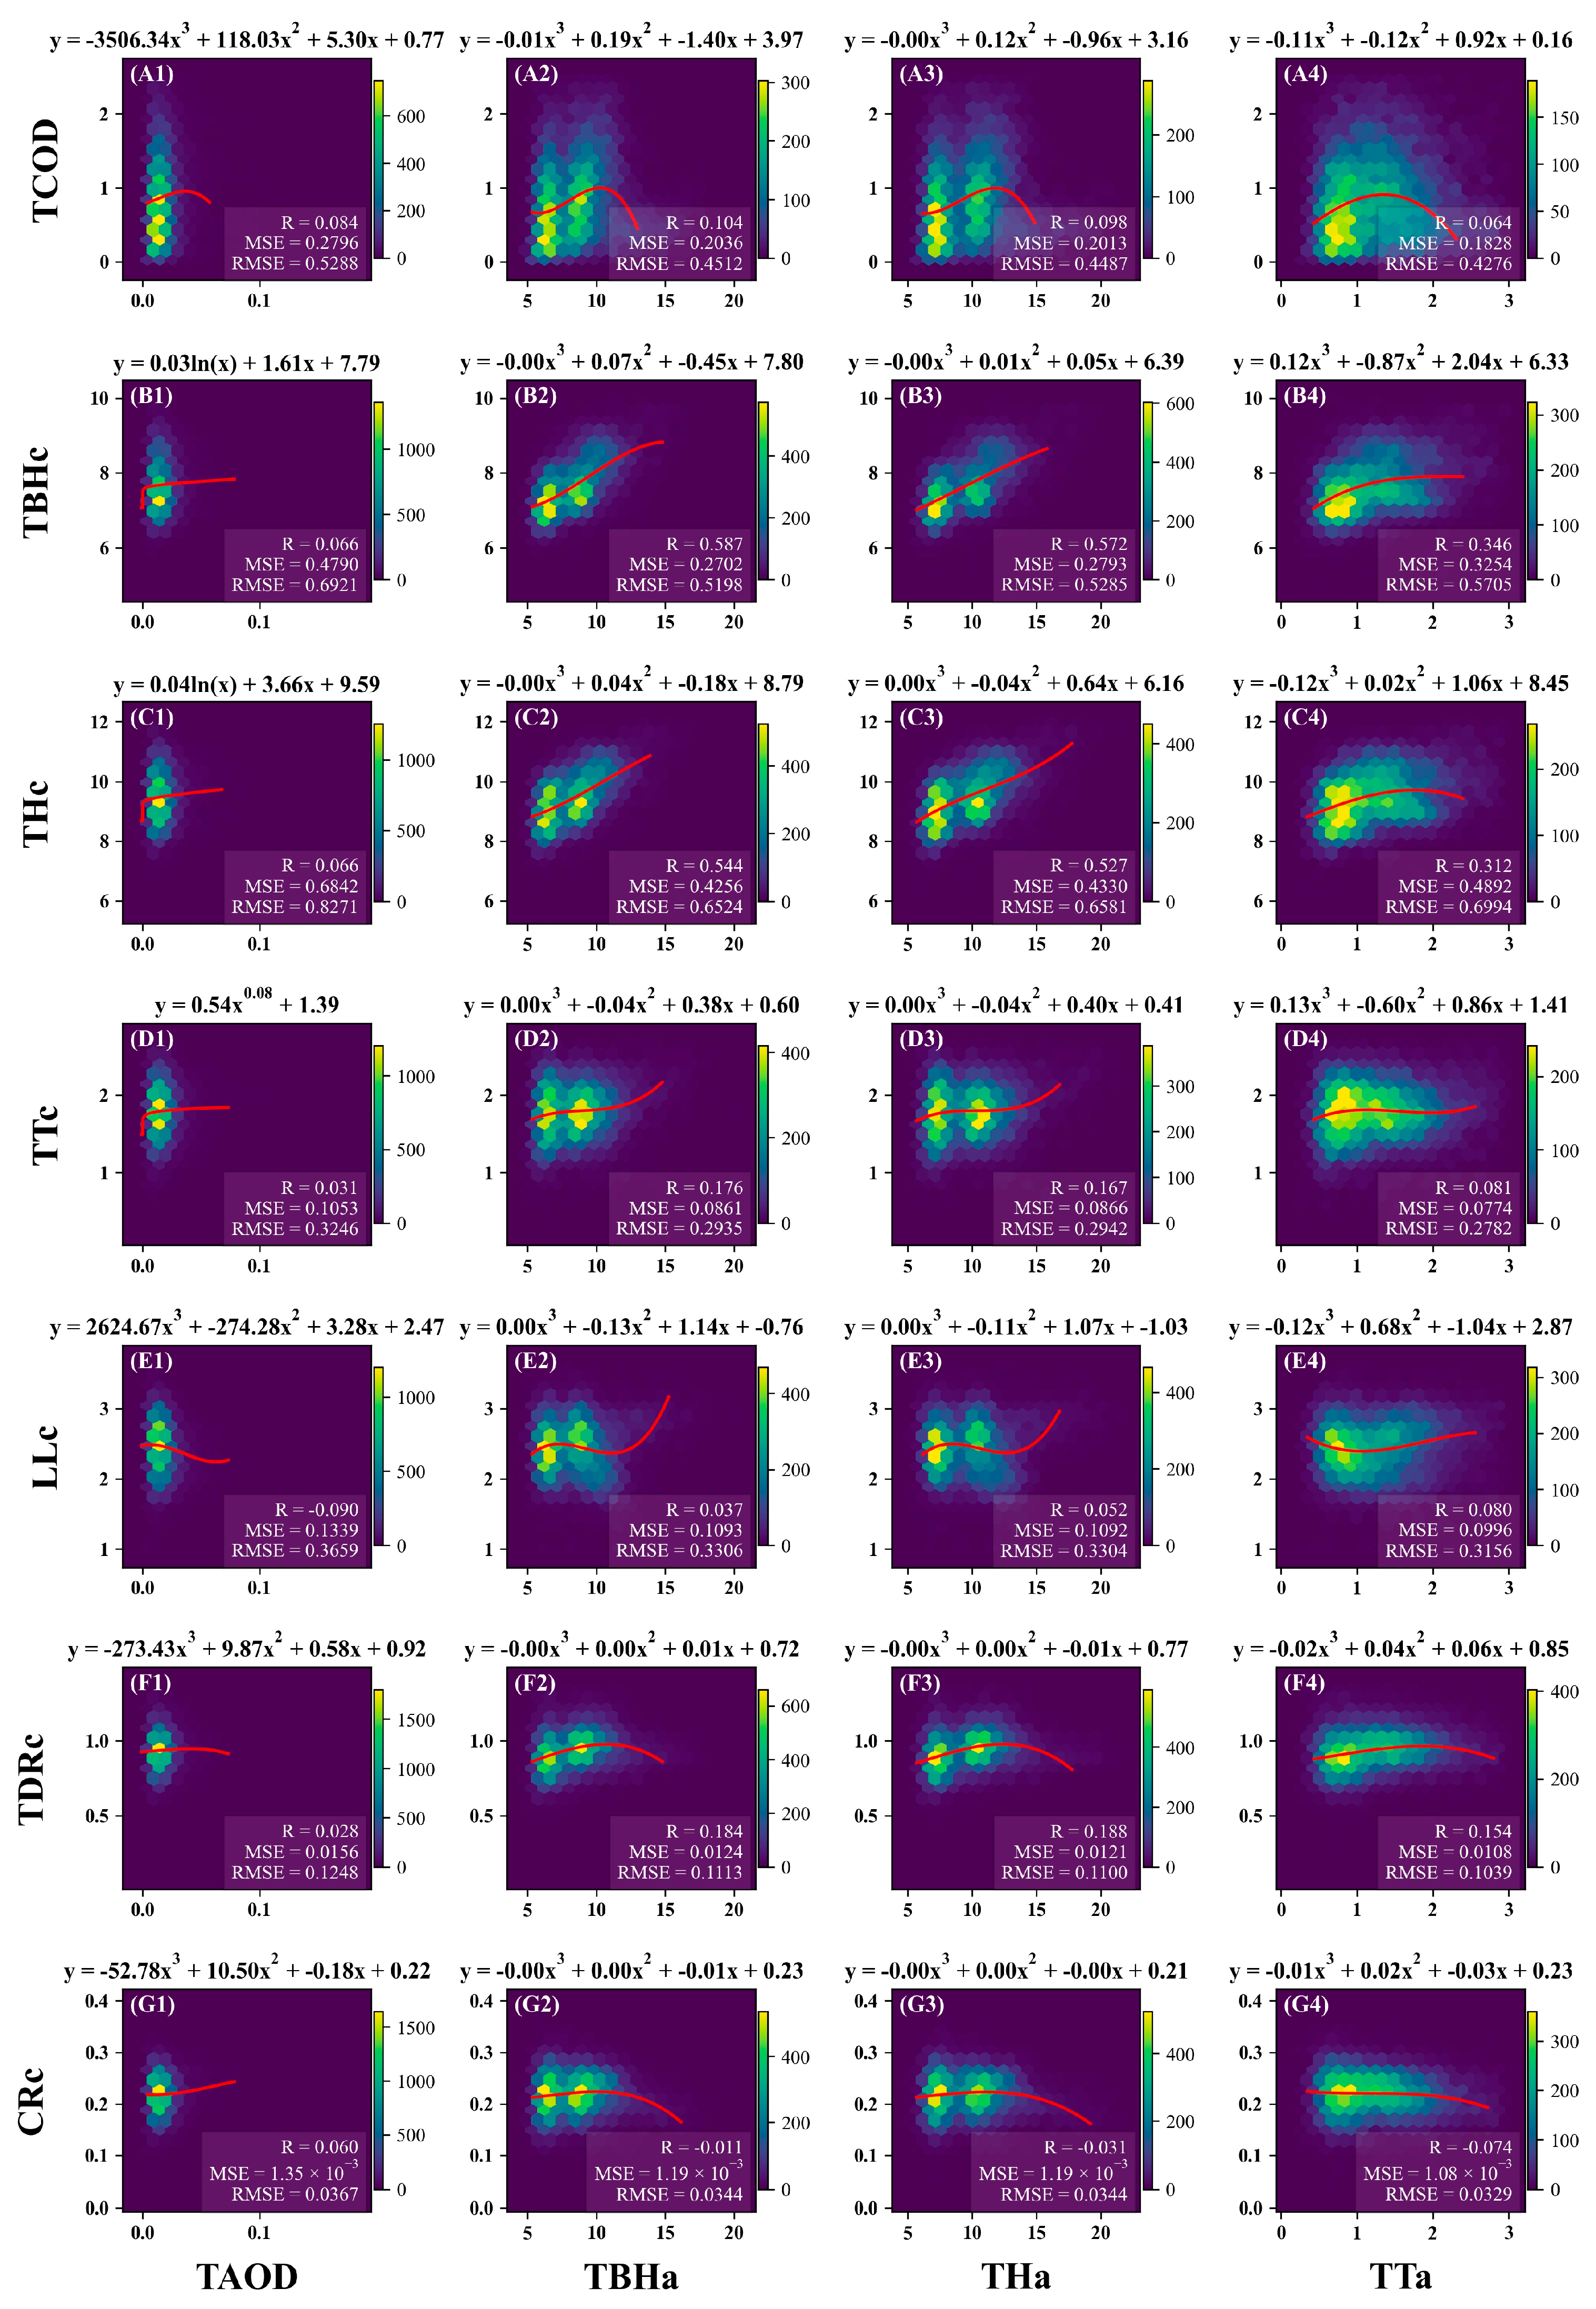
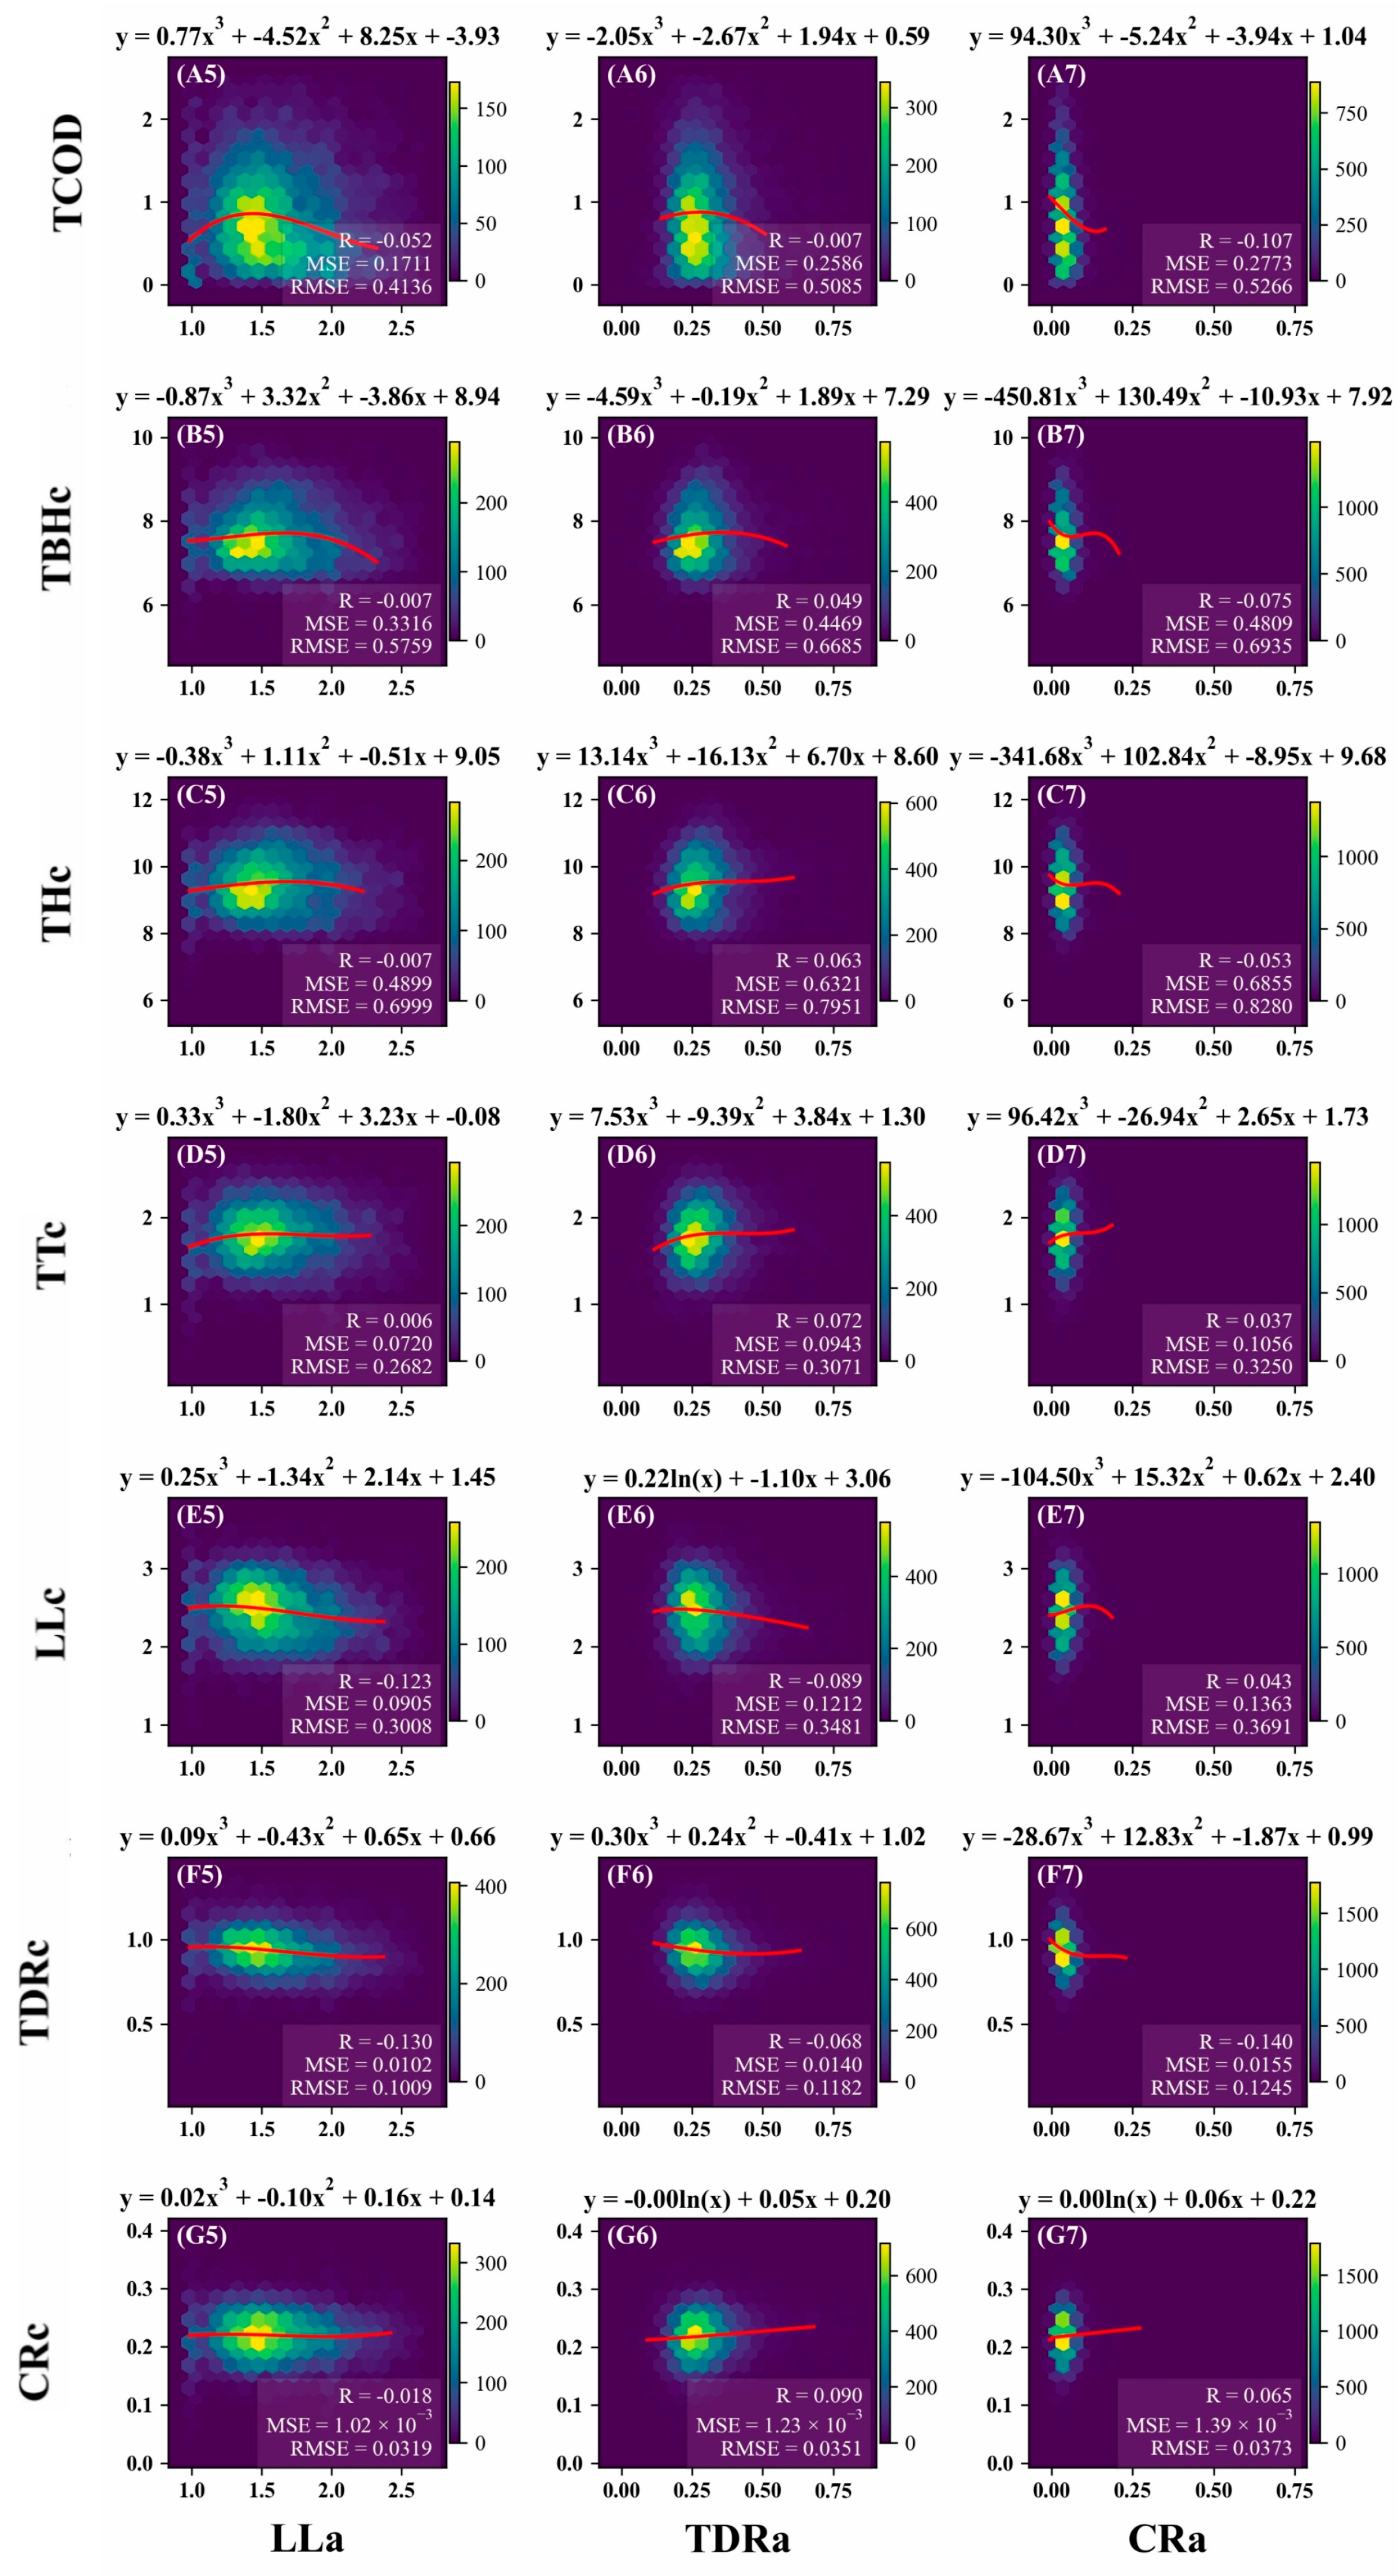
Regression analysis utilized hexagonal density distributions with cloud parameters as vertical axes and aerosol parameters as horizontal axes. Color gradients represent data density (blue: low-density, yellow: high-density), with optimal regression curves (red lines) fitted exclusively to high-density regions (top 40% by density) to minimize outlier effects. Statistical metrics (R, MSE, RMSE) are displayed for each relationship, ensuring robust characterization of dominant physical processes.

3. Results and Discussion

3.1. Seasonal Variation in Optical and Physical Properties of High-Level Clouds in Russian Regions

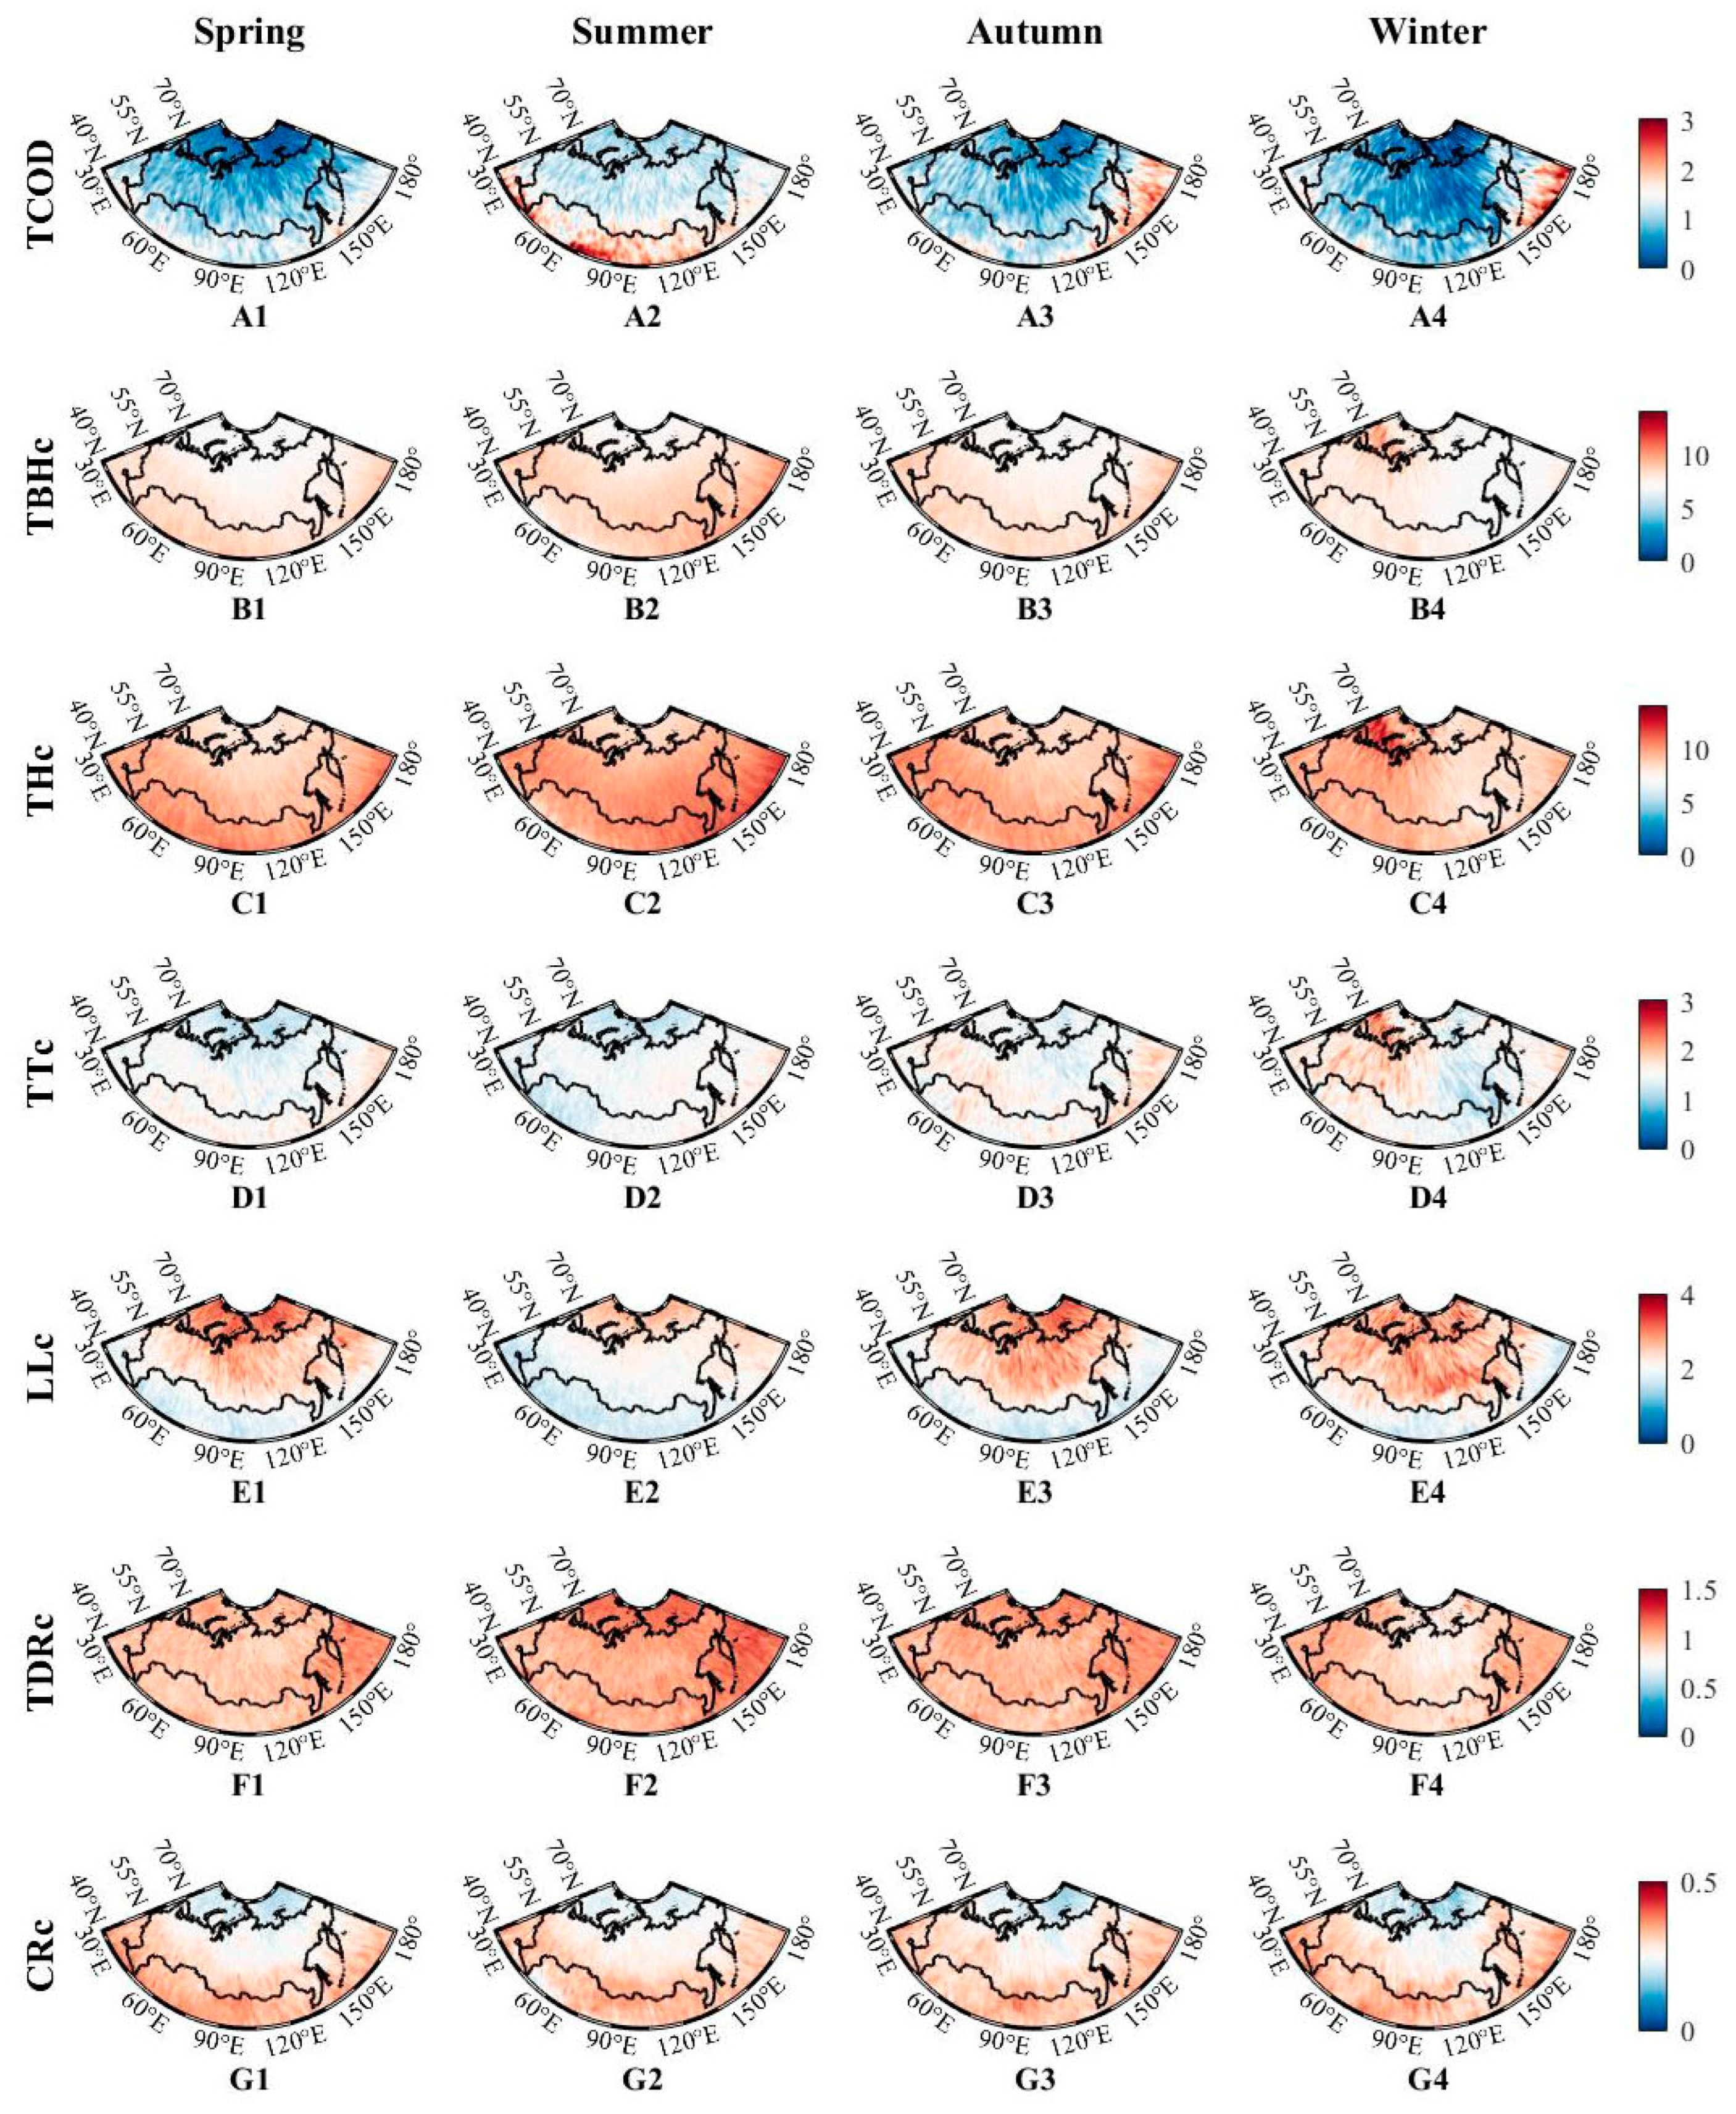
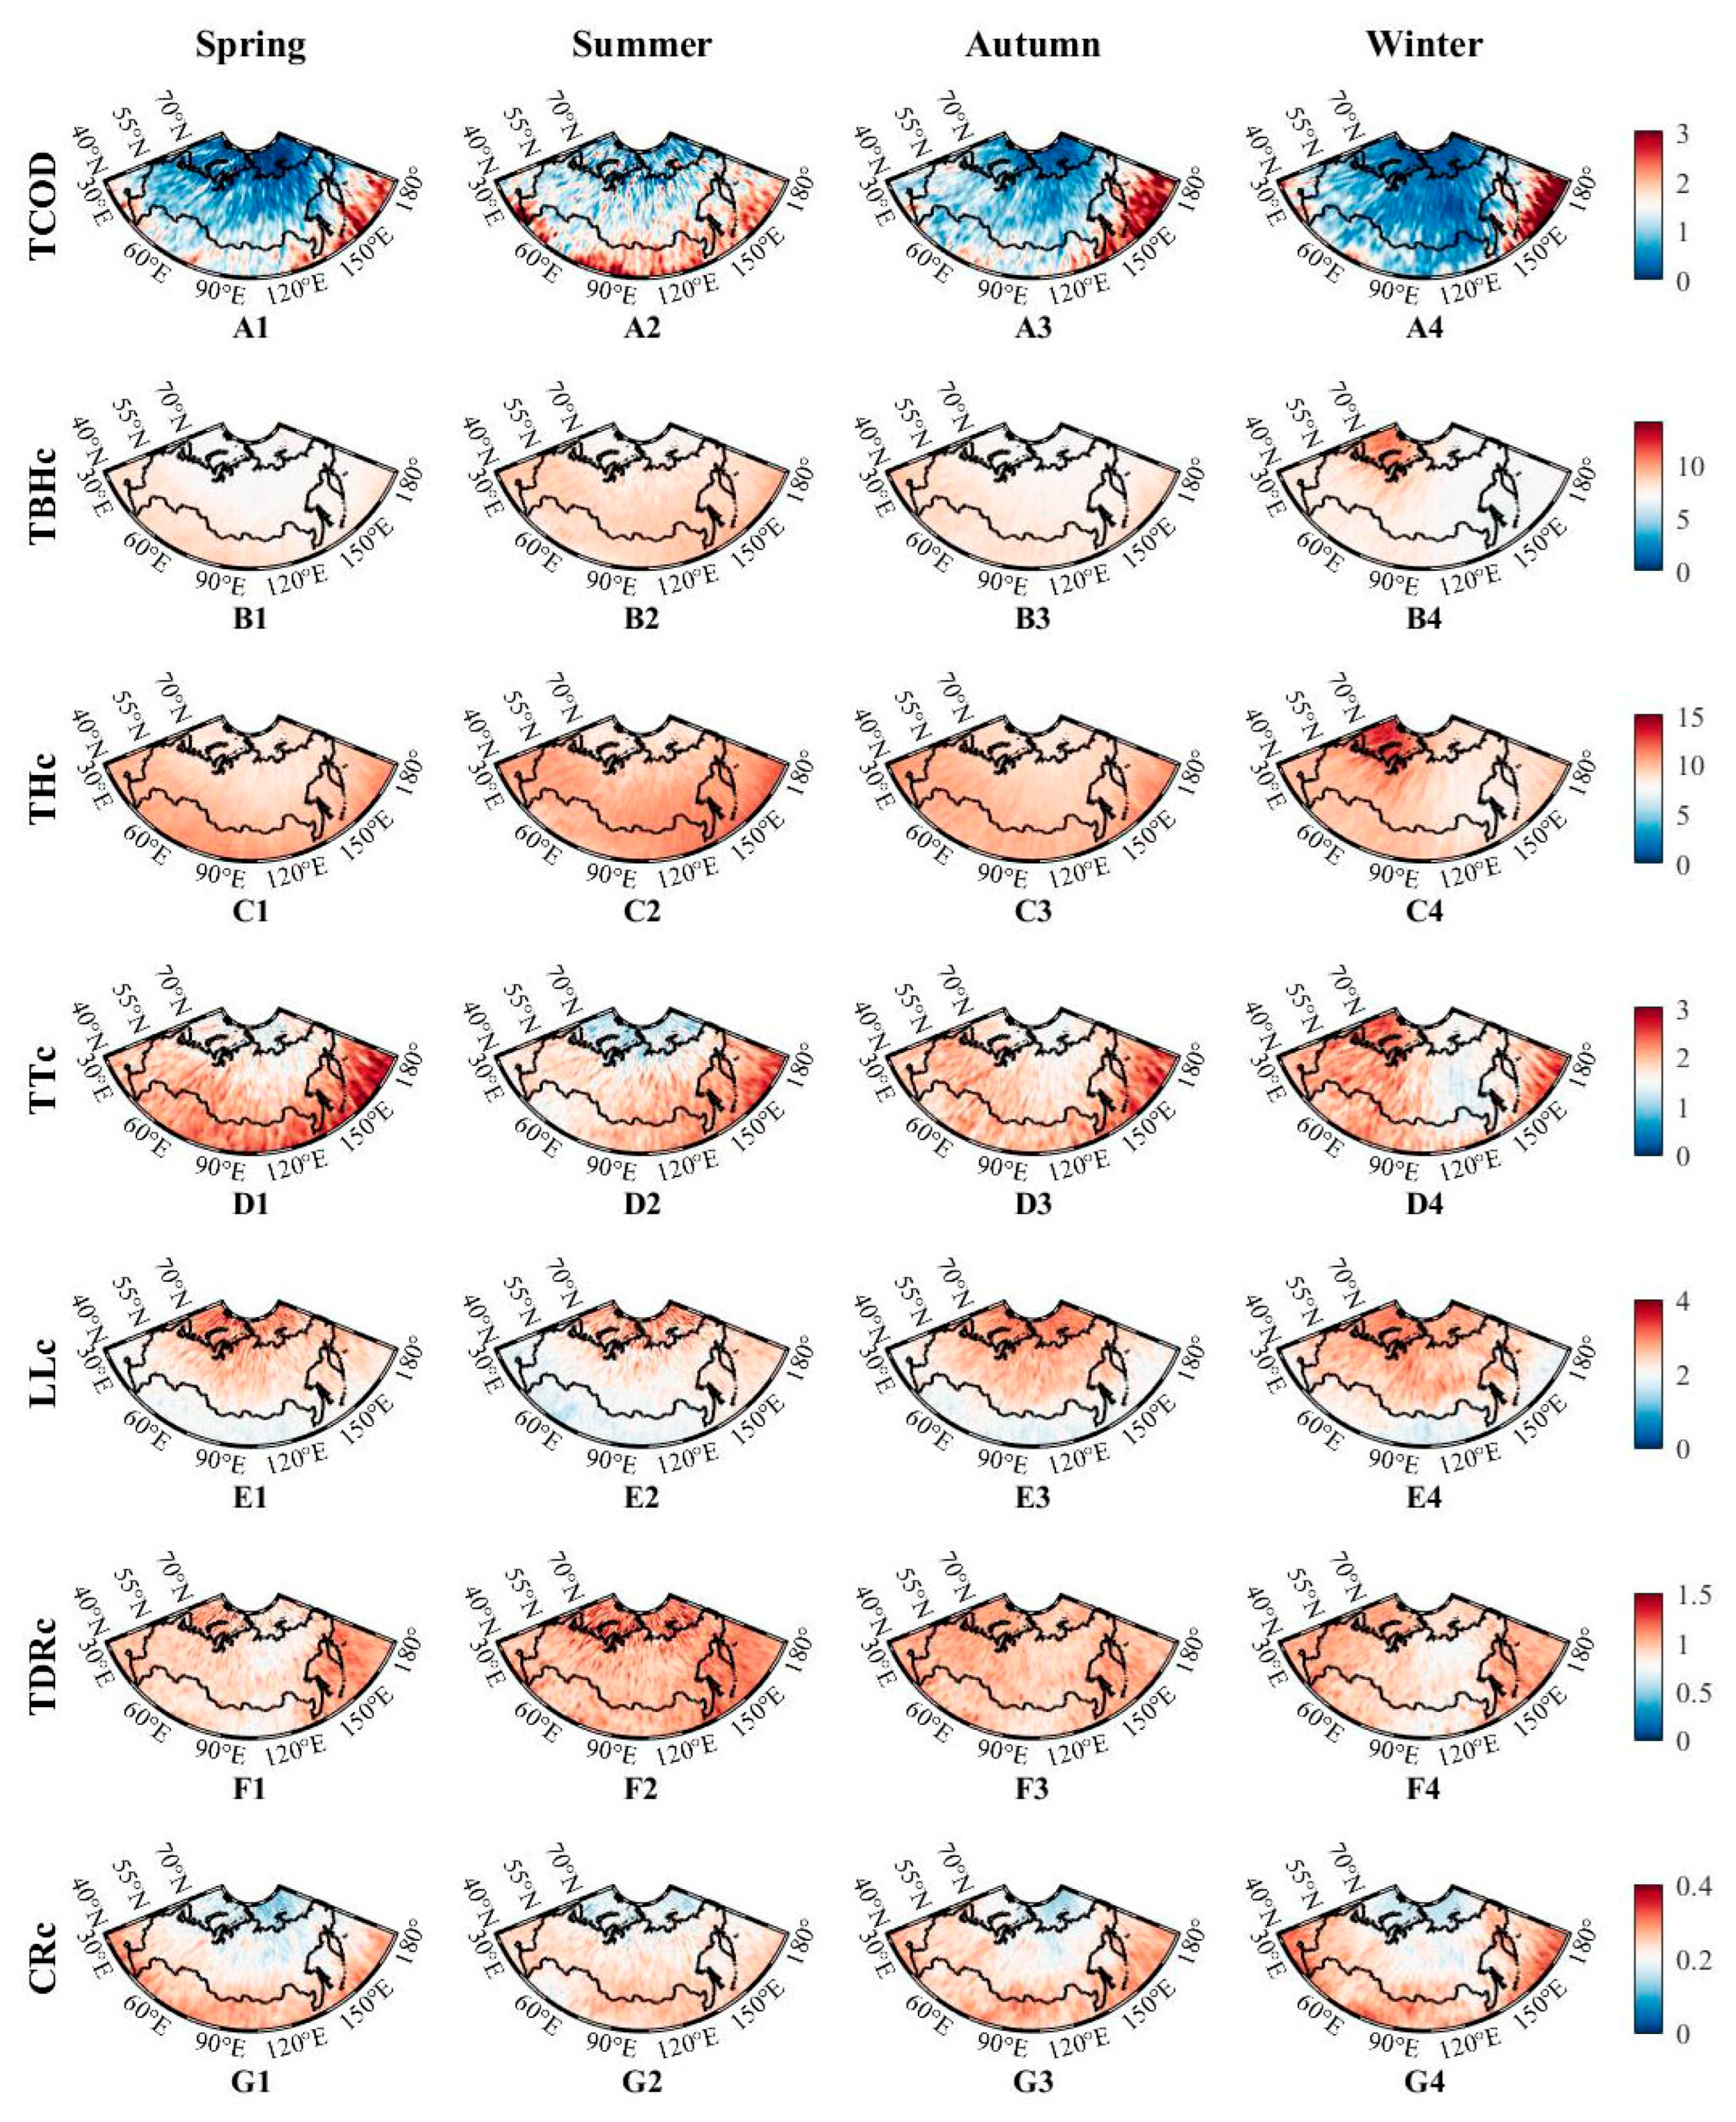
As shown in Figure 2 and Figure 3 (A1–A4), TCOD exhibits pronounced seasonal patterns across Russian regions. Spring maintains consistently low values (<1), while summer represents the annual maximum with TCOD reaching 1–2, particularly in regions C and D, driven by enhanced cyclonic activity and convective uplift. Autumn returns to spring levels (<1) except in western Zone A, and winter shows minimum values approaching zero in zones C and D, indicating thin or absent upper clouds. Notable exceptions occur in the Far East Pacific, where autumn and winter TCOD values reach 2–3 due to Alaskan low-pressure systems enhancing water vapor transport. Arctic coastal regions consistently maintain low values year-round, reflecting stable atmospheric stratification in cold, dry conditions [7,32]. Diurnally, nighttime TCOD values are generally lower than daytime values, except in the Far East Pacific where nighttime values exceed daytime values with expanded spatial coverage.
TBHc and THc distributions (Figure 2 and Figure 3, B1–B4, C1–C4) show annual maxima during summer, with TBHc ranging 8–10 km and THc 10–12 km, forming high-value bands south of the four subregions due to enhanced solar radiation and convective development [33,34]. Winter minima (6–8 km) occur in eastern zones C and D due to suppressed convection and reduced water vapor. Spatial patterns differ seasonally: spring through autumn exhibit northward-decreasing latitudinal gradients, while winter shows longitudinal variations. Western regions (west of 105° E) display elevated winter values (10–12 km) with maxima in the western Arctic Ocean and Barents Sea, attributed to North Atlantic Current influence creating strong air–sea temperature gradients [35]. Eastern regions (east of 105° E) show minimum values (6–8 km) due to mountainous topography and reduced insolation promoting high-pressure systems with prevalent subsidence (Table 2).
TTc shows minimal seasonal variation during daytime, generally ranging 1–2 km except for higher winter values (2–3 km) in eastern regions A and B. Nighttime TTc values increase significantly compared to daytime across most regions, reaching ≥2 km, with pronounced seasonal differences: summer highs occur mainly in regions C and D, while other seasons peak in regions A and B.
LLc exhibits significant seasonal variation (Figure 2 and Figure 3, E1–E4). Winter represents the peak season with values reaching 3–4 in northern regions B and C, likely due to large-scale weather systems generating cirrus and stratocumulus clouds [36]. Summer shows minimum values (1–2) as convective activity concentrates in lower atmospheric layers. Arctic Ocean regions maintain high values (≥2) year-round due to favorable multi-layer cloud formation conditions. Diurnally, nighttime LLc values are generally lower than daytime values, particularly in autumn and winter, reflecting nighttime radiative cooling and atmospheric stabilization. Multi-layer cloud frequency exceeds single-layer frequency across Russia, though overall layer numbers remain relatively low compared to other global regions.
TDRc values are consistently high (0.5–1.2, locally reaching 1.5), indicating substantial non-spherical particle proportions in upper clouds (Figure 2 and Figure 3, F1–F4). Summer exhibits maximum values (>1.0) across most regions due to numerous ice crystals and complex mixed-phase particles. Winter shows significant decreases, especially in northern regions C and D, where values drop to ~0.5, indicating stable ice crystal formations with reduced activity [11,37]. Arctic Ocean regions display summer maxima (1.0–1.5) attributed to sea ice melting, enhanced water vapor exchange, and preferential ice crystal growth in mixed-phase clouds. Nighttime values are generally lower than daytime values except in winter, reflecting combined effects of microphysical processes and radiation conditions.
CRc shows minimal seasonal variation but distinct spatial patterns with higher southern values and lower northern values (Figure 2 and Figure 3, G1–G4). Southern regions approach 0.4, indicating smaller particle sizes likely due to increased aerosol concentrations in populated areas competing for water vapor [8]. Northern regions with sparse aerosols show low values (≤0.2), reflecting larger but fewer ice crystals. Summer exhibits maximum values forming high-value bands across southern Russia. Nighttime CRc values are consistently lower than daytime values, particularly in spring and summer, indicating increased nighttime particle sizes due to enhanced supersaturation and diffusive growth on ice crystal surfaces [38].

3.2. Seasonal Variation in Optical and Physical Properties of Upper Aerosol Layers in Russian Regions

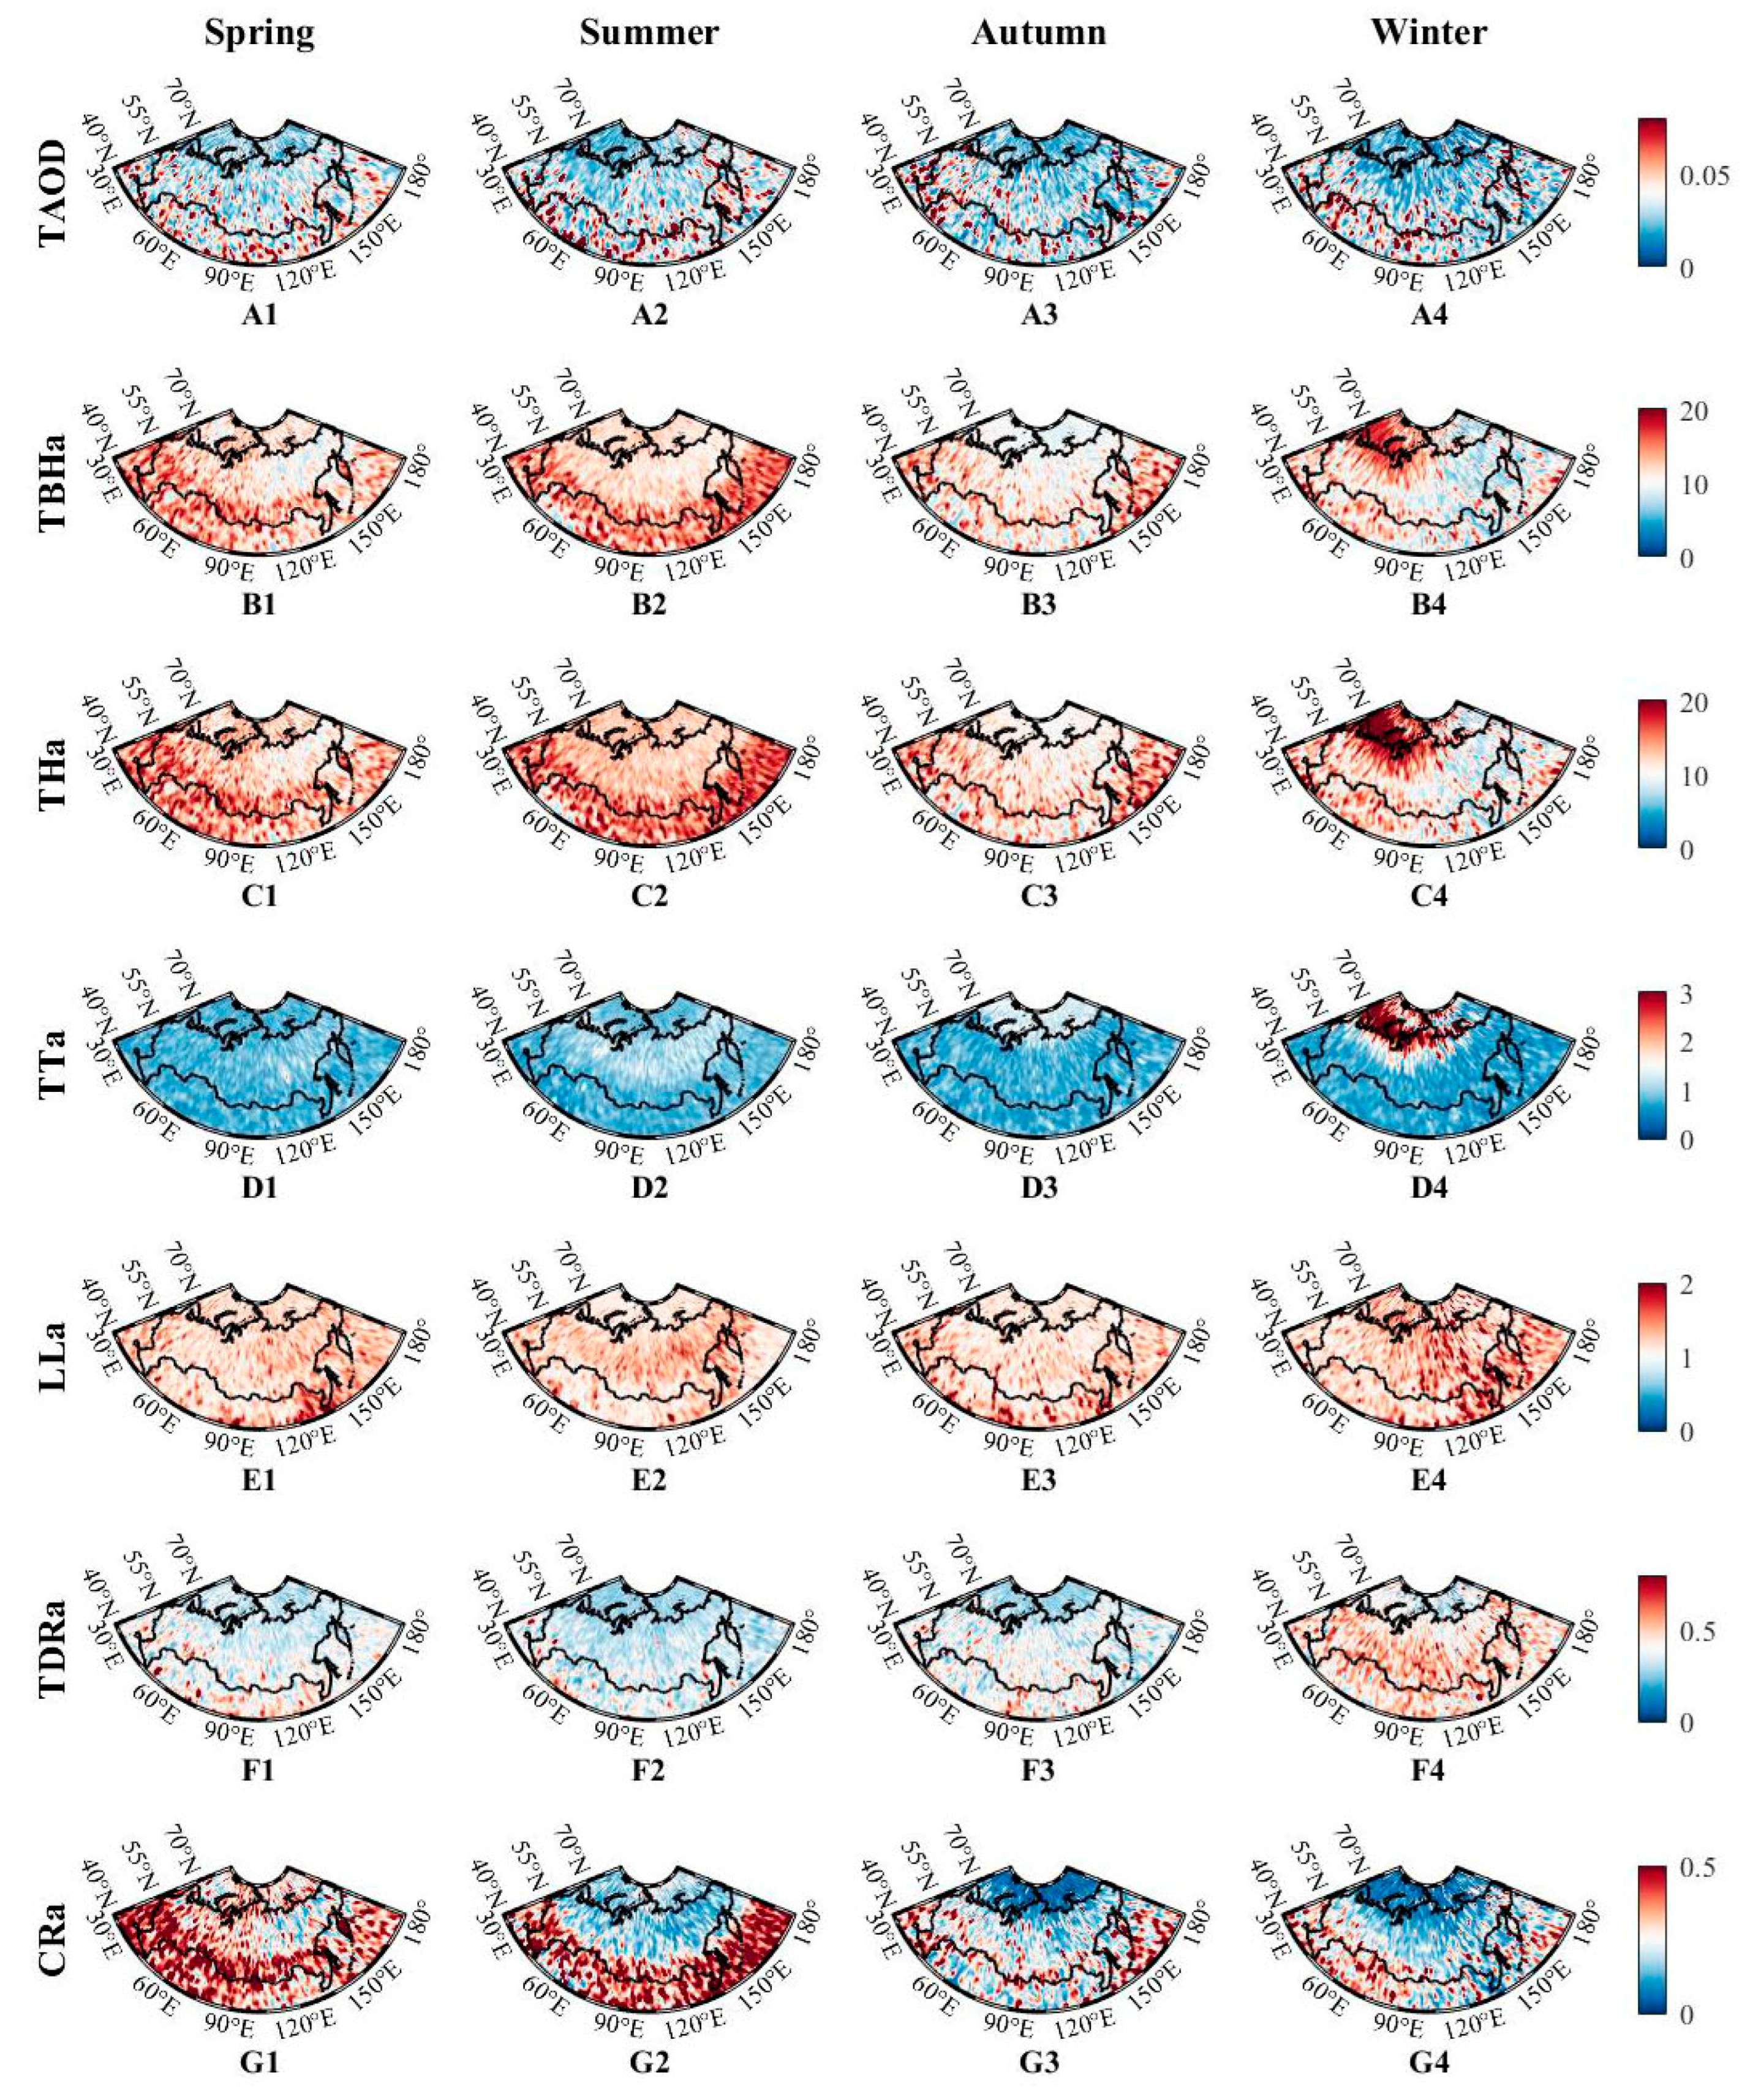
TAOD seasonal variations are minimal across Russian regions (Figure 4 and Figure 5, A1–A4), with most areas showing consistently low values (0–0.05). Winter daytime exhibits relatively higher concentrations in southern zones C and southwestern zone D (TAOD ~0.1), likely due to enhanced solar radiation promoting convective transport of surface aerosols to upper levels [39]. These elevated values disappear at night when weakened convection concentrates aerosols in lower layers. Spring shows scattered high TAOD points in regions A and B, potentially related to long-distance dust transport from Mongolia and Kazakhstan during the severe dust storm season [12]. Summer maintains similar patterns with slight increases due to forest fires and crop burning [40].
TBHa and THa form high-value bands along Russia’s southern borders during spring and summer, reaching 18–20 km in some areas (Figure 4 and Figure 5, B1–B4, C1–C4). Summer represents annual maxima due to crop burning, forest fires, and extended daylight maintaining elevated values [41]. Winter shows minimum values (0–10 km) except in northeastern region A and northwestern region B, where values reach 20 km due to reduced sea-ice cover and strong uplift from coastal currents. Dramatic diurnal differences occur across all seasons, with nighttime values dropping significantly: spring and autumn show near-zero values (0–10 km) across most regions, while summer exhibits slight increases with expanded medium-value ranges.
LLa exhibits significant seasonal and diurnal variations (Figure 4 and Figure 5, E1–E4). Spring shows medium values (1–2) with widest distributions in eastern region C and western region D. Summer increases occur particularly in region D, likely related to forest fires creating multi-layer aerosol structures through wind shear effects [42]. Winter displays maximum values with widespread high concentrations in zones C and D (LLa ~2), possibly due to long-distance transport by westerly jets and Arctic haze influences [43]. Nighttime values are consistently lower than daytime across seasons, with winter showing the most pronounced decreases. Overall, LLa values exceed 1 throughout Russian regions, indicating predominantly multi-layer aerosol structures (Table 3).
TDRa shows pronounced seasonal patterns with winter maxima and summer minima (Figure 4 and Figure 5, F1–F4). Summer displays widespread low values (<0.5) due to high temperatures and biomass aerosols from Siberian wildfires, combined with spherical sea-salt aerosols from melting ice [13,44,45]. Winter exhibits higher values (≥0.5) across central and southern zones A–D, indicating dominance of irregular non-spherical particles. Spring and winter show elevated nighttime values in southern regions A and B, likely attributed to increased dust storm activity transporting irregularly shaped particles to upper levels [40]. Arctic Ocean regions consistently show lower values (0–0.4) year-round.
CRa displays clear seasonal patterns with high-value bands along Russia’s southern borders during spring and summer (Figure 4 and Figure 5, G1–G4). Spring shows maximum values (>0.5) extending from southwestern region A to southern region D, attributed to fine anthropogenic aerosols and selective deposition during long-distance transport [43]. Summer maintains high southern values but with narrowed spatial extent. Autumn and winter show progressive decreases, with winter displaying only scattered high-value points in southern areas. Dramatic diurnal differences occur, with nighttime values significantly lower (maximum ~0.1) due to ice crystal growth on coarse particles during cold nights, increasing particle sizes and decreasing CRa values.

3.3. Upper Cloud-Aerosol Layer Correlation Analysis

Aerosols significantly influence cloud microphysical and radiative properties through complex interaction mechanisms involving ice nucleation, radiative forcing, and thermodynamic modifications. We analyzed correlation matrices for daytime and nighttime upper cloud and aerosol layer parameters over Russia to understand these interactions (Figure 6, Figure 7, Figure 8 and Figure 9).

3.3.1. Cloud-Aerosol Parameter Correlation Models

We conducted multidimensional correlation analysis evaluating correlation coefficients (R), mean square error (MSE), root mean square error (RMSE), and physical interpretations across multiple parameter pairs.
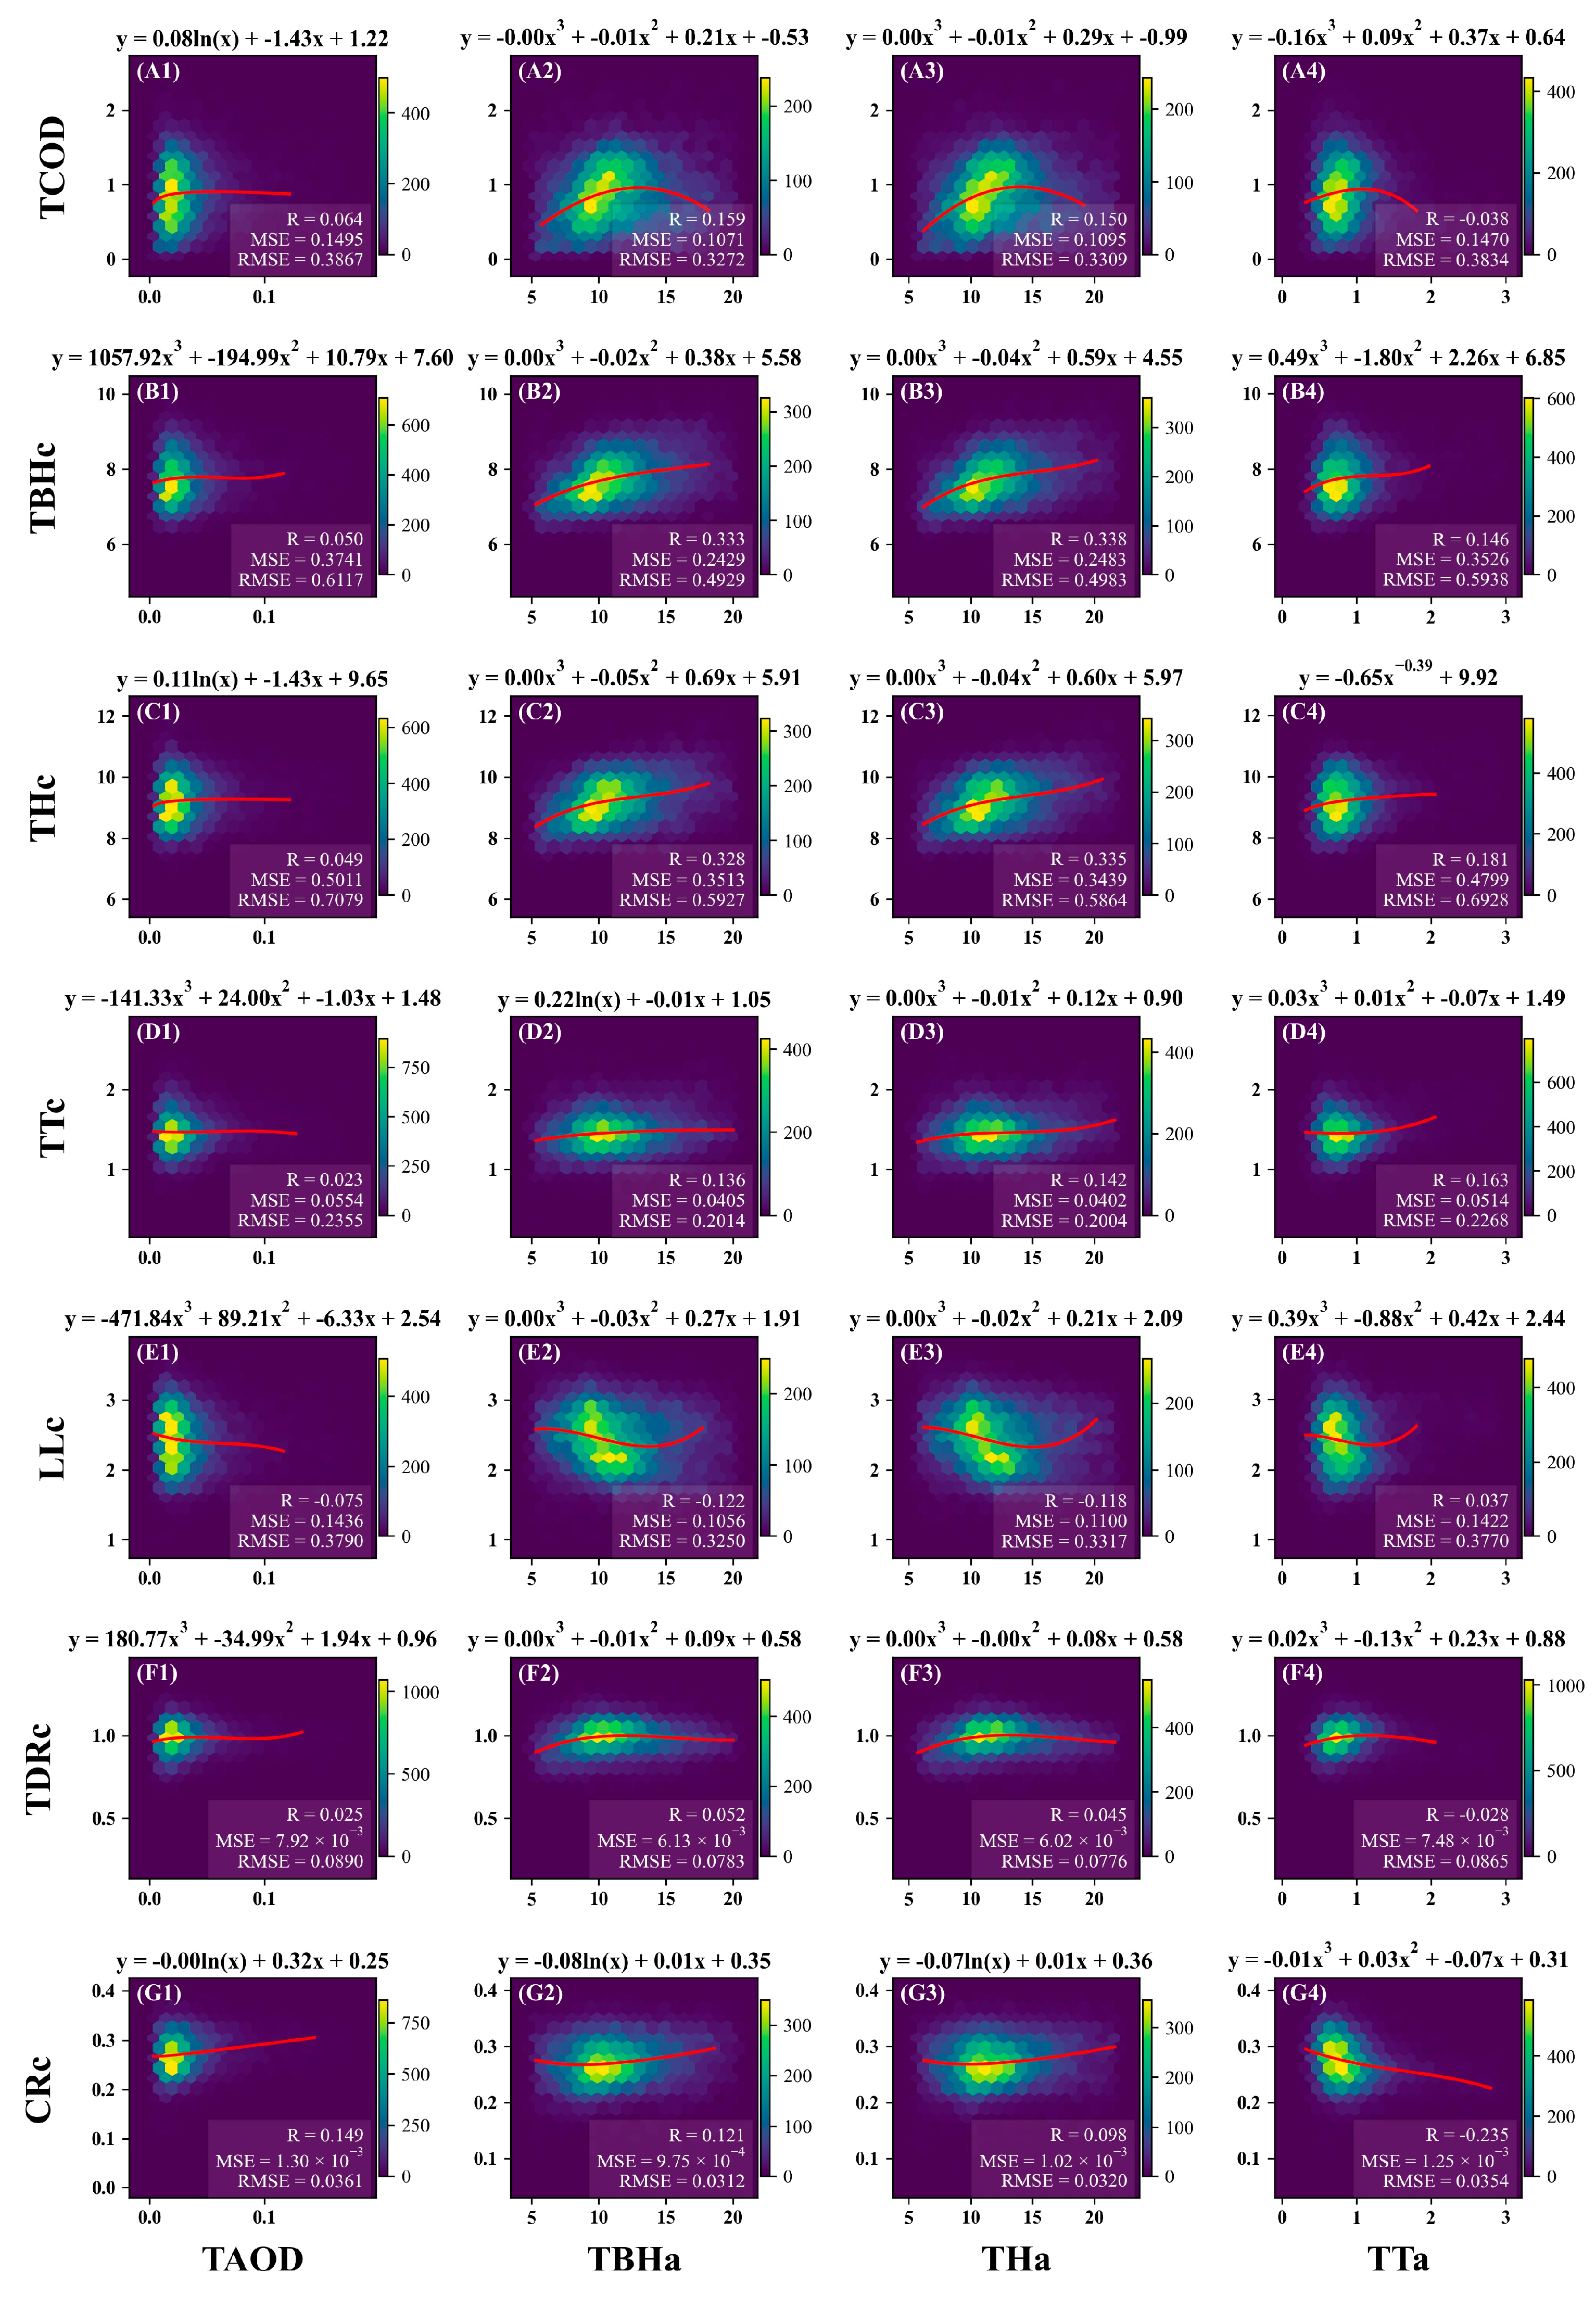
Height parameter correlations (TBHc, THc vs. TBHa, THa) demonstrated moderately strong relationships, with correlation coefficients ranging from 0.33 to 0.59. Nighttime correlations consistently exceeded daytime values, with improvements from 0.33 to 0.34 to 0.53–0.59. Hexagonal density distributions reveal pronounced high-density clustering in the 8–12 km altitude range, with regression curves accurately traversing these regions. This indicates synergistic vertical positioning between upper clouds and aerosol layers, likely driven by combined effects of atmospheric circulation patterns, temperature stratification, and vertical transport processes [46]. The relatively small MSE and RMSE values (e.g., nighttime THc-THa: MSE = 0.43, RMSE = 0.66) confirm high accuracy of established nonlinear regression models.
Optical parameter correlations (TCOD-TAOD) exhibited consistently weak relationships (R = 0.064 daytime, 0.084 nighttime) with correspondingly poor fitting quality, indicating that statistical correlation does not always align with regression performance [47]. Hexagonal density profiles show highly dispersed data distributions lacking obvious aggregation features, suggesting that upper cloud and aerosol layer optical properties are governed by distinct radiative transfer mechanisms and microphysical processes. Data concentration in low-value regions (TAOD < 0.05, TCOD < 0.5) reflects the predominance of thin layers characteristic of high-latitude atmospheric conditions.
Depolarization ratio relationships revealed unique statistical properties. The TDRc parameter demonstrated exceptional behavior: despite low correlations with various aerosol parameters (R typically < 0.2), it achieved excellent regression fit quality with RMSE values consistently below 0.13. This paradoxical relationship suggests that systematic, nonlinear dependencies exist between aerosol properties and ice crystal orientation, possibly through radiative heating effects that modify intra-cloud thermodynamic environments [48]. Most TDRc relationships follow cubic polynomial or power function forms, accurately capturing complex data distribution characteristics across different parameter ranges.
Diurnal variations significantly influenced correlation strength and fitting accuracy. Nighttime data consistently exhibited stronger parameter correlations and reduced fitting errors compared to daytime observations. This enhancement results from three primary factors: (1) elimination of solar background noise improving signal-to-noise ratios in CALIPSO measurements [49], (2) enhanced atmospheric stratification stability reducing turbulent mixing effects [10], and (3) intensified surface radiative cooling strengthening boundary layer processes that influence aerosol-cloud interactions [1]. These diurnal differences provide crucial insights into time-dependent cloud-aerosol interaction mechanisms.
Nonlinear relationships dominated virtually all parameter interactions, extending beyond simple linear absence to exhibit complex, interval-specific variation patterns. Fitted curves predominantly follow cubic polynomial or power function forms, with distinct mathematical expressions for daytime and nighttime conditions. For example, the LLc-TAOD relationship exhibits markedly different cubic fits: daytime (y = −471.84x3 + 89.21x2 − 6.33x + 2.54) versus nighttime (y = 2624.67x3 − 274.28x2 + 3.28x + 2.47), reflecting the complex interplay of multiple physical mechanisms and feedback pathways [50].

3.3.2. Representative Parameter Relationship Analysis

Based on statistical significance, regression quality, and physical interpretability, we selected key parameter pairs for detailed analysis (Table 4).
THc-THa relationship demonstrates positive correlation with pronounced strengthening from daytime (R = 0.335) to nighttime (R = 0.527). Hexagonal density analysis reveals three distinct altitude regimes in the cubic fitting relationship: (1) below 8 km, slow THc growth due to strong lower-atmospheric turbulent mixing, (2) within 8–12 km, rapid growth facilitated by stable atmospheric stratification that promotes aerosol transport and enhances ice cloud interactions, and (3) above 12 km, growth deceleration due to limited water vapor availability and restricted upward motion [51,52]. High statistical fit quality (RMSE = 0.66) indicates that nonlinear models effectively capture variability within high-density regions.
Despite minimal correlation coefficients (R = 0.025), the TDRc-TAOD relationship exhibits exceptional regression fit quality (RMSE = 0.089), representing the most precise statistical relationship among all parameter pairs. Cubic polynomial fitting reveals a systematic three-phase pattern: acceleration for TAOD < 0.02, stabilization during 0.02–0.05, and renewed growth above 0.05. This precise relationship suggests that aerosol optical properties systematically influence ice crystal morphology and orientation distributions through complex radiative forcing processes that modify intra-cloud thermodynamic environments [53,54].
TDRc-TDRa relationship has moderate negative correlation (daytime R = −0.177) with excellent fit quality (RMSE = 0.083), which reveals threshold-dependent morphological coupling. Cubic polynomial analysis identifies three regimes: positive correlation for TDRa < 0.3 (direct morphological influence), saturation plateau at 0.3–0.5 (mechanism saturation), and slight negative correlation above 0.5 (secondary effects from altered ice nucleation activity). This non-monotonic behavior indicates complex threshold dependencies in aerosol-cloud microphysical interactions [55].
TDRc-TTa relationship has low correlation (R = 0.028) contrasts with high fit quality (RMSE = 0.087), suggesting systematic but complex dependencies. The relationship indicates that moderate aerosol layer thickness (TTa ≈ 1.5 km) optimally promotes non-spherical ice crystal growth through heterogeneous nucleation and radiative flux regulation, while excessive thickness may compromise atmospheric stability and vertical mixing, subsequently affecting ice crystal growth environments [56].
TBHc-TBHa relationship has strong altitude-dependent correlation (R = 0.333–0.587) with quadratic-to-cubic fitting characteristics, which demonstrates how atmospheric vertical structure influences both cloud and aerosol formation. The upward convex relationship indicates monotonically decreasing correlation with altitude, reflecting how suitable low-altitude temperature and pressure conditions maintain coupled formation mechanisms, while increasing altitude leads to differentiated influence mechanisms and weakened correlations [51].
Despite poor statistical performance (R < 0.1, RMSE ≈ 0.4–0.5), this TCOD-TAOD relationship provides important climatological insights. The high concentration of data in low optical depth regions, with sharp density decreases for TAOD > 0.05, reveals the regional characteristic absence of thick aerosol layers at Russian high latitudes. This distribution pattern closely relates to regional climatic conditions and atmospheric circulation patterns [57].
These analyses demonstrate that cloud-aerosol interactions involve complex, altitude-dependent, and time-varying nonlinear mechanisms that require sophisticated parameterization approaches in atmospheric models. The identification of threshold effects, saturation phenomena, and regime-dependent behaviors provide crucial insights for improving climate model representations of aerosol-cloud interactions.

4. Conclusions

Based on 16-year CALIPSO satellite observations (2006–2021), this study analyzed high-altitude cloud and aerosol properties across Russian regions, revealing four key findings:
(1)
Seasonal cloud patterns: Summer convection produces thick clouds (TCOD: 1–2, TTc: 1–2 km, THc: 8–15 km), while winter shows thin/absent layers (TCOD < 1) with regular ice crystals. Nighttime cooling enhances cloud stability.
(2)
Complex aerosol structures: Despite low optical depth (TAOD < 0.05), multi-layered aerosols extend to 16–18 km from dust transport and biomass burning, with simpler nighttime distributions.
(3)
Cloud-aerosol coupling: Height correlations are moderate (nighttime R = 0.527–0.587), while optical relationships show weak linear but strong nonlinear correlations (MSE < 0.02).
(4)
Nonlinear dominance: Cubic and power models outperform linear fits, revealing threshold and saturation effects that require sophisticated parameterizations in climate models. Nighttime conditions optimize aerosol-cloud interaction quantification.

Author Contributions

Conceptualization, M.Z. and Z.S.; methodology, Z.L. (Zixin Luo); software, Y.Z.; validation, Z.L. (Zhibiao Liu); formal analysis, G.H.; investigation, T.C.; resources, G.H.; data curation, M.Z.; writing—original draft preparation, Y.Z.; writing—review and editing, M.Z.; visualization, Y.L.; supervision, Z.L. (Zixin Luo); project administration, M.Z.; funding acquisition, M.Z. All authors have read and agreed to the published version of the manuscript.

Funding

This research was funded by the Program for Science & Technology Innovation Talents in Universities of Henan Province of China (No. 24HASTIT018), the Natural Science Foundation of Henan Province of China (No. 242300421369), the Program of Undergraduate Universities Young Backbone Teacher Training of Henan Province of China (No. 2024GGJS104), the National Key R&D Program of China (No. 2024YFB3910203), National Natural Science Foundation of China (No. 42475144).

Data Availability Statement

Data are contained within the article.

Acknowledgments

Thanks to NASA for providing the research data, and also thanks to editors and reviewers for their hard work.

Conflicts of Interest

The authors declare no conflicts of interest.

References

  1. Dagan, G.; Yeheskel, N.; Williams, A.I. Radiative forcing from aerosol–cloud interactions enhanced by large-scale circulation adjustments. Nat. Geosci. 2023, 16, 1092–1098. [Google Scholar] [CrossRef]
  2. Fan, J.; Rosenfeld, D.; Zhang, Y.; Giangrande, S.E.; Li, Z.; Machado, L.A.; Martin, S.T.; Yang, Y.; Wang, J.; Artaxo, P. Substantial convection and precipitation enhancements by ultrafine aerosol particles. Science 2018, 359, 411–418. [Google Scholar] [CrossRef]
  3. Li, Z.; Niu, F.; Fan, J.; Liu, Y.; Rosenfeld, D.; Ding, Y. Long-term impacts of aerosols on the vertical development of clouds and precipitation. Nat. Geosci. 2011, 4, 888–894. [Google Scholar] [CrossRef]
  4. Rosenfeld, D.; Sherwood, S.; Wood, R.; Donner, L. Climate effects of aerosol-cloud interactions. Science 2014, 343, 379–380. [Google Scholar] [CrossRef]
  5. Virtanen, A.; Joutsensaari, J.; Kokkola, H.; Partridge, D.G.; Blichner, S.; Seland, Ø.; Holopainen, E.; Tovazzi, E.; Lipponen, A.; Mikkonen, S. High sensitivity of cloud formation to aerosol changes. Nat. Geosci. 2025, 18, 289–295. [Google Scholar] [CrossRef]
  6. Erlanger, E.; Bufe, A.; Paris, G.; D’Angeli, I.; Pisani, L.; Kemeny, P.C.; Stammeier, J.; Haghipour, N.; Hovius, N. Deep CO2 release and the carbon budget of the central Apennines modulated by geodynamics. Nat. Geosci. 2024, 17, 465–471. [Google Scholar] [CrossRef] [PubMed]
  7. Roeckner, E.; Schlese, U.; Biercamp, J.; Loewe, P. Cloud optical depth feedbacks and climate modelling. Nature 1987, 329, 138–140. [Google Scholar] [CrossRef]
  8. Rosenfeld, D.; Zhu, Y.; Wang, M.; Zheng, Y.; Goren, T.; Yu, S. Aerosol-driven droplet concentrations dominate coverage and water of oceanic low-level clouds. Science 2019, 363, eaav0566. [Google Scholar] [CrossRef] [PubMed]
  9. Wang, N.; Zhang, K.; Shen, X.; Wang, Y.; Li, J.; Li, C.; Mao, J.; Malinka, A.; Zhao, C.; Russell, L.M. Dual-field-of-view high-spectral-resolution lidar: Simultaneous profiling of aerosol and water cloud to study aerosol–cloud interaction. Proc. Natl. Acad. Sci. USA 2022, 119, e2110756119. [Google Scholar] [CrossRef]
  10. Su, T.; Li, Z.; Henao, N.R.; Luan, Q.; Yu, F. Constraining effects of aerosol-cloud interaction by accounting for coupling between cloud and land surface. Sci. Adv. 2024, 10, eadl5044. [Google Scholar] [CrossRef]
  11. Morrison, H.; De Boer, G.; Feingold, G.; Harrington, J.; Shupe, M.D.; Sulia, K. Resilience of persistent Arctic mixed-phase clouds. Nat. Geosci. 2012, 5, 11–17. [Google Scholar] [CrossRef]
  12. Uno, I.; Eguchi, K.; Yumimoto, K.; Takemura, T.; Shimizu, A.; Uematsu, M.; Liu, Z.; Wang, Z.; Hara, Y.; Sugimoto, N. Asian dust transported one full circuit around the globe. Nat. Geosci. 2009, 2, 557–560. [Google Scholar] [CrossRef]
  13. O’Dowd, C.D.; Facchini, M.C.; Cavalli, F.; Ceburnis, D.; Mircea, M.; Decesari, S.; Fuzzi, S.; Yoon, Y.J.; Putaud, J.-P. Biogenically driven organic contribution to marine aerosol. Nature 2004, 431, 676–680. [Google Scholar] [CrossRef]
  14. Han, G.; Huang, Y.; Shi, T.; Zhang, H.; Li, S.; Zhang, H.; Chen, W.; Liu, J.; Gong, W. Quantifying CO2 emissions of power plants with Aerosols and Carbon Dioxide Lidar onboard DQ-1. Remote Sens. Environ. 2024, 313, 114368. [Google Scholar] [CrossRef]
  15. Han, G.; Zhang, H.; Huang, Y.; Chen, W.; Mao, H.; Zhang, X.; Ma, X.; Li, S.; Zhang, H.; Liu, J. First global XCO2 observations fromspaceborne lidar: Methodology and initial result. Remote Sens. Environ. 2025, 330, 114954. [Google Scholar] [CrossRef]
  16. Lefebvre, A.; Hélière, A.; Wallace, K.; Nakatsuka, H.; Tomita, E. The ESA EarthCARE mission development status. In Proceedings of the 2017 IEEE International Geoscience and Remote Sensing Symposium (IGARSS), Fort Worth, TX, USA, 23–28 July 2017; pp. 4234–4237. [Google Scholar]
  17. Sawamura, P.; Moore, R.H.; Burton, S.P.; Chemyakin, E.; Müller, D.; Kolgotin, A.; Ferrare, R.A.; Hostetler, C.A.; Ziemba, L.D.; Beyersdorf, A.J. HSRL-2 aerosol optical measurements and microphysical retrievals vs. airborne in situ measurements during DISCOVER-AQ 2013: An intercomparison study. Atmos. Chem. Phys. 2017, 17, 7229–7243. [Google Scholar] [CrossRef]
  18. Fang, J.; Huang, K.; Du, M.; Zhang, Z.; Cao, R.; Yi, F. Investigation on cloud vertical structures based on Ka-band cloud radar observations at Wuhan in Central China. Atmos. Res. 2023, 281, 106492. [Google Scholar] [CrossRef]
  19. Jimenez, C.; Ansmann, A.; Engelmann, R.; Donovan, D.; Malinka, A.; Seifert, P.; Wiesen, R.; Radenz, M.; Yin, Z.; Bühl, J. The dual-field-of-view polarization lidar technique: A new concept in monitoring aerosol effects in liquid-water clouds—Case studies. Atmos. Chem. Phys. 2020, 20, 15265–15284. [Google Scholar] [CrossRef]
  20. Yang, Y.; Zhao, C.; Wang, Q.; Cong, Z.; Yang, X.; Fan, H. Aerosol characteristics at the three poles of the Earth as characterized by Cloud–Aerosol Lidar and Infrared Pathfinder Satellite Observations. Atmos. Chem. Phys. 2021, 21, 4849–4868. [Google Scholar] [CrossRef]
  21. Bulygina, O.; Razuvaev, V.; Korshunova, N.; Groisman, P.Y. Climate variations and changes in extreme climate events in Russia. Environ. Res. Lett. 2007, 2, 045020. [Google Scholar] [CrossRef]
  22. Hugelius, G.; Bockheim, J.G.; Camill, P.; Elberling, B.; Grosse, G.; Harden, J.W.; Johnson, K.; Jorgenson, T.; Koven, C.; Kuhry, P. A new data set for estimating organic carbon storage to 3 m depth in soils of the northern circumpolar permafrost region. Earth Syst. Sci. Data 2013, 5, 393–402. [Google Scholar] [CrossRef]
  23. Ruane, A.C. Synthesis Report of the IPCC Sixth Assessment Report (AR6); NASA: Washington, DC, USA, 2024.
  24. Sharmina, M.; Anderson, K.; Bows-Larkin, A. Climate change regional review: Russia. Wiley Interdiscip. Rev. Clim. Change 2013, 4, 373–396. [Google Scholar] [CrossRef]
  25. Winker, D.M.; Pelon, J.R.; McCormick, M.P. CALIPSO mission: Spaceborne lidar for observation of aerosols and clouds. In Proceedings of the Lidar Remote Sensing for Industry and Environment Monitoring III, Hangzhou, China, 24–25 October 2002; pp. 1–11. [Google Scholar]
  26. Poliukhov, A.; Zhdanova, E.Y.; Chubarova, N.Y. Long-term variations of aerosol optical depth according to satellite data and its effects on radiation and temperature in the Moscow megacity. Atmos. Res. 2024, 304, 107398. [Google Scholar] [CrossRef]
  27. Winker, D.M.; Vaughan, M.A.; Omar, A.; Hu, Y.; Powell, K.A.; Liu, Z.; Hunt, W.H.; Young, S.A. Overview of the CALIPSO mission and CALIOP data processing algorithms. J. Atmos. Ocean. Technol. 2009, 26, 2310–2323. [Google Scholar] [CrossRef]
  28. Garnier, A.; Tackett, J.; Lambeth, J.; Powell, K. Extinction and optical depth retrievals for CALIPSO’s version 4 data release. Atmos. Meas. Tech. 2018, 11, 5701–5727. [Google Scholar]
  29. King, M.D. Determination of the scaled optical thickness of clouds from reflected solar radiation measurements. J. Atmos. Sci. 1987, 44, 1734–1751. [Google Scholar] [CrossRef]
  30. Nakajima, T.; King, M.D. Determination of the optical thickness and effective particle radius of clouds from reflected solar radiation measurements. Part I: Theory. J. Atmos. Sci. 1990, 47, 1878–1893. [Google Scholar] [CrossRef]
  31. Schotland, R.M.; Sassen, K.; Stone, R. Observations by lidar of linear depolarization ratios for hydrometeors. J. Appl. Meteorol. Climatol. 1971, 10, 1011–1017. [Google Scholar] [CrossRef]
  32. Tselioudis, G.; Rossow, W.B.; Rind, D. Global patterns of cloud optical thickness variation with temperature. J. Clim. 1992, 5, 1484–1495. [Google Scholar] [CrossRef]
  33. Pal, S.R.; Steinbrecht, W.; Carswell, A.I. Automated method for lidar determination of cloud-base height and vertical extent. Appl. Opt. 1992, 31, 1488–1494. [Google Scholar] [CrossRef]
  34. Sun, B.; Groisman, P.Y.; Bradley, R.S.; Keimig, F.T. Temporal changes in the observed relationship between cloud cover and surface air temperature. J. Clim. 2000, 13, 4341–4357. [Google Scholar] [CrossRef]
  35. Vavrus, S.; Holland, M.M.; Bailey, D.A. Changes in Arctic clouds during intervals of rapid sea ice loss. Clim. Dyn. 2011, 36, 1475–1489. [Google Scholar] [CrossRef]
  36. Wernli, H.; Davies, H.C. A Lagrangian-based analysis of extratropical cyclones. I: The method and some applications. Q. J. R. Meteorol. Soc. 1997, 123, 467–489. [Google Scholar] [CrossRef]
  37. Bailey, M.; Hallett, J. Growth rates and habits of ice crystals between −20° and −70 °C. J. Atmos. Sci. 2004, 61, 514–544. [Google Scholar] [CrossRef]
  38. Rosenfeld, D.; Gutman, G. Retrieving microphysical properties near the tops of potential rain clouds by multispectral analysis of AVHRR data. Atmos. Res. 1994, 34, 259–283. [Google Scholar] [CrossRef]
  39. Garratt, J.R. The atmospheric boundary layer. Earth-Sci. Rev. 1994, 37, 89–134. [Google Scholar] [CrossRef]
  40. Huang, J.; Wang, T.; Wang, W.; Li, Z.; Yan, H. Climate effects of dust aerosols over East Asian arid and semiarid regions. J. Geophys. Res. Atmos. 2014, 119, 11398–11416. [Google Scholar] [CrossRef]
  41. Zhuravleva, T.B.; Kabanov, D.M.; Nasrtdinov, I.M.; Russkova, T.V.; Sakerin, S.M.; Smirnov, A.; Holben, B.N. Radiative characteristics of aerosol during extreme fire event over Siberia in summer 2012. Atmos. Meas. Tech. 2017, 10, 179–198. [Google Scholar] [CrossRef]
  42. Witte, J.; Douglass, A.; Da Silva, A.; Torres, O.; Levy, R.; Duncan, B. NASA A-Train and Terra observations of the 2010 Russian wildfires. Atmos. Chem. Phys. 2011, 11, 9287–9301. [Google Scholar] [CrossRef]
  43. Stohl, A.; Klimont, Z.; Eckhardt, S.; Kupiainen, K.; Shevchenko, V.P.; Kopeikin, V.; Novigatsky, A. Black carbon in the Arctic: The underestimated role of gas flaring and residential combustion emissions. Atmos. Chem. Phys. 2013, 13, 8833–8855. [Google Scholar] [CrossRef]
  44. Dall’ Osto, M.; Beddows, D.; Tunved, P.; Krejci, R.; Ström, J.; Hansson, H.-C.; Yoon, Y.; Park, K.-T.; Becagli, S.; Udisti, R. Arctic sea ice melt leads to atmospheric new particle formation. Sci. Rep. 2017, 7, 3318. [Google Scholar] [CrossRef]
  45. Rinaldi, M.; Decesari, S.; Finessi, E.; Giulianelli, L.; Carbone, C.; Fuzzi, S.; O′ Dowd, C.D.; Ceburnis, D.; Facchini, M.C. Primary and secondary organic marine aerosol and oceanic biological activity: Recent results and new perspectives for future studies. Adv. Meteorol. 2010, 2010, 310682. [Google Scholar] [CrossRef]
  46. Gui, L.; Tao, M.; Wang, Y.; Wang, L.; Chen, L.; Lin, C.; Tao, J.; Wang, J.; Yu, C. Climatology of aerosol types and their vertical distribution over East Asia based on CALIPSO lidar measurements. Int. J. Climatol. 2022, 42, 6042–6054. [Google Scholar] [CrossRef]
  47. Engström, A.; Ekman, A.M. Impact of meteorological factors on the correlation between aerosol optical depth and cloud fraction. Geophys. Res. Lett. 2010, 37, L18814. [Google Scholar] [CrossRef]
  48. Tian, P.; Yu, Z.; Cui, C.; Huang, J.; Kang, C.; Shi, J.; Cao, X.; Zhang, L. Atmospheric aerosol size distribution impacts radiative effects over the Himalayas via modulating aerosol single-scattering albedo. NPJ Clim. Atmos. Sci. 2023, 6, 54. [Google Scholar] [CrossRef]
  49. Hunt, W.H.; Winker, D.M.; Vaughan, M.A.; Powell, K.A.; Lucker, P.L.; Weimer, C. CALIPSO lidar description and performance assessment. J. Atmos. Ocean. Technol. 2009, 26, 1214–1228. [Google Scholar] [CrossRef]
  50. Fan, J.; Wang, Y.; Rosenfeld, D.; Liu, X. Review of aerosol–cloud interactions: Mechanisms, significance, and challenges. J. Atmos. Sci. 2016, 73, 4221–4252. [Google Scholar] [CrossRef]
  51. Chen, J.; Liu, Y.; Zhang, M.; Peng, Y. Height dependency of aerosol-cloud interaction regimes. J. Geophys. Res. Atmos. 2018, 123, 491–506. [Google Scholar] [CrossRef]
  52. Kuebbeler, M.; Lohmann, U.; Feichter, J. Effects of stratospheric sulfate aerosol geo-engineering on cirrus clouds. Geophys. Res. Lett. 2012, 39, L23803. [Google Scholar] [CrossRef]
  53. Zeng, X.; Gong, J.; Li, X.; Wu, D.L. Modeling the radiative effect on microphysics in cirrus clouds against satellite observations. J. Geophys. Res. Atmos. 2021, 126, e2020JD033923. [Google Scholar] [CrossRef]
  54. Zeng, X.; Heymsfield, A.J.; Ulanowski, Z.; Neely III, R.R.; Li, X.; Gong, J.; Wu, D.L. The radiative effect on cloud microphysics from the Arctic to the tropics. Bull. Am. Meteorol. Soc. 2022, 103, E2108–E2129. [Google Scholar] [CrossRef]
  55. Pruppacher, H.R.; Klett, J.D.; Wang, P.K. Microphysics of clouds and precipitation. Aerosol Sci. Technol. 1998, 28, 381–382. [Google Scholar] [CrossRef]
  56. Kärcher, B.; Lohmann, U. A parameterization of cirrus cloud formation: Heterogeneous freezing. J. Geophys. Res. Atmos. 2003, 108, 4402. [Google Scholar] [CrossRef]
  57. Kishcha, P.; Starobinets, B.; Alpert, P. Latitudinal variations of cloud and aerosol optical thickness trends based on MODIS satellite data. Geophys. Res. Lett. 2007, 34, L05810. [Google Scholar] [CrossRef]
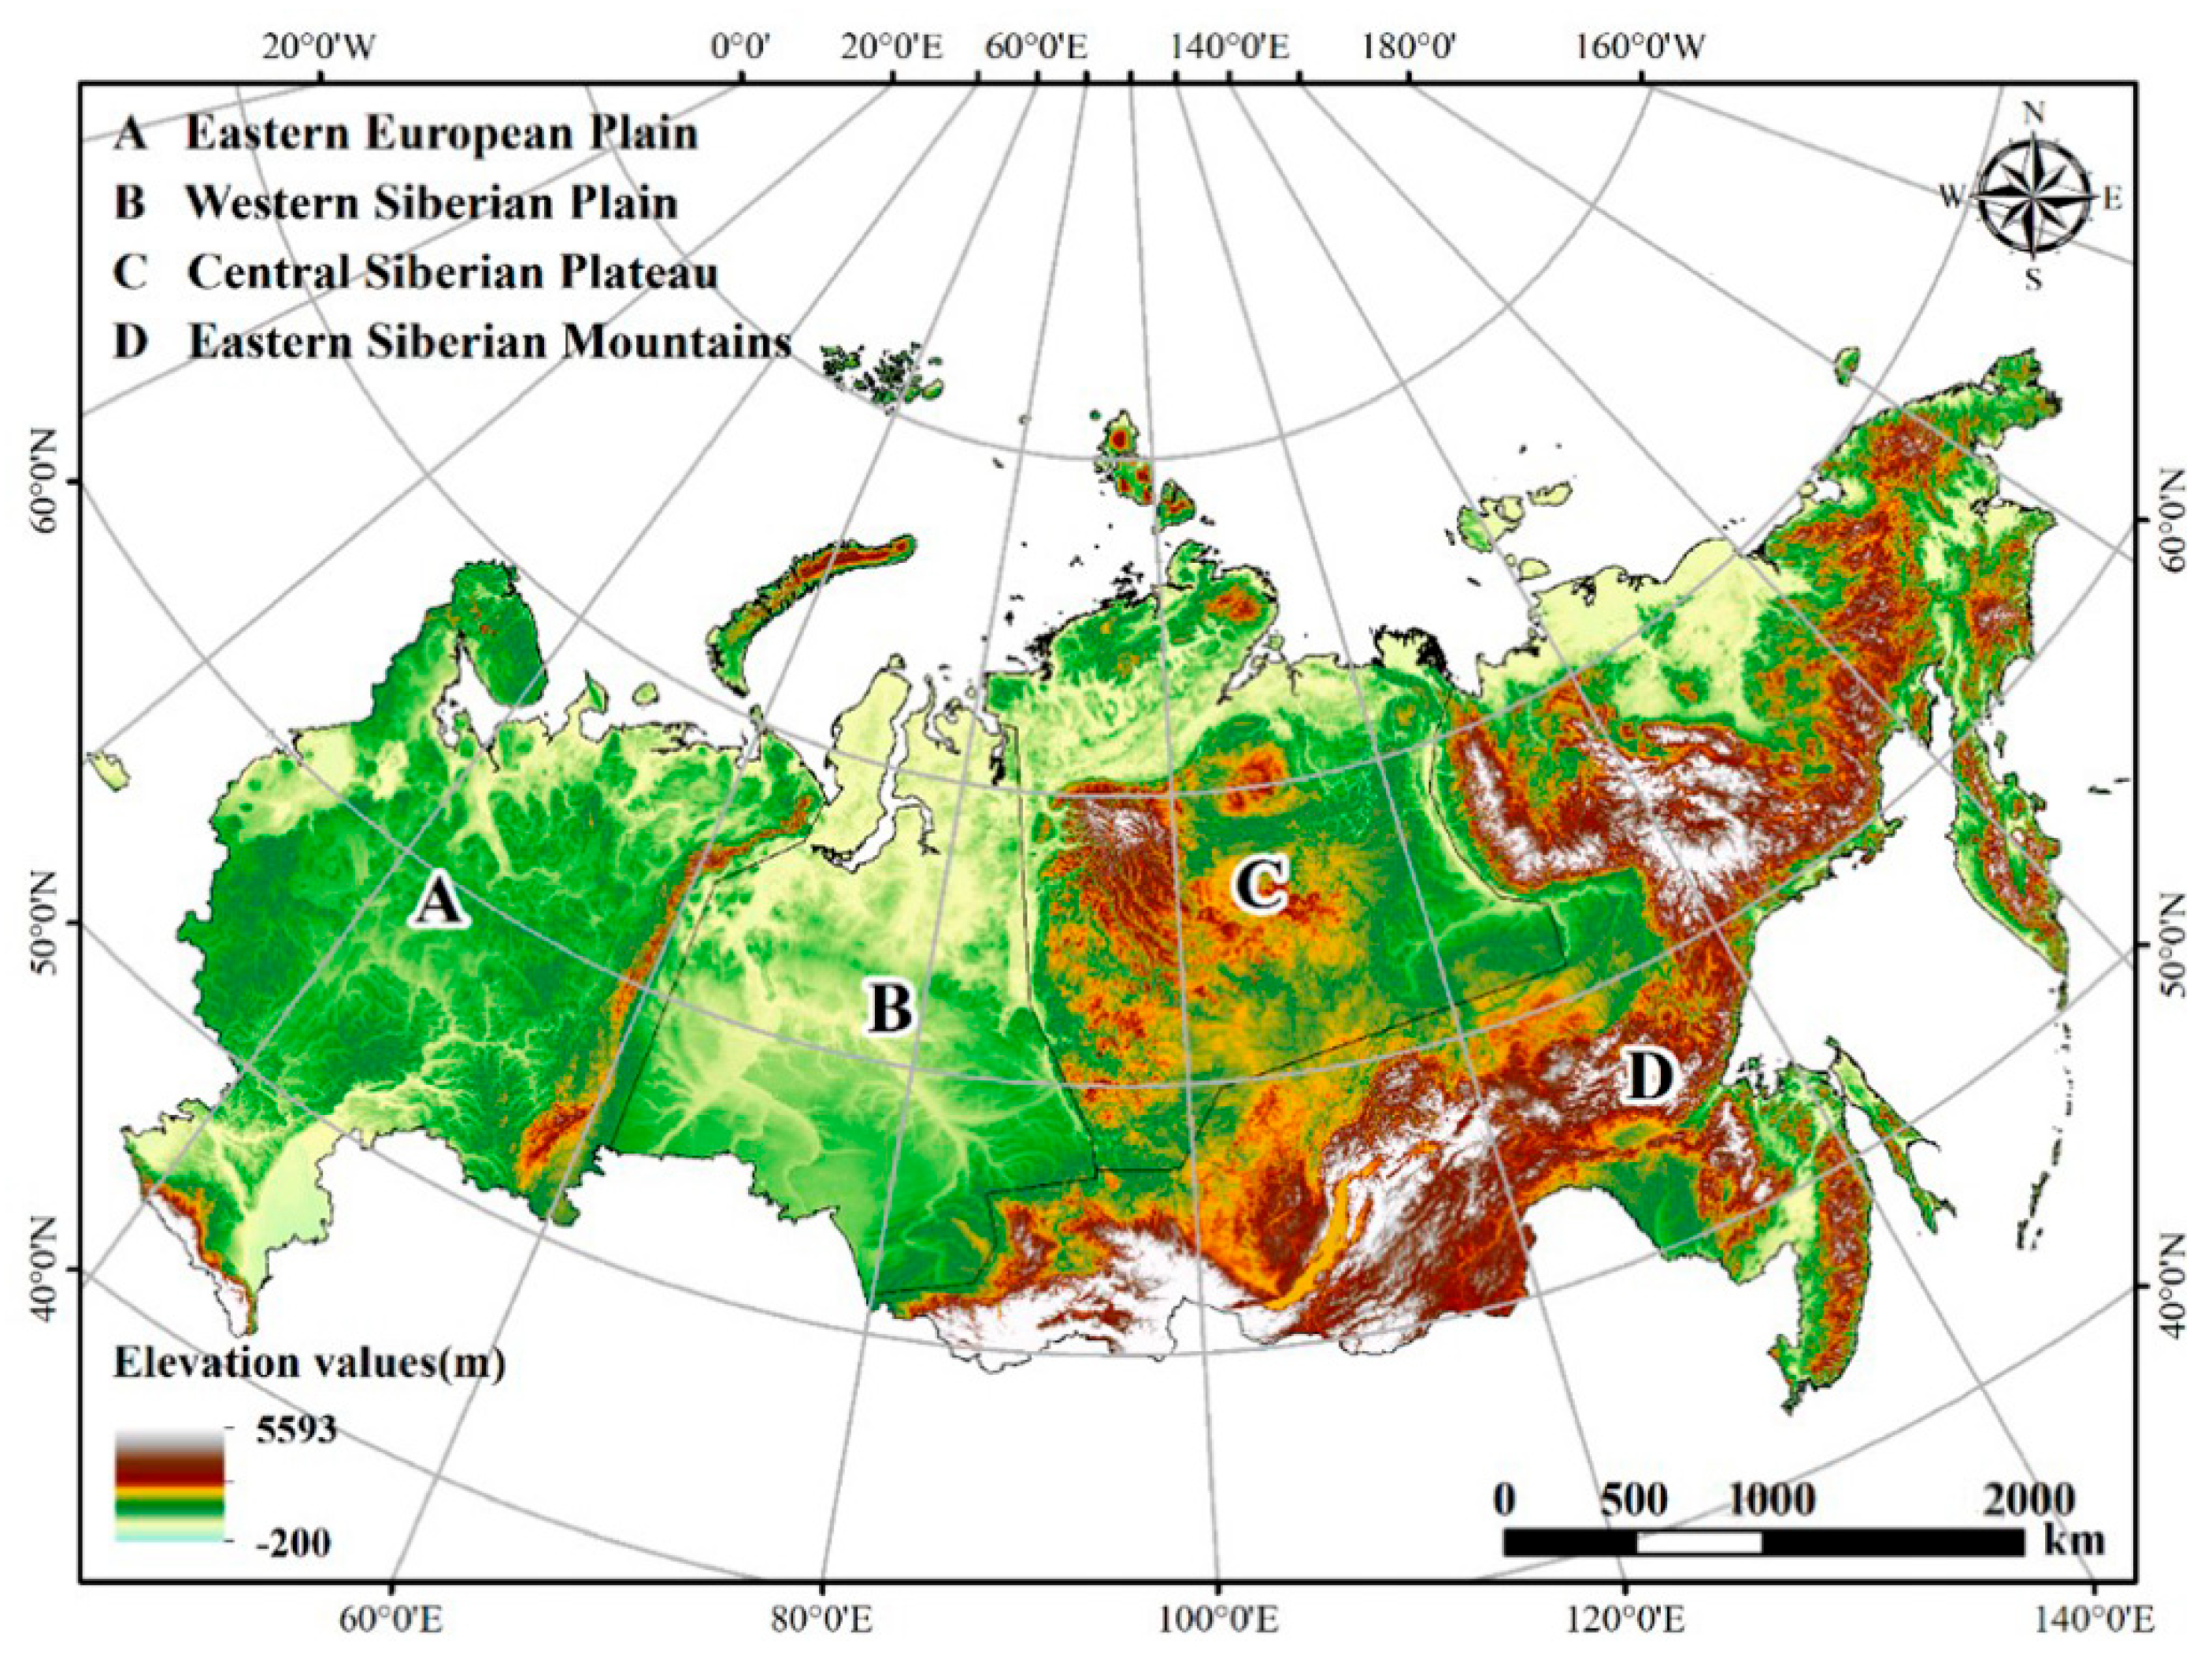
Figure 1. Geographic location and zoning map of Russia.
Atmosphere 16 01015 g001
Figure 2. Seasonal variations in the average values of optical and physical properties of upper clouds during the daytime in the Russian region from 2006 to 2021.
Atmosphere 16 01015 g002
Figure 3. Seasonal variations in the average values of optical and physical properties of upper clouds during the nighttime in the Russian region from 2006 to 2021.
Atmosphere 16 01015 g003
Figure 4. Seasonal variations in the average values of optical and physical properties of the upper aerosol layer during the daytime in the Russian region from 2006 to 2021.
Atmosphere 16 01015 g004
Figure 5. Seasonal variations in the average values of optical and physical properties of the upper aerosol layer during the nighttime in the Russian region from 2006 to 2021.
Atmosphere 16 01015 g005
Figure 6. Correlation matrix showing hexagonal density distribution of daytime upper cloud-upper aerosol layer parameters (Group 1) (color bars indicate data point density).
Atmosphere 16 01015 g006
Figure 7. Correlation matrix showing hexagonal density distribution of daytime upper cloud-upper aerosol layer parameters (Group 2) (color bars indicate data point density).
Atmosphere 16 01015 g007
Figure 8. Correlation matrix showing hexagonal density distribution of nighttime upper cloud-upper aerosol layer parameters (Group 1) (color bars indicate data point density).
Atmosphere 16 01015 g008
Figure 9. Correlation matrix showing hexagonal density distribution of nighttime upper cloud-upper aerosol layer parameters (Group 2) (color bars indicate data point density).
Atmosphere 16 01015 g009
Table 1. The names and abbreviations of the seven indicators.
ParameterAbbreviation
Top Cloud Optical DepthTCOD
op Aerosol Optical DepthTAOD
Color Ratio (Cloud/Aerosol)CRc/CRa
Top Depolarization Ratio (Cloud/Aerosol)TDRc/TDRa
Top Base Height (Cloud/Aerosol)TBHc/TBHa
Top Height (Cloud/Aerosol)THc/THa
Top Thickness (Cloud/Aerosol)TTc/TTa
Layer Level (Cloud/Aerosol)LLc/LLa
Table 2. Seasonal variations in average values for seven upper cloud layers optical and physical indicators across four study regions (2006–2021, daytime values).
SeasonTime PeriodTCODTBHcTHcTTcLLcTDRcCRc
Area A
SpringDay0–15–1010–151–20–21–1.50.25
SummerDay1–28–1010–151–20–21–1.50.25
AutumnDay0–15–1010–151–20–21–1.50.25
WinterDay0–15–1010–152–32–31–1.50.25–05
Area B
SpringDay0–15–76–81.0–1.52.0–2.50.6–0.80.20–0.30
SummerDay1–27–98–91.0–1.52.0–2.51.0–1.20.25–0.35
AutumnDay0–17–98–91.5–2.03.0–3.51.0–1.20.30–0.35
WinterDay0–14–66–72.0–2.52.0–2.50.6–0.80.25–0.30
Area C
SpringDay0.5–1.06–87–91.5–2.02.5–3.00.8–1.00.25–0.35
SummerDay1.0–2.08–910–121.5–2.01.5–2.01.0–1.20.15–0.25
AutumnDay0.5–1.07–97–91.5–2.03.0–3.51.0–1.20.35–0.40
WinterDay0.5–1.07–97–91.5–2.03.0–3.50.7–1.00.35–0.40
Area D
SpringDay0.5–1.05–77–90.5–1.02.0–3.00.7–1.00.10–0.20
SummerDay1.5–2.07–99–101.5–2.01.5–2.01.0–1.20.20–0.30
AutumnDay0.5–1.05–77–91.5–2.03.0–3.50.7–1.00.10–0.20
WinterDay0.0–1.05–66–71.0–1.52.5–3.00.5–1.00.20–0.30
Table 3. Seasonal variations in average values for seven optical and physical indicators in upper aerosol layers across four study regions (2006–2021, daytime values).
SeasonTime PeriodTAODTBHaTHaTTaLLaTDRaCRa
Area A
SpringDay0.02–0.038–1210–140.5–1.00.6–1.00.2–0.30.25–0.50
SummerDay0.03–0.0412–1614–180.5–1.01.2–1.60.2–0.30.15–0.40
AutumnDay0.03–0.0410–1412–160.8–1.21.0–1.40.3–0.40.10–0.20
WinterDay0.02–0.034–88–121.5–2.00.4–0.80.4–0.50.10–0.20
Area B
SpringDay0.03–0.0410–1412–161.0–1.50.8–1.20.2–0.30.20–0.30
SummerDay0.04–0.0510–1212–161.0–1.51.4–1.80.1–0.30.20–0.30
AutumnDay0.03–0.048–1010–121.0–1.80.6–1.00.2–0.30.15–0.25
WinterDay0.02–0.0310–1412–162.0–2.51.2–1.60.5–0.70.15–0.25
Area C
SpringDay0.02–0.0312–1614–160.5–1.00.8–1.20.2–0.30.25–0.35
SummerDay0.02–0.0312–1614–181.0–1.51.0–1.40.2–0.30.15–0.25
AutumnDay0.02–0.0310–1212–140.5–1.00.8–1.20.3–0.40.20–0.30
WinterDay0.01–0.028–1010–121.0–3.01.4–1.80.4–0.60.20–0.30
Area D
SpringDay0.02–0.0310–1412–160.5–1.01.0–1.40.3–0.40.25–0.40
SummerDay0.02–0.0312–1614–161.5–2.01.0–1.40.2–0.30.25–0.35
AutumnDay0.01–0.0210–1210–140.5–1.01.0–1.20.3–0.40.15–0.25
WinterDay0.01–0.026–108–120.5–1.01.6–2.00.4–0.60.15–0.25
Table 4. Daytime and nighttime statistics for representative cloud-aerosol parameter pairs.
Cloud–Aerosol Parameter PairTimeRMSERMSEKey Physical Meaning
THc–THaDaytime0.3350.34390.5864Stable stratification enhances aerosol–ice cloud interactions in 7–12 km range
Nighttime0.5270.43300.6581
TDRc–TAODaDaytime0.0257.92 × 10−30.089Radiative effects of aerosols regulate ice crystal orientation
Nighttime0.0280.01560.1248
TDRc–TDRaDaytime−0.1776.86 × 10−30.0828Aerosol morphology influences cloud particle nonsphericity with threshold dependence
Nighttime−0.0680.0140.1182
TDRc–TTaDaytime−0.0287.48 × 10−30.0865Aerosol layer thickness modulates intra-cloud temperature gradients and ice growth
Nighttime0.1540.01080.1039
TBHc–TBHaDaytime0.3330.24290.4929Lower-altitude coupling weakens with height due to changing dynamical conditions
Nighttime0.5870.27020.5198
TCOD–TAODDaytime0.0640.14950.3867Thin aerosol and cloud layers dominate; thick aerosol layers are rare in high latitudes
Nighttime0.0840.27960.5288
TTc–TTaDaytime0.1630.05140.2268Both layers dominated by thin structures; aerosol influence shows “saturation effect”
Nighttime0.0810.07740.2782
Disclaimer/Publisher’s Note: The statements, opinions and data contained in all publications are solely those of the individual author(s) and contributor(s) and not of MDPI and/or the editor(s). MDPI and/or the editor(s) disclaim responsibility for any injury to people or property resulting from any ideas, methods, instructions or products referred to in the content.