Abstract
In the context of growing climate change and more frequent heat extremes, tourism in Mediterranean cities like Mostar (Bosnia and Herzegovina) is becoming increasingly vulnerable. This study aimed to provide a detailed analysis of the human bioclimatic conditions in Mostar using the physiologically equivalent temperature (PET) index, the modified PET (mPET), and the Climate-Tourism Information Scheme (CTIS), based on hourly meteorological data for the period 2000–2020. By applying the RayMan model, relevant bioclimatic parameters were calculated for three key times of day (07:00, 14:00, and 21:00 CET), and the results were analyzed in terms of seasonal and daily patterns of thermal stress. The most intense thermal stress was observed during summer afternoon hours, while the transitional seasons (spring and autumn) offer significantly more favorable conditions for tourist activities. A major contribution of this study is the creation of the first integrated bioclimatic information sheet for Mostar, which brings together PET, mPET, and CTIS outputs in accessible format tailored to local tourism needs. It serves as a scientifically based and practical tool for informing visitors and improving the planning of tourism activities in accordance with local climatic characteristics. Due to its visual clarity and ease of interpretation, the information sheet has strong potential for strategic adaptation in climate-sensitive tourism management.
1. Introduction
One of the greatest challenges contemporary tourism faces is the ever more frequent and intensive extreme weather events, such as heat waves, cold spells, storms, and other natural hazards, as stated in a report by the World Meteorological Organization [1]: “Climate indicators set new records. Extreme events cause devastation” [1]. These events negatively affect tourism infrastructure and endanger natural and cultural resources as well as having the capacity to cause fires, erosion, or transportation disruptions, which impacts the safety and reputation of destinations [2]. Although heat waves are not globally recognized as the most dangerous type of weather hazard compared to hurricanes or storms, they are to a growing extent becoming a threat regarding local areas, especially in the Mediterranean region [3]. Such trends highlight the need for the development of sustainable spatial planning that integrates tourism, climate resilience, and environmental protection [4]. According to earlier reports by the World Tourism Organization [5,6], the Mediterranean region—geographically including the city of Mostar—represents the world’s leading tourist destination, attracting one-fifth of all international arrivals and generating over 30% of global tourism revenue. However, climate change threatens this potential, as earlier reports by the Intergovernmental Panel on Climate Change [7] already warned of rising temperatures and more frequent heat waves. Recent IPCC reports [8,9] confirm that the predictions made in 2007 about rising temperatures and increasing heat waves have nearly been fulfilled. “Climate Change 2021: The Physical Science Basis” and “Climate Change 2024: Synthesis Report” both highlight that extreme heat events have become more frequent and intense, in line with earlier projections [8,9].
Contemporary approaches to tourism planning emphasize that climate and weather should be considered key determinants of tourism demand and destination management [10]. Traditional planning, which relies on monthly average data, often overlooks the impact of short-term weather conditions on tourists’ daily comfort. As shown in the case of Catalonia [11], linking objective climatic data with visitors’ subjective preferences enables the creation of weather-type catalogues suitable for tourism. As a multisectoral economic activity, tourism is one of the most sensitive sectors to natural and climatic conditions, making it particularly vulnerable to the effects of climate change [12,13]. Despite a growing number of studies, tourism is still inadequately prepared for adaptation to pronounced climate disturbances, while weather events are already negatively impacting the attractiveness, competitiveness, and economic sustainability of many destinations. The growing number of tourists during summer months further highlights the importance of analyzing thermal comfort, as high temperatures can adversely affect visitors’ health, time spent outdoors, and the structure of tourist activities [12]. From a bioclimatological perspective, De Freitas [14] emphasizes that user needs—both tourists and tourism decision-makers—are often neglected in standard climate analysis approaches. He calls for the development of validated and functional tourism–climate indices that more accurately reflect conditions relevant to tourist experiences and behavior. In this context, the provision and availability of weather and climate information play an increasingly important role in modern tourism, both in terms of travel planning and in terms of visitor safety and comfort. Matzarakis [15] classifies this information into three key groups: climatological data (monthly averages of temperature, precipitation, number of sunshine hours), real-time meteorological information (e.g., UV index, air quality), and bioclimatic indices that quantify the impact of the environment on the human body. These data enable tourism organizations to more accurately plan accommodation capacities and activities, improve visitor information, and enhance their experience at the destination. The author particularly emphasizes the importance of using simple and visually interpretable formats, such as bioclimatic brochures, which combine thermal, physical, and aesthetic characteristics of weather, making them accessible and useful to the wider public.
Scott and Lemieux [16] further note the strategic value of climate information for the touristic sector, viewing it both as a resource and as a risk factor. They point to the lack of standardization and systematic application of meteorological information in tourism, emphasizing the need to improve data collection infrastructure in tourism-relevant regions, as well as the development of specific climate services tailored to the needs of destinations. They particularly stress the importance of linking the academic community, meteorological institutions, and the tourism industry in creating integrated systems for managing climate risks and increasing sector resilience. In addition to the objective assessment of conditions, forecasts, risks of extreme events, and long-term climate expectations also play a significant role in shaping tourism demand and planning.
Although classic climate information provides a basis for understanding seasonal patterns, it is often not intuitive enough for widespread use. For this reason, growing attention is being given to the application of bioclimatic indices, which present thermal comfort levels in a comprehensible and operational way. Among these, the physiologically equivalent temperature (PET) has emerged as the most commonly used index in the context of tourism, as it allows direct comparison with temperatures familiar to users and provides clear interpretations regarding potential heat or cold stress. The application of bioclimatic indices has proven valuable in urban areas in Bosnia and Herzegovina [17,18,19,20]. The application of bioclimatic indices internationally has been complemented by visualizations using the Climate-Tourism Information Scheme (CTIS), which further confirms their value. The CTIS enables visualization of the frequency of favorable and unfavorable thermal, physical, and aesthetic conditions, providing tourists and decision-makers with high-resolution information for visit planning and destination development. An interesting approach was successfully applied in Taiwan [21] and on the island of Hvar in Croatia, where Zaninović and Matzarakis [22] produced a bioclimatic leaflet integrating PET, precipitation, solar radiation, humidity, and wind to better inform tourists.
Mostar, a recognizable “city break” destination with rich cultural–historical heritage and Mediterranean influence [23], has seen a rise in tourist arrivals in recent years—from about 77,000 in 2012 to over 266.00 in 2019—with recovery following the decline due to the COVID-19 pandemic [24]. However, the city remains vulnerable to climate extremes, which further emphasizes the need for thermal comfort analysis and better integration of bioclimatic information into tourism planning. Although PET, mPET, and the CTIS have been successfully applied in climate and tourism studies, there has been no integrated bioclimatic analysis using these indices for Mostar, a city experiencing rapid tourism growth and pronounced heat stress. This study addresses that gap by providing the first combined assessment for a city experiencing tourism expansion and intensive summer heat. Given all this, the aim of this study was to develop a bioclimatic informational sheet for Mostar tailored to local climatic and geographic specifics using the bioclimatic indices of physiologically equivalent temperature (PET), modified PET (mPET), and the Climate-Tourism Information Scheme (CTIS) with the aim of contributing to sustainable tourism planning, improved information for visitors and decision-makers, and strengthening Mostar’s resilience to climate extremes.
2. Materials and Methods
This study employed an interdisciplinary approach that combined climate data analysis and biometeorological index modeling to assess patterns of thermal stress in Mostar, a city experiencing growing tourism activity and pronounced Mediterranean climatic influence. The analysis of thermal comfort is based on daily synoptic meteorological data for the period 2000–2020. The data include values for air temperature, relative humidity, wind speed, and cloud cover recorded at 7:00, 14:00, and 21:00 Central European Time. These data were obtained from the main meteorological station in Mostar, operated by the Federal Hydrometeorological Institute of Bosnia and Herzegovina. The station is located at an elevation of 70 m and serves as a reliable source of long-term observations for the lower Herzegovina region. Due to the absence of a high-resolution urban meteorological network in Mostar, this study was based on the primary long-term station, which offers the only consistent and validated dataset for 2000–2020. Although microclimate variation is inherent to urban environments, data from a single long-term station still provide meaningful and reliable input for regional-scale bioclimatic analysis. In addition, a Human Bioclimatic Information Sheet for visitors and planners was developed as supplementary material. It synthesizes the results of PET, mPET, and CTIS analyses and reformulates them in a simplified format, providing a user-friendly resource for tourists and planners while complementing the scientific framework of the study.
2.1. Study Area
Mostar is located in southeastern Europe in the southern part of Bosnia and Herzegovina at the heart of the Herzegovina region, and lies on the banks of the Neretva River (Figure 1). The city, with approximately 60,195 inhabitants, according to the 2013 census [25], serves as the administrative, cultural, and economic center of the southern part of the country, as well as the seat of the Herzegovina-Neretva Canton. The urban area is situated within a series of karst basins: Bijelo Polje to the north, the Mostar Basin—home to the city center—and Bišće Polje to the south. It is surrounded by low hills (Hum, Brkanovo Brdo, Galac, Orlovac) and mountain ranges in close proximity, such as Velež (1969 m) and Prenj (2155 m). Its specific geographical position, pronounced Mediterranean influence, and rich natural and cultural–historical heritage make Mostar and its surroundings attractive for the development of various types of tourism, including mass, cultural, religious, rural, ecological adventure, and speleological [26].
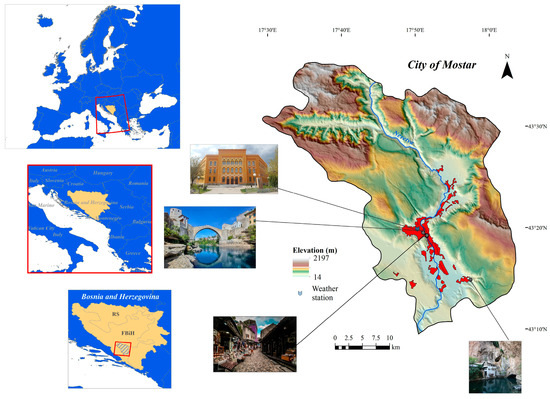
Figure 1.
Geographic position of Mostar.
Thanks to its strategic location at the crossroads of important transport routes and at the junction of Mediterranean and continental influences, Mostar has a long-standing tradition as a significant commercial, artisanal, and cultural center. The city is recognized for its rich cultural and historical heritage, and its global symbol is the Old Bridge, a UNESCO World Heritage Site, which represents a key focal point for tourist flows between the Adriatic coast and the interior, especially during the warmer part of the year (May–September). The area surrounding the Old Bridge, with its pre-Ottoman, Eastern Ottoman, Mediterranean, and Western European architectural elements, is an outstanding example of a multicultural urban settlement [27]. Today, the Old Bridge is not only an architectural icon but also the central hub of various tourist activities, including recreational and cultural content, which contribute to the overall tourism valorization of Mostar [28]. However, tourism development is limited by underdeveloped infrastructure and a lack of planning strategy, coordination, and institutional support, highlighting the need to strengthen the city’s tourism infrastructure [29]. Mostar’s popularity and the increasing number of tourists during the summer months further emphasize the importance of understanding local thermal conditions, particularly in the context of increasingly frequent heat extremes during the peak tourist season.
Mostar’s climate is shaped by its geographical position and relief, combining Mediterranean and continental influences. According to the Köppen–Geiger classification for the standard reference period 1961–1990 [30], the climate is classified as a Mediterranean climate with dry and warm summers (Csb). The city experiences mild, wet winters and warm to very hot, dry summers, which increases the risk of summer heat stress. During this period, average monthly temperatures ranged from 4.8 °C in January to 24.7 °C in July. The annual precipitation was approximately 1515 mm, with a pronounced drought during the summer months and most precipitation occurring in the winter period. The city also stands out for its high number of sunshine hours—around 2000 h per year—which further intensifies exposure to heat stress.
More recent data (2000–2020) are presented using a Walter-Lieth climate diagram (Figure 2), which shows the average monthly air temperatures (left y-axis, red line) and average monthly precipitation totals (right y-axis, blue bars), the average annual precipitation, the average annual temperature, the average daily maximum temperature (33.8 °C), and the average daily minimum temperature (2.9 °C) [31]. There are observable trends toward longer dry and intensified summer heat stress compared to the baseline climate norm from the 1961–1990 period.
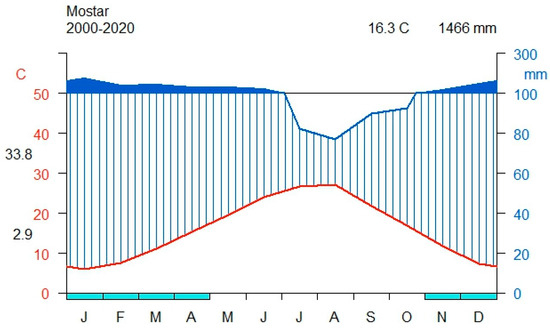
Figure 2.
Walter-Lieth climate diagram for Mostar for the period 2000–2020. The left y-axis (in red) shows the average monthly air temperatures. The right y-axis (blue color) shows the monthly precipitation in totals, while blue bar lines illustrate the amount of precipitation per month. On the left axis, values in black represent the mean daily maximum and mean daily minimum temperature along the whole period. At the top right, values in black represent the averaged value of mean temperature and annual precipitation along the whole period.
This is aligned with the findings of contemporary research documenting the significant impacts of climate change in the region. Studies indicate ever more frequent and intense extreme heat events, particularly in the southern parts of Bosnia and Herzegovina, where Mostar is located [32,33,34]. These studies confirm the trend of rising average annual and seasonal temperatures, as well as the more frequent occurrence of extremely high temperatures, aligning with broader patterns of temperature increase observed in the southern and southeastern parts of the country. Accordingly, climate projections based on the RCP8.5 scenario—which assumes very high greenhouse gas emissions without significant mitigation measures—show that Bosnia and Herzegovina could experience an average temperature increase of up to 5 °C by the end of the 21st century along with a reduction in annual precipitation by up to 30% and up to 40% in the summer months. A higher number of summer days is expected during the peak tourist season (June–August), with the number of additional summer days rising from 3 to 12 at the start of the century to 30–40 by its end. This would further intensify the risks of heat stress for visitors. These changes could halt the region’s climatic and hydrological balance and further increase risks for tourism and other climate-dependent sectors [35]. Such changes point to a tendency to prolonged seasonal heat stress.
Climatic characteristics such as high temperatures, extended dry periods, intense solar radiation, and the more frequent occurrence of tropical nights directly affect visitors’ thermal comfort. For this reason, the application of bioclimatic indices—such as physiologically equivalent temperature (PET) and modified PET (mPET)—is important for the analysis and planning of tourism activities in Mostar. These indices allow for the assessment of thermal stress in urban outdoor environments and provide a basis for creating bioclimatic data useful to tourists, planners, and decision-makers, with the aim of adapting tourism to current and future climate conditions.
2.2. PET and mPET
To assess bioclimatic conditions, the physiologically equivalent temperature (PET) index was used. PET is based on the Munich Energy-Balance Model for Individuals (MEMI), a two-node thermo-physiological model of human heat balance. It is one of the most commonly used thermal indices and is certified by the German VDI Guidelines 3787, Part 2 [36]. PET expresses the thermal load on the human body in degrees Celsius, allowing for direct comparison with standard meteorological data. The model incorporates key meteorological parameters such as air temperature, relative humidity, wind speed, mean radiant temperature, and physiological characteristics of the individual, such as gender, activity level, and clothing insulation value [37]. In addition to the standard PET index, the modified PET (mPET) index was also applied as a more physiologically realistic alternative to PET, particularly under extreme summer heat conditions. The mPET index is an advanced version of the PET index that provides a more detailed and dynamic representation of human thermoregulation. While both indices are derived from the same underlying model, the Munich Energy-Balance Model for Individuals (MEMI), mPET incorporates a multi-node heat transport model equivalent to the Fiala model [38], along with a self-adapting multilayer clothing model that simulates water vapor resistance. It considers changes in clothing insulation over time and core body temperature, allowing for a more realistic simulation of physiological responses under varying environmental conditions, which was the main disadvantage of PET [39]. These improvements enable mPET to better reflect adaptive thermoregulatory mechanisms, particularly under extreme heat stress, often resulting in lower thermal stress classifications compared to PET.
Because of this, mPET enables more precise assessments of thermal comfort by more realistically showing the impact of clothing and microclimatic conditions, including vapor resistance [39]. Threshold values for PET and mPET are presented in Table 1. Threshold values for PET and mPET in Table 1 are derived from internationally recognized standards (VDI 3787, Part 2) and are widely used for assessing thermal comfort in outdoor tourism environments.

Table 1.
Threshold values for PET/mPET comfort categories [40].
2.3. RayMan Model
The RayMan model was used to assess PET and mPET values. It is a software tool made for the analysis of radiation fluxes and testing thermal comfort in urban and natural environments [41]. The RayMan model assesses the mean radiant temperature (Tmrt), a key variable for determining thermal stress. The model enables the simulation of simple and complex microclimatic scenarios and the integration of meteorological data with environmental parameters (such as shading, reflection, and surface orientation). The RayMan model complies with the standards of German VDI Guideline 3787 of the German Engineering Society, Part 2 [36], and it was included in the Methods for Human–Biometeorological Assessment of Climate and Air for Urban and Regional Planning. The model was developed to bridge biometeorology with urban climatology, but is has also been successfully used in other areas, such as tourism and recreational studies.
2.4. Climate-Tourism Information Scheme (CTIS)
For the purposes of visualizing and interpreting the results, the Climate-Tourism Information Scheme (CTIS) was applied, a methodological framework that enables the presentation of complex climate information in a format that is easy to understand for tourists, planners, and decision-makers. CTIS diagrams are used to identify components of thermal comfort (based on thermal stress derived from PET and mPET), aesthetic conditions (sunny and foggy days), and physical weather conditions (wind, rain, and sultriness) relevant to tourism-related activities. Input data—including meteorological and bioclimatic parameters—are evaluated based on predefined threshold values (Table 2). The CTIS concept, including its visualization method, is designed to be user-friendly: climatic conditions are classified into several categories, and depending on the calculated input values, a corresponding color on the scale indicates the degree of suitability for specific activities [41]. The CTIS is flexible and allows for the adaptation of information to a specific destination or event.
Table 2.
CTIS criteria and threshold values for the analysis of bioclimatic conditions [40].
3. Results
This section presents a detailed assessment of the thermal and climatic conditions in Mostar between 2000 and 2020, with a focus on their implications for human thermal comfort and tourism. The analysis is based on four key components: (1) the frequency distribution of PET and mPET thermal stress categories across different times of day and seasons; (2) seasonal patterns of precipitation and its impact on outdoor conditions; (3) the daily and seasonal course of PET and mPET values; and (4) an evaluation using the Climate-Tourism Information Scheme (CTIS) to assess the suitability of weather conditions for tourism. Finally, the findings are synthesized into a practical bioclimatic information sheet designed to support climate-responsive tourism planning.
3.1. Frequencies of PET and mPET
To provide a comprehensive overview of the thermal conditions during three time periods throughout the day between 2000 and 2020, frequency distribution diagrams for nine thermal stress categories of PET and mPET, organized into 10-day intervals, were created, presented in Figure 3. Considering the afternoon (14:00 CET) observations shown in the middle column of Figure 3, it is notable that the absence of a thermal stress category is quite rare, particularly during the summer and winter months (less than 10% and 15%, respectively). When it comes to the transitional seasons, favorable thermal conditions are significantly more common than in winter and summer (between 5% in early September and 44% in early November), and they are on average slightly more frequent in spring than in autumn. Heat stress was unrecorded only in January and December, while it prevailed (over 50%) from late April to mid-October. From mid-June to early September, the incidence of heat stress exceeded 90%, with extreme heat stress prevailing for most of that period. Afternoon heat stress was more common in autumn than in spring. Cold stress prevailed from late November to mid-March, with the two weakest stress categories being most represented.
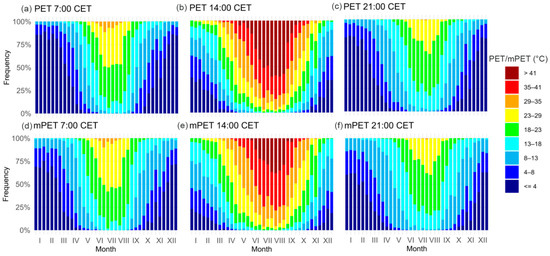
Figure 3.
Frequency of occurrence of PET and mPET thermal stress categories in Mostar (2000–2020), shown by 10-day intervals at 07:00, 14:00, and 21:00 CET.
Based on the morning (07:00 CET) and evening (21:00 CET) observations, no thermal stress category was observed from mid-April to the end of October. Considering summer values, no stress conditions were more frequent in the evening than in the morning (up 48.06% and 44.19% for mPET, respectively). When it comes to transitional seasons, favorable morning conditions are more common in spring than in autumn, while in the evening, they are the opposite. Both morning and evening cold stress categories were recorded in all 10-day periods throughout the year, with the most common occurring between September and May. The most intense morning and evening cold stress (strong and extreme cold stress categories) predominates approximately between the middle of November and the end of March. Considering heat stress, only the two mildest categories appear in the morning and evening observations, with the slight stress category being more dominant. Morning heat stress was recorded from early May to late August, while evening heat stress was noted from mid-May to mid-September. Analysis indicated that heat stress is recorded much more often in the morning than in the evening.
3.2. Frequency of Precipitation
Mean annual precipitation during the 2000–2020 period in Mostar is 1467 mm. Precipitation is the most pronounced in winter and spring (468 mm and 412 mm, respectively) and the least in summer and autumn (283 mm and 304 mm, respectively). The month with the most precipitation is January (177 mm), while the month with the least is August (77 mm).
Figure 4 illustrates that the frequency of precipitation ranges from 16.2% (mid-September) to 42% (early March). The average annual frequency of dry days (<1 mm) is 72.19%. Overall, the likelihood of precipitation is higher in the early part of the year, from January to May (frequency > 30%), compared to the rest of the year (frequency < 20%). The average frequency of 20.1% for precipitation events in August is lower compared to other summer months. In general, moderate precipitation rates (5–10 mm) prevail throughout the year, while heavy (20–50 mm) and very heavy precipitation (greater than 50 mm) rates are less frequent. The frequency of heavy and very heavy precipitation is highest from December to March, ranging from approximately 8.7% in March to 9.4% in January.
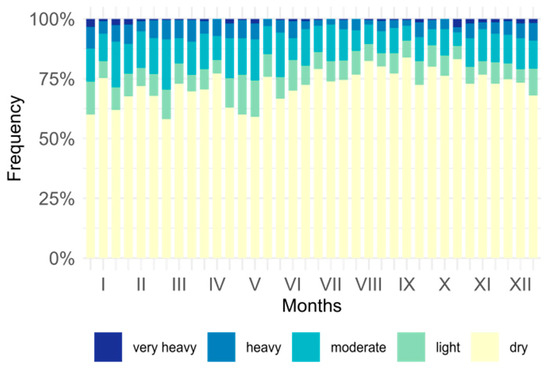
Figure 4.
Diagram of average frequency classes of daily precipitation amounts at 10-day resolution throughout the year in Mostar (2000–2020).
3.3. Daily Distribution of PET
The daily distribution of PET and mPET presented in Figure 5 identifies intervals of heat stress from morning through evening, evaluating 10-day intervals within the observed years at the same time. Figure 5 shows that the warmest days and hours were recorded in July and August between 12:00 CET and 16:00 CET when PET and mPET levels go beyond 35 °C. Hot conditions reach 35 °C from mid-June to late August during the day, while stress above 41 °C is only present in August around 14:00 CET (according to PET). From June to the end of August, mornings and evenings are often comfortable or may induce slight heat stress, with no expectation of cold stress at all. PET and mPET categories below 13 °C occur in the mornings and evenings from late September until early May, and they are present during the day from early November until late March.
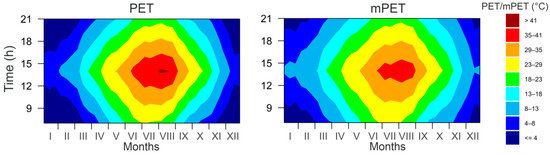
Figure 5.
Annual course of 10-day mean values of (left) PET and (right) mPET according to data at 07:00, 14:00, and 21:00 CET in Mostar (2000–2020).
It is noteworthy that compared to PET (Figure 5 left), the frequency of mPET (Figure 5 right) is somewhat more moderate, indicating a reduced likelihood of extreme heat stress conditions. For instance, during the cold months in the morning and evening, instances of PET below 4 °C are more frequent than those of mPET below 4 °C. Additionally, unlike mPET, summer afternoon PET values fall into the category of extremely severe heat stress (>41 °C).
3.4. Climate-Tourism Information Scheme (CTIS) Diagrams
The CTIS diagrams presented in Figure 6 integrate thermal, physical, and aesthetic aspects with input data for the period 2000–2020. To provide a clearer understanding of the results and enhance accessibility for potential visitors, the CTIS diagrams for three observing terms were illustrated in two different formats. Initially, percentages for each assessed factor at 10-day intervals were generated and then visually grouped by month (Figure 6 left-hand graphs). Following this, the evaluated factors were classified as suitable or unsuitable according to the relative frequencies (Figure 6 right-hand graphs).
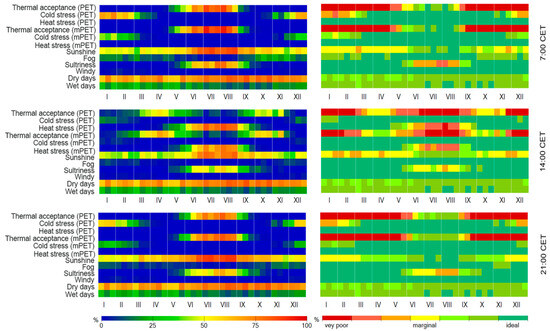
Figure 6.
Climate-Tourism Information Scheme (CTIS) for Mostar (2000–2020) at 07:00, 14:00, and 21:00 CET. The left-hand graphs show the frequency distribution of thermal comfort categories and weather-related conditions expressed as percentages for 10-day intervals throughout the year. The right-hand graphs illustrate the degree of suitability of these conditions for tourism, classified into three categories: very poor, marginal, and ideal.
A multitude of green cells in Figure 6 left-hand graphs indicates a high level of suitability for the destination. Extreme cold stress (PET/mPET < 0 °C) is not present during the afternoon observations, while it is rare in the morning and evening. Extreme cold stress in the morning and evening, with more than 20%, but less than 60% of days, persists from the beginning of October to the end of March based on PET (from late November to early March, according to mPET). Strong and extreme heat stress (PET/mPET > 35 °C) occurs during the afternoon measurement period from the beginning of May to the end of September (according to PET) or from the end of May to mid-September (according to mPET). In June and August, strong and extreme heat stress occurs in the afternoon observations for more than 75% of the days. The chance of afternoon thermal acceptance (18 °C < PET < 29 °C) is highest in April and October, while it occurs in the morning and evening from mid-May to mid-September. The destination is often sunny, especially from May to October when the possibility of cloudiness <5 octas is greater than 50%. From late April to mid-September, a higher level of sultriness, ranging from 20% to 70%, is noticeable, diminishing favorable morning and evening conditions while worsening afternoon conditions. Fog can occur in every month except summer, although it is quite rare (up to 20% in autumn mornings), and it tends to be more common in the morning than in the evening. The likelihood of precipitation less than 1 mm is dominant throughout the year (over 60%), surpassing 70% from late May to mid-December. The probability of precipitation exceeding 5 mm, which could negatively affect tourism activities, ranges from 10% to 30%, with the highest frequency (over 20%) occurring from mid-December to the end of May. The frequency of strong winds is under 5%.
3.5. Human Bioclimatic Information Sheet
To support the interpretation and practical application of the research findings, a bioclimatic information sheet for Mostar was developed as Supplementary Material to this study in the form of a poster to consolidates all findings of the study into a single visual guide (see Supplementary Material Figure S1: Bioclimatic Information Sheet). It translates complex results into accessible information for tourists and planners. This visual guide integrates key findings from the analysis of physiologically equivalent temperature (PET), modified PET (mPET), and the Climate-Tourism Information Scheme (CTIS) in a format designed for both scientific interpretation and practical use. It is designed to provide seasonally and diurnally resolved insights into thermal comfort and relevant climatic factors in a format accessible to tourists, planners, and decision-makers alike. In addition to offering practical recommendations—such as promoting shoulder seasons and developing adaptive infrastructure—the sheet also reflects a scientifically based bioclimatic analysis based on standardized methods and validated indices, thus providing a valid basis for sustainable tourism planning in the face of ongoing climate change. Its practical relevance is further explored in the discussion section, where the bioclimatic information sheet is positioned as a key tool for climate-informed tourism management in the city of Mostar.
4. Discussion
This study aimed to conduct a detailed analysis of the bioclimatic conditions in Mostar using the physiologically equivalent temperature (PET) index, the modified physiologically equivalent temperature (mPET) index, and the Climate-Tourism Information Scheme (CTIS) over the period 2000–2020. By utilizing daily meteorological data and a bioclimatic model, thermal conditions were assessed at three key times of the day, and visual representations were made in the form of CTIS diagrams and a bioclimatic information sheet tailored to the needs of tourists and planners.
The study focused on identifying seasonal and daily patterns of heat and cold stress, their impact on tourism activities, and opportunities for improving tourism planning under current climate change conditions. The results reveal pronounced seasonal contrasts that affect the city’s tourism potential. The findings confirm that during the summer months, particularly from mid-June to early September, Mostar frequently experiences intense heat stress. Afternoon PET values often exceed 35 °C, with extreme stress levels (>41 °C) regularly recorded during this period. These results are consistent with studies from other Mediterranean destinations like the Croatian coast [22,42], where similar patterns of high thermal stress were observed during the peak tourist season. In contrast, the transitional seasons (spring and autumn) offer significantly more favorable thermal conditions, aligning with the optimal bioclimatic periods for tourism identified in other Mediterranean cities.
CTIS diagrams show that during spring and autumn, Mostar offers a significant number of days suitable for tourism, characterized by pronounced thermal comfort and favorable aesthetic conditions (e.g., sunny days, low cloud cover). However, the high frequency of intense heat stress during summer afternoons and the increasingly common occurrence of sultriness highlight the need for careful planning of tourism activities to reduce health risks and improve visitor comfort. Morning and evening hours provide more acceptable conditions, suggesting that outdoor activities and promotional strategies should be adjusted to these times of day to minimize exposure to thermal extremes. For example, this can be achieved by improving public spaces with shading and ventilation, adjusting the timing of tourism events, and integrating early-warning systems for heat waves. Similar recommendations have been made for Athens [40].
The bioclimatic information leaflet, designed as a poster (Supplementary Material S1: Bioclimatic Information Sheet), has the potential to become a valuable resource in tourism promotion, destination management, and the enhancement of visitor safety in Mostar. By offering clear, science-based insights into thermal conditions, this tool can assist planners in adapting tourism strategies and informing tourists in real time. Its integration into digital platforms, tourist offices, and accommodation facilities would contribute to its accessibility and practical application. Such an approach—similar to the successful implementation on the island of Hvar [22], as well as examples from Greece [43]—demonstrates significant potential for incorporating climate data into the promotion and planning of tourist destinations, while simultaneously adapting these destinations to the challenges of climate change. This aligns with recommendations from the literature [11], which emphasize the importance of providing high-quality climate information to tourists at all stages of their journey—from planning to experience and evaluation. Our findings further show that bioclimatic information should become an integral part of tourism marketing, with particular emphasis on promoting the transitional seasons and diversifying tourism offerings beyond the thermally most stressful summer months. As highlighted in the survey-based study by Moreno [3], changes in climate patterns can significantly affect tourism demand, especially during the summer months when destinations are affected by heat waves and extreme weather events. That study also highlights the importance of proactive adaptation strategies, which are essential for reducing the negative impacts of climate change on tourism as a key economic sector. Given the continuous rise in temperatures across the Mediterranean region, including Herzegovina, the tourism sector should adapt to these changes to ensure its long-term sustainability. In this context, bioclimatic tools such as the informational sheet and the CTIS visualizations developed in this study provide valuable support for local adaptation efforts.
Although the study provides comprehensive insight into the thermal comfort conditions in Mostar, several limitations of this research should be noted. The analysis is based on meteorological data from a single station, which may not fully reflect the spatial diversity of microclimatic conditions within the urban area of Mostar. Additionally, it should be considered that the RayMan model and PET and mPET indices assume standardized activity levels and clothing insulation values, which may not fully represent the varying behavior and clothing patterns of tourists that can influence the perception of thermal stress. Furthermore, the CTIS framework, while valuable for general guidelines, simplifies complex climatic interactions and the subjective perception of comfort. Future research steps involve expanding the analysis to microclimate modeling at finer spatial scales within the city to more accurately identify spatial differences in thermal stress and their impacts on tourist areas. Primarily, this refers to integrating micrometeorological measurements such as those conducted in the urban part of Banja Luka [17] or Belgrade [44]. Additionally, it is important to include visitor perception studies to complement objective bioclimatic indices with subjective assessments of comfort and tourist satisfaction. Studies indicate that climate change is increasingly recognized as a barrier to destination selection, with tourists prioritizing sustainability, resilience, and safety [45]. Furthermore, recent research on Generation Z tourists emphasizes the value of clear, fact-based communication and environmental responsibility [46]. In addition, participatory planning involving local stakeholders is essential to align tourism strategies with environmental realities and to ensure that climate adaptation measures are both context-specific and widely accepted [47]. Therefore, including visitor perception studies alongside objective climate data is crucial for creating effective and sustainable tourism management strategies.
Special attention should be given to examining the potential of adaptation measures, such as greening urban areas and shading strategies, which could help mitigate heat stress in the most burdened tourist parts of the city. The development of dynamic bioclimatic information systems linked with real-time meteorological data and mobile applications would further support adaptive tourism management and increase visitor resilience to climate extremes. Finally, promoting wider use of bioclimatic brochures and CTIS visualization in digital formats is recommended, significantly enhancing the accessibility and practical application of this information in tourism planning and promotion.
5. Conclusions
This study provides the first integrated bioclimatic assessment of Mostar by applying PET, mPET, and CTIS indices to evaluate thermal conditions over the period 2000–2020. Based on the obtained results, it can be concluded that the climatic conditions in Mostar during the summer months pose a challenge for tourism activities due to the high levels of heat stress, while the transitional seasons (spring and autumn) offer more favorable bioclimatic conditions for tourism development. These findings highlight the need for tourism marketing and destination development strategies to focus on promoting visits during thermally more comfortable periods, as well as improving infrastructure that can mitigate the negative impacts of extreme temperatures. Bioclimatic informational sheets, developed in this study, represent a novel and practical tool for enhancing tourist safety and satisfaction while also supporting responsible planning and promotion of the destination in line with contemporary climate challenges. These combine scientific insight with user-friendly visual communication.
This study emphasizes the need to align tourism strategies with climatic realities by promoting thermally comfortable periods, adjusting activity schedules, and integrating adaptive infrastructure such as shading and ventilation. In light of projected climatic changes, the integration of real-time climate data and participatory planning approaches will be essential for building resilient and sustainable tourism systems in urban Mediterranean destinations like Mostar.
Supplementary Materials
The following supporting information can be downloaded at https://www.mdpi.com/article/10.3390/atmos16080987/s1. Figure S1: Bioclimatic information sheet for tourists and planners.
Author Contributions
Conceptualization, A.M. and M.P.; methodology, A.M. and M.P.; resources, S.M.-M.; writing—original draft preparation, A.M. and M.P.; writing—review and editing, S.M.-M.; visualization, M.P. and S.M.-M.; supervision, A.M. All authors have read and agreed to the published version of the manuscript.
Funding
This research was supported by the Ministry of Science, Technological Development and Innovation of the Republic of Serbia, grant number 451-03-136/2025-03/200172. The APC was partially funded by the Geographical Institute “Jovan Cvijić” SASA.
Institutional Review Board Statement
Not applicable.
Informed Consent Statement
Not applicable.
Data Availability Statement
The original contributions presented in this study are included in the article/supplementary material. Further inquiries can be directed to the corresponding author(s).
Acknowledgments
The authors would like to thank the Federal Meteorological Institute of Bosnia and Herzegovina for providing access to the meteorological data used in this study. The authors express their gratitude to Sanda Šušnjar from the University of East Sarajevo (BaH) for her assistance in creating the map used in this study.
Conflicts of Interest
The authors declare no conflicts of interest.
References
- World Meteorological Organization (WMO). State of the Global Climate 2021; WMO-No. 1290; WMO: Geneva, Switzerland, 2021; Available online: https://library.wmo.int/index.php?lvl=notice_display&id=22080 (accessed on 23 June 2025).
- Hall, C.M.; Gössling, S.; Scott, D. The Routledge Handbook of Tourism and Sustainability; Routledge: London, UK, 2017. [Google Scholar]
- Moreno, A. Mediterranean tourism and climate (change): A survey-based study. Tour. Geogr. 2010, 12, 253–265. [Google Scholar] [CrossRef]
- Papageorgiou, M. Spatial planning for tourism destinations resilient to climate change. Tour. Hosp. 2025, 6, 8. [Google Scholar] [CrossRef]
- United Nations World Tourism Organization (UNWTO). Tourism Market Trends: Europe; UNWTO: Madrid, Spain, 2007. [Google Scholar]
- United Nations World Tourism Organization (UNWTO). World Tourism Barometer; UNWTO: Madrid, Spain, 2009; Volume 7. [Google Scholar]
- Christensen, J.H.; Hewitson, B.; Busuioc, A.; Chen, A.; Gao, X.; Held, I.; Jones, R.; Kolli, R.K.; Kwon, W.-T.; Laprise, R.; et al. Regional Climate Projections. In Climate Change 2007: The Physical Science Basis. Contribution of Working Group I to the Fourth Assessment Report of the Intergovernmental Panel on Climate Change; Solomon, S., Qin, D., Manning, M., Chen, Z., Marquis, M., Averyt, K.B., Tignor, M., Miller, H.L., Eds.; Cambridge University Press: Cambridge, UK; New York, NY, USA, 2007; pp. 847–940. [Google Scholar]
- Intergovernmental Panel on Climate Change (IPCC). Climate Change 2021: The Physical Science Basis. Contribution of Working Group I to the Sixth Assessment Report of the IPCC; Cambridge University Press: Cambridge, UK, 2021. [Google Scholar] [CrossRef]
- Intergovernmental Panel on Climate Change (IPCC). Climate Change 2024: Synthesis Report. Contribution of Working Groups I, II and III to the Sixth Assessment Report of the IPCC; Cambridge University Press: Cambridge, UK, 2024. [Google Scholar] [CrossRef]
- Gómez-Martín, M.B. Climate potential and tourist demand in Catalonia (Spain). Clim. Res. 2006, 33, 71–85. [Google Scholar] [CrossRef]
- Gómez-Martín, M.B.; Armesto-López, X.A.; Martínez-Ibarra, E. Tourists, weather and climate: Official tourism promotion websites as a source of information. Atmosphere 2017, 8, 255. [Google Scholar] [CrossRef]
- Scott, D.; Gössling, S. A review of research into tourism and climate change—Launching the Annals of Tourism Research Curated Collection on tourism and climate change. Ann. Tour. Res. 2022, 95, 103409. [Google Scholar] [CrossRef]
- Gössling, S.; Scott, D. Climate change and tourism geographies. Tour. Geogr. 2024, 27, 642–652. [Google Scholar] [CrossRef]
- De Freitas, C.R. Tourism climatology: Evaluating environmental information for decision making and business planning in the recreation and tourism sector. Int. J. Biometeorol. 2003, 48, 45–54. [Google Scholar] [CrossRef]
- Matzarakis, A. Weather and Climate-Related Information for Tourism. Tour. Hosp. Plan. Dev. 2006, 3, 99–115. [Google Scholar] [CrossRef]
- Scott, D.; Lemieux, C. Weather and Climate Information for Tourism. Procedia Environ. Sci. 2010, 1, 146–183. [Google Scholar] [CrossRef]
- Milošević, D.; Trbić, G.; Savić, S.; Popov, T.; Ivanišević, M.; Marković, M.; Ostojić, M.; Dunjić, J.; Fekete, R.; Garić, B. Biometeorological conditions during hot summer days in diverse urban environments of Banja Luka (Bosnia and Herzegovina). Geogr. Pannon. 2022, 26, 29–45. [Google Scholar] [CrossRef]
- Malinović-Milićević, S. Biometeorological Conditions of Urban and Suburban Areas in Bosnia and Herzegovina. Theor. Appl. Climatol. 2023, 153, 697–708. [Google Scholar] [CrossRef]
- Pecelj, M. Human bioclimatology—Bioclimatic indices UTCI and PET in the context of climate change—Example of Banja Luka. In Natural Resources Management in a Changing Climate; Trbić, G., Popov, T., Mirjanić, D., Eds.; Academy of Sciences and Arts of the Republic of Srpska: Banja Luka, Bosnia and Herzegovina, 2023; pp. 401–424. [Google Scholar]
- Đurđević, D.; Vasić, M.; Ogrin, M.; Savić, S.; Milošević, D.; Dunjić, J.; Šećerov, I.; Žgela, M.; Boras, M.; Herceg Bulić, I.; et al. Long-Term Assessment of Bioclimatic Conditions at Micro and Local Scales in the Cities of the Western Part of the Balkan Peninsula during the 21st Century. Sustainability 2023, 15, 15286. [Google Scholar] [CrossRef]
- Lin, T.P.; Matzarakis, A. Tourism climate and thermal comfort in Sun Moon Lake, Taiwan. Int. J. Biometeorol. 2008, 52, 281–290. [Google Scholar] [CrossRef]
- Zaninović, K.; Matzarakis, A. The bioclimatological leaflet as a means conveying climatological information to tourists and the tourism industry. Int. J. Biometeorol. 2009, 53, 369–374. [Google Scholar] [CrossRef]
- Pobrić, A.; Banda, A.; Sivac, A. City Break Tourism in Bosnia and Herzegovina—Case Study of Sarajevo and Mostar. In Proceedings of the International Tourism and Hospitality Management Conference (ITHMC), Sarajevo, Bosnia and Herzegovina, 30 September–4 October 2015; pp. 378–384. [Google Scholar] [CrossRef]
- Federal Office of Statistics. Herzegovina-Neretva Canton in Figures 2024. Sarajevo, Bosnia and Herzegovina. 2024. Available online: https://fzs.ba/wp-content/uploads/2024/06/hercegovacko-neretvanskii.pdf (accessed on 8 May 2025).
- Agency for Statistics of Bosnia and Herzegovina. Census of Population, Households and Dwellings in Bosnia and Herzegovina, 2013: Final Results; Agency for Statistics of BiH: Sarajevo, Bosna i Hercegovina, 2016; Available online: http://www.statistika.ba/?show=12&id=11410 (accessed on 9 May 2025).
- Avdić, B.; Sivac, A.; Mirić, R.; Avdić, A. Tourism regions of Bosnia and Herzegovina—vernacular, landscape and historical differentiation. Geogr. Pregl. 2022, 46, 57–74. [Google Scholar] [CrossRef]
- UNESCO World Heritage Centre. Old Bridge Area of the Old City of Mostar (World Heritage List No. 946). Available online: https://whc.unesco.org/en/list/946/ (accessed on 16 June 2025).
- Gaberli, Y.C. Touristic value of Mostar Bridge: An exploratory research. Sos. Bilim. Metinleri 2024, 2024, 152–167. [Google Scholar] [CrossRef]
- Bidžan-Gekić, A.; Gekić, H.; Pirić, A. Herzegovina tourism region. Geogr. Pregl. 2022, 46, 72–74. [Google Scholar]
- Federal Hydrometeorological Institute of Bosnia and Herzegovina. Meteorological Data for Mostar: Climatological Averages 1961–1990; FHMZ BiH: Sarajevo, Bosna i Hercegovina, 2025. Available online: https://www.fhmzbih.gov.ba/ (accessed on 19 May 2025).
- Walter, H.; Lieth, H. Klimadiagram-Weltatlas; VEB Gustav Fischer Verlag: Jena, Germany, 1960. [Google Scholar]
- Пoпoв, Т.; Гњатo, С.; Трбић, Г. Трендoви индекса екстремних температура у Бoсни и Херцегoвини—примјер Мoстара (Trends of Extreme Temperature Indices in Bosnia and Herzegovina—The Case of Mostar). Herald 2017, 1, 21. [Google Scholar] [CrossRef][Green Version]
- Popov, T.; Gnjato, S.; Trbić, G. Changes in Precipitation over the East Herzegovina Region. Bull. Serb. Geogr. Soc. 2019, 99, 29–44. [Google Scholar] [CrossRef]
- Popov, Т.; Gnjato, S.; Bajić, D.; Trbić, G. Spatial patterns of precipitation in Bosnia and Herzegovina. J. Geogr. Inst. Jovan Cvijic SASA 2019, 69, 185–195. [Google Scholar] [CrossRef]
- Trbić, G.; Popov, T.; Djurdjevic, V.; Milunovic, I.; Dejanovic, T.; Gnjato, S.; Ivanisevic, M. Climate change in Bosnia and Herzegovina according to climate scenario RCP8.5 and possible impact on fruit production. Atmosphere 2022, 13, 1. [Google Scholar] [CrossRef]
- VDI. VDI/DIN—Handbuch Reinhaltung der Luft. Band 1b. Environmental Meteorology, Methods for the Human-Biometeorological Evaluation of Climate and Air Quality for the Urban and Regional Planning at Regional Level—Part I: Climate; VDI: Düsseldorf, Germany, 1998. [Google Scholar]
- Höppe, P. The physiological equivalent temperature—A universal index for the biometeorological assessment of the thermal environment. Int. J. Biometeorol. 1999, 43, 71–75. [Google Scholar] [CrossRef] [PubMed]
- Fiala, D.; Lomas, K.J.; Stohrer, M. Computer prediction of human thermoregulatory and temperature responses to a wide range of environmental conditions. Int. J. Biometeorol. 2001, 45, 143–159. [Google Scholar] [CrossRef]
- Chen, Y.C.; Matzarakis, A. Modified physiologically equivalent temperature—Basics and applications for western European climate. Theor. Appl. Climatol. 2018, 132, 1275–1289. [Google Scholar] [CrossRef]
- Matzarakis, A. Transfer of climate data for tourism applications—The Climate-Tourism/Transfer-Information-Scheme. Sustain. Environ. Res. 2014, 24, 273–280. [Google Scholar]
- Matzarakis, A.; Rutz, F.; Mayer, H. Modelling Radiation Fluxes in Simple and Complex Environments—Basics of the RayMan Model. Int. J. Biometeorol. 2010, 54, 131–139. [Google Scholar] [CrossRef]
- Malinović-Milićević, S.; Micić, J.; Denda, S.; Stanojević, G.; Petrović, M.D. Intensification of thermal risk in a changing climate: Findings from prominent tourism destinations along the eastern Adriatic coast. Int. J. Biometeorol. 2025, 69, 157–175. [Google Scholar] [CrossRef]
- Lemesios, I.; Varotsos, K.V.; Georgopoulou, E.; Sarafidis, Y.; Kapetanakis, D.; Mirasgedis, S.; Gakis, N.; Giannakopoulos, C. Effects of Climate Change on the Future Attractiveness of Tourist Destinations in Greece. Atmosphere 2024, 15, 1185. [Google Scholar] [CrossRef]
- Savić, S.; Milovanović, B.; Milošević, D.; Dunjić, J.; Pecelj, M.; Lukić, M.; Ostojić, M.; Fekete, R. Thermal assessments at local and micro scales during hot summer days: A case study of Belgrade (Serbia). Időjárás 2024, 128, 121–141. [Google Scholar] [CrossRef]
- Kutlu, D.; Kasalak, M.A.; Bahar, M. Assessing Climate Change Impacts on Outdoor Recreation: Insights from Visitor and Business Perspectives. Sustainability 2025, 17, 3400. [Google Scholar] [CrossRef]
- Miljković, J.; Vujičić, M.; Kovačić, S.; Pivac, T.; Kliček, T. Guiding the Future: What Generation Z Expects from Tourist Guides. J. Geogr. Inst. “Jovan Cvijić” SASA 2025, 75, 87–103. [Google Scholar] [CrossRef]
- Težak Damijanić, A.; Pičuljan, I.; Ilak Peršurić, A.S. Stakeholders’ Experiences with Participative Approach in Tourism. J. Geogr. Inst. “Jovan Cvijić” SASA 2023, 73, 93–108. [Google Scholar] [CrossRef]
Disclaimer/Publisher’s Note: The statements, opinions and data contained in all publications are solely those of the individual author(s) and contributor(s) and not of MDPI and/or the editor(s). MDPI and/or the editor(s) disclaim responsibility for any injury to people or property resulting from any ideas, methods, instructions or products referred to in the content. |
© 2025 by the authors. Licensee MDPI, Basel, Switzerland. This article is an open access article distributed under the terms and conditions of the Creative Commons Attribution (CC BY) license (https://creativecommons.org/licenses/by/4.0/).