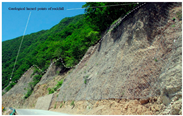
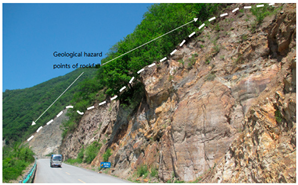
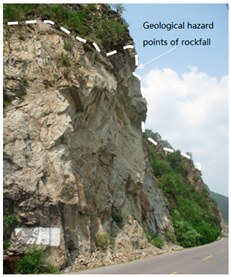
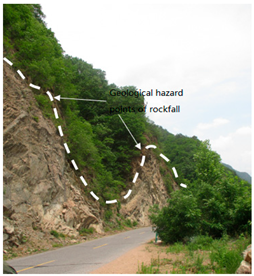
Article

Dynamic Risk Assessment of Collapse Geological Hazards on Highway Slopes in Basalt Regions During Rainy Seasons

1
School of Computer Science, Huainan Normal University, Huainan 232038, China
2
College of Exploration and Geomatics Engineering, Changchun Institute of Technology, Changchun 130021, China
*
Author to whom correspondence should be addressed.
Atmosphere 2025, 16(8), 978; https://doi.org/10.3390/atmos16080978
Submission received: 20 July 2025 / Revised: 13 August 2025 / Accepted: 14 August 2025 / Published: 17 August 2025
(This article belongs to the Section Climatology)

Abstract

Anchored in the four-factor theory of natural hazard risk, this study presents a dynamic risk assessment of collapse geological hazards (CGHs) using the S3K highway slope in Changbai Korean Autonomous County, China, as a case study. Building on previous research, the methodological framework consists of three sequential stages: (1) critical indicators for CGHs in basalt regions are identified, with iron-staining anomalies—a hallmark of such terrains—innovatively integrated as a slope stability metric; (2) a system dynamics (SD) model is developed in Vensim to quantify dynamic feedback mechanisms, focusing on the “rock weathering–rainfall triggering–slope instability” nexus, and time-varying parameters are introduced to enable monthly-scale risk prediction; and (3) a 500 m × 500 m grid system is established using ArcGIS 10.4, and a computer program is developed to achieve SD-GIS coupling and calculate grid parameters. The information value method is then employed to determine risk thresholds, thereby completing CGH risk assessment and prediction. The results indicate that over the next five years, high-risk areas will exhibit spatial agglomeration when monthly rainfall exceeds approximately 130 mm (July and August). Conversely, when monthly rainfall is below around 60 mm, the entire region will display low or no risk. Model simulations reveal that risks during the rainy season over the next five years will exhibit insignificant variability, prompting simplification of the resultant cartography. Field validation corroborates the robustness of the model. This research overcomes the primary limitations of conventional static assessment models by improving the dynamic predictability and the applicability to basalt terrains. The integrated SD-GIS framework presents a novel methodological paradigm for dynamic CGH risk analysis and offers support for the formulation of targeted disaster mitigation strategies.

1. Introduction

In recent years, the incidence of rainfall-induced geological hazards (e.g., slope collapses) has exhibited an upward trend, largely attributed to climate change [1,2]. Collapse geological hazards (CGHs) pose significant threats to human life and property [3]. Risk refers to the possibility of an adverse event occurring [4]. The accurate and efficient risk assessment of CGHs is crucial for formulating effective disaster prevention and mitigation strategies that safeguard people’s lives and property and promote sustainable development [5].
Natural hazard risk assessments can be classified as either qualitative or quantitative [6,7]. In recent years, advancements have been made in risk assessment technologies and methods for slope-related geological hazards. This includes research on deep learning models based on multi-source data coupling [8,9], studies on multiphysical field coupling and numerical simulation [10,11], and advancements in dynamic monitoring and early warning [12,13,14].
Due to the inherent complexity of slope geological hazard systems [15,16], research efforts face numerous challenges, including the early identification of potential hazards [17] and difficulties in clarifying interactions among the multiple influencing factors within complex systems [18]. System dynamics (SD) allows for the elucidation of hazard evolution mechanisms, while Geographic Information Systems (GISs) enable the efficient integration of multi-source spatial data. The synergy of these two methodologies can overcome current limitations and enhance assessment accuracy and reliability [19]. However, previous studies have merely employed SD to analyze the sensitivity of landslides to rainfall [19], falling short of achieving the depth required for disaster risk assessment. Furthermore, relevant studies have also failed to adequately address the causal relationships within the complex system of rainfall and disaster risks, which constitutes a bottleneck for dynamic risk research [20]. This highlights the need for further exploration.
In this research, a case study on the S3K highway slope section in Changbai Korean Autonomous County, China (Changbai County), is conducted. The selection of this site was based on two main considerations. First, as a representative of global basalt regions, research on CGHs in this area holds practical implications [21]. Second, the highway section is located near the county town, where slope fracturing is severe and many potential CGH locations exist. Notably, this region contains as many as 86 identified collapse hazard points, with prior studies having yielded interim results. Furthermore, the personnel involved possess a comprehensive understanding of this field, which facilitates both the implementation of fieldwork for the present study and the accurate validation of its findings [22,23]. More importantly, research on this region can offer valuable insights for slope hazard risk assessment and disaster prevention/control in basalt areas.
The four-factor theory of natural disaster risk composition determines disaster risk levels through the dynamic coupling of four elements: hazard of hazard-forming factors (e.g., disaster intensity and frequency), exposure of affected entities (e.g., quantity and distribution of impacted population and economy), vulnerability (i.e., susceptibility of exposed entities, encompassing physical and social dimensions), and disaster prevention and mitigation capacity (e.g., response capacities in technology and management) [24]. This theory exhibits advantages including systematicity, dynamic adaptability, refined outcomes, and guiding significance for disaster prevention and mitigation. In this study, this theory is applied to analyze key indicators of CGH risk in basalt regions, with the slope along the S3K highway adopted as a case study. An SD model was developed in Vensim, and quantitative risk prediction and assessment were conducted using a GIS. Distinct from previous studies, this research is the first to integrate iron-staining anomalies—a characteristic feature of basalt formations [23]—as a slope stability indicator within the SD model. The model quantifies the dynamic feedback mechanism linking rock weathering, rainfall triggering, and slope instability. Furthermore, spatial gridding (500 m × 500 m) is employed to achieve monthly-scale risk prediction and assessment with high spatial resolution, addressing the inherent limitations of traditional models in capturing short-term risk dynamics. The findings provide a valuable reference for researchers in related domains.

2. Methodology

2.1. Research Area and Data

Changbai County is in the southeast region of Jilin Province, China, at the southern foot of Changbai Mountain on the right bank of the upper reaches of the Yalu River (127°12′20″–128°18′10″ E and 41°21′41″–41°58′02″ N). It is the most important Quaternary volcanic rock area in China, covering an area of 2497.6 km2. This region mainly comprises mountains; its topography is complex, and it has high terrain in the northeast and low terrain in the southwest. The region exhibits uneven spatial precipitation distribution: the multi-year average precipitation near Tianchi Lake in the Changbai Mountains (northeastern part) exceeds 1000 mm, while that in the central and eastern regions is approximately 700 mm annually. Seasonal precipitation variations are substantial with distinct periodicity, as rainy-season precipitation accounts for over 60% of the annual total precipitation. Rivers in the region belong to the Yalu River system, with five tributaries exceeding 10 km in length. The valley bottoms are deeply incised, and the streamflow is swift. The S3K section is at the northern side of the Yalu River, where the slope rock mass exhibits high iron content. Within this region, collapse hazard points are relatively clustered, and their occurrence is significantly influenced by rainfall. The study area is illustrated in Figure 1 [23].

2.2. Data Sources

This study integrates more data. The socioeconomic data were provided by the Juhui Data Network “https://population.gotohui.com” (accessed on 13 August 2025) and the Agricultural Professional Knowledge Service Network “http://www.agri.cn/sj/” (accessed on 13 August 2025). A time series of Landsat 8 images was provided by the Geospatial Data Cloud “https://www.gscloud.cn” (accessed on 13 August 2025). High-resolution RS images, 1:10,000 topographic maps, land use data, meteorological data, regional geological maps, highway traffic maps, and administrative area maps were collected from government departments. The data sources are detailed in Table 1.

2.3. Theoretical Basis

The hazard, exposure, vulnerability, and emergency response and recovery capability are the four elements of natural hazard risk (cf. Figure 2) [24]. These elements form a complex adaptive system in which each factor interacts with others—a network of relationships that can be effectively captured within the SD model [19].
The SD model is mainly composed of state variables (level, L), rate variables (rate, R), and auxiliary variables (A) [25,26]. Causal relationships between system elements can be established through them to achieve the research purpose.
The state variable (it is represented by “Atmosphere 16 00978 i001”, accumulated or depleted via flows, thereby reflecting the cumulative outcomes of past system behaviors, and stands as the core determinant of the system’s future evolutionary trends) can be expressed as
L = L 0 + 0 t ( R 1 R 2 ) d t
where R1 is the initial flow velocity, R2 is the final flow velocity, and L0 is the initial value of L.
The rate variable equation during the KL period is given by
R . K L = f ( L . K , C )
where R is the rate variable representing the speed at which the state variable changes per unit time (it is represented by “Atmosphere 16 00978 i002” in the SD model, determines the rate at which state variables increase or decrease, and acts as a pivotal factor that connects distinct state variables and drives the system’s dynamic changes), K and L, respectively, represent the present and future moments, and C is the initial value of the state variable.
Auxiliary variables are used to connect potential relationships and simplify the mathematical formulation of the underlying complex rate equations. They can be used to decompose the rate equation into several independent equations.
Guided by the four-element theory of disasters, this study was executed through a systematic process encompassing indicator analysis, data acquisition and processing, SD modeling, and GIS integration, with its engineering workflow depicted in Figure 2.

2.4. Establishment of the SD Model

Collapse hazards are fundamentally a result of gravitational erosion [27,28], with rainfall serving as a major triggering factor for slope collapses [29]. This process is primarily driven by the mass migration of rock and soil masses on slopes under hydraulic forces [24].
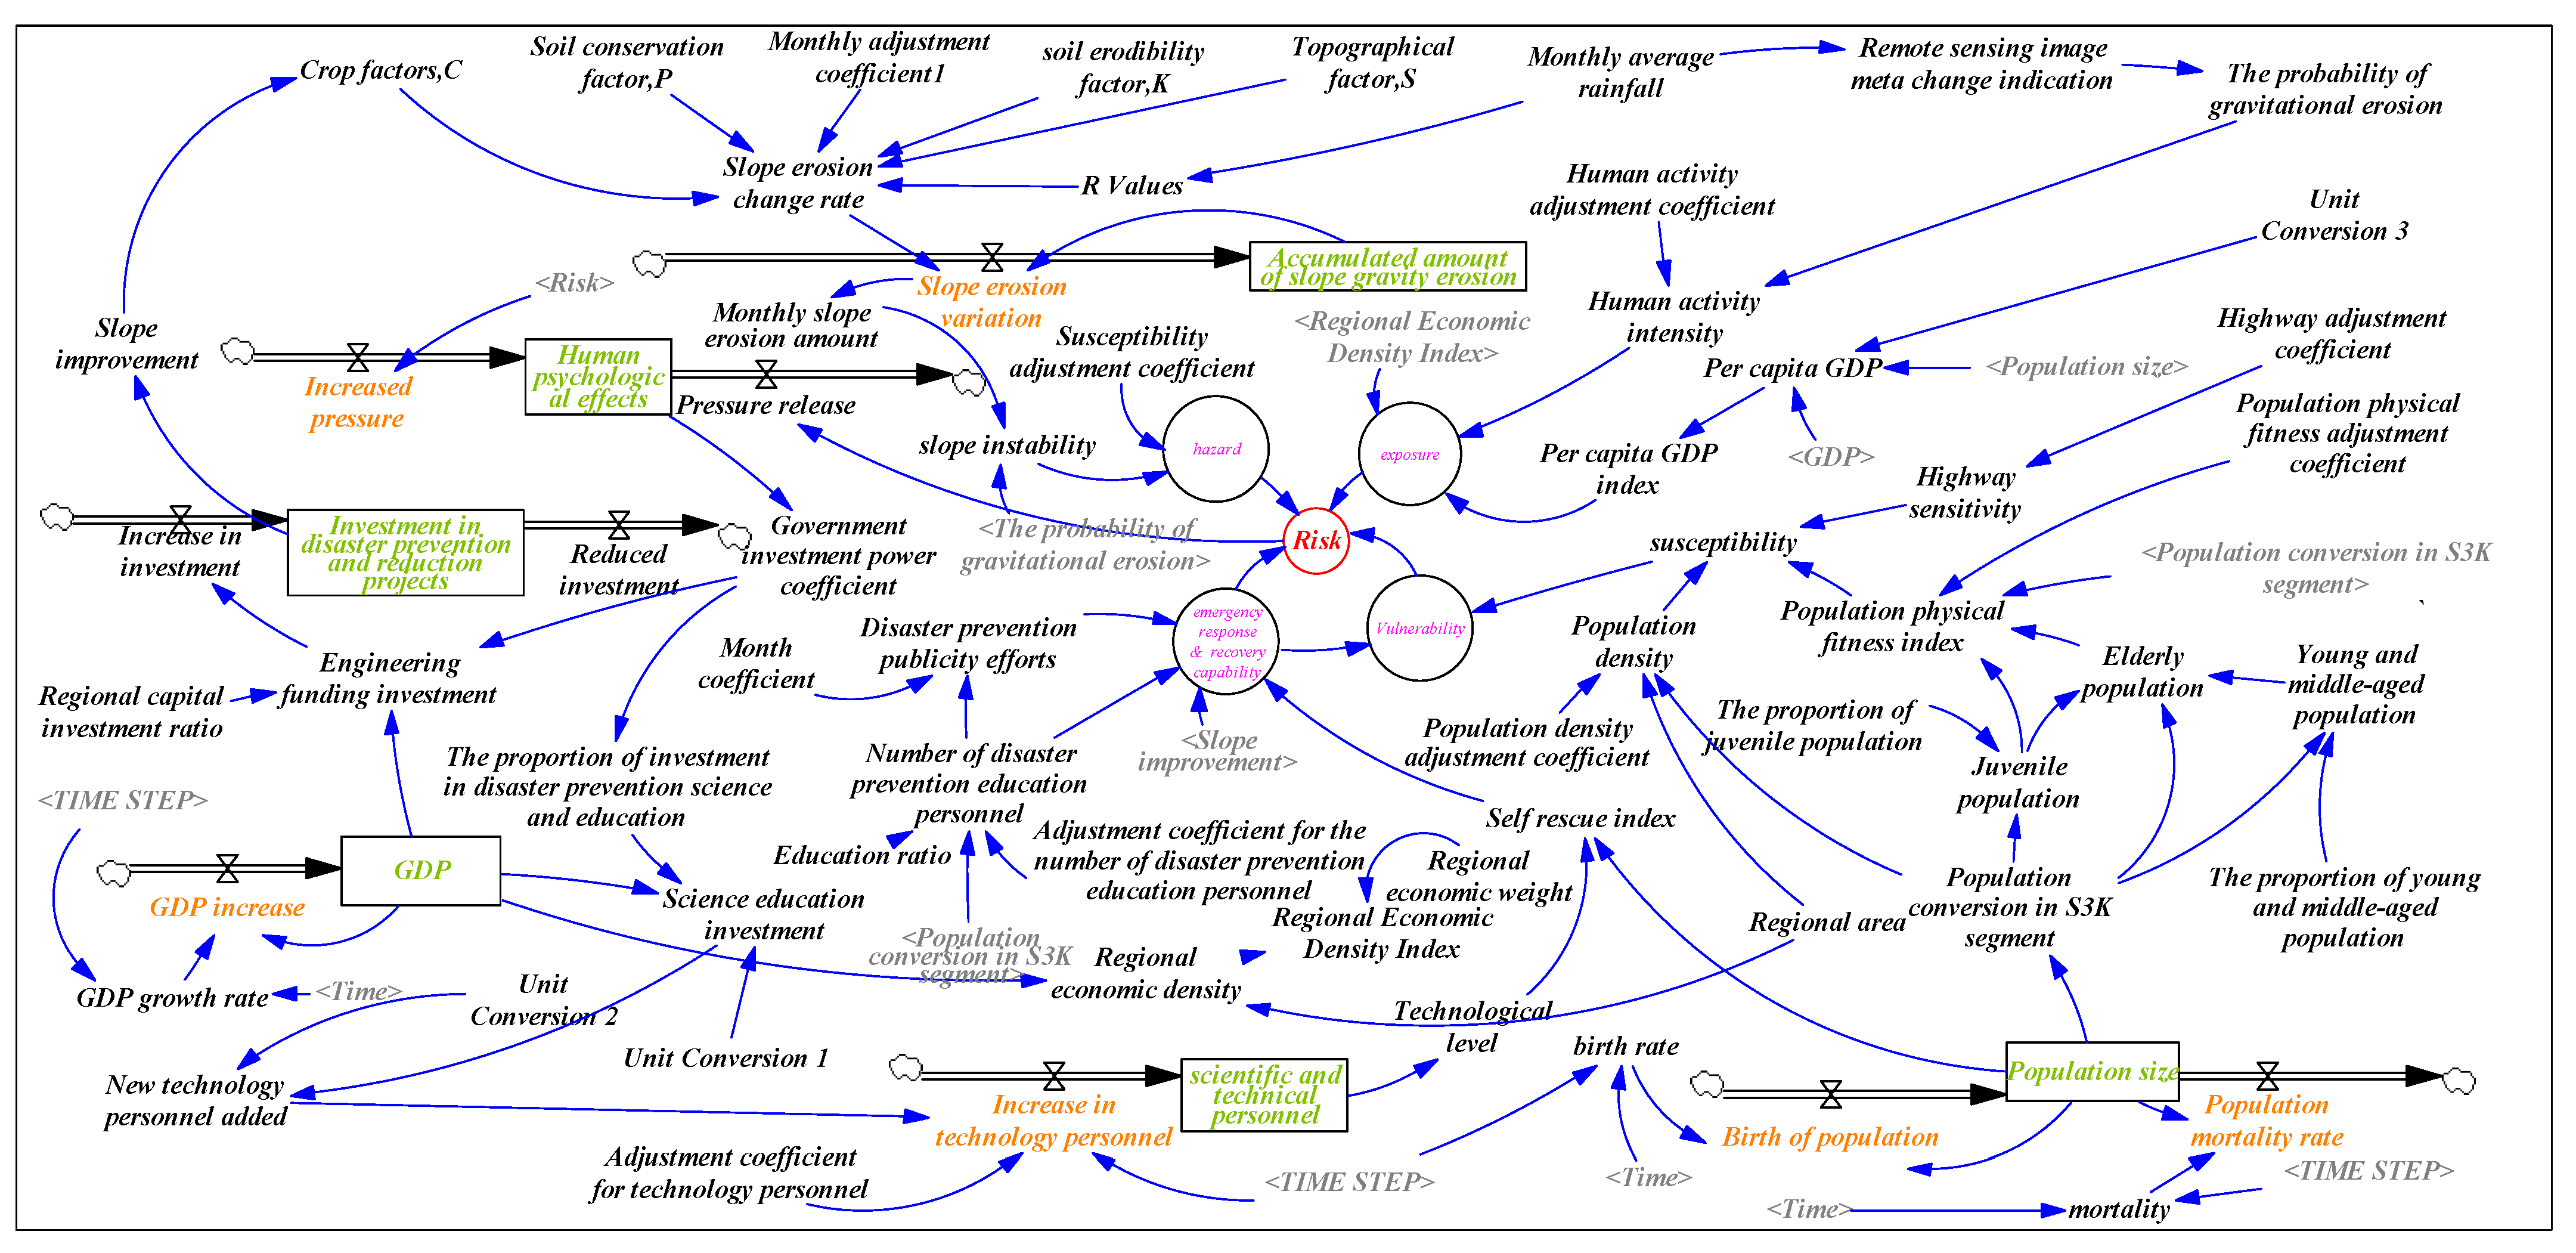
Hazard risk is influenced by a combination of natural, social, economic, and environmental factors [30]. Natural hazard vulnerability comprises three core components: risk resistance, sensitivity, and physical exposure. The highway sensitivity index, an important parameter in this context, varies depending on the highway classification. The index is dimensionless and ranges from 0 to 1 [31]. The paper sets this value to 0.8 based on the highway type and level of the S3K section. The exposure parameter accounts for both the population and infrastructure [32]. The population size is represented by the level of outdoor activity, which varies by month and reflects seasonal and temporal dynamics. Infrastructure exposure is estimated based on regional economic density and the number of highways in the study area [33], while economic exposure is quantified by the regional economic density index [34]. The indicators of emergency response and recovery capability include the self-rescue ability index of residents, the per capita gross domestic product (GDP), and the regional evacuation vulnerability index.
Building on prior research outcomes [23,35,36], the hazard-formative environment and slope stability were incorporated as auxiliary variables in the model, with basalt iron-staining anomalies during the rainy season serving as a key indicator. The resulting SD model is depicted in Figure 3.

2.5. Basis for Calculating Important Parameters of the SD Model

The ARIMA model was utilized to estimate parameters for population, GDP, and rainfall (Table 2) embedded within the SD model. Specifically, population and GDP trends for the next five years were projected using two decades of historical data from the study area, while rainfall trends were forecasted based on a 60-year historical dataset. These estimates were saved in an Excel spreadsheet to facilitate seamless integration with subsequent modeling processes.
Within the model, the physical fitness and self-rescue indices of the population were calculated based on the proportions of young and elderly residents in the Baishan Municipal Government area, using Equations (3) and (4). The parameters in the equations are self-explanatory and require no further elaboration.
Population   Physical   Fitness   Index = ( 1 Youth   population + Elderly   population Total   population ) × 100 %
Self   rescue   index = Number   of   people   who   have   the   ability   to   save   themselves Total   population   × 100 %
According to statistics from government authorities, the annual investment in geological hazard prevention and control in the region is approximately CNY 3.5 million. This figure served as the basis for determining the hazard prevention input parameters within the model.
The gravity erosion of the slope was computed using the Universal Soil Loss Equation (USLE), which is given by the following:
A = R × K × L × S × C × P
where A represents the amount of slope erosion due to gravity (tons/hectare/year); R is the rainfall erosivity factor (t·h/MJ·mm); K is the soil erodibility factor; L is the slope length (dimensionless); S is the terrain factor (dimensionless); C is the crop cover factor (dimensionless); and P is the soil and water conservation factor (dimensionless).
The empirical formula proposed by Wischmeier [36] was used to calculate R:
R = i = 1 12 1.735 × 10 1.5 × lg p i 2 p 0.8188
where P and p i are, respectively, the average annual and monthly rainfall totals (mm).
Informed by national soil erodibility (K-factor) statistics for China [37] and further calibrated using a combination of in situ field experiments and prior empirical studies [24], the K values used in this study range from 0.3 to 0.5. The crop cover factor (C) was computed as follows [38,39]:
C = 0.992 × e 0.0344 × N D V I N D V I min N D V I max N D V I min
The Normalized Difference Vegetation Index (NDVI) was derived by interpreting Landsat 8 remote sensing images using ENVI 5.3 software. The values were extracted into grid-based Excel format using ArcGIS 10.4, enabling seamless data access for program execution.
The terrain factor (S) was calculated using the slope length (L) and gradient ( θ ), as follows [39]:
S = L 22 0.3 θ 5.16 1.3
L was calculated as
L = DEM sin ( s l o p e × π 180 )
where DEM represents the digital elevation model and slope represents the gradient. Both the slope gradient and L were calculated using ArcGIS 10.4 software.
The soil and water conservation factor (P) was determined using the method presented in previous research [40,41].
Parameters R, C, S, and L in the above Equation (5) can be readily computed via relevant software (ArcGIS, ENVI), and their computational procedures are not elaborated herein. The probability of gravity erosion was computed as follows [42]:
P S / B = p ( S / B ) p ( S ) = N p i x S B N p i x ( B )
where N p i x S B represents the number of pixels within rock mass B that have undergone gravity erosion, and N p i x ( B ) represents the total number of pixels in rock mass B within the study area.
Regional slope stability in basalt areas, characterized by a high iron content [43,44], was assessed using a combination of multi-spectral and high-resolution satellite remote sensing imagery in conjunction with artificial neural networks (ANNs). Iron-staining anomalies served as indicators of slope instability. This approach primarily focuses on quantifying the development and extent of slope fractures under varying spatiotemporal contexts, with the key calculation formula presented in Equation (11).
P ( k , t , l ) = ( 1 + ( ln γ ) α ) × p ANN ( k , t , l ) × Ω k t × c o n ( s k t ) )
where P ( k , t , l ) represents the transition probability of the L-th type of slope fragmentation for geotechnical mass k at time t; 1 + ( ln γ ) α is a random factor; p ANN ( k , t , l ) is the conversion probability for the slope fragmentation type as calculated by the trained ANN; Ω k t is the neighborhood development density within a defined neighborhood window; and c o n ( s k t ) is the conversion suitability between two fragmentation types (with values of 0 and 1 representing convertible and non-convertible states, respectively) [24].
Slope stability varies with rainfall amount (Table 2). To save manuscript space and for clarity, we selected the slope stability under 130 mm and 60 mm rainfall and plotted the corresponding diagrams (Figure 4). For the simulated slope stability data, raster values were extracted at the grid-cell scale and saved in Excel for access by computer programs.

3. Simulation and Risk Assessment

3.1. Computer Simulation Program Design

To account for spatial environmental variations, each grid cell in the study area was assigned site-specific environmental parameters. The parameter data computed in Section 2.4 were stored in Excel format and linked to individual grid cells via unique ID numbers. Given the inefficiency of manually computing each grid cell, a custom Python 3.8 program was developed using the PySD 3.14.3 module. IronPython 2.7 served as the interface to integrate the SD model into ArcGIS 10.4 via C#, enabling the automated execution of all computational tasks for this study.

3.2. Risk Mapping

Following model testing and validation (including verifying whether the model conforms to the “four-factor” theoretical framework, checking for missing parameters, validating parameter units and the model’s correctness using VensimDSS 5.6 software, and conducting sensitivity tests of the model to rainfall), the information volume model stipulated in the Specification for Geological Hazard Risk Investigation and Evaluation (1:50,000): “https://gi.mnr.gov.cn/202302/P020230210569168439297.pdf” (accessed on 13 August 2025) was employed to delineate risk thresholds. Based on the simulation results, grid cells were categorized into four risk levels: high-risk areas had values exceeding 0.8; medium-risk areas had values ranging from 0.5 to 0.8; low-risk areas had values ranging from 0.3 to 0.5; and areas with values below 0.3 were designated as no-risk areas.
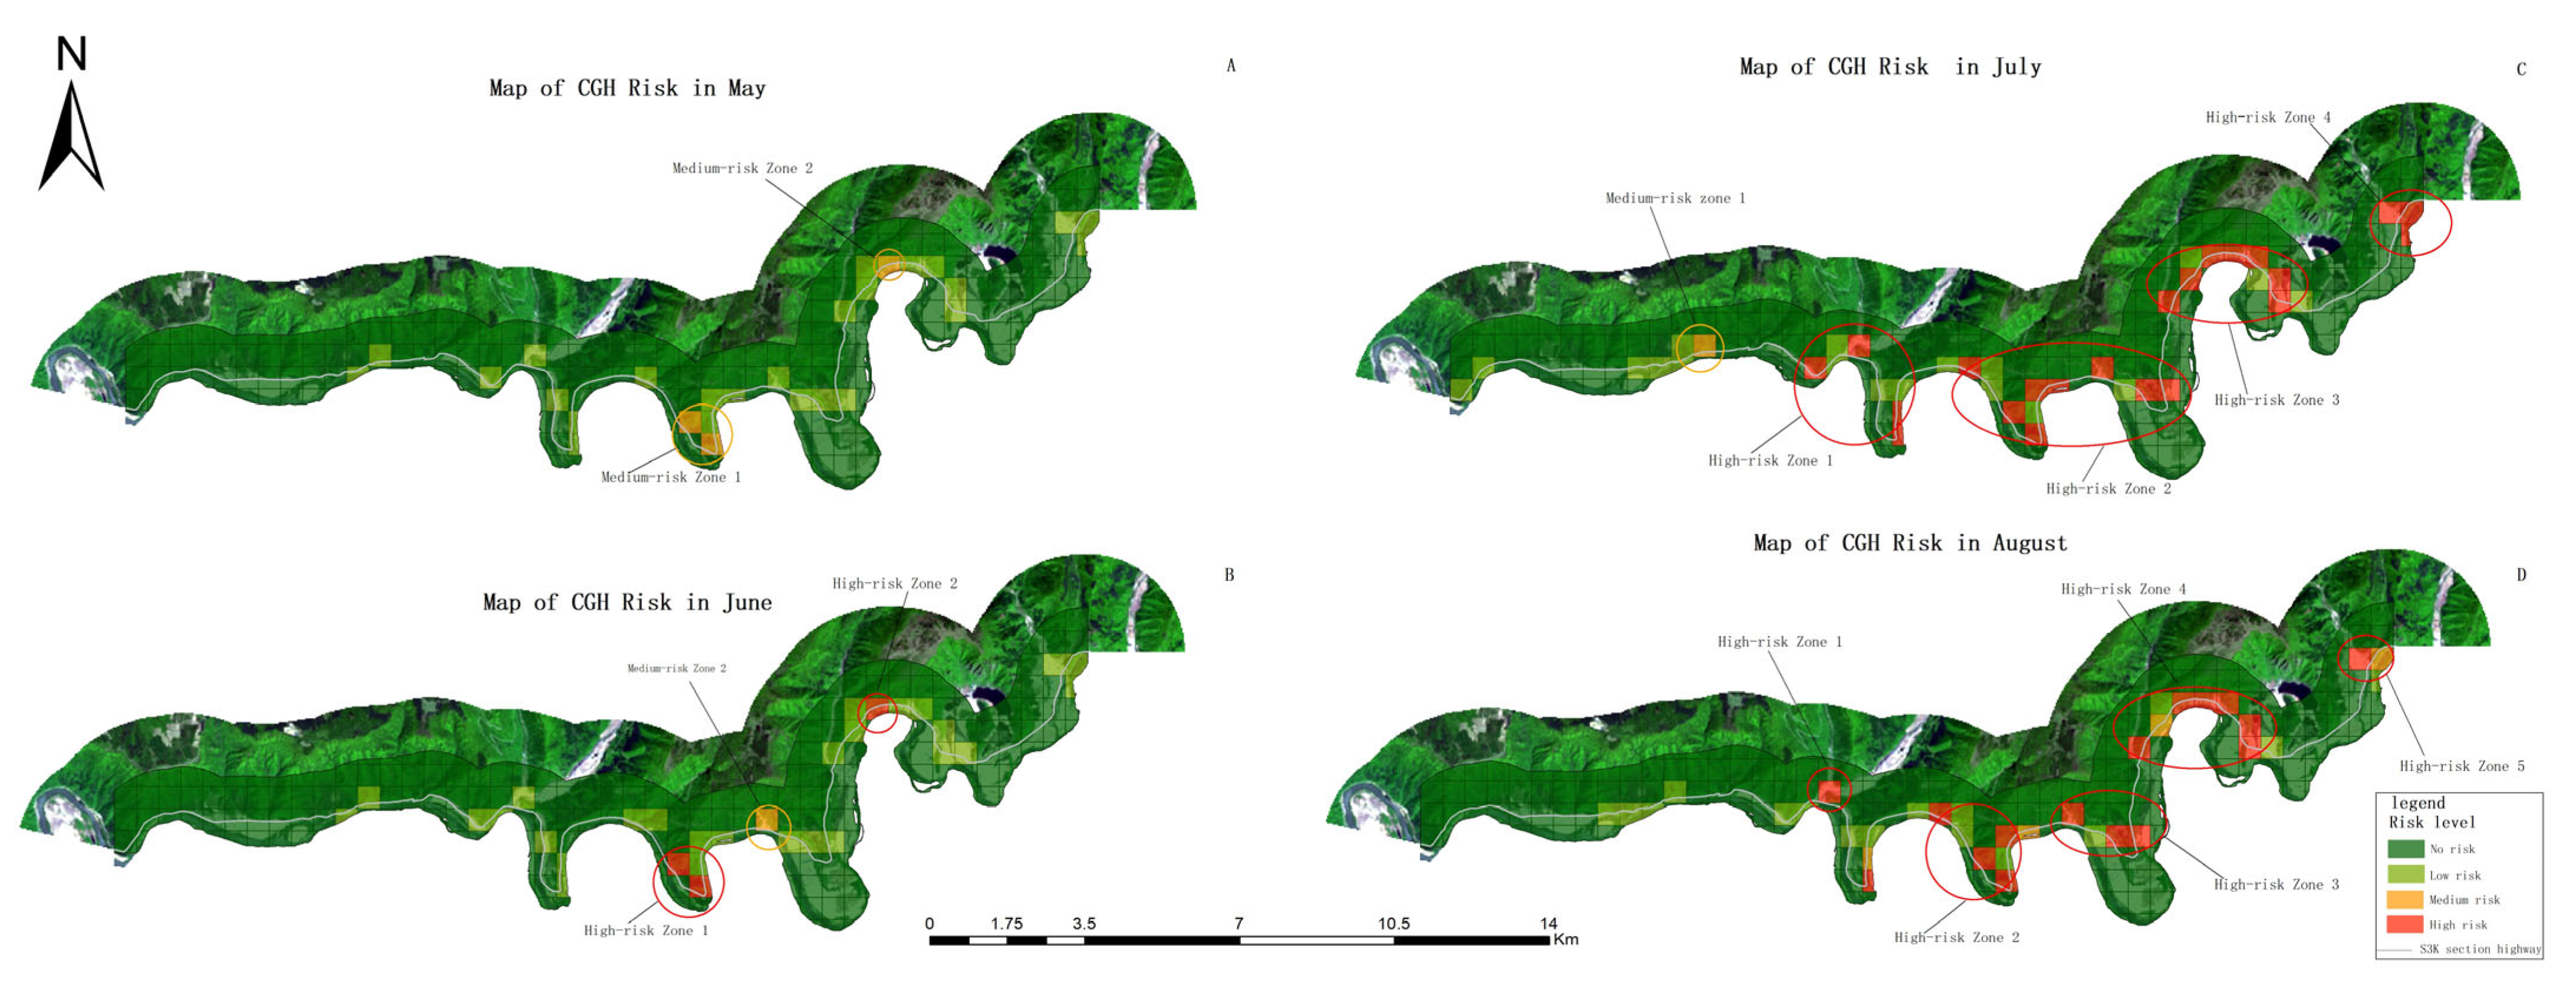
A five-year risk prediction of CGHs in the study area was conducted. The statistical results for different risk levels are presented in Table 3, while the field survey data are provided in Table 4. A corresponding spatial risk distribution map is presented in Figure 5.

4. Results and Discussion

The findings of this study are as follows:
(1) Temporal dynamics of risk: The risk of CGHs in the study region escalates in tandem with increasing precipitation levels from May to August, peaking notably in July and August. Road segments traversing Lengzigou Village, Jiguanlazi Village, and Anle Village exhibit extreme risk during these months. Field investigations, consistent with previous research, confirm that the slopes in these segments are severely weathered and structurally destabilized due to meteorological influences [24]. From September to April, the risk across the entire region remains low, underscoring the pivotal role of rainfall in driving slope gravitational erosion.
(2) Predictability of future risks: The simulation results reveal that, beginning in 2026, numerous segments, particularly those between Lenggouzi Village, Jiguanlazi Village, and Anle Village, will display heightened CGH risks during the rainy season. To prevent disasters, both slope engineering interventions and monitoring for high-risk road segments should be intensified.
(3) Pronounced spatial clustering and recurrence of risks: Although CGH risk levels are contingent on seasonal rainfall volumes, the spatial clustering and recurrence of risks, particularly along the road segment from Lenggouzi Village to Jiguanlazi Village, are apparent. This arises from inherent variations in geological conditions (e.g., lithology, tectonics) across spatial domains, defined as “geological heterogeneity”. Meteorological factors, via their differential influences, further exacerbate such spatial disparities. Upon the occurrence of meteorological triggering events, concentrated collapses manifest in pre-weakened zones that have already been altered by meteorological processes, converting originally dispersed geological weaknesses into well-defined “disaster clusters”. The findings of this study align with this theoretical framework [45], providing certain guidance for disaster prevention and mitigation.
(4) Dynamic risk feedback mechanisms are explicitly captured: For instance, iron-staining anomalies—a hallmark of basalt weathering in this region—reflect the extent of chemical weathering in basaltic rock masses. Such weathering weakens rock integrity (Equation (11)) and reduces shear strength, thereby lowering the threshold for slope instability. Our findings indicate that rainfall exceeding 100 mm enhances the rainfall erosivity factor (Equation (6)), accelerating surface runoff and infiltration. The infiltrated water not only lubricates fracture surfaces but also elevates pore water pressure, exacerbating gravitational erosion (Equation (5)). The road segment from Lenggouzi Village to Jiguanlazi Village, characterized by steep slopes, amplifies the kinetic energy of rock–soil mass movement, converting potential geological weaknesses into active hazard points and giving rise to heightened risks during the rainy season.
In conclusion, this study advances CGH risk assessment across three critical dimensions—dynamics, spatial precision, and applicability to basalt terrains—with explicit comparisons to the existing literature to underscore its innovations:
(A)
Advancements in dynamic risk assessment.
Traditional risk assessment models, such as that developed by Lee et al. [19], have focused narrowly on landslide sensitivity to rainfall. Their approach integrated rainfall duration, cumulative rainfall, and geospatial data to derive a dynamic susceptibility index yet remained confined to qualitative susceptibility mapping, lacking quantification of core risk components (e.g., exposure, vulnerability). Their findings indicated that rainfall significantly elevated landslide susceptibility but failed to capture temporal variations in hazard-forming processes (e.g., seasonal rock weathering) or socioeconomic exposure (e.g., monthly fluctuations in population activity).
In contrast, this study moves beyond mere sensitivity analysis to comprehensive risk assessment by embedding time-varying parameters within an SD model. Specifically, we incorporated monthly rainfall erosivity (calculated via Equation (6)) to reflect dynamic weathering intensity and seasonal data on population outdoor activity to quantify temporal shifts in exposure. This integration enables monthly-scale risk prediction, capturing short-term risk surges triggered by rainfall. Such capability is critical for real-time early warning systems.
(B)
Improvements in spatial precision.
Previous studies [9,19,23], while engaging with issues within the domain of slope hazard risk, lacked comprehensive risk assessment, and their delineation of risk theoretical boundaries remained ambiguous. In contrast, grounded in the theory of the four elements constituting disaster risk, we established a 500 m × 500 m grid and clarified the dynamic mechanisms of the disaster risk system, and the resultant Figure 4 illustrates these characteristics. This methodological approach holds certain reference value for professionals in the field.
This study was limited to highway slopes in basalt regions, and future research should verify the universality of the model in loess and granite areas. Due to the limited time span of available data, the long-term prediction accuracy of the model requires further validation. Furthermore, the present study did not investigate CGHs under extreme rainfall conditions, which is an issue to be addressed in our subsequent research.

5. Conclusions

This paper presented a comprehensive risk assessment of CGHs using an SD framework, taking the S3K highway slope in Changbai Korean Autonomous County as a case study. Grounded in the four-factor theory of natural hazard risk formation, SD and a GIS were integrated, and causal relationships between indicators were constructed. This approach revealed the intricate interdependencies between factors contributing to CGH risk, thereby facilitating the revelation of the underlying mechanisms driving hazard risks. This approach provides a novel perspective and addresses the current limitations in the application of SD within this domain.
This research provides practitioners and policymakers with a more precise dissection of dynamic risks, empowering them to devise more targeted and effective disaster prevention strategies. Furthermore, the interdisciplinary nature of the research methodology can serve as a paradigm for future inquiries in this domain, fostering the integration of diverse technologies to tackle complex environmental challenges. This study contends that a well-refined systems model is pivotal for advancing the prediction, monitoring, and holistic management of CGHs. As such, the methodological framework adopted herein may serve as a valuable reference for relevant stakeholders.

Author Contributions

L.Q.: writing—original draft, project administration, and funding acquisition. P.Z.: investigation and writing—review and editing. Z.L.: investigation and data curation. All authors have read and agreed to the published version of the manuscript.

Funding

This research was funded by the Research Project of Higher Education Institutions in Anhui Province, China (No. 2024AH051743).

Institutional Review Board Statement

Not applicable.

Informed Consent Statement

Not applicable.

Data Availability Statement

The underlying data can be downloaded from the following websites: https://population.gotohui.com; http://www.agri.cn/sj/; and https://www.gscloud.cn. Some data, being confidential, are available upon request from the authors, with the aim of collectively advancing research in the field of disaster risk.

Acknowledgments

We would like to express our special gratitude to the Jilin Branch of the China National Geological Exploration Center of Building Materials Industry for their substantial support during the field investigations.

Conflicts of Interest

The authors declare no conflicts of interest.

References

  1. Wu, S.; Xu, C.; Ma, J.; Gao, H. Escalating risks and impacts of rainfall-induced geohazards. Nat. Hazards Res. 2025, in press. [Google Scholar] [CrossRef]
  2. de Souza, D.C.; Crespo, N.M.; da Silva, D.V.; Harada, L.M.; de Godoy, R.M.P.; Domingues, L.M.; Luiz, R.; Bortolozo, C.A.; Metodiev, D.; de Andrade, M.R.M.; et al. Extreme rainfall and landslides as a response to human-induced climate change: A case study at Baixada Santista, Brazil, 2020. Nat. Hazards 2024, 120, 10835–10860. [Google Scholar] [CrossRef]
  3. Zhang, X.; Zhang, M.; Liu, X.; Terfa, B.K.; Nam, W.-H.; Gu, X.; Zhang, X.; Wang, C.; Yang, J.; Wang, P.; et al. Review on the progress and future prospects of geological disasters prediction in the era of artificial intelligence. Nat. Hazards 2024, 120, 11485–11525. [Google Scholar] [CrossRef]
  4. Zhang, G. Principles and Methods of Natural Disaster Risk Assessment and Zoning; China Meteorological Press: Beijing, China, 2014; pp. 16–17. [Google Scholar]
  5. Yu, P.; Dong, J.; Hao, H.; Xie, Y.; Zhang, H.; Wang, J.; Zhu, C.; Guan, Y.; Yu, H. Risk Assessment and Prevention Planning for Collapse Geological Hazards Considering Extreme Rainfall—A Case Study of Laoshan District in Eastern China. Land 2023, 12, 1558. [Google Scholar] [CrossRef]
  6. Aubrecht, C.; Özceylan, D.; Steinnocher, K.; Freire, S. Multi-level geospatial modeling of human exposure patterns and vulnerability indicators. Nat. Hazards 2013, 68, 147–163. [Google Scholar] [CrossRef]
  7. Sun, R.; Gao, G.; Gong, Z.; Wu, J. A review of risk analysis methods for natural disasters. Nat. Hazards 2020, 100, 571–593. [Google Scholar] [CrossRef]
  8. Lai, J.-S.; Tsai, F. Improving GIS-Based Landslide Susceptibility Assessments with Multi-temporal Remote Sensing and Machine Learning. Sensors 2019, 19, 3717. [Google Scholar] [CrossRef]
  9. Hussain, M.A.; Chen, Z.; Zheng, Y.; Zhou, Y.; Daud, H. Deep Learning and Machine Learning Models for Landslide Susceptibility Mapping with Remote Sensing Data. Remote Sens. 2023, 15, 4703. [Google Scholar] [CrossRef]
  10. Saha, S.; Majumdar, P.; Bera, B. Deep learning and benchmark machine learning based landslide susceptibility investigation, Garhwal Himalaya (India). Quat. Sci. Adv. 2023, 10, 100075. [Google Scholar] [CrossRef]
  11. Moos, C.; Bontognali, Z.; Dorren, L.; Jaboyedoff, M.; Hantz, D. Estimating Rockfall and Block Volume Scenarios Based on a Straightforward Rockfall Frequency Model. Eng. Geol. 2022, 309, 106828. [Google Scholar] [CrossRef]
  12. Monisha, P.J.; Obaid, S.; Madhavan, S.; Sivagami, S.; Saranya, N.N. Landslide Detection and Early Warning System Using Extended Kalman Filter with Convolutional Neural Networks Based Long Short-Term Memory. In Proceedings of the 2024 International Conference on Integrated Intelligence and Communication Systems (ICIICS), Kalaburagi, India, 22–23 November 2024; pp. 1–5. [Google Scholar] [CrossRef]
  13. Wei, L.; Xu, Y.; Lv, D.; Cui, H.; Liu, S.; Ao, M. Rockfall susceptibility assessment in Kuandian County (Northeast. China) by combining information content method and analytic hierarchy process. Bull. Eng. Geol. Environ. 2024, 83, 240. [Google Scholar] [CrossRef]
  14. Yan, D.; Zhang, H.; Xie, M.; Jiang, Y.; Li, S.; Liu, J. Review on the monitoring and early warning technology of large-scale unstable rock collapse. Adv. Eng. Sci. 2024, 56, 10–23. [Google Scholar] [CrossRef]
  15. Lei, Y.; Huang, J.; Cui, Y.; Jiang, S.H.; Wu, S.; Ching, J. Time capsule for landslide risk assessment. Georisk Assess. Manag. Risk Eng. Syst. Geohazards 2023, 17, 613–634. [Google Scholar] [CrossRef]
  16. Zhan, Q.; Wang, S.; Wang, L.; Guo, F.; Zhao, D.; Yan, J. Analysis of Failure Models and Deformation Evolution Process of Geological Hazards in Ganzhou City, China. Front. Earth Sci. 2021, 9, 731447. [Google Scholar] [CrossRef] [PubMed]
  17. van Westen, C.; van Asch, T.; Soeters, R. Landslide hazard and risk zonation—Why is it still so difficult? Bull. Eng. Geol. Environ. 2006, 65, 167–184. [Google Scholar] [CrossRef]
  18. Fu, X.; Yang, Y.; Wang, M.; Zhang, Z. Advances in modeling, assessment, and prevention of geotechnical and geological disasters. Front. Earth Sci. 2022, 10, 999365. [Google Scholar] [CrossRef]
  19. Lee, J.J.; Song, M.S.; Yun, H.S.; Yum, S.G. Dynamic landslide susceptibility analysis that combines rainfall period, accumulated rainfall, and geospatial information. Sci. Rep. 2022, 12, 18429. [Google Scholar] [CrossRef]
  20. Mihailović, D.T.; Malinović-Milićević, S. A Novel Approach to Understanding the Complexity of Precipitation. Atmosphere 2025, 16, 706. [Google Scholar] [CrossRef]
  21. Fan, Q.; Sui, J.; Wang, T.; Li, N.; Sun, Q. Eruption history and magma evolution of the trachybasalt in the Tianchivolcano, Changbaishan. Acta Petrol. Sin. 2006, 22, 1449–1457. Available online: https://geology.nju.edu.cn/CN/abstract/abstract8560.shtml (accessed on 13 August 2025).
  22. Wang, Y. Stability Analysis and Control Engineering of Landslide in S3k Section of Yangjiang Highway in Changbai County, Jilin. Master’s Thesis, Jilin University, Changchun, China, 2017. Available online: http://cdmd.cnki.com.cn/Article/CDMD-10183-1018000028.htm (accessed on 13 August 2025).
  23. Qian, L.; Zang, S.; Man, H.; Sun, L.; Wu, X. Determination of the Stability of a High and Steep Highway Slope in a Basalt Area Based on Iron Staining Anomalies. Remote Sens. 2023, 15, 3021. [Google Scholar] [CrossRef]
  24. Zhang, J.Q.; Okada, N.; Tatano, H. Integrated natural disaster risk mangement comprehensive and integrated model and Chinese strategy choice. J. Nat. Disasters 2006, 15, 29–37. [Google Scholar] [CrossRef]
  25. Zhong, Y.; Jia, X.; Qian, Y. Frontiers and Applications of System Dynamics; Science Press: Beijing, China, 2016. [Google Scholar]
  26. Zhu, Q.; Jia, R.; Xu, X.; Feng, L. System Dynamics Modeling and Reserch on Theory and Application of Feedback Loop Analysis; Economic & Management Publishing House: Beijing, China, 2022. [Google Scholar]
  27. Jiang, X.D.; Hou, T.S.; Guo, S.L.; Chen, Y. Influence of cracks on loess collapse under heavy rainfall. CATENA 2023, 223, 106959. [Google Scholar] [CrossRef]
  28. Jones, J.N.; Boulton, S.J.; Stokes, M.; Bennett, G.L.; Whitworth, M.R. 30-year record of Himalaya mass-wasting reveals landscape perturbations by extreme events. Nat. Commun. 2021, 12, 6701. [Google Scholar] [CrossRef] [PubMed]
  29. Qian, L.; Zang, S. Differentiation Rule and Driving Mechanisms of Collapse Disasters in Changbai County. Sustainability 2022, 14, 2074. [Google Scholar] [CrossRef]
  30. Ge, Q.S.; Zou, M.; Zheng, J.Y. Integrated Assessment of Natural Disaster Risks in China; Cience Press: Beijing, China, 2008; pp. 102–122. [Google Scholar]
  31. Li, Z.; Nadim, F.; Huang, H.; Uzielli, M.; Lacasse, S. Quantitative Vulnerability Estimation for Scenario-based Landslide Hazards. Landslides 2010, 7, 125–134. Available online: https://link.springer.com/article/10.1007/s10346-009-0190-3 (accessed on 13 August 2025). [CrossRef]
  32. Di Felice, P. Ranking of Assets with Respect to Their Exposure to the Landslide Hazard: A GIS Proposal. ISPRS Int. J. Geo-Inf. 2020, 9, 326. [Google Scholar] [CrossRef]
  33. Zhang, M.; Tang, Y. Risk investigation method and practice of geohazard. Geol. Bull. China 2008, 27, 1205–1216. Available online: http://dzhtb.cgs.cn/article/id/20080816 (accessed on 13 August 2025).
  34. Lollino, P.; Pagliarulo, R.; Trizzino, R.; Santaloia, F.; Pisano, L.; Zumpano, V.; Fazio, N.L. Multi-scale approach to analyse the evolution of soft rock coastal cliffs and role of controlling factors: A case study in South-Eastern Italy. Geomat. Nat. Hazards Risk 2021, 12, 1058–1081. [Google Scholar] [CrossRef]
  35. Zhao, F.; Miao, F.; Wu, Y.; Ke, C.; Gong, S.; Ding, Y. Refined landslide susceptibility mapping in township area using ensemble machine learning method under dataset replenishment strategy. Gondwana Res. 2024, 131, 20–37. [Google Scholar] [CrossRef]
  36. Wischmeier, W.H.; Smith, D.D. Predicting Rainfall Erosion Losses—A Guide to Conservation Planning; Science and Education Administration, United States Department of Agriculture: Washington, DC, USA, 1978; Available online: https://xueshu.baidu.com/usercenter/paper/show?paperid=ce79cdb85a57324b5f094b598fadfb78 (accessed on 13 August 2025).
  37. Zhao, Y.; Tian, Z.; Liang, Y.; Zhao, Y. Changing trend of soil erodibility factor based on two national mappings of it. Sci. Soil. Water Conserv. 2024, 22, 146–151. [Google Scholar] [CrossRef]
  38. Zhang, Y.; Liu, B.; Shi, P.; Jiang, Z. Crop cover factor estimating for soil loss prediction. Acta Ecol. Sin. 2001, 21, 1050–1056. Available online: https://www.ecologica.cn/stxb/article/abstract/010702?st=search (accessed on 13 August 2025).
  39. Thakuriah, G. GIS-based revised universal soil loss equation for estimating annual soil erosion: A case of lower Kulsi basin, India. SN Appl. Sci. 2023, 5, 81. [Google Scholar] [CrossRef]
  40. Lu, J.; Chen, X.; Li, H.; Liu, H.; Xiao, J.; Yin, J. Soil erosion changes based on GIS/RS and USLE in Poyang Lake basin. Trans. Chin. Soc. Agric. Eng. 2011, 27, 337–344. Available online: https://xueshu.baidu.com/usercenter/paper/show?paperid=0eadd6fad631e015e3eb84d2e14b3ba0&site=xueshu_se (accessed on 13 August 2025).
  41. Xu, X.Q.; Fan, H.M.; Tan, J.; Jia, Y.; Wu, M. Comparison of Practice Values of Soil and Water Conservation Measures Under the Condition of Snow Melting and Rainfall Erosion. Res. Soil. Water Conserv. 2017, 24, 29–38. Available online: http://stbcyj.paperonce.org/oa/DArticle.aspx?type=view&id=20170306 (accessed on 13 August 2025).
  42. Li, J. A Study on Regional Gravitation Erosion Hazrad Based on RS and GIS. Ph.D. Thesis, Chinese Academy of Sciences, Beijing, China, 2006. [Google Scholar]
  43. Ahmad, M.; Ansari, M.K.; Singh, T.N. Instability investigations of basaltic soil slopes along SH-72, Maharashtra, India. Geomat. Nat. Hazards Risk 2013, 6, 115–130. [Google Scholar] [CrossRef]
  44. Liu, X.; Chen, X.; Su, M.; Zhang, S.; Lu, D. Stability Analysis of a Weathered-Basalt Soil Slope Using the Double Strength Reduction Method. Adv. Civ. Eng. 2021, 2021, 6640698. [Google Scholar] [CrossRef]
  45. Wang, Y.; Wang, H.; Cui, P.; Chen, D.; Tang, J.; Ou, T.; Hao, J.; Wang, J.; Zhang, G.; Lei, Y.; et al. Disaster effects of climate change and the associated scientific challenges. Sci. Bull. 2024, 69, 286–300. [Google Scholar] [CrossRef]
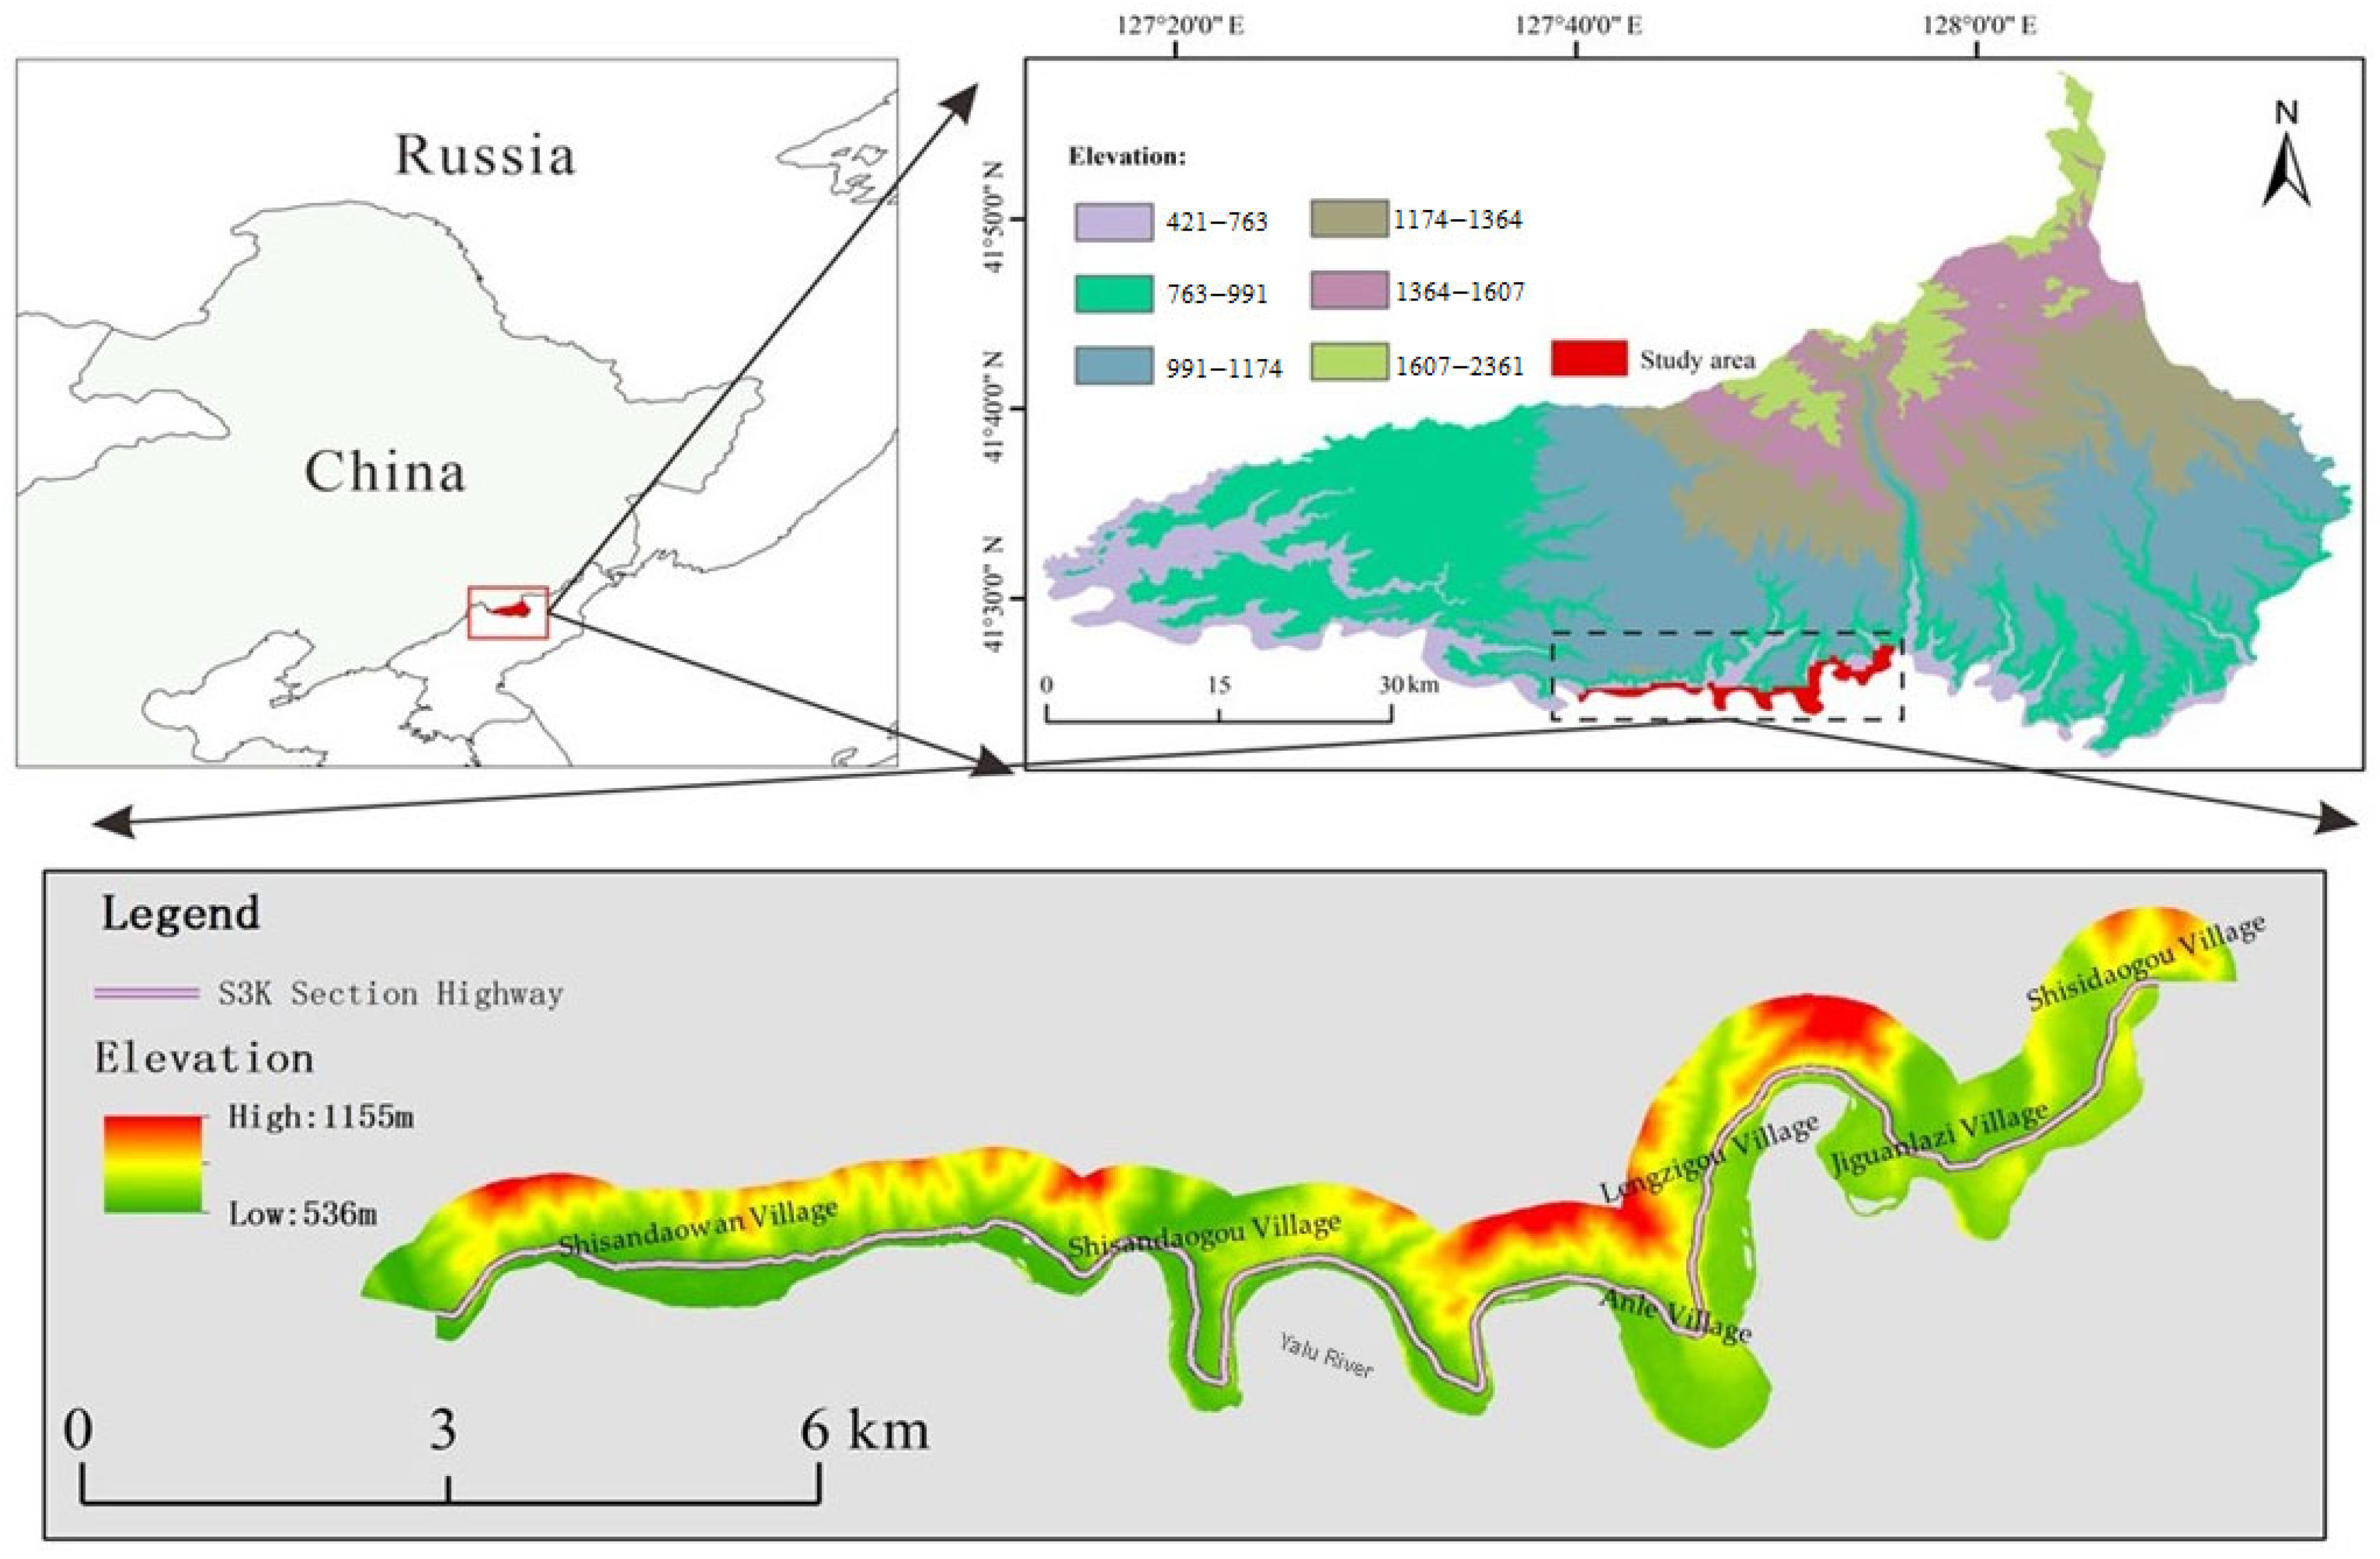
Figure 1. Map overview and location of the S3K section.
Atmosphere 16 00978 g001
Figure 2. Framework for CGH risk assessment and prediction process.
Atmosphere 16 00978 g002
Figure 3. The SD model for the risk assessment of CGHs.
Atmosphere 16 00978 g003
Figure 4. Schematic diagram of slope stability simulation under varying rainfall amounts.
Atmosphere 16 00978 g004
Figure 5. The spatiotemporal distribution of CGH risk in the S3K highway section. Notes: ① The entire region remains at extremely low risk or no risk in January, February, March, April, September, October, November, and December. As these months have limited analytical significance, no risk maps were generated for them. ② The zone numbers correspond to the risk levels listed in Table 1. ③ For detailed information on the regional field survey, refer to Reference [24]. ④ This study focuses on short-term forecasting. Simulation results indicate that rainy season risk values show minimal variations over the next five years. For brevity, the figures are simplified in presentation. ⑤ Regional names mentioned in the Discussion are referenced in Figure 1.
Atmosphere 16 00978 g005
Table 1. Data sources and descriptions of their applications.
Data TypesInformation Mining of Key Parameters in the SD Model
Socioeconomic dataIt is used to calculate GDP, population, income level, scientific research level, education, etc., as shown in Equations (3) and (4).
RS imagesFor slope stability studies; they involve the calculation of parameter C (Equation (7)), etc.
Topographic The overview is shown in Figure 1, including the determination of S and L (Equations (8) and (9)) and the calculation of slope stability.
Land use dataIt involves calculating slope stability, conducting exposure analysis and research, and determining parameter P.
Meteorological dataTo calculate the important parameters of slope erosion, see Equation (5). Additionally, it is used for research on the exposure of hazard-bearing bodies.
Regional geological mapsThey are applied to slope stability analysis.
Highway trafficIt is applicable to the highway sensitivity index.
Administrative area mapsThey are used in the calculation and statistics of processes.
Notes: All the SD parameters, except dimensionless data, are in SI units.
Table 2. Monthly average rainfall forecast data during the rainy season.
YearMonthRainfall (mm)YearMonthRainfall (mm)YearMonthRainfall (mm)
2026568.02028568.42030568.9
685.4689.2688.7
7167.27167.17166.9
8137.28135.78134.2
953.5952.7952.0
2027568.22029568.6
687.9687.7
7167.27167.0
8136.48134.9
953.1952.4
Table 3. The risk levels of the slope in the S3K highway section.
Risk LevelMonthSpatial LocationTownship to Which it BelongsCorresponding Grid Number
Low risk or no risk1,2,3,4, 9,10,11,12------
Medium-risk Zone 15127°49′12″ E, 41°24′51″ NAnle Village201,254
Medium-risk Zone 2127°52′21″ E, 41°26′47″ NLenggouzi Village929
Medium-risk Zone 16127°50′38″ E, 41°25′24″ NAnle Village403
High-risk Zone 1127°49′12″ E, 41°24′51″ NAnle Village201,254
High-risk Zone 2127°52′21″ E, 41°26′47″ NLenggouzi Village929
Medium-risk Zone 17127°44′10″ E, 41°25′36″ NShisandaowan Village474
High-risk Zone 1127°46′39″ E, 41°25′38″ NShisandaogou Village390,481
High-risk Zone 2127°50′38″ E, 41°25′24″ NAnle Village201,254,321,322,326,327,403
High-risk Zone 3127°52′23″ E, 41°26′47″ NThe section from Lenggouzi Village to Jiguanlazi Village699,811,815,704,929,930,931
High-risk Zone 4127°55′16″ E, 41°27′20″ NShisidaogou Village1056,1173,1174
High-risk Zone 18127°46′39″ E, 41°25′38″ NShisandaogou Village481
High-risk Zone 2127°49′12″ E, 41°24′51″ NAnle Village201,254,321,397
High-risk Zone 3127°51′21″ E, 41°25′8″ NAnle Village326,327,403
High-risk Zone 4127°52′21″ E, 41°26′47″ NThe section from Lenggouzi Village to Jiguanlazi Village174,196,197,704,815,931
High-risk Zone 5127°55′16″ E, 41°27′20″ NShisidaogou Village1173
Notes: ① The numbering and spatial locations of the regions are illustrated in Figure 4. ② Due to confidentiality and security requirements, the precision of longitude and latitude coordinates has been intentionally reduced. ③ The entire region remains in a state of low or no risk during January, February, March, April, September, October, November, and December.
Table 4. The field survey and verification of slope conditions.
Corresponding Grid NumberOn-Site Investigation SituationPhotoCorresponding Grid NumberOn-Site Investigation
Situation
Photo
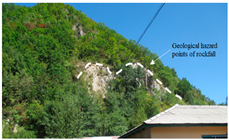
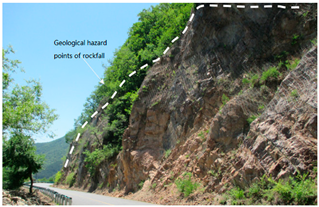
1173The slope has a height difference of 25 m, with an estimated volume of 9100 m3. The volume of debris accumulated at the foot of the slope is 11.88 m3. A collapse occurred in 2012, which posed a threat to both residents and the highway infrastructure. The designation of this area as high-risk during heavy rainfall periods is consistent with the research findings.Atmosphere 16 00978 i003811The slope height difference is about 15 m, and the predicted volume is 4800 m3. This is identified as a high-risk area.Atmosphere 16 00978 i004
704, 815, 929, 930A protective net has been installed on the slope; however, multiple areas have sustained damage. The predicted collapse volume is 26,000 m3, with an average weathered layer thickness of about 2 m and an unloading depth of about 1.2 m. The designation of this area as high-risk during heavy rainfall periods is consistent with the research findings.Atmosphere 16 00978 i005931The rock slope has a height difference of about 45 m, with a predicted volume of about 10,000 m3. Eight clustered disaster points have been identified within 1 km. This area is classified as high-risk.Atmosphere 16 00978 i006
390The height difference in the slope is about 20 m, with an estimated volume of 6100 m3. The structure is predominantly blocky, with an accumulation volume of about 9 m3. This condition poses a threat to the highway, resulting in a high-risk classification during the rainy season.Atmosphere 16 00978 i007474The predicted volume of unstable material is about 9000 m3. The top of the slope is unstable, and there is a risk of rockfall, posing a threat to the highway.Atmosphere 16 00978 i008
Notes: ① Due to space constraints, only a portion of the slope conditions is presented. ② The simulation results indicate moderate risk when the monthly average rainfall reaches 60 mm (May), as depicted in Figure 5A. High-risk zones emerge when monthly rainfall exceeds 100 mm (June), as shown in Figure 5B; when the monthly rainfall exceeds 120 mm, the high-risk areas increase significantly (July, August), as shown in Figure 5C,D. ③ The field survey results are consistent with the observations reported in a previous publication [24] regarding slope stability, corroborating the pronounced effect of rainfall on CGHs in this region during the rainy season. ④ Extreme rainfall events were not considered in this study. No anomalies were detected in the projected monthly average rainfall over the next five years, as computed via the ARIMA model.
Disclaimer/Publisher’s Note: The statements, opinions and data contained in all publications are solely those of the individual author(s) and contributor(s) and not of MDPI and/or the editor(s). MDPI and/or the editor(s) disclaim responsibility for any injury to people or property resulting from any ideas, methods, instructions or products referred to in the content.