Article

Seasonal Variations of Carbonaceous Aerosols of PM2.5 at a Coastal City in Northern China: A Case Study of Qinhuangdao

1
School of Resources and Civil Engineering, Northeastern University, Shenyang 110819, China
2
School of Resources and Materials, Northeastern University at Qinhuangdao, Qinhuangdao 066004, China
3
Department of Road and Bridge Engineering, Hebei Jiaotong Vocational and Technical College, Shijiazhuang 050000, China
*
Author to whom correspondence should be addressed.
Atmosphere 2025, 16(8), 960; https://doi.org/10.3390/atmos16080960
Submission received: 19 June 2025 / Revised: 6 August 2025 / Accepted: 8 August 2025 / Published: 12 August 2025
(This article belongs to the Section Air Quality and Health)

Abstract

Carbonaceous aerosols exert significant impacts on human health and climate systems. This study investigates the seasonal variations of carbonaceous components in fine particulate matter (PM2.5) in Qinhuangdao, a coastal city in northern China, throughout 2023. The mass concentrations of organic carbon (OC) and elemental carbon (EC) averaged 9.44 ± 4.57 μg m−3 and 0.84 ± 0.33 μg m−3, contributing 26.49 ± 8.74% and 2.81 ± 1.56% to total PM2.5, respectively. OC exhibited a distinct seasonal trend: winter (12.02 μg m−3) > spring (11.96 μg m−3) > autumn (8.15 μg m−3) > summer (5.71 μg m−3), whereas EC followed winter (1.31 μg m−3) > autumn (0.73 μg m−3) > spring (0.70 μg m−3) > summer (0.63 μg m−3). Both OC and EC levels were elevated at night compared to daytime. Secondary organic carbon (SOC), estimated via the EC-tractor method, constituted 37.94 ± 14.26% of total OC. A positive correlation between SOC/OC ratios and PM2.5 concentrations suggests that SOC formation critically influences haze events. In autumn and winter, SOC formation was higher at night, likely driven by aqueous-phase reactions, whereas in summer SOC formation was more pronounced during the day, likely due to enhanced photochemical reactions. Source apportionment analysis revealed that gasoline and diesel vehicles were major contributors to carbonaceous aerosols, accounting for 27.35–29.06% and 14.97–31.83%, respectively. Coal combustion contributed less (10.51–21.55%), potentially due to strict regulations prohibiting raw coal use for domestic heating in surrounding regions. Additionally, fugitive dust was found to have a high contribution to carbonaceous aerosols during spring and summer.

1. Introduction

Carbonaceous aerosols represent a critical component of atmospheric particulate matter, exerting significant impacts on air quality, human health, visibility, and climate systems [1,2,3,4,5]. These aerosols demonstrate approximately twice the toxicity of inorganic particles [4]. Over the past two decades, China has faced severe carbonaceous aerosol pollution [6,7]. These aerosols have constituted approximately 23–55% of the PM2.5 mass in urban areas of China [2,8], and in extreme cases they can constitute up to 90% of total aerosol mass [9].
Carbonaceous aerosols are chemically classified into organic carbon (OC) and elemental carbon (EC) based on distinct thermal–optical properties [1]. OC comprises both directly emitted primary OC (POC) from natural and anthropogenic sources and secondary OC (SOC) formed through atmospheric oxidation processes [10,11]. The OC fraction includes numerous hazardous compounds, notably polycyclic aromatic hydrocarbons [10,12]. Conversely, EC originates predominantly from incomplete combustion processes, significantly impacting visibility through light absorption and contributing to climate forcing [13,14].
In recent years, carbonaceous aerosol concentrations in China have decreased significantly due to the implications of stringent emission control measures [15,16,17,18]. For example, between 2013 and 2022, OC and EC mass concentrations in Beijing decreased by 5.8% yr−1 and 9.9% yr−1, at rates of 0.8 and 0.4 μg m−3 yr−1, respectively [16]. Similarly, in Zhengzhou, central China, OC and EC concentrations dropped by 53% and 76%, respectively, between 2011 and 2021 [17].
Previous studies have extensively characterized carbonaceous aerosols and reported significant geographic variations across China [2,15,19,20]. For instance, Zhao et al. revealed distinct spatial patterns, with carbonaceous aerosols contributing significantly more to PM2.5 in southern Chinese cities compared to northern regions, largely attributable to frequent dust events in northern areas [2]. The study further identified contrasting seasonal trends, demonstrating winter dominance in northern cities versus summer maxima in southern regions [2]. Cities reliant on coal combustion exhibited lower OC/EC ratios compared to cities with more diversified economies, indicating more severe primary pollution in the former [19]. A chemical analysis of PM2.5 at Shangdianzi, a regional background site, suggested that secondary formation processes (52%) were the largest sources of organic aerosols [15]. In contrast, carbonaceous aerosols in Lvliang, Shanxi Province, were mainly attributed to primary emissions [20].
Qinhuangdao is a coastal city situated at the northeastern boundary of the North China Plain (NCP), adjacent to the Bohai Sea [21]. Previous studies have investigated carbonaceous aerosol concentrations during autumn haze periods in Qinhuangdao [21], and Wang et al., analyzed the characteristics of carbonaceous aerosols during two severe dust events in spring [22]. However, limited research has explored the seasonal variations of carbonaceous aerosols. Although previous studies suggested that sea breeze influenced less in Qinhuangdao compared to the open coastal seas, their potential sources were not well resolved [21]. To address this knowledge gap, this study collected PM2.5 samples from Qinhuangdao in 2023, with the objective of analyzing the seasonal characteristics of carbonaceous aerosols and identifying their potential sources.

2. Materials and Methods

2.1. Sample Collection

PM2.5 samples were collected from the rooftop of a 15-story teaching building at Northeastern University in Qinhuangdao (N39°55′24.85″ E119°33′20.91″), as shown in Figure 1. The sampling site is approximately 2 km north of the coastal line and 0.8 km east of the West Ring Road. The surrounding area primarily consists of residential buildings and roads with typical traffic. No large emission sources, such as factories or coal-fired power plants, were located near the sampling site.
Quartz fiber filters (90 mm, Whatman QM-A) were used for sample collection. A medium-volume cascade active sampler (Laoying 2030; Qingdao Laoying Haina Photoelectric Environmental Protection Group Co., Ltd, Qingdao, China), operating at a flow rate of 100 L/min, was employed to collect PM2.5 samples twice daily, from 8:00 to 19:00 (daytime) and from 20:00 to 7:00 the next day (nighttime). Four sampling campaigns were conducted in 2023, yielding a total of 116 valid samples. Specifically, 26 samples were collected in spring (25 February–10 March 2023), 26 in summer (22 June–6 July 2023), 38 in autumn (14 October–2 September), and 26 in winter (24 December 2023–7 January 2024). Invalid samples, due to instrument failure (power off) or adverse weather conditions (rainy and snowy), were excluded from the analysis. The detailed sample information and corresponding meteorological conditions are shown in Table S1 and Figure S1.

2.2. Sample Analysis

The quartz fiber filters were pretreated in a muffle furnace at 600 °C for 4 h prior to sampling to eliminate any potential organic impurities. The filters were equilibrated at a temperature of 20 ± 1 °C and a relative humidity (RH) of 50 ± 5% for 24 h before being weighed both before and after sampling to determine the PM2.5 mass concentrations.
The mass concentrations of organic carbon (OC) and elemental carbon (EC) were measured using a Sunset Lab OC/EC analyzer (Model 5L, USA) following the NIOSH 5040 thermal–optical transmittance (TOT) method. Prior to analysis, a 1.0 × 1.5 cm section was cut from each quartz filter, and the instrument was calibrated with sucrose standards to ensure measurement accuracy. Approximately 10% of samples were randomly selected for duplicate analysis, with results showing less than 10% deviation between parallel measurements.
To account for potential background contamination, procedural blank filters were analyzed in parallel, and their average values were subtracted from the sample measurements. This quality control procedure, combined with the strict adherence to the NIOSH protocol, ensured the reliability of the obtained OC and EC concentration data.

2.3. Secondary Organic Carbon Estimation

POC and SOC concentrations were determined using the EC-tracer method, with the minimum OC/EC ratio serving as the key parameter for calculations [17,23]. It is well known that EC in the atmosphere primarily originates from combustion sources and is chemically stable [17,23]. The key assumption of this method is that the emission sources in the study region in each short periods remain relatively consistent, leading to a strong correlation between POC and EC [24]. The equation used for the calculation is as follows:
POC = EC × (OC/EC)min
SOC = OC − POC
where (OC/EC)min represents the ratio of OC to EC emitted by primary combustion sources. The minimum value of OC/EC in each season was selected as the (OC/EC)min, assuming that this value corresponds to periods dominated by primary emissions without significant secondary organic formation. Considering that the emissions sources may vary between day and night, and among different seasons, the minimum OC/EC ratio (OC/EC)min was selected separately for daytime and nighttime in each of the four seasons to account for diurnal variations in emissions and atmospheric conditions.

2.4. PMF Model

Positive Matrix Factorization (PMF), as recommended by the United States Environmental Protection Agency (USEPA), is a multivariate factor analysis tool based on a weighted least-squares fit, where the weights are derived from analytical uncertainties. This model does not require prior knowledge of source profiles and has no limitation on the number of sources, making it an effective receptor model for source apportionment. PMF has been widely utilized in studies concerning the source apportionment of PM2.5 [25,26,27,28,29]. Unlike some other receptor models, PMF does not require prior knowledge of source profiles and has no strict limitations on the number of potential sources, making it flexible and effective for complex environmental datasets.
The principle of PMF is to decompose the observed concentration matrix X i j (where i represents the sample index and j represents the species index) into two matrices, the source contribution matrix G i k and the source profile matrix F k j , along with a residual matrix E i j as shown in Equation (3):
X i j = k = 1 P G i k F k j + E i j
where:
p = number of factors (sources),
G i k = contribution of the k-th source to the i-th sample,
F k j = fraction of species j in the k-th source,
E i j = residual for species j in sample i.
The PMF model minimizes the objective function Q, defined as the sum of the squared residuals weighted by the uncertainties of each observation:
Q = i = 1 n j = 1 m E i j U i j 2
where:
U i j = uncertainty associated with the measurement of species j in sample i,
n = total number of samples,
m = total number of species
By minimizing Q, PMF adjusts G and F iteratively to find a solution that best represents the data structure while considering the measurement uncertainties. The estimation of analytical uncertainties for the filter-based measurements was calculated according to the following formular:
If the concentration is less than or equal to the method detection limit (MDL),
U n c = 5 6 × M D L
If the concentration is greater than the MDL used,
U n c = E r r o r   F r a c t i o n × c o n c e n t r a t i o n 2 + 0.5 × M D L 2
Unc is the uncertainties, ErrorFraction is set to 0.1 for carbonaceous aerosols.

3. Results and Discussions

3.1. Mass Concentrations of OC and EC

The mass concentrations of OC and EC across different seasons are presented in Table 1 and Figure 2 and Figure S2. The annual average mass concentration of OC was 9.27 ± 4.47 μg m−3, with the highest value recorded in winter (11.63 ± 4.78 μg m−3), followed by spring (11.81 ± 4.06 μg m−3), autumn (8.15 ± 3.70 μg m−3), and summer (5.71 ± 1.72 μg m−3). The annual average mass concentration of EC was 0.83 ± 0.33 μg m−3, with the highest concentration in winter (1.31 ± 0.29 μg m−3) and the lowest in summer (0.63 ± 0.08 μg m−3). Statistical analysis indicated significant seasonal variations of OC and EC as shown in Tables S2 and S3 at a significance of 0.05.
The carbonaceous aerosol concentrations during autumn in this study were comparable to those recorded in autumn 2021, with OC mass concentrations of 10.88 μg m−3 and EC mass concentrations of 0.68 μg m−3, as shown in Table 2 [21]. The OC mass concentrations in winter were slightly lower than those in winter 2016 (13.7 μg m−3), while the EC mass concentrations were significantly lower than those in winter 2016 (2.7 μg m−3) [30]. These results suggest a decreasing trend in carbonaceous aerosols over the past years, consistent with findings from other cities [15,16,17,18].
Table 1 also demonstrates that the mass concentrations of both OC and EC were higher in nighttime samples compared to daytime samples, especially in wintertime, which aligns with the mass concentrations of PM2.5, similar to previous studies [16]. This phenomenon can be attributed to low temperatures, weak solar radiation, and a stable atmospheric boundary layer, which contribute to the continuous accumulation of pollutants in the near-surface layer, resulting in maximum OC and EC values during the nighttime [10,31].
On average, OC mass concentrations were significantly higher than those of EC. The mass concentrations of OC and EC accounted for 25.93% and 2.53% of the total PM2.5 mass concentrations, respectively, as shown in Table 1. Notably, although the mass concentrations of OC were lower in summer than in other seasons, its proportion was highest, accounting for 33.73% of the total PM2.5 mass concentrations, which were consistent with a previous study in Handan City, Hebei province [32]. In contrast, the proportion of OC in spring (19.61%) was the lowest, despite high mass concentrations of OC being observed. This discrepancy may be attributed to the abundance of dust in spring, which contains less carbonaceous aerosols compared with inorganic crustal elements [19,22].

3.2. Correlations Between OC and EC, and SOC Estimation

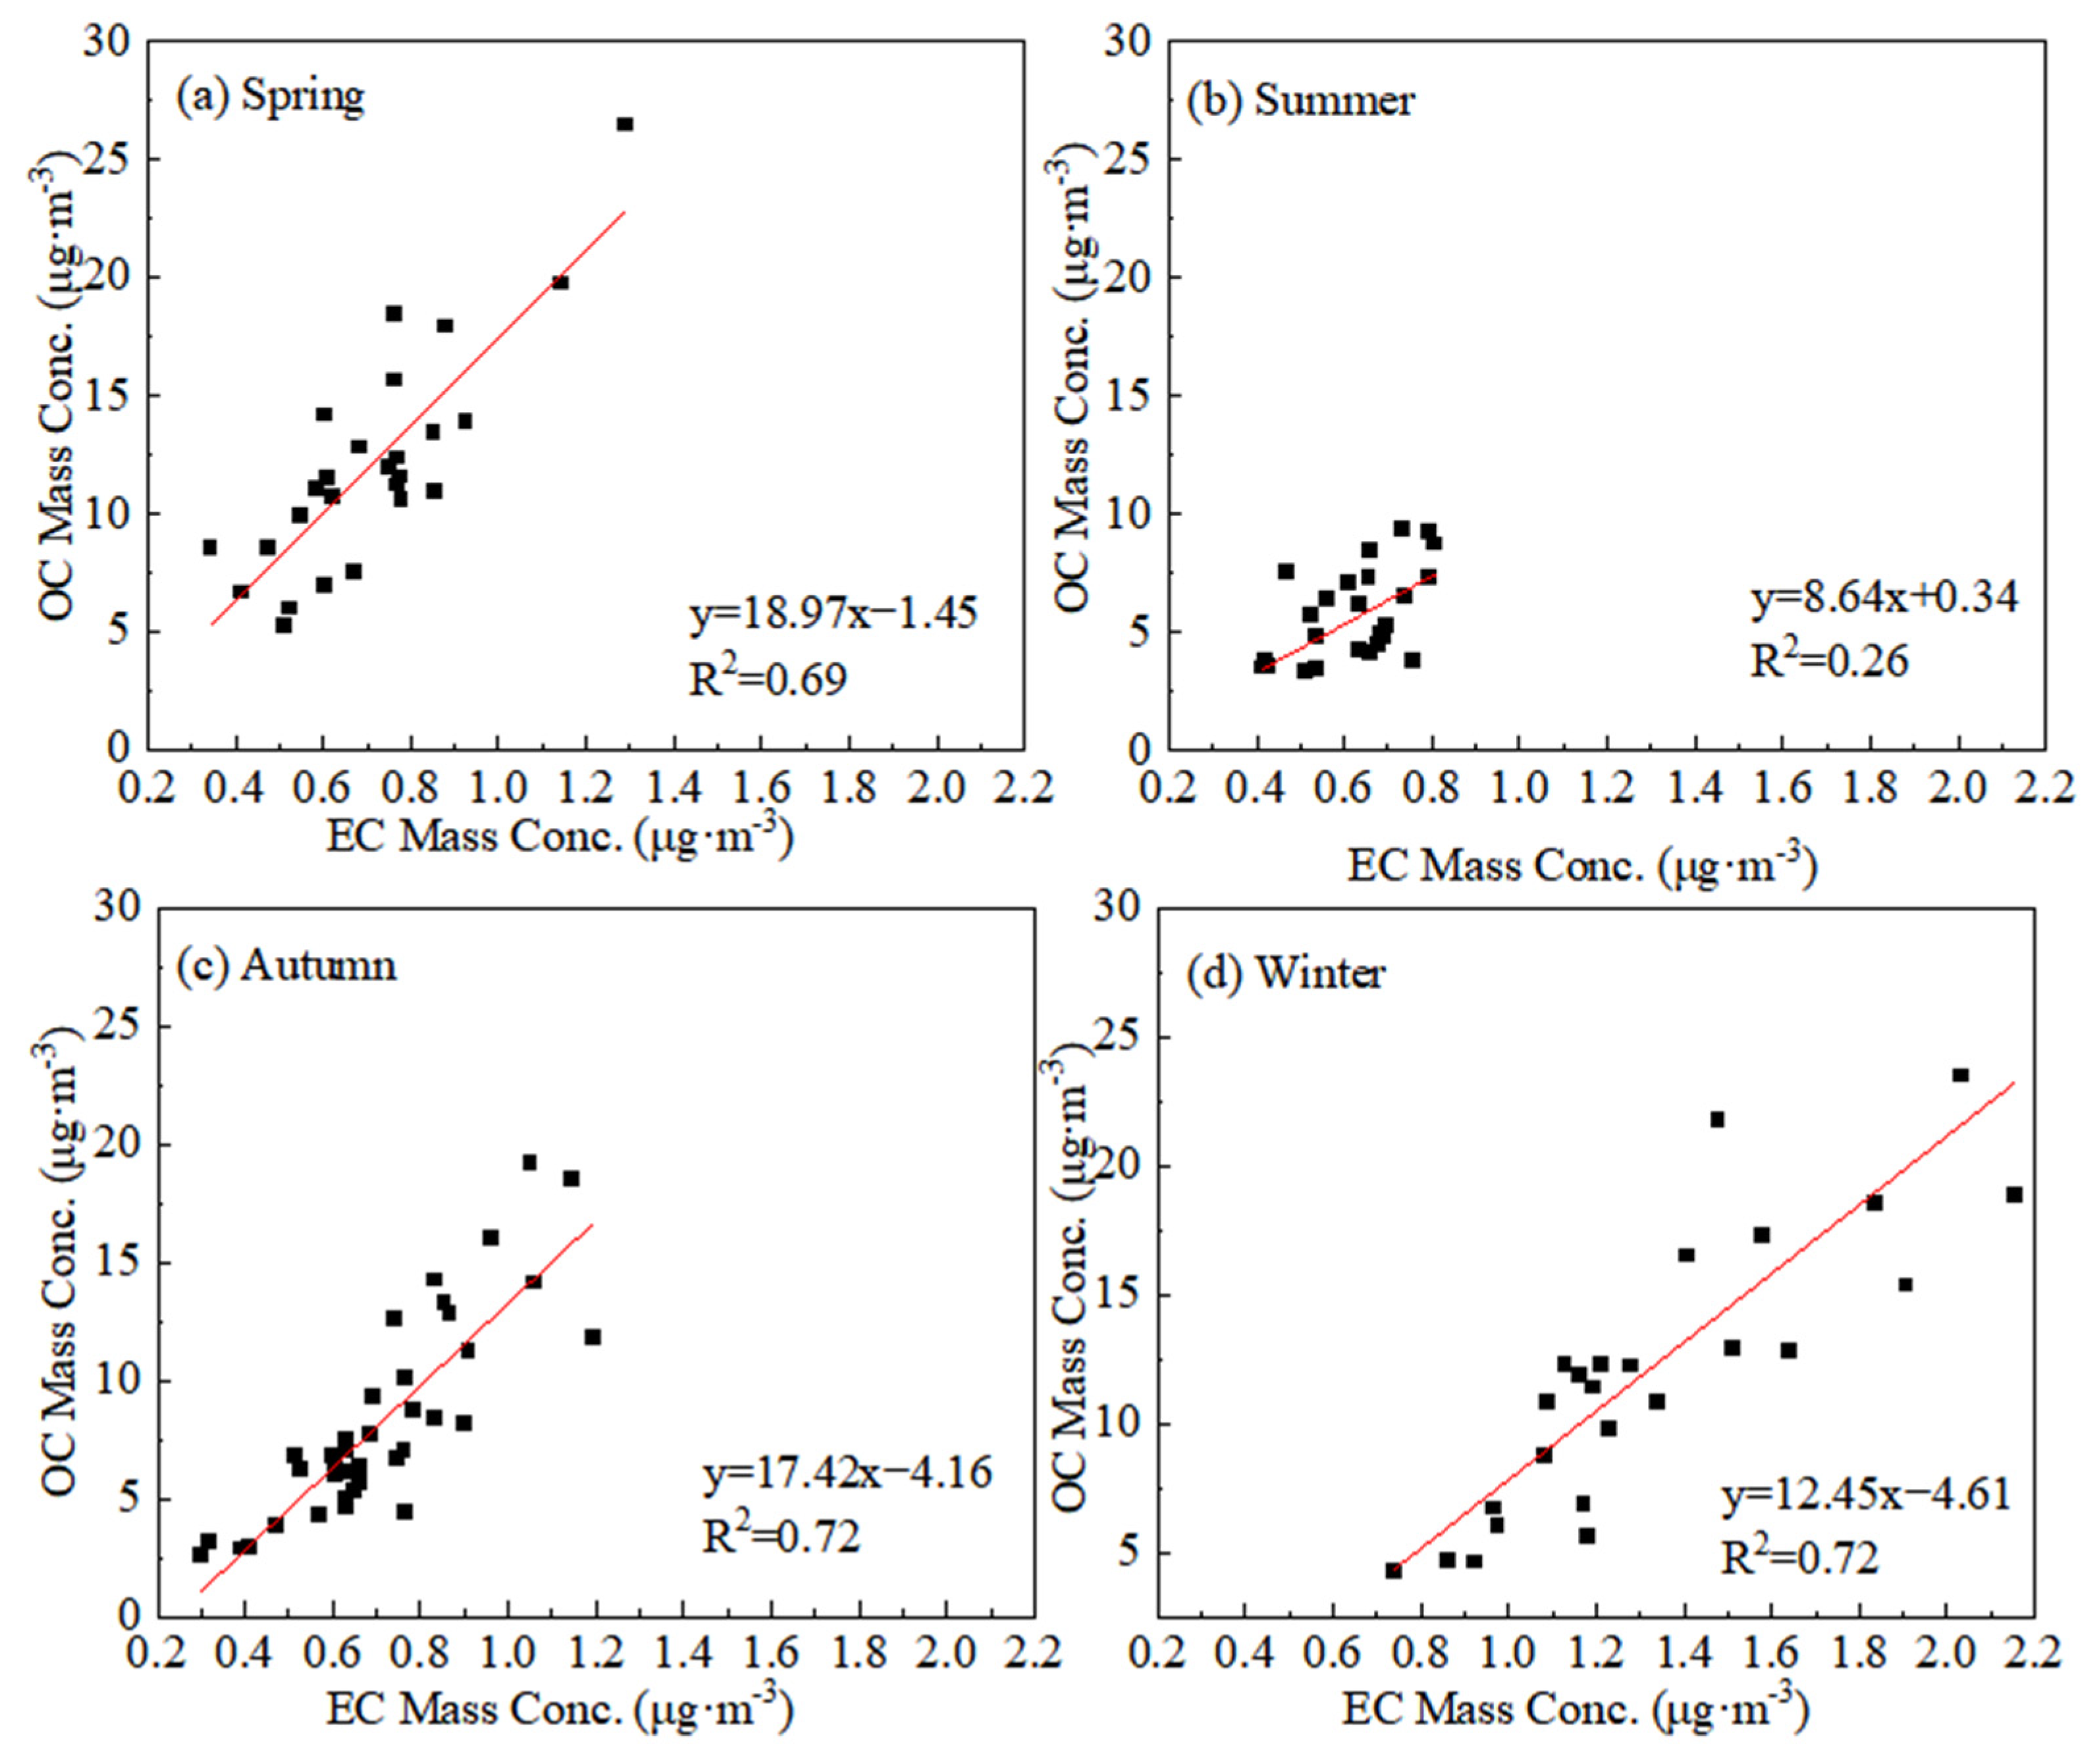
EC is generally considered to originate primarily from incomplete combustion and is classified as an inert pollutant [24,32]. In contrast, OC can derive from both natural and anthropogenic sources, encompassing primary emissions and secondary organic aerosols [33]. Therefore, the correlations between OC and EC reflect the similarity in their source origins [13]. A higher correlation coefficient suggests a greater likelihood of shared sources for OC and EC [32,34]. In contrast, a lower correlation coefficient indicates the more complex sources of OC and EC, such as SOC. The linear regression analysis between OC and EC is presented in Figure 3. The strongest correlation was observed in winter (R2 = 0.72), followed by autumn (R2 = 0.72) and spring (R2 = 0.69). Conversely, the summer season exhibited the lowest correlation (R2 = 0.26), indicating a more complex relationship between OC and EC sources during this period. Furthermore, the linear regression analysis in winter and autumn showed higher R values during the daytime compared to nighttime (See Figure S3), suggesting that nighttime sources were more complex. However, the opposite trend was noted in spring and summer.
EC is commonly employed as a tracer for primary emissions, and the OC/EC ratio can be utilized to assess the extent of secondary organic aerosol (SOA) formation. It is generally accepted that SOC formation occurs when the OC/EC ratio exceeds 2 [24]. The average OC/EC ratios across the four seasons ranged from 8.57 to 16.72, as illustrated in Table 1 and Figure 4. These ratios are substantially higher than those observed in Shijiazhuang (4.4) [35] and in Lvliang (1.7) [20], indicating a higher level of SOC formation during the sampling period. In this study, the minimum value of OC/EC in daytime and nighttime for each season was applied to estimate SOC mass concentrations [36]. The variation in POC and SOC can be seen in Figure 4 and Table 1.
The average mass concentration of SOC was 3.99 ± 2.92 μg m−3, with the highest concentration in winter (5.68 ± 3.47 μg m−3), followed by spring (4.50 ± 2.56 μg m−3), autumn (3.74 ± 2.73 μg m−3), and summer (2.16 ± 1.49 μg m−3). The mass ratios of SOC/OC in winter, autumn, spring, and summer were 40.93 ± 14.86%, 39.36 ± 14.03%, 34.63 ± 12.46%, and 33.90 ± 16.04%, respectively. Although SOC mass concentrations were significantly lower than those recorded in Handan City, the seasonal variation trends in this study were similar to those in Handan City, which also showed the highest SOC/OC ratios in winter and the lowest in summer [32]. The elevated SOC/OC ratios in winter are primarily attributed to an increase in volatile organic precursors produced from combustion sources coupled with low temperatures during this season [13,37]. Conversely, the lower ratios observed in summer may be due to increased precipitation, which enhances pollution removal and leads to lower SOC concentrations in the atmosphere [32]. It should be mentioned that the averaged OC/EC values in spring were much higher than those in other seasons, but their SOC/OC ratios were not the highest. The reason for this might be that there were some dust particles from long-range transport that contained certain amounts of OC but limited EC, leading to high values of OC/EC [22].
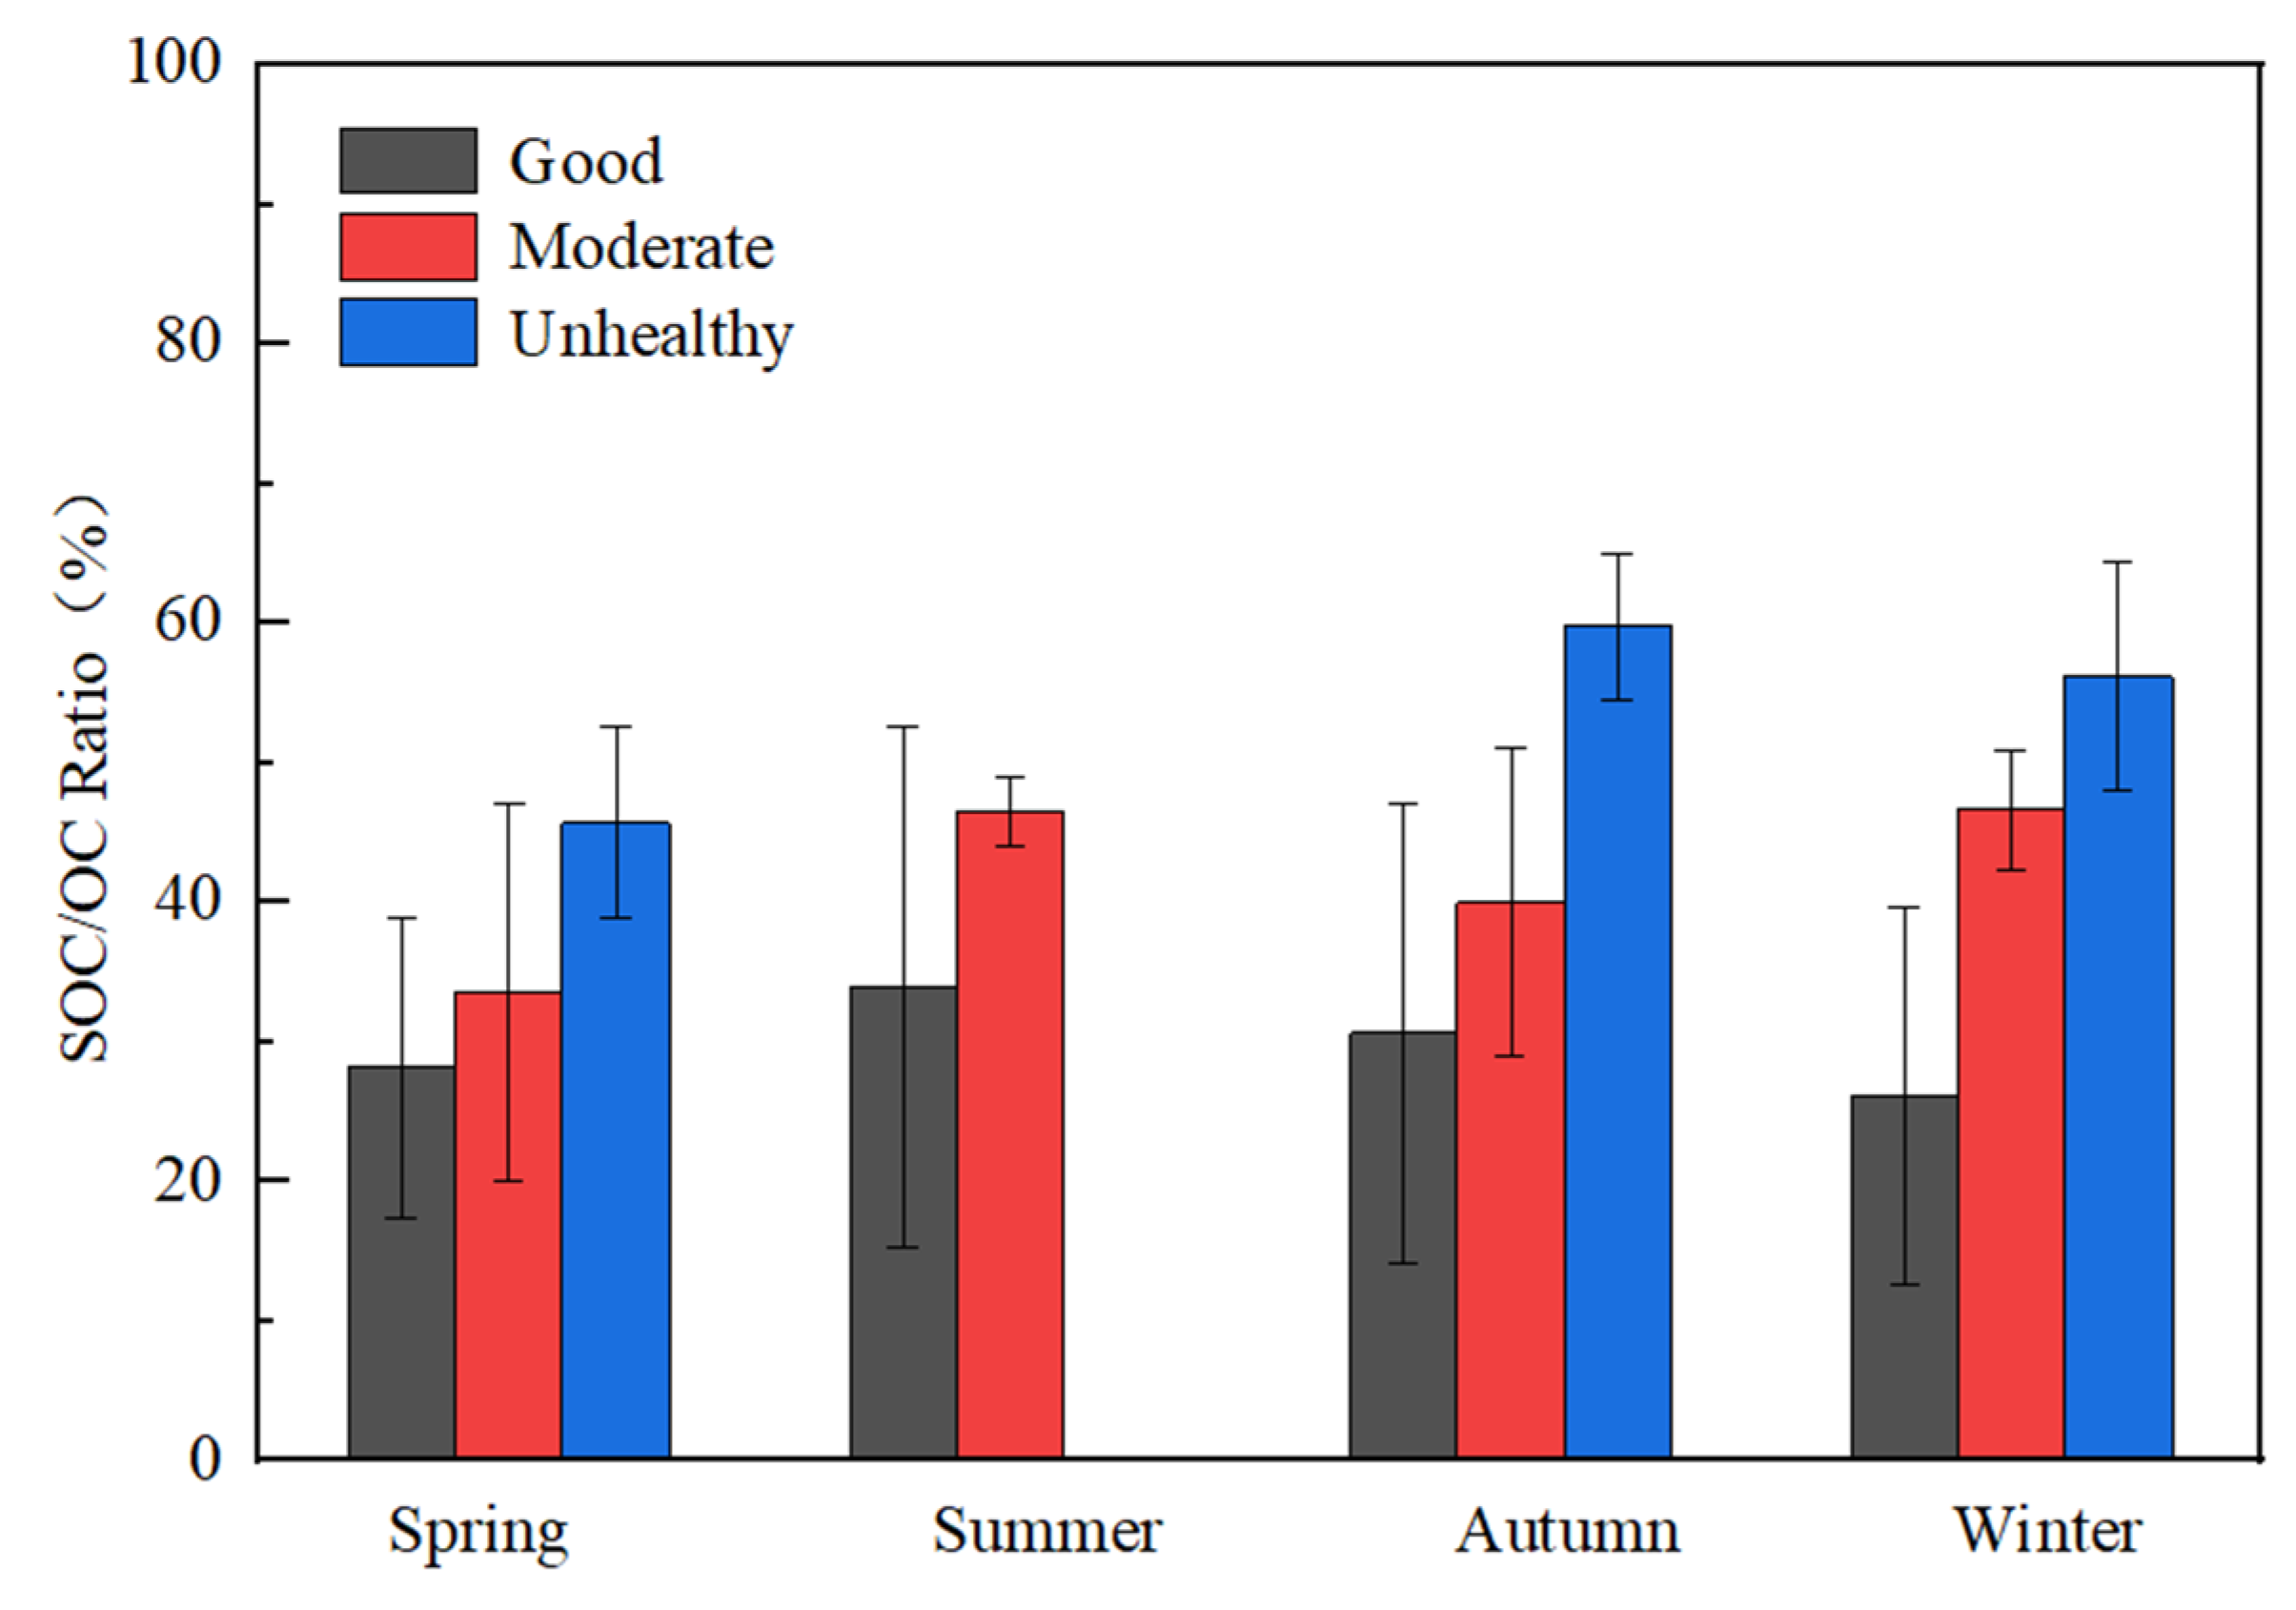
PM2.5 mass concentrations were further classified into categories based on the technical regulations on ambient air quality index (HJ633–2012 [38]): “Good” (PM2.5 < 35 μg m−3), “Moderate” (35 μg m−3 < PM2.5 < 75 μg m−3), and “Unhealthy” (PM2.5 > 75 μg m−3). Notably, higher PM2.5 mass concentrations correlated with increased SOC/OC ratios, as depicted in Figure 5. These findings suggest that SOC formation significantly contributes to haze development, consistent with previous reports [21]. Higher SOC/OC mass ratios were observed at night compared to during the day in winter and autumn, as shown in Table 2, indicating greater SOC formation at night, which corresponds to the lower linear regression observed between OC and EC during nighttime (see Figure S3). Additionally, Table S1 indicates that the average RH during nighttime was higher than that during the daytime in winter and autumn sampling periods, suggesting that aqueous reactions may play an important role in secondary aerosol formation during these seasons [39]. In contrast, SOC mass concentrations in summer were higher during the day (2.64 ± 1.47 μg·m−3) than the night (1.92 ± 1.63 μg·m−3). Correspondingly, SOC in summer accounted for 43.02% during the daytime, significantly higher than the nighttime ratio of 26.92%. Although nighttime RH was also elevated compared to daytime RH in summer, as shown in Tables S1 and S4, SOC formation in summer was likely influenced by photochemical reactions driven by light intensity [39]. These results underscore that the mechanisms of SOC formation differ significantly between summer and the colder seasons, with summer predominantly influenced by photochemical reactions and winter (and autumn) primarily governed by aqueous-phase reactions.

3.3. Source Apportionment of Carbonaceous Aerosols

In this study, the mass concentrations of PM2.5 were highest in spring (72.99 μg m−3), followed by winter (55.88 μg m−3), autumn (44.04 μg m−3), and summer (18.24 μg m−3). Notably, while spring exhibited the highest PM2.5 levels, the mass concentrations of OC and EC in spring were lower than those in winter, particularly for EC. Additionally, the OC/EC ratios showed significant seasonal variation, indicating that both chemical compositions and source contributions varied across seasons.
The mass concentrations of eight carbonaceous components—OC1, OC2, OC3, OC4, EC1, EC2, EC3, and OP—were determined from the PM2.5 samples. Previous studies have identified that OC1 primarily originates from biomass combustion, OC2 is associated with coal combustion sources, OC3 and OC4 are enriched in dust particles, EC1 and OP are derived from gasoline vehicle exhaust, and EC2 and EC3 are indicative of diesel exhaust sources [13,37,40].
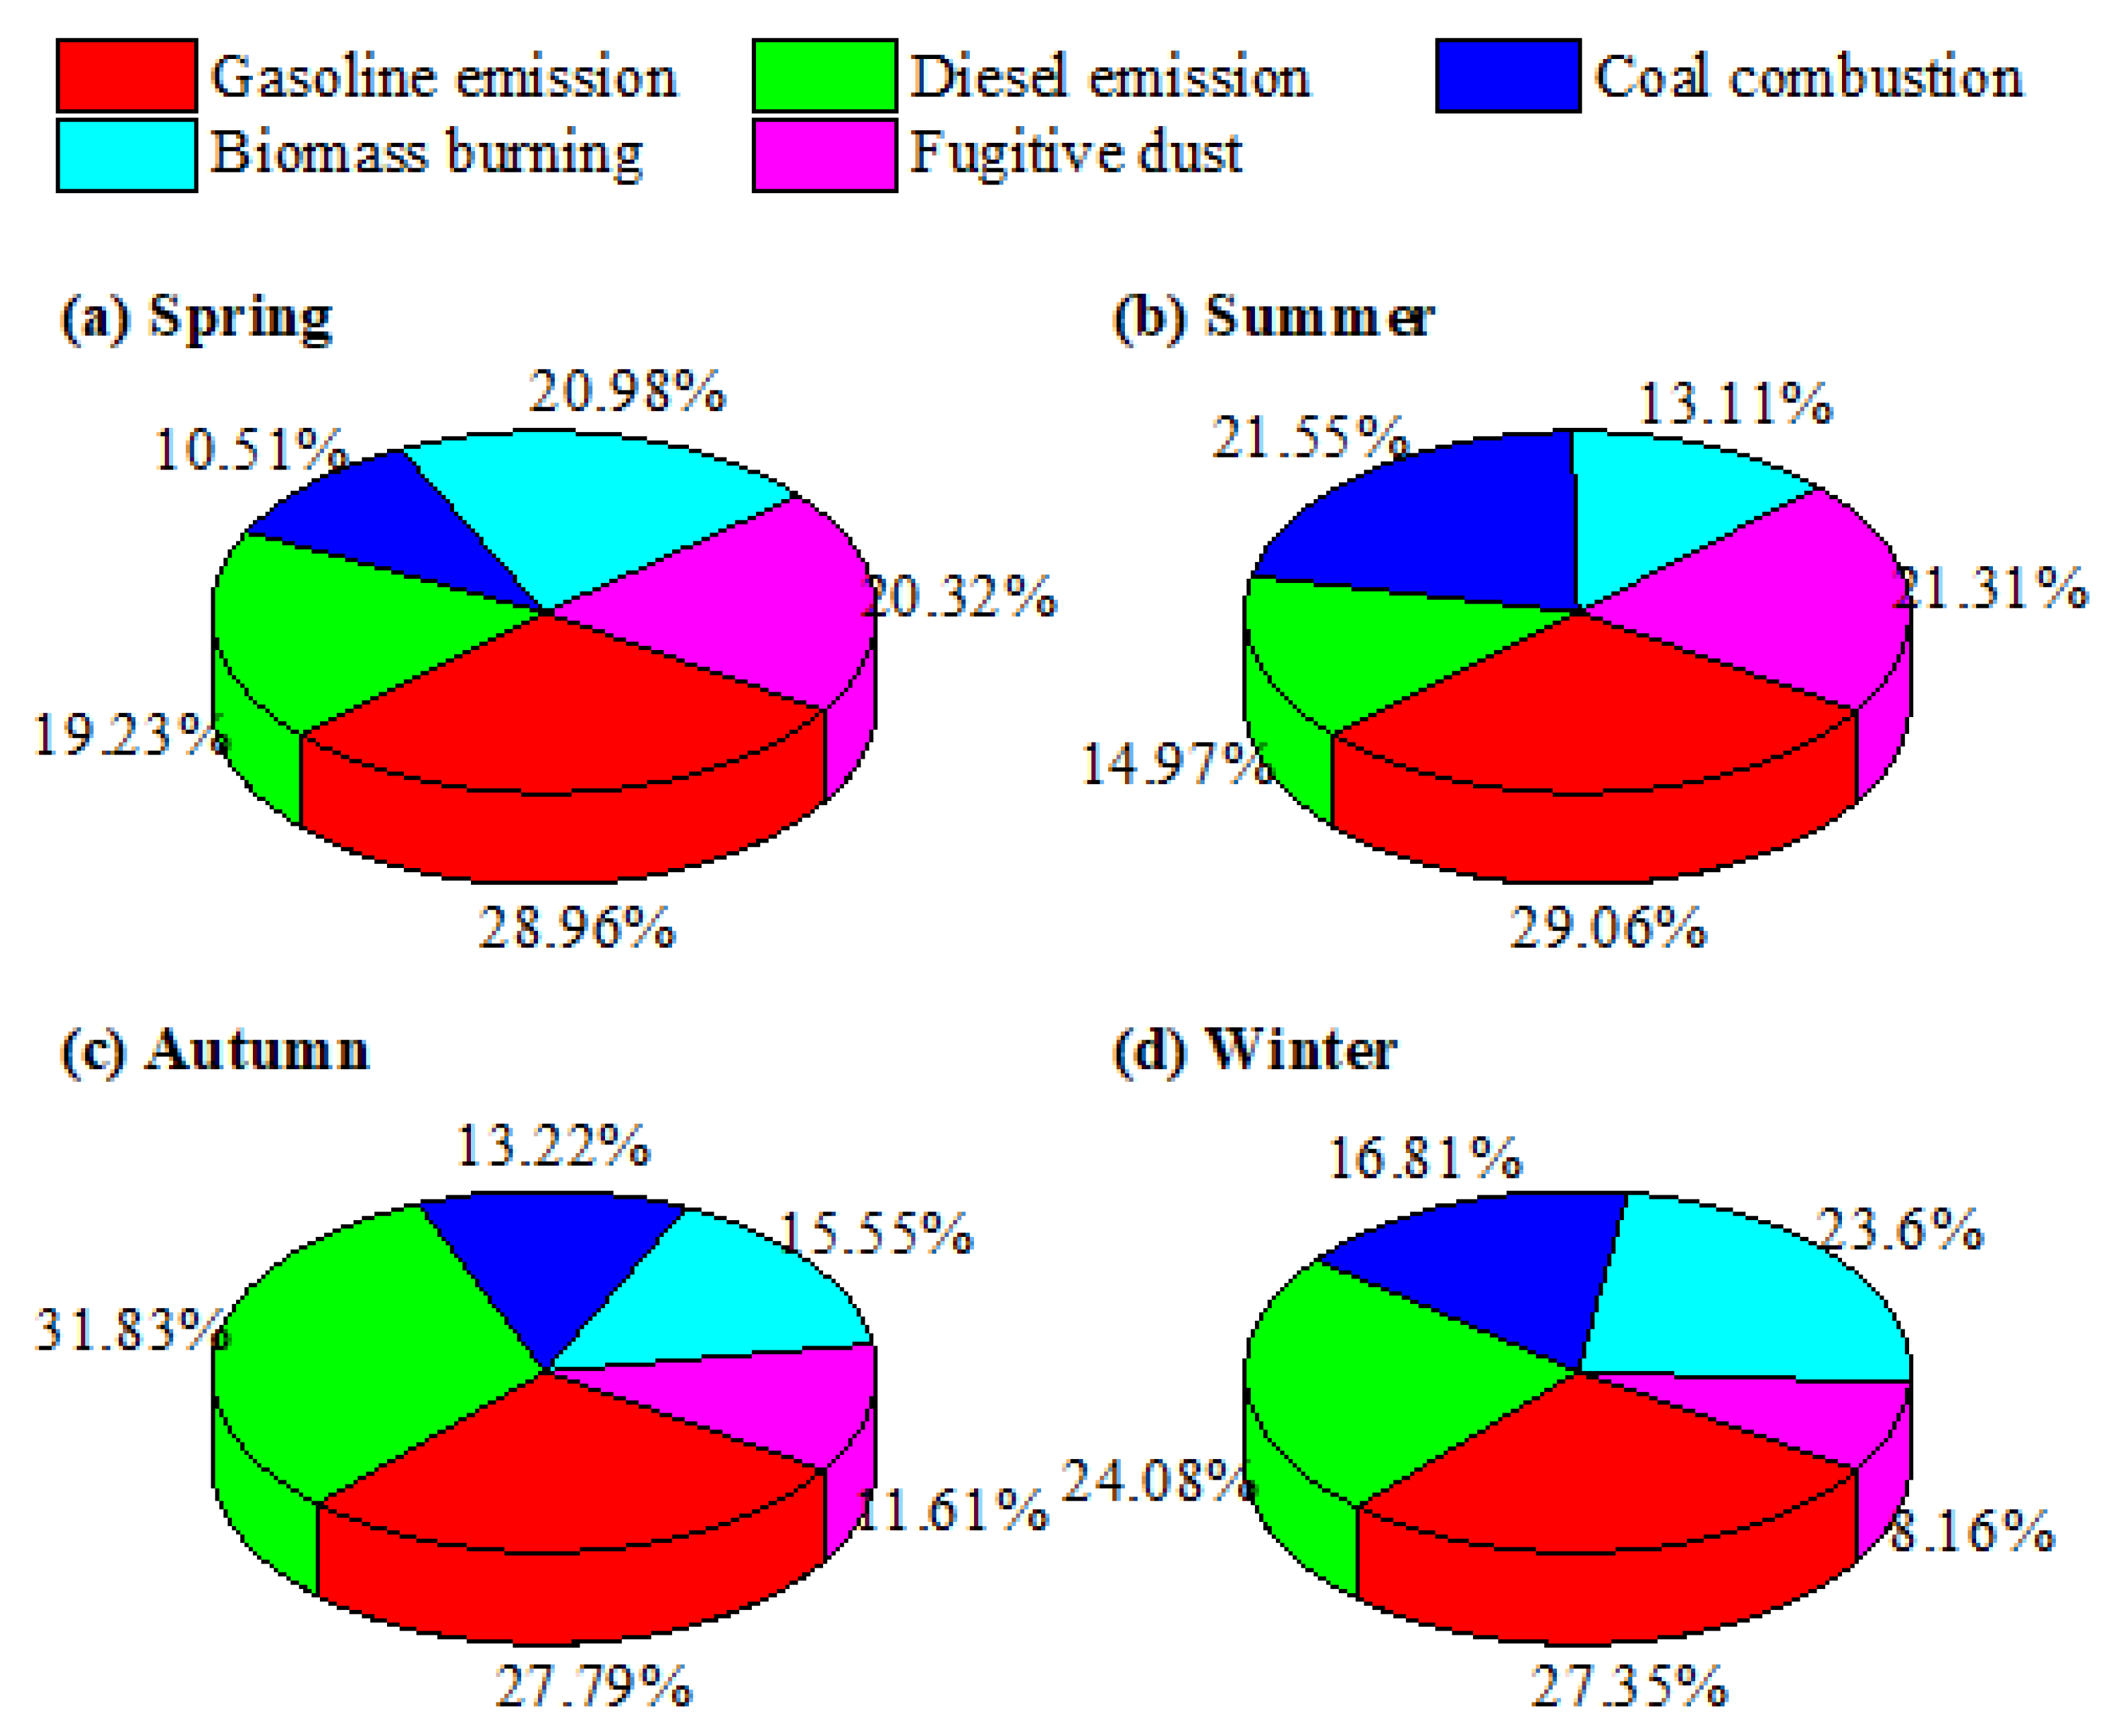
Using the PMF model, five factors were resolved, as illustrated in Figure S4. The contributions from various sources, including gasoline vehicle emissions, diesel vehicle emissions, coal combustion, biomass burning, and fugitive dust, were calculated and are presented in Figure 6. Importantly, SOC and some of the OCs, such as biological aerosols were not resolved by the PMF model, primarily due to the absence of known tracers [1,13]. Consequently, the aforementioned sources may have been overestimated [41]. But it can truly reflect the main emission sources of carbonaceous aerosols in a certain sense. Gasoline vehicle emissions accounted for 27.79–29.06% of total carbonaceous aerosols, making them the predominant contributors. In contrast, coal combustion contributed only 10.51–21.55%, a significant shift from previous years when coal combustion was the major contributor in northern China [8]. This finding aligns with earlier reports from Qinhuangdao City, which indicated that water-soluble inorganic nitrate (predominantly from vehicle emissions) was significantly higher than sulfate (mainly from coal combustion) [21]. The mass concentrations of NO2 and SO2 (available online: https://www.zq12369.com/, accessed on 18 June 2025) can be seen in Table S1. Higher PM2.5 mass concentrations were associated with higher NO2 and SO2 mass concentrations. Therefore, significantly higher NO2 mass concentrations compared to SO2 in the current atmospheric conditions indicated a higher contribution of vehicle emissions to PM2.5, consistent with our source apportionment results [42].
The implementation of stringent emission control measures by the government, including the “Air Pollution Prevention and Control Action Plan” (APPCAP) issued in 2013 and the annual “Action Plan for Comprehensive Control of Atmospheric Pollution in Autumn and Winter of Beijing-Tianjin-Hebei region” [43], has likely contributed to these changes. Notably, domestic raw coal combustion was strictly forbidden. Additionally, fugitive dust contributed 20.32% in spring and 21.31% in summer, which was significantly higher than its contribution during autumn and winter. Dust particles can introduce a certain amount of OC and limited EC to downstream regions, although these particles primarily consist of inorganic mineral dust in spring, leading to high OC/EC mass ratios and low OC/PM2.5 ratios and lower SOC/OC ratios [22]. High OC/EC ratios (Figure 2) alongside low OC/PM2.5 mass ratios (Table 1) and lower SOC/OC ratios (Figure 4) in spring were consistent with our source analysis [13,22,44]. Conversely, the higher proportion of dust in summer could be related to a reduction of anthropogenic sources during that season, supported by the lowest PM2.5 and OC mass concentrations in summer. Biomass burning also played a significant role in contributing to carbonaceous aerosols in both spring and winter.

4. Conclusions

(1) The mass concentrations of organic carbon (OC) and elemental carbon (EC) averaged 9.27 ± 4.47 μg m−3 and 0.83 ± 0.33 μg m−3, respectively, contributing 25.93 ± 8.86% and 2.53 ± 1.83% to total PM2.5. The highest concentrations were found in winter, while the lowest were found in summer. In addition, the higher OC and EC values were found in nighttime samples compared with those in daytime.
(2) SOC/OC ratios significantly increased with the increase of pollution levels. In winter and autumn, SOC formation was higher at night, whereas in summer SOC formation was more pronounced during the day.
(3) Source apportionment analysis revealed that gasoline and diesel vehicle emissions were major contributors to carbonaceous aerosols, while coal combustion contributed less. Additionally, fugitive dust was found to have a high contribution to carbonaceous aerosols during spring and summer.

5. Outlook

This study focused on the seasonal characteristics of carbonaceous aerosols in a coastal city in north China. The research found that vehicle emissions contributed significantly to carbonaceous aerosols compared to coal combustions. However, SOC and some of the OCs, such as biological OC, were not resolved. More chemical analysis and models (such as chemical mass balance) are encouraged to further resolve their contributions.

Supplementary Materials

The following supporting information can be downloaded at: https://www.mdpi.com/article/10.3390/atmos16080960/s1, Table S1: Meteorological conditions and mass concentrations of SO2 and NO2 during sampling periods. Data were derived from official National Air Quality Monitoring Network (CNEMC) and downloaded from the website (https://www.zq12369.com/, accessed on 18 June 2025). Table S2: One-way ANOVA results for comparing mean OC concentrations across four seasons. Table S3: One-way ANOVA results for comparing mean EC concentrations across four seasons. Table S4: One-way ANOVA results for comparing mean RH in summer between day and night. Figure S1: Mass concentrations of PM2.5 and corresponding meteorological conditions during sampling periods (meteorological data were downloaded from website: ttps://www.zq12369.com/, accessed on 18 June 2025). Figure S2: Timeseries of OC and EC mass concentrations during sampling periods (Note: The numbers in parentheses represent the sample sizes). Figure S3: Linear regressions between OC and EC in different seasons. Figure S4: Source profile of PMF analysis of carbonaceous aerosols in PM2.5 in different seasons.

Author Contributions

Conceptualization, X.L., X.Z. and W.W.; Methodology, X.L.; Validation, J.S. and Q.W.; Formal analysis, M.W., Y.G. and W.W.; Investigation, M.W. and Y.G.; Data curation, Y.G.; Writing—original draft, X.L. and W.W.; Writing—review & editing, J.S., Q.W., X.Z. and W.W.; Funding acquisition, W.W. All authors have read and agreed to the published version of the manuscript.

Funding

This research was funded by Natural Science Foundation of Hebei Province (D2024501001), and Fundamental Research Funds for the Central Universities (N2523008).

Institutional Review Board Statement

Not applicable.

Informed Consent Statement

Not applicable.

Data Availability Statement

The original contributions presented in this study are included in the article/Supplementary Materials. Further inquiries can be directed to the corresponding author.

Conflicts of Interest

The authors declare no conflict of interest.

References

  1. Huang, J.; Zhang, Z.; Tao, J.; Zhang, L.; Nie, F.; Fei, L. Source apportionment of carbonaceous aerosols using hourly data and implications for reducing PM2.5 in the Pearl River Delta region of South China. Environ. Res. 2022, 210, 112960. [Google Scholar] [CrossRef]
  2. Tao, J.; Zhang, L.; Cao, J.; Zhang, R. A review of current knowledge concerning PM2. 5 chemical composition, aerosol optical properties and their relationships across China. Atmos. Chem. Phys. 2017, 17, 9485–9518. [Google Scholar] [CrossRef]
  3. Li, M.; Hu, M.; Walker, J.; Gao, P.; Fang, X.; Xu, N.; Qin, Y.; Zhou, L.; Liu, K.; Czimczik, C.I.; et al. Source apportionment of carbonaceous aerosols in diverse atmospheric environments of China by dual-carbon isotope method. Sci. Total Environ. 2022, 806, 150654. [Google Scholar] [CrossRef]
  4. Paisi, N.; Kushta, J.; Pozzer, A.; Violaris, A.; Lelieveld, J. Health effects of carbonaceous PM2.5 compounds from residential fuel combustion and road transport in Europe. Sci. Rep. 2024, 14, 1530. [Google Scholar] [CrossRef]
  5. Schwarz, J.; Cusack, M.; Karban, J.; Chalupníčková, E.; Havránek, V.; Smolík, J.; Ždímal, V. PM2.5 chemical composition at a rural background site in Central Europe, including correlation and air mass back trajectory analysis. Atmos. Res. 2016, 176–177, 108–120. [Google Scholar] [CrossRef]
  6. Han, Y.M.; Cao, J.J.; Lee, S.C.; Ho, K.F.; An, Z.S. Different characteristics of char and soot in the atmosphere and their ratio as an indicator for source identification in Xi’an, China. Atmos. Chem. Phys. 2010, 10, 595–607. [Google Scholar] [CrossRef]
  7. Niu, H.; Liu, Z.; Hu, W.; Cheng, W.; Li, M.; Xue, F.; Wu, Z.; Wang, J.; Fan, J. Carbonaceous components in particulate matter during a haze episode at a typical industrial area in the North China Plain. World J. Eng. 2021, 18, 293–301. [Google Scholar] [CrossRef]
  8. Huang, R.J.; Zhang, Y.; Bozzetti, C.; Ho, K.F.; Cao, J.J.; Han, Y.; Daellenbach, K.R.; Slowik, J.G.; Platt, S.M.; Canonaco, F.; et al. High secondary aerosol contribution to particulate pollution during haze events in China. Nature 2014, 514, 218–222. [Google Scholar] [CrossRef] [PubMed]
  9. Li, X.; Zhu, H.; Zhang, X.; Yang, Y.; Jiang, J.; Liu, Y.; Chen, J.; Tian, H.; Hou, D.; Liu, X. Characteristics of carbonaceous aerosols in four northern Chinese cities during the 2022 Winter Olympics. Atmos. Environ. 2024, 334, 120699. [Google Scholar] [CrossRef]
  10. Feng, T.; Wang, F.; Yang, F.; Li, Z.; Lu, P.; Guo, Z. Carbonaceous aerosols in urban Chongqing, China: Seasonal variation, source apportionment, and long-range transport. Chemosphere 2021, 285, 131462. [Google Scholar] [CrossRef] [PubMed]
  11. Park, G.; Kang, S.; Bae, M.-S.; Lim, Y.; Jeon, C.-S.; Lee, T. Roadside air pollution and secondary organic aerosol seasonal trends from an oxidation flow reactor in Seoul. Atmos. Environ. 2023, 312, 120051. [Google Scholar] [CrossRef]
  12. Jiang, G.; Song, X.; Xie, J.; Shi, T.; Yang, Q. Polycyclic aromatic hydrocarbons (PAHs) in ambient air of Guangzhou city: Exposure levels, health effects and cytotoxicity. Ecotoxicol. Environ. Saf. 2023, 262, 115308. [Google Scholar] [CrossRef] [PubMed]
  13. Bond, T.C.; Doherty, S.J.; Fahey, D.W.; Forster, P.M.; Berntsen, T.; DeAngelo, B.J.; Flanner, M.G.; Ghan, S.; Kärcher, B.; Koch, D.; et al. Bounding the role of black carbon in the climate system: A scientific assessment. J. Geophys. Res. Atmos. 2013, 118, 5380–5552. [Google Scholar] [CrossRef]
  14. Cheng, X.; Yu, J.; Chen, L.; Sun, Y.; Zhang, H.; Gao, S.; Kong, S.; Zheng, H.; Wang, H. Influence of pollution control measures on the reduction of black carbon in an urban site of megacity, Tianjin, China based on ground-monitored and MERRA-2 reanalysis data. Sci. Total Environ. 2024, 912, 169466. [Google Scholar] [CrossRef] [PubMed]
  15. Li, P.; Yue, S.; Yang, X.; Liu, D.; Zhang, Q.; Hu, W.; Hou, S.; Zhao, W.; Ren, H.; Li, G.; et al. Fluorescence Properties and Chemical Composition of Fine Particles in the Background Atmosphere of North China. Adv. Atmos. Sci. 2023, 40, 1159–1174. [Google Scholar] [CrossRef]
  16. Liu, Y.; Xu, X.; Ji, D.; He, J.; Wang, Y. Examining trends and variability of PM2.5-associated organic and elemental carbon in the megacity of Beijing, China: Insight from decadal continuous in-situ hourly observations. Sci. Total Environ. 2024, 938, 173331. [Google Scholar] [CrossRef]
  17. Dong, Z.; Li, X.; Dong, Z.; Su, F.; Wang, S.; Shang, L.; Kong, Z.; Wang, S. Long-term evolution of carbonaceous aerosols in PM2.5 during over a decade of atmospheric pollution outbreaks and control in polluted central China. Sci. Total Environ. 2024, 935, 173089. [Google Scholar] [CrossRef]
  18. Dao, X.; Ji, D.; Zhang, X.; He, J.; Sun, J.; Hu, J.; Liu, Y.; Wang, L.; Xu, X.; Tang, G.; et al. Significant reduction in atmospheric organic and elemental carbon in PM2.5 in 2+26 cities in northern China. Environ. Res. 2022, 211, 113055. [Google Scholar] [CrossRef]
  19. Xie, F.; Guo, L.; Wang, Z.; Tian, Y.; Yue, C.; Zhou, X.; Wang, W.; Xin, J.; Lü, C. Geochemical characteristics and socioeconomic associations of carbonaceous aerosols in coal-fueled cities with significant seasonal pollution pattern. Environ. Int. 2023, 179, 108179. [Google Scholar] [CrossRef]
  20. Li, X.; Mu, L.; Liu, T.; Li, Y.; Feng, C.; Jiang, X.; Liu, Z.; Tian, M. Carbonaceous aerosols in Lvliang, China: Seasonal variation, spatial distribution and source apportionment. J. Environ. Chem. 2022, 19, 90–99. [Google Scholar] [CrossRef]
  21. Wang, W.; Gao, Y.; Shao, L.; Fan, C.; Li, X.; Li, Y.; Liu, M.; Zhou, X. Chemical compositions and possible transportation of PM2.5 during two haze periods in a coastal city of the North China Plain. Geol. J. 2023, 58, 4417–4427. [Google Scholar] [CrossRef]
  22. Wang, W.; Zhou, H.; Lyu, R.; Shao, L.; Li, W.; Xing, J.; Zhao, Z.; Li, X.; Zhou, X.; Zhang, D. Organic Carbon and Elemental Carbon in Two Dust Plumes at a Coastal City in North China. Aerosol Air Qual. Res. 2024, 24, 240002. [Google Scholar] [CrossRef]
  23. Turpin, B.J.; Huntzicker, J.J. Identification of secondary organic aerosol episodes and quantitation of primary and secondary organic aerosol concentrations during SCAQS. Atmos. Environ. 1995, 29, 3527–3544. [Google Scholar] [CrossRef]
  24. Na, K.; Sawant, A.A.; Song, C.; Cocker, D.R. Primary and secondary carbonaceous species in the atmosphere of Western Riverside County, California. Atmos. Environ. 2004, 38, 1345–1355. [Google Scholar] [CrossRef]
  25. Frischmon, C.; Hannigan, M. VOC source apportionment: How monitoring characteristics influence positive matrix factorization (PMF) solutions. Atmos. Environ. X 2024, 21, 100230. [Google Scholar] [CrossRef]
  26. Srivastava, D.; Xu, J.; Vu, T.V.; Liu, D.; Li, L.; Fu, P.; Hou, S.; Moreno Palmerola, N.; Shi, Z.; Harrison, R.M. Insight into PM2.5 sources by applying positive matrix factorization (PMF) at urban and rural sites of Beijing. Atmos. Chem. Phys. 2021, 21, 14703–14724. [Google Scholar] [CrossRef]
  27. Gugamsetty, B.; Wei, H.; Liu, C.-N.; Awasthi, A.; Hsu, S.-C.; Tsai, C.-J.; Roam, G.-D.; Wu, Y.-C.; Chen, C.-F. Source Characterization and Apportionment of PM10, PM2.5 and PM0.1 by Using Positive Matrix Factorization. Aerosol Air Qual. Res. 2012, 12, 476–491. [Google Scholar] [CrossRef]
  28. Khobragade, P.P.; Ahirwar, A.V. Source apportionment of SPM by positive matrix factorization and PM2.5 analysis in an urban industrial area. World J. Eng. 2022, 19, 446–458. [Google Scholar] [CrossRef]
  29. EPA. Positive Matrix Factorization (PMF) 5.0 Fundamentals and User Guide; EPA 600/R-14/108; U.S. Environmental Protection Agency (EPA): Washington, DC, USA, 2014. [Google Scholar]
  30. Pang, N.; Gao, J.; Zhao, P.; Wang, Y.; Xu, Z.; Chai, F. The impact of fireworks control on air quality in four Northern Chinese cities during the Spring Festival. Atmos. Environ. 2021, 244, 117958. [Google Scholar] [CrossRef]
  31. Wang, W.; Shao, L.; Mazzoleni, C.; Li, Y.; Kotthaus, S.; Grimmond, S.; Bhandari, J.; Xing, J.; Feng, X.; Zhang, M.; et al. Measurement report: Comparison of wintertime individual particles at ground level and above the mixed layer in urban Beijing. Atmos. Chem. Phys. 2021, 21, 5301–5314. [Google Scholar] [CrossRef]
  32. Niu, H.; Wu, C.; Schindler, M.; Silva, L.F.O.; Ma, B.; Ma, X.; Ji, X.; Tian, Y.; Zhu, H.; Bao, X.; et al. Characterization of PM2.5 Carbonaceous Components in a Typical Industrial City in China under Continuous Mitigation Measures. Toxics 2024, 12, 461. [Google Scholar] [CrossRef] [PubMed]
  33. Zhou, R.; Yan, C.; Yang, Q.; Niu, H.; Liu, J.; Xue, F.; Chen, B.; Zhou, T.; Chen, H.; Liu, J.; et al. Characteristics of wintertime carbonaceous aerosols in two typical cities in Beijing-Tianjin-Hebei region, China: Insights from multiyear measurements. Environ. Res. 2023, 216, 114469. [Google Scholar] [CrossRef] [PubMed]
  34. Liu, P.; Zhou, H.; Chun, X.; Wan, Z.; Liu, T.; Sun, B.; Wang, J.; Zhang, W. Characteristics of fine carbonaceous aerosols in Wuhai, a resource-based city in Northern China:Insights from energy efficiency and population density. Environ. Pollut. 2022, 292, 118368. [Google Scholar] [CrossRef] [PubMed]
  35. Ke, Y.; Wang, H.; Wu, Z.; Liu, S.; Zhao, T.; Yin, Y. Quantifying the pollution characteristics of chemical components in PM2.5 in the North China Plain, China: Spatiotemporal variation and health risk. Atmos. Environ. 2023, 307, 119860. [Google Scholar] [CrossRef]
  36. Guo, S.; Hu, M.; Guo, Q.; Shang, D. Comparison of Secondary Organic Aerosol Estimation Methods. Acta Chim. Sin. 2014, 72, 658–666, (In Chinese with English Abstract). [Google Scholar] [CrossRef]
  37. Jiang, J.; Hou, L.; Yan, X.; Liu, H.; Sun, S.; Li, S.; Xiong, K.; Zhao, W. Simultaneous Measurements of Carbonaceous Aerosol in Three Major Cities in the Beijing-Tianjin-Hebei Region, China. Aerosol Air Qual. Res. 2022, 22, 220056. [Google Scholar] [CrossRef]
  38. HJ633–2012; Technical Regulation on Ambient Air Quality Index (on Trial). National Environmental Protection Standards of the People’s Republic of China: Beijing, China, 2016.
  39. Zhang, Z.; Sha, T.; Mu, Z.; Li, J.; Dong, Z.; Ainur, D.; Ding, J.; Jiang, X.; Xu, T.; Chen, Q. Changes in sources and formation mechanisms of carbonaceous aerosols driven by short-term air pollution controls in Megacity Xi’an, China. Atmos. Environ. 2024, 322, 120369. [Google Scholar] [CrossRef]
  40. Wang, G.; Cheng, S.; Li, J.; Lang, J.; Wen, W.; Yang, X.; Tian, L. Source apportionment and seasonal variation of PM2.5 carbonaceous aerosol in the Beijing-Tianjin-Hebei Region of China. Environ. Monit. Assess. 2015, 187, 143. [Google Scholar] [CrossRef]
  41. Majewski, G.; Rogula-Kozłowska, W. The elemental composition and origin of fine ambient particles in the largest Polish conurbation: First results from the short-term winter campaign. Theor. Appl. Climatol. 2016, 125, 79–92. [Google Scholar] [CrossRef]
  42. Wang, W.; Shao, L.; Li, X.; Li, Y.; Lyu, R.; Zhou, X. Changes of water-soluble inorganic sulfate and nitrate during severe dust storm episodes in a coastal city of North China. Environ. Pollut. 2023, 335, 122288. [Google Scholar] [CrossRef]
  43. Li, W.; Shao, L.; Wang, W.; Li, H.; Wang, X.; Li, Y.; Li, W.; Jones, T.; Zhang, D. Air quality improvement in response to intensified control strategies in Beijing during 2013–2019. Sci. Total Environ. 2020, 744, 140776. [Google Scholar] [CrossRef]
  44. Huang, X.; Tang, G.; Zhang, J.; Liu, B.; Liu, C.; Zhang, J.; Cong, L.; Cheng, M.; Yan, G.; Gao, W.; et al. Characteristics of PM2.5 pollution in Beijing after the improvement of air quality. J. Environ. Sci. 2021, 100, 1–10. [Google Scholar] [CrossRef] [PubMed]
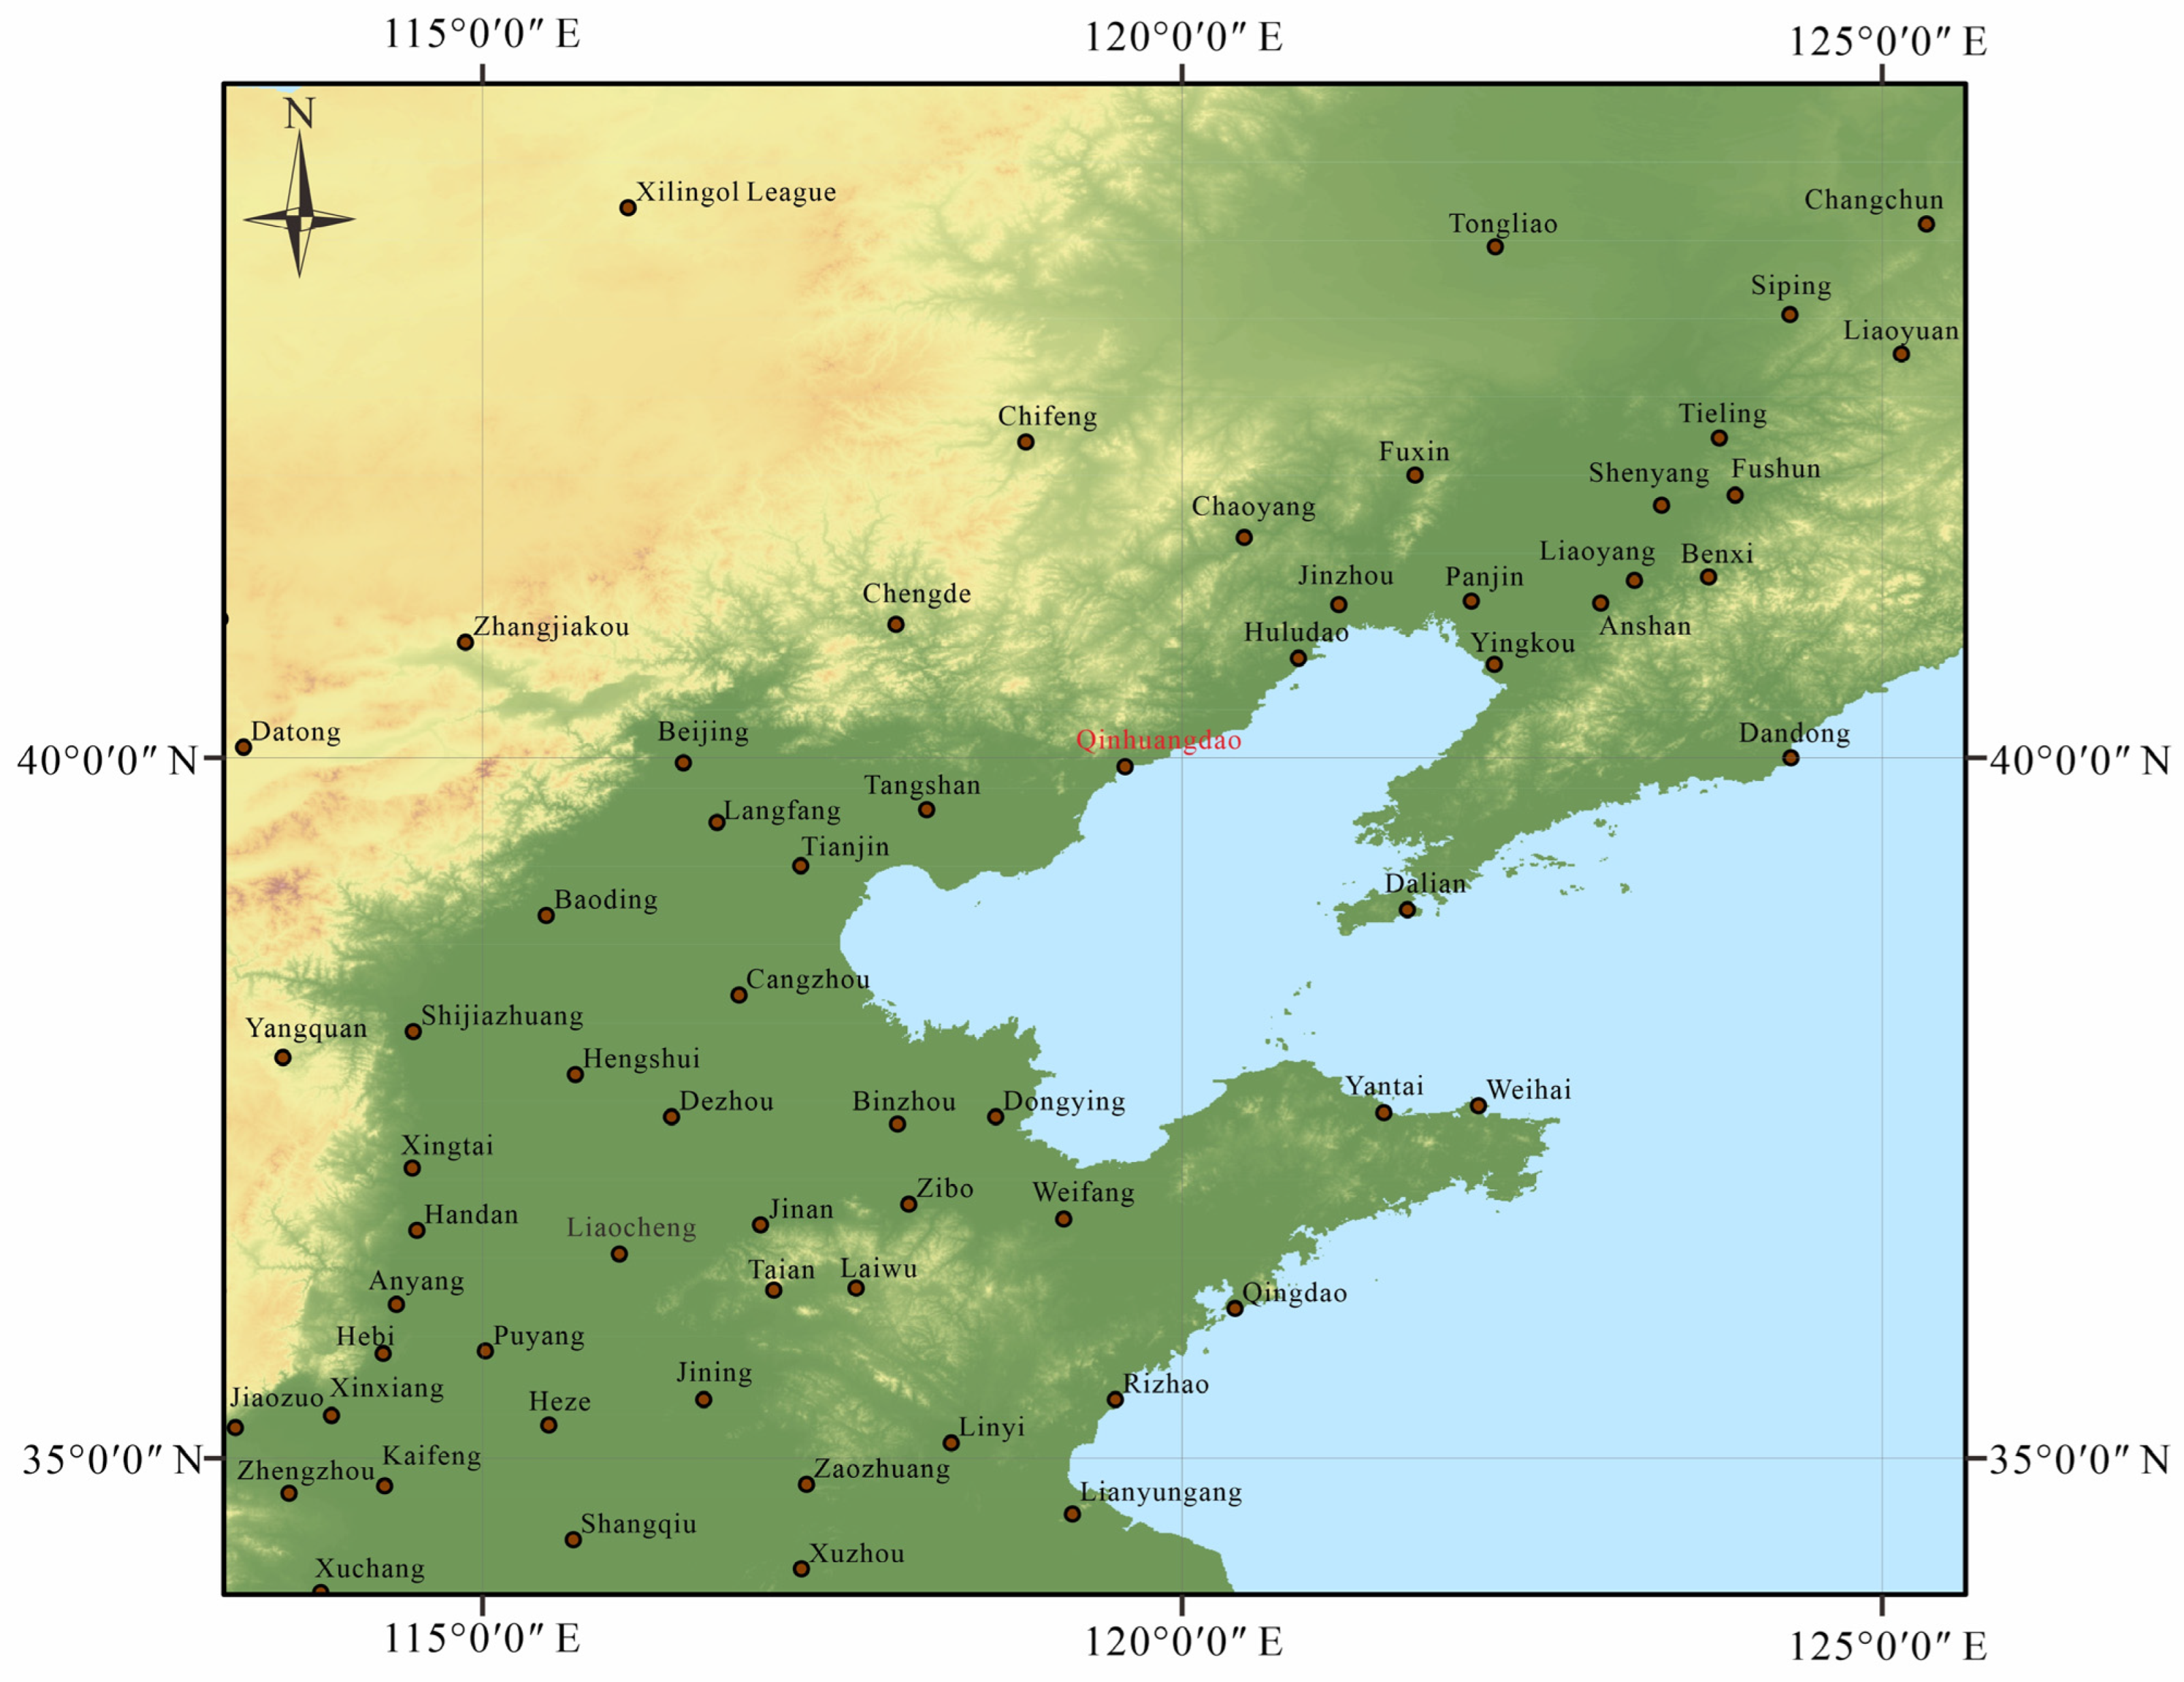
Figure 1. Map showing the geographical locations of Qinhuangdao City.
Atmosphere 16 00960 g001
Figure 2. Mass concentrations of OC and EC during sampling periods (a) is OC mass concentrations and (b) is EC mass concentrations (Note: The numbers in parentheses represent the sample sizes).
Atmosphere 16 00960 g002
Figure 3. Linear regressions between OC and EC in different seasons. (a), (b), (c), and (d) are for spring, summer, autumn, and winter, respectively.
Atmosphere 16 00960 g003
Figure 4. Mass concentrations of POC and SOC as well as SOC/OC ratios during sampling periods. (Note: The numbers in parentheses represent the sample sizes).
Atmosphere 16 00960 g004
Figure 5. SOC/OC ratios under different pollution levels.
Atmosphere 16 00960 g005
Figure 6. Source apportionment of carbonaceous aerosols in PM2.5 in different seasons. (a), (b), (c), and (d) are Spring, Summer, Autumn, and Winter, respectively.
Atmosphere 16 00960 g006
Table 1. Seasonal variations of PM2.5, OC, EC, and SOC mass concentrations during sampling periods.
ParameterSpringSummerAutumnWinterAverage
DayNightDailyDayNightDailyDayNightDailyDayNightDaily
PM2.5 (μg m−3)63.48 ± 30.2376.84 ± 44.6472.99 ± 32.7216.15 ± 6.6719.84 ± 8.2218.24 ± 6.1342.35 ± 34.2347.78 ± 39.1544.04 ± 33.2544.82 ± 32.7161.42 ± 38.4855.88 ± 33.2746.97 ± 34.46
OC (μg m−3)10.59 ± 3.7213.55 ± 4.9911.81 ± 4.065.56 ± 1.745.86 ± 1.975.71 ± 1.727.96 ± 4.258.51 ± 4.218.15 ± 3.7010.03 ± 4.7813.73 ± 5.1111.63 ± 4.789.27 ± 4.47
EC (μg m−3)0.65 ± 0.170.78 ± 0.210.72 ± 0.170.63 ± 0.130.63 ± 0.100.63 ± 0.080.69 ± 0.200.74 ± 0.210.70 ± 0.171.18 ± 0.291.47 ± 0.351.31 ± 0.290.83 ± 0.33
OC/PM2.5 (%)18.72 ± 5.3519.53 ± 9.1219.61 ± 7.0336.33 ± 7.6331.12 ± 6.9333.73 ± 6.1526.56 ± 11.2722.34 ± 7.9324.57 ± 8.3727.31 ± 8.5627.06 ± 9.7327.02 ± 7.4725.93 ± 8.86
EC/PM2.5 (%)1.26 ± 0.651.31 ± 0.631.31 ± 0.574.34 ± 1.373.56 ± 1.133.95 ± 1.082.88 ± 1.862.21 ± 1.012.53 ± 1.313.83 ± 1.883.36 ± 1.993.75 ± 1.852.53 ± 1.83
SOC (μg m−3)4.36 ± 2.335.30 ± 3.134.50 ± 2.562.64 ± 1.471.92 ± 1.632.16 ± 1.493.22 ± 3.124.55 ± 3.173.74 ± 2.734.44 ± 3.437.31 ± 3.715.68 ± 3.473.99 ± 2.92
SOC/OC (%)37.22 ± 13.8136.63 ± 12.1634.63 ± 12.4643.02 ± 14.1026.92 ± 18.3433.90 ± 16.0430.65 ± 19.2247.94 ± 11.0939.36 ± 14.0335.20 ± 17.8248.19 ± 10.4240.93 ± 14.8638.03 ± 13.95
SOC/PM2.5 (%)6.37 ± 2.296.96 ± 2.306.47 ± 2.5016.05 ± 7.198.62 ± 6.0411.87 ± 6.196.24 ± 3.5310.29 ± 3.498.63 ± 3.178.77 ± 4.3212.00 ± 3.6510.54 ± 4.029.24 ± 4.52
Table 2. Mass concentrations of OC and EC in Qinhuangdao in different studies.
Study AreaSampling Time SpanPM2.5 (μg·m−3)OC (μg·m−3)EC (μg·m−3)Reference
QinhuangdaoFebruary–March 202372.9911.810.72This study
June–July 202318.245.710.63
October–November 202344.048.150.70
December 2023–January 202455.8811.631.31
Annually (2023)46.979.270.83
October–November 2021--10.880.68[21]
December 2016–January 201749.513.72.7[30]
Disclaimer/Publisher’s Note: The statements, opinions and data contained in all publications are solely those of the individual author(s) and contributor(s) and not of MDPI and/or the editor(s). MDPI and/or the editor(s) disclaim responsibility for any injury to people or property resulting from any ideas, methods, instructions or products referred to in the content.