Abstract
Precipitation pH at a Russin EANET site, Irkutsk, was discussed and explained from the viewpoint of acid–base chemical equilibrium theory. The datasets employed were the wet-only daily basis observations at a subarctic climate urban site from 1999 to 2020. A distinct seasonal variation in pH was discovered for the monthly means over the entire period, from pH5.24 in July to pH6.66 in February, bracketing pH5.6, a criterion for acid rain. Monthly concentration variations in major ions, nss-SO42−, NO3−, NH4+, and nss-Ca2+, divulged that nss-Ca2+ and nss-SO42− were predominant species and that nss-Ca2+ dominated nss-SO42− during winter months and vice versa in summer. Individual pHs were explored with the concentration difference between two ions, ([nss-SO42−] − [nss-Ca2+]), defined as D2, as well as two other differences in selected ion groups, D4 = ([nss-SO42−] + [NO3−]) − ([NH4+] + [nss-Ca2+]) and D6 = ([nss-SO42−] + [NO3−]) − ([NH4+] + [nss-Ca2+] + [nss-Mg2+] + [nss-K+]), to show some clear relationships with pH. The observed results were compared with theoretical calculations, Dn = [H+] − HPCO2Ka1/[H+], where n is 2, 4, or 6. The distribution of ΔpH (=pHcalc − pHobs) for D2 demonstrated the most reasonable pattern with a median of zero among the three Dns. These quantitative results conclude that the Irkutsk pH was controlled dominantly by sulfuric acid and calcium carbonate.
1. Introduction
1.1. Precipitation Chemistry and Acid Rain Issue
Modern precipitation chemistry has developed rapidly with the acid rain problem, where the chemistry of precipitation has been explored from various viewpoints of different disciplines. The problem was first raised by a Swedish scientist, Svante Odén [1], who discovered acidification of freshwater and precipitation. Precipitation pH is a common focus of studies and has been extensively discussed along with major ionic species involved in the acid–base interactions.
Observations of precipitation chemistry were investigated mostly in Europe and North America to elucidate the physical and chemical processes of atmospheric acids, bases, and their related compounds. Since acid rain is a regional and global environmental problem, its monitoring networks have been developed in the world: EACN (1955–1976), WMO/GAW/BAPMoN (1964–), NADP (1977–), CAPMoN (1978–), EANET (2001–), and Male Declaration (2003–) [2]. These regional networks cover various geographical areas and contribute to the Global Atmosphere Watch of WMO. Some of the monitoring datasets have been analyzed to provide global pictures of acid rain and precipitation chemistry [3,4]. Although “acid rain” seems to have fairly improved in recent years, the subject of precipitation chemistry or wet deposition has been included in a more comprehensive discipline, atmospheric chemistry, which provides a clearer experimental basis for network monitoring [5,6].
1.2. Neutralization Factor, NF
In discussions of precipitation chemistry and pH, various measures and factors have been proposed, and chemical models have been developed. The neutralization factor, NF, is an example of a measure, although Possanzini et al. originally He explained NF for the interpretation of aerosol chemistry in a rural area near Rome [7]. Major constituents of the fine particle were sulfate, nitrate, and ammonium, and water extracts of the aerosol showed negligible acid content, which was interpreted to show that ammonia had neutralized the original sulfuric and nitric acids. For further quantitative discussion, the neutralization factor for ammonium was defined as NF(NH4+) = [NH4+]/([nss-SO42−] + [NO3−]), where the brackets denote equivalent-basis concentration hereafter. This concept had been extended to the neutralization of precipitation acidity.
Salve et al. collected 21 precipitation samples from Kabir Nagar, India, and found a pH in the range of 6.0 to 7.3, with a mean of pH6.3 [8]. The NF was used to evaluate neutralization by crustal components and ammonia: NF(NH4+)—0.15, NF(Mg2+)—0.38, and NF(Ca2+)—1.1. The crustal components were recognized to be responsible for the neutralization of the acids.
Based on observations at an urban site in south-central India, Kulshretha et al. reported neutralization factors for Ca2+, NH4+, and K+, calculated to be 1.25, 0.45, and 0.23, respectively [9]. Major neutralization was interpreted to be due to coarse-mode calcium aerosols from soil dust.
Mouli et al. studied the chemistry of rainwater sampled in a regional representative urban site in southern peninsular India [10]. The neutralization factors for NH4+, Ca2+, and Mg2+ were 0.11, 0.33, and 0.88, respectively, and suggested that the crustal components neutralized a large fraction of the available acids.
Wang et al. applied the neutralization factor to a set of five ions, K+, NH4+, Ca2+, Na+, and Mg2+, at ten sites in Northern China to show that NH4+ and Ca2+ had very high neutralization effects and that the contributions of K+, Na+, and Mg2+ were very low [11].
Wu et al. studied rainwater chemistry at Puding in southwestern China with neutralization factors [12]. The factors for Ca2+, NH4+, K+, and Mg2+ were 0.86, 0.09, 0.06, and 0.05, respectively. Calcium species were demonstrated to be the dominant cause of acid neutralization in the sampled precipitation, whereas the other components were insignificant.
Precipitation chemistry was investigated at an urban site in southwestern Turkey by Demirak et al. [13]. The NFs for Ca2+ and NH4+ were 1.18 and 0.20, respectively, which implied that major neutralization had occurred due to Ca2+ species and that calcium aerosol seemed to be a major component in the neutralization of rainwater acidity.
1.3. Fractional Acidity, FA
A similar index to the NF was also employed in cloud water of high acidity. Daum et al. quantified the degree of neutralization using the ratio [H+]/([NO3−] + ([SO42−]) and named it fractional acidity [14]. In their study, the fractional acidity was characteristically in the range between 0.8 and 1.0. Because the ratios [H+]/[NO3−] were quite high, the predominance of H+ over NH4+ reinforced the view that H+ was the principal cation associated with sulfate and nitrate. Fractional acidity and the neutralization factor have a counterpart relationship with each other if the concentration sum, ([H+] + [NH4+] + [Ca2+]), is equal to the other sum, ([SO42−] + [NO3−]).
Al-Moman et al. discussed the fractional acidity of 120 wet-only samples in Antalya, Turkey [15]. The sum of ([H+] + [NH4+] + [Ca2+]) was plotted against ([SO42−] + [NO3−]), which had a correlation coefficient of 0.82, but the slope of the regression line was well over unity. The fractional acidity markedly changed with the season: the value was less than 0.1 from March to September and fairly increased from November to February.
Since partial neutralization was implied for precipitation collected in Singapore with an average pH of 4.5, Balasubramanian et al. examined the neutralization of acidity by calculating fractional acidity [16]. The mean fractional acidity was 0.64, suggesting that more than half of the original sulfuric and nitric acids remained as collected.
Wu et al. also calculated the fractional acidity to be 0.014, indicating that approximately 98.6% of the original acidity was neutralized mainly by calcium carbonate [12].
1.4. Multi-Regression Analysis
A statistical extension of the neutralization factor concept is multi-regression analysis for the interpretation of acid–base chemistry. The relationships between SO42− and NO3− and other cations, respectively, were analyzed across a group of datasets to estimate the average condition of neutralizing bases.
Kaya and Tuncel first confirmed the correlation (r = 0.78) between ([H+] + [NH4+] + [Ca2+]) and ([SO42−] + [NO3−]), and applied the Ankara measurements to multi-regression analysis: [SO42−] = a0 + a1[H+] + a2[Ca2+] + a3[NH4+] and [NO3−] = b0 + b1[H+] + b2[Ca2+] + b3[NH4+] [17]. In total, 78% of sulfate and 81% of nitrate were explained by three independent variables, [H+], [NH4+], and [Ca2+]
Migliavacca et al. discussed the neutralization of sulfuric and nitric acids with ammonia and calcium carbonate by linear regression analysis [18]. The set of variables associated with acidification (SO42− and NO3−) and neutralization (NH4+ and Ca2+) was analyzed. For wet-only samples, 62% of SO42− and 90% of NO3− were explained by the two variables. Of the SO42− samples, 38% were attributed to (NH4)2O4 and 24% CaSO4. As for NO3−, 87.6% were regarded as NH4NO3 and 2.4% as Ca(NO3)2.
Wang et al. also extended the neutralization concept to multiple-regression analysis [11]. Possible contributions of ammonia and calcium carbonate, respectively, to the neutralization of sulfuric and nitric acids were estimated by multiple-linear regression analysis with the following equations for the acids: [SO42−] = α0 + α1[NH4+] + α2[Ca2+] + α3[H+] and [NO3−] = β0 + β1[NH4+] + β2[Ca2+] + β3[H+]. For three of the sites, NH4+ and Ca2+ were the major neutralizing agents for nitric and sulfuric acids, respectively. On the other hand, for another three sites, NH4+ neutralized both acids, whereas for the remaining four sites, Ca2+ mainly interacted with both acids.
1.5. D-Value
Some semi-quantitative approaches have been taken to explain precipitation pH. As is often discussed, pH is related to two quantities, ([SO42−] + [NO3−]) and ([NH4+] + [Ca2+]). Noguchi et al. explored the pH of precipitation water in Hokkaido, northern Japan [19]. pH was plotted against ([SO42−] + [NO3−]) − ([NH4+] + [Ca2+]). The plot was very similar to an acid–base titration curve. However, the electroneutrality of the analytes was not accomplished for higher pHs, which was explained due to undetermined HCO3− from soil and road dust.
Kitamura et al. defined the difference cited above as the D-value, shown in Equation (1), and discussed the precipitation chemistry data at 29 sites for the first two years of the Japanese Acid Deposition Survey (JADS) [20]. The mean pHs over the two years were plotted against the D-values. Although the pH was related to this factor, no distinct quantitative pattern was recognized.
D-value = ([SO42−] + [NO3−]) − ([NH4+] + [Ca2+])
In terms of D-value, He and Balasubramanian characterized and discussed Singapore precipitation by the seasonality of pH [21]. The pH was ca. pH6.5 for a D-value of −52.7 µeq L−1 and decreased gradually to ca. pH 3.4 for 224.7 µeq L−1. When the value was 0.89 µeq L−1, close to zero, the pH was pH5.3, which was interpreted to be very close to pH5.6 in equilibrium with atmospheric CO2.
Sakihara et al. presented a clear continuous relationship between pH and D-value for two-year long observations in Okinawa Island, Japan [22]. The daily basis pH ranged from pH3.89 to pH7.61 as the D-value changed from −156 to 179 µeq L−1. High pHs were suggested to be associated with high concentrations of calcium ion.
Chang et al. carried out an extensive study of changes in precipitation acidity across three continents by using EANET, NADP, and EMEM datasets over the last few decades [23]. In their study, pH was discussed in terms of the D-value equivalent, showing the significance of both Ca2+ and NH4+ species in the neutralization of acidity. They applied linear regression analyses to each of the network datasets.
1.6. Acid-Base Model of pH
Granat carried out important chemistry work on the pH of precipitation [24]. A chemical equilibrium expression in terms of alkalinity was proposed for the interpretation of the precipitation pH from the European Atmospheric Chemistry Network (EACN). This model considered H2SO4, HNO3, NH3, CaCO3, MgCO3, K2CO3, and further carbonate species in equilibrium with atmospheric CO2. The alkalinity of the EACN, varying from −100 to over 300 µmol L−1, was plotted against a broad range of pHs, from pH < 4.0 to pH > 7, to show reasonable agreements between the observation and the calculation.
Alkalinity is defined by Alkalinity = ([HCO3−] + [CO32−] + [OH−] − [H+]) ([25], p. 960).
If hydrogen carbonate is absent, alkalinity is the titrated amount of acid with a negative sign. Alkalinity = −([ nss-SO42−] + [NO3−] − [NH4+] − [nss-Ca2+] − [nss-Mg2+] − [nss-K+]), where nss- denotes the non-seasalt fraction of the ion, estimated from the sodium ion in precipitation and its component ratio of sea water. Granat finally obtained, from the two equations of alkalinity above, a relationship between negative alkalinity and acidity for a pH < 8.
where H, PCO2, and Ka1 are Henry’s law constant for CO2, the atmospheric pressure of CO2, and the first dissociation constant for H2CO3 ([25], pp. 291–294) broad range of the observed pHs will be discussed with this equation. This discussion will be extended later.
[nss-SO42−] + [NO3−] − [NH4+] − [nss-Ca2+] − [nss-Mg2+] − [nss-K+] = [H+] − HPCO2Ka1/[H+]
Various model calculations estimated regional and global distributions of pH and major ion concentrations. Rodhe and coworkers provided a comprehensive picture of precipitation acidity in the discussion of potential impacts to ecosystems. The acidity of natural rainwater on a global scale is estimated to range from pH4.5 to pH5.6 due to the variability of the sulfur cycle [26]. The global distribution of acidifying wet deposition was estimated by using global models to provide global distribution maps, where the three types of acidifying deposition were defined for different nitrogen environments: [H+]precip = [SO42−] + [NO3−] − [NH4+] − [Ca2+] for the precipitation concentration, [pot-H+]N-sat = [SO42−] + [NO3−] + [NH4+] − [Ca2+] for the effective acid deposition to nitrogen-saturated ecosystems, and [pot-H+]N-lim = [SO42−] − [Ca2+] for the effective acid deposition to nitrogen-limited ecosystems [27].
Vet et al. carried out a global assessment of precipitation chemistry as a WMO program [3]. For the analysis, appropriate datasets have been selected after stringent data quality evaluation of the globally collected measurements. Precipitation pH observations on a global basis with four different measures are as follows: M1: [SO42−] + [NO3−], M2: [SO42−] + [NO3−] − [NH4+], M3: [SO42−] + [NO3−] − [NH4+] − [Ca2+], and M4: [SO42−] + [NO3−] + [Cl−] − [NH4+] − [Ca2+] − [Mg2+] − [Na+] − [K+] + 5.1/[H+] (for pH > 5). These measures were compared with the measured acidity, [H+]. Measures 1 and 2 were higher than the measurements. Good agreement was obtained for M3 at acidity over 10 µeq L−1. Below this acidity, however, the M3 was far below the measurements. Measure 4 showed better agreements than M3 for over 10 µeq L−1. However, significant discrepancies were observed below the concentration level.
Shah et al. evaluated the global distribution of acidity of cloud water and precipitation with a detailed model that extended to more inorganic and organic compounds: [H+] = [SO42−] + [NO3−] + [Cl−] + [HSO3−] + [SO32−] + [HCOO−] + [CH3COO−] + [HCO3−] − [NH4+] − [Ca2+] − [Na+]. It is interesting to note that both Mg2+ and K+ were excluded in this model [4].
1.7. EANET Datasets
The EANET covers a region outside of Europe and North America and started the preparatory-phase measurements from March 1998 to December 2000. Regular-phase monitoring was launched in January 2001 in ten countries: China, Indonesia, Japan, Malayasia, Mongolia, Philippines, Republic of Korea, Russia, Thailand, and Vietnam. Further, monitoring expanded to Cambodia, Lao PDR, and Myanmar in 2001, 2002, and 2005, respectively. The stations are classified into three categories, urban (20), rural (17), and remote (21), where the numbers in parentheses indicate the number of stations [28,29]. EANET measurements reach a point where the length of records and the data quality permit statistical manipulation and description. This network is characterized by a broad range of climatic classes: tropical, temperate, and cold climate zones [30]. In terms of rainfall, the annual rainfall amount ranged from 58.6 mm y−1 (Russia) to 4429.6 mm y−1 (Malaysia), with an average of 1735.2 mm y−1 as of 2021.
As reviewed so far, almost all the pH studies discussed precipitation pH in a qualitative or semi-quantitative manner. The present work intends to explore the Irkutsk pH from the viewpoint of chemical equilibrium theory through the application of Granat’s work, which was based on the alkalinity concept but essentially on the equilibrium theory [24]. Unlike physical process studies, chemical equilibrium does not distinguish nitric acid and ammonia (an acid and a base) from ammonium nitrate (a salt). When acids, bases, and salts are dissolved into an aqueous solution, these compounds are dissociated into component ions. These ions are rearranged according to the simultaneous equilibria condition to determine the pH that satisfies the strict restriction of the ion product of water, [H+][OH−] = Kw.
Distinct pH seasonality was explored from the viewpoint of chemical equilibrium theory for the acid–base interactions in aqueous solution to provide explanations for the pH-controlling factor.
2. Materials and Methods
2.1. Siting
Irkutsk is a subarctic climate site that has rainfall each month, with an annual rainfall of 591 mm y−1 as of 2021. Precipitation chemistry monitoring was carried out at an urban site of the EANET, Limnological Institute SB RAS in Irkutsk, Russia (52.248 deg N, 104.259 deg E, 495 m asl). The city has a population of 620,000, with an area of 300 km2 ([31], pp. 7–10).
2.2. Sampling and Analysis
Sample collection and chemical analysis were conducted by following the technical manual of the network [32]. Irkutsk precipitation was collected on a daily basis with a wet-only sampler from October 1999–December 2020. The samples were subjected to chemical analysis for H+ (pH), NH4+, Ca2+, K+, Mg2+, Na+, SO42−, NO3−, Cl−, and HCO3−. Stringent quality assurance procedures were applied in the EANET [32].
2.3. Data Management
When the member countries report their raw measurements to the network center, all datasets of the year are then submitted to the data verification group for careful examination of individual data. After some Q/A communication between experts and field and laboratory experts, if necessary, the verified datasets are discussed and approved by the Scientific Advisory Committee for disclosure [33].
2.4. Dataset
Precipitation datasets from the Irkutsk site are available on the EANET website [34]. The present analysis utilized the raw datasets that met the ENET criteria and yielded positive values for both non-seasalt SO42− and Ca2+ ions ([31], pp. 20–21). Through this data screening policy, as many as 1979 sets of daily measurements were obtained for the period from October 1999 to December 2020.
3. Results
3.1. Rainfall
The Irkutsk climate is a subarctic climate of the humid middle-latitude class, Df, where the winter is severe and precipitation totals are small, with a maximum occurring during the warmer summer months [30].
The hythergraph constructed using observations from the Irkutsk meteorological station close to the site clearly demonstrates that the seasonality in temperature and rainfall amount was very large (Figure 1). During the summer months, June, July, and August, the monthly precipitation was over 60 mm month−1, and the temperature was over 15 °C. In contrast, the precipitation was below ca. 20 mm month−1, with the temperature below ca. −15 °C in December, January, and February. On a daily basis, the precipitation amount ranged from 0.1 to 91.7 mm d−1 at the precipitation monitoring site.
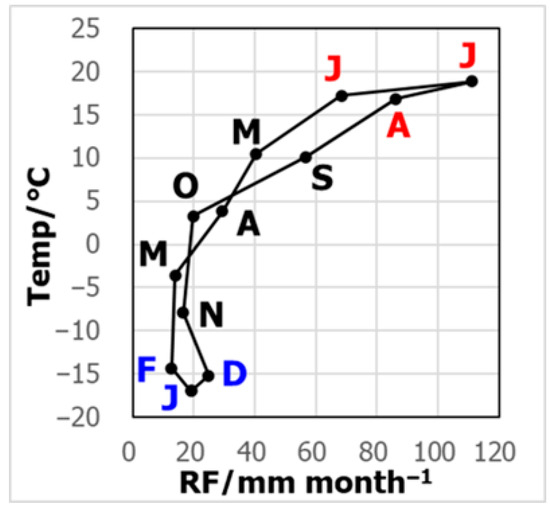
Figure 1.
Hythergraph for Irkutsk, Russia. The letters are the initials of the months.
3.2. Monthly pH Variation
Precipitation pH is the result of a complex chain of physical and chemical processes in the atmosphere. Current atmospheric chemistry seems to have reached a point where the pH can be discussed in consideration of the different mechanisms by which acidic and basic chemical species can be nucleated directly in the atmosphere, where research findings are available.
However, the present work focuses on a monitoring dataset to explain pH from the viewpoint of the chemical equilibrium of ionic species in aqueous solution. To characterize the observed Irkutsk pH, box plots were created from daily data for each month, and monthly pH variation patterns were described with the median and the mean of the month (Figure 2). pH exhibited strong seasonality. The median pH had a minimum value in July (pH5.14) and peaked in February (pH6.60), with an overall median pH of 5.91. Apparently, pH was high, around pH6.5, in winter, and low, about pH5.2, in the summer months. It is interesting to note that the monthly pH fluctuated around pH5.6, which is considered to be the criterion for acid rain.
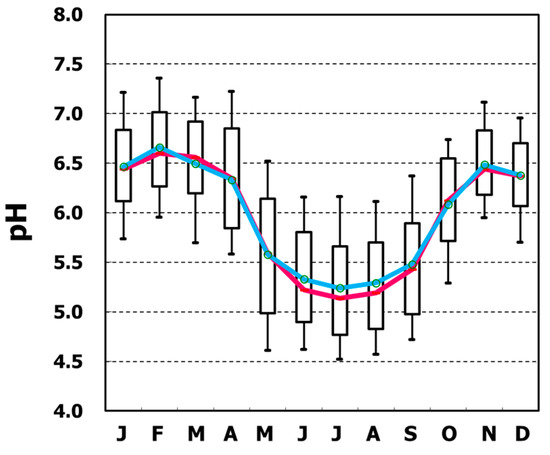
Figure 2.
Whisker plots of monthly pH (blue: mean, red: median).
3.3. Monthly Variations in Major Ion Concentrations
For further investigation of pH seasonality, the monthly concentrations averaged over the entire study period are illustrated in Figure 3 for the major ions, nss-SO42−, NO3−, NH4+, nss-Ca2+, and H+, where the H+ concentrations were multiplied by ten. Among the ions, nss-SO42− and nss-Ca2+ concentrations were considerably higher than those of NO3−, NH4+, and H+. Clearly, both nss-SO42− and nss-Ca2+ showed prominent seasonal variations, high in winter and low in summer. Further, nss-SO42− concentration exceeded that of nss-Ca2+ from May to September, and the opposite trend was observed from September to April. Hydrogen ion concentration also demonstrated a distinguished seasonality, with the concentration peaking in the summer months. This is consistent with the seasonal variation in acidity. Provided that nss-SO42− and nss-Ca2+ represent H2SO4 and CaCO3, respectively, the seasonal order switch would imply that the hydrogen ion concentration is closely related to the seasonality of the relative contribution of these two compounds.
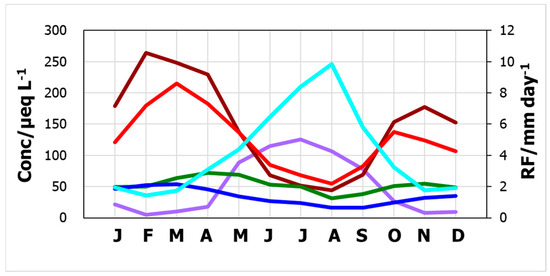
Figure 3.
Monthly averages of ion concentrations and daily rainfall amount. red: nss-SO42−, brown: nss-Ca2+, green: NH4+, dark blue: NO3−, purple: H+ × 10, and light blue: RF.
3.4. Daily pH and the Major Ion Concentrations
To explore the possible contributions of the compounds represented by the major ions, the daily basis raw data was analyzed to confirm their relationship with pH. Figure 4, Figure 5, Figure 6 and Figure 7 show plots of pH against concentrations of nss-Ca2+, nss-SO42−, NH4+, and NO3−. A highly prominent dependence was noted for nss-Ca2+. The concentration varied over a broad range, up to 1800 µeq L−1, and pH increased with nss-Ca2+ concentration, which could be expected because of the nature of calcium species. Another prominent dependence was found for nss-SO42−, whose concentration also increased up to 1800 µeq L−1. As the ion nss-SO42− is supposed to be from sulfuric acid, the lowest pH, around 3.6, occurred at an nss-SO42− concentration of 800 µeq L−1, suggesting that the sulfate is mostly from sulfuric acid. pH increased with decreasing nss-SO42− concentrations to around pH5.5. From this point, however, pH increased with increasing concentrations of nss-SO42−. Together with nss-Ca2+ behavior in pH variation, the low-pH region seems to be mostly associated with H2SO4, while high pH is associated with CaSO4. Compared with these two ions, ammonium and nitrate ions had rather low concentration levels and showed no significant dependence to affect pH.
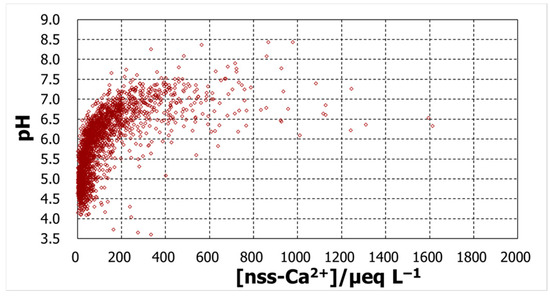
Figure 4.
pH against daily concentrations of nss-Ca2+.
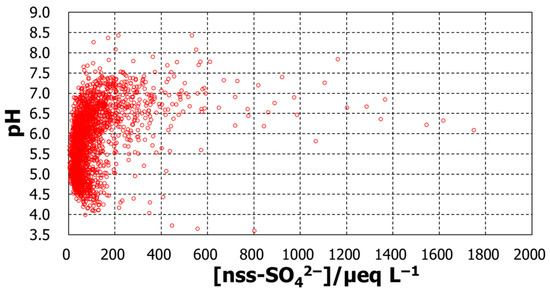
Figure 5.
pH against daily concentrations of nss-SO42−.
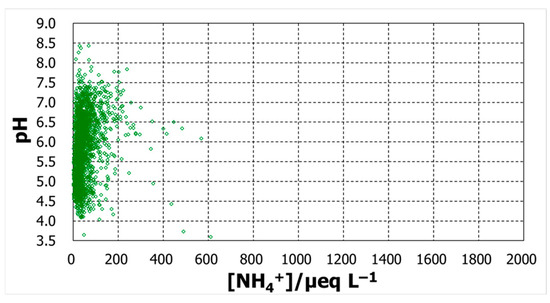
Figure 6.
pH against daily concentrations of NH4+.
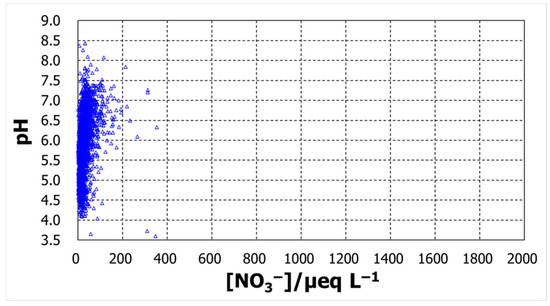
Figure 7.
pH against daily concentrations of NO3−.
3.5. Daily pH and the Calcium Ion Fraction
To confirm the possibility that pH is determined by the relative amount of sulfuric acid and calcium carbonate, the pH was plotted against the calcium-ion fraction [nss-Ca2+]/([nss-Ca2+] + [nss-SO42−]) as shown in Figure 8. Below 0.5 of the calcium-ion fraction, the pH generally increased with the fraction, roughly from pH4 to pH6. Above 0.5, the pH was likely to continue to increase, but with more scatters, and exceeded pH7.5. Although the plot is considerably scattered, the general speculated trend could be accepted.
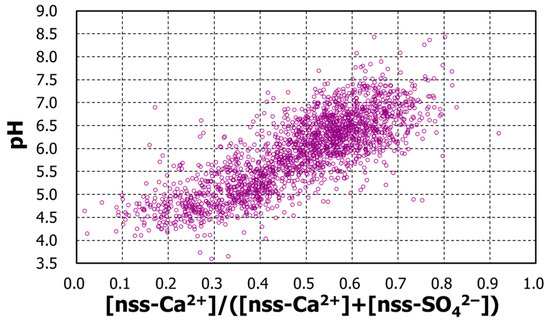
Figure 8.
pH against fractional nss-Ca2+; daily concentrations of [nss-Ca2+]/([nss-Ca2+] + [nss-SO42−]).
These results led to the working hypothesis that pH is determined by the concentration of sulfuric acid and calcium carbonate. In other words, the pH is related to two of the compounds in Irkutsk precipitation and further quantitatively with the concentration difference, ([nss-SO42−] − [nss-Ca2+]).
3.6. Daily pH and Three Types of the Concentration Difference: Observation
This concentration difference can be regarded as a simplified D-value, Equation (1) [20], when [NO3−] and [NH4+] are neglected. Provided that the negative form of Granat’s alkalinity, Equation (2), is taken [24], the quantity can be a type of D-value with six kinds of ions. For a comprehensive understanding of acid–base chemistry, three types of D-value are therefore proposed, denoted as Dn where the suffix corresponds to the number of ions considered.
D2 = ([nss-SO42−] − [nss-Ca2+])
D4 = ([nss-SO42−] + [NO3−]) − ([NH4+] + [nss-Ca2+])
D6 = ([nss-SO42−] + [NO3−]) − ([NH4+] + [nss-Ca2+] + [nss-Mg2+] + [nss-K+])
pH was plotted against D2, D4, and D6, respectively. All figures showed a kind of S-shaped pattern, like a titration curve. Compared with the D2 and D4 cases, the D6 case extended more in the negative direction, with more scatters. However, the general patterns were very similar to each other over the entire range of Dn.
3.7. Calculation of pH with the Concentration Differences
For further discussion, an equation for the theoretical pH of the observed value of Dn was derived as Equation (6) by extending Granat formalism (Equation (3)) [24].
Dn = [H+] − HPCO2Ka1/[H+]
The CO2 concentration was supposed to be 400 ppm. The temperature is assumed to be 5 °C because the analysis samples are usually stored in a refrigerator (ca. 5 °C) until laboratory work.
Three calculated lines were added to Figure 9, Figure 10 and Figure 11. For the D2 case, the calculation was regarded as passing roughly throughout the middle of the variation in the measurements. However, calculation with D4 pass through the right and those with D6 pass through the far right.
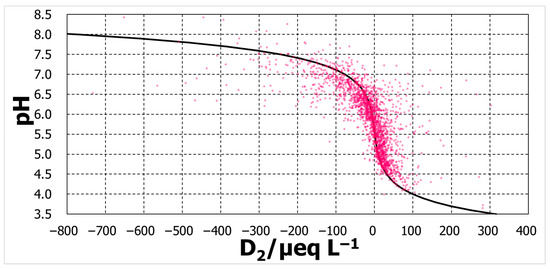
Figure 9.
pH against D2.
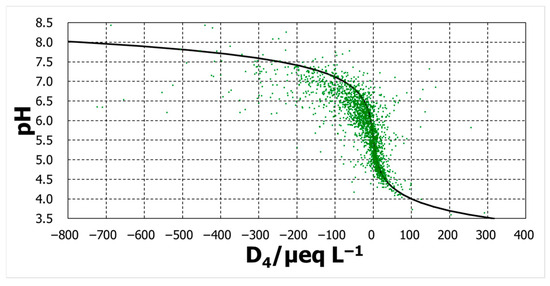
Figure 10.
pH against D4.
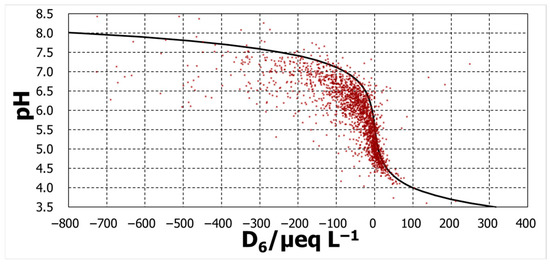
Figure 11.
pH against D6.
3.8. Evaluation of the Agreement Between the Calculation and the Observation
The degree of agreement was evaluated by the pH difference between the calculated and observed pHs, ΔpH (=pHcalc − pHobs). The distributions of ΔpH occurrence were some normal distribution-like patterns (Figure 12). The mode of distribution of ΔpH for D2 was zero, whereas the D4 mode moved in a positive direction of ΔpH, and that for D6 moved further in the same direction. Among the three, D2 can explain the pH over a broad pH range, although D4 and D6 might provide some acceptable explanations.
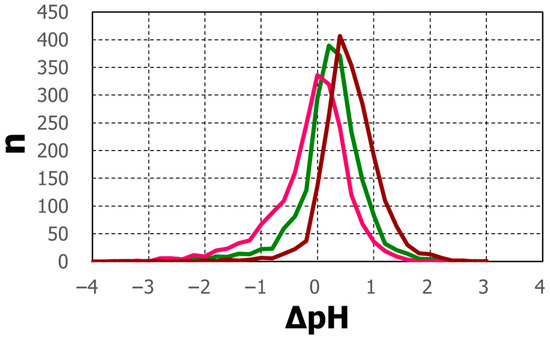
Figure 12.
Number distribution of ΔpH (=pHcalc − pHobs) for D2 (red), D4 (green) and D6 (brown).
In conclusion, the Irkutsk pH is essentially explained by the concentration difference of ([nss-SO42−] − [nss-Ca2+]). Despite the possible contribution to pH of other compounds represented by corresponding ions, the overall pH chemistry is concluded to be determined by two compounds, sulfuric acid and calcium carbonate, in Irkutsk, Russia.
4. Conclusions
The wet-only daily basis datasets at Irkutsk from 1999 to 2020 were analyzed to demonstrate the following findings:
- (1)
- The monthly average pH over the entire period ranged from pH5.24 in July to pH6.66 in February, bracketing pH 5.6. Among the four major ions, nss-SO42−, NO3−, NH4+, and nss-Ca2+, nss-Ca2+ and nss-SO42− were the highly predominant species. Non-seasalt Ca2+ dominated nss-SO42− during winter months and vice versa in summer, which was consistent with pH seasonality.
- (2)
- The above characteristics of the two ions suggested a possible pH-controlling factor, D2 (=[nss-SO42−] − [ nss-Ca2+]), against which pH was plotted to obtain a titration curve-like pattern. Similar patterns were illustrated for two other differences, D4 and D6.
- (3)
- The consideration of acid–base chemical equilibrium gave a quantitative relationship, D2 = [H+] − HPCO2Ka1/[H+]. The observed pH was compared with the calculation over a broad range of D2 in terms of ΔpH(= pHcalc − pHobs) to demonstrate a good agreement with the theory.
- (4)
- In the light of current understanding of precipitation chemistry [3] and of Granat’s pioneering work [24], the present detailed description of the measurements and detailed chemical equilibrium approach allow us to conclude that the Irkutsk pH is evidently controlled predominantly by the relative contributions of sulfuric acid and calcium carbonate.
Author Contributions
H.H.; writing—review and editing. I.N.; discussion of pH issues. All authors have read and agreed to the published version of the manuscript.
Funding
The research received no external funding.
Institutional Review Board Statement
Not applicable.
Informed Consent Statement
Not applicable.
Data Availability Statement
The original contributions presented in this study are included in the article. Further inquiries can be directed to the corresponding author.
Acknowledgments
Authors are thankful to Lennart Granat for his helpful discussion and encouragement, and to Tamara Khodzher, Limnological Institute, Irkutsk, for her continuing co-operation and understanding.
Conflicts of Interest
The authors declare no conflicts of interest.
References and Note
- Odén, S. The acidity problem-an outline of concepts. Water Air Soil Pollut. 1976, 6, 137–166. [Google Scholar] [CrossRef]
- Grennfelt, P.; Engleryd, A.; Hov, F.M.; Rodhe, H.; Cowling, E. Acid rain and air pollution: 50 years of progress in environmental science and policy. Ambio 2020, 49, 849–864. [Google Scholar] [CrossRef]
- Vet, R.; Artz, R.S.; Carou, S.; Shaw, M.; Ro, C.-U.; Aas, W.; Baker, A.; Bowersox, V.C.; Dentener, F.; Galy-Lacaux, C.; et al. A global assessment of precipitation chemistry and deposition of sulfur, nitrogen, sea salt, base cations, organic acids, acidity and pH, and phosphorus. Atmos. Environ. 2014, 93, 3–176. [Google Scholar] [CrossRef]
- Shah, V.; Jacob, D.J.; Moch, J.M.; Wang, X.; Zhai, S. Global modeling of cloud water acidity, precipitation acidity, and acid inputs to ecosystems. Atmos. Chem. Phys. 2020, 20, 12223–12245. [Google Scholar] [CrossRef]
- Dragomir, C.M.; Constantin, D.E.; Voiculescu, M.; Georgescu, L.P.; Merlaud, A.; Roozendael, M.V. Modeling results of atmospheric dispersion of NO2 in an urban area using METI–LIS and comparison with coincident mobile DOAS measurements. Atmos. Pollut. Res. 2015, 6, 503–510. [Google Scholar] [CrossRef]
- Meier, A.C.; Schönhardt, A.; Bösch, T.; Richter, A.; Seyler, A.; Ruhtz, T.; Constantin, D.E.; Shaiganfar, R.; Wagner, T.; Merlaud, A.; et al. High-resolution airborne imaging DOAS measurements of NO2 above Bucharest during AROMAT. Atmos. Meas. Tech. 2017, 10, 1831–1857. [Google Scholar] [CrossRef]
- Possanzini, M.; Buttine, P.; Palo, V.D. Characterization of a rural area in terms of dry and wet deposition. Sci. Total Environ. 1988, 74, 111–120. [Google Scholar] [CrossRef] [PubMed]
- Salve, P.R.; Maurya, A.; Wate, S.R.; Devotta, S. Chemical composition of major ions in rainwater. Bull. Environ. Contam. Toxicol. 2008, 80, 242–246. [Google Scholar] [CrossRef]
- Kulshrestha, U.C.; Kulshrestha, M.J.; Sekar, R.; Sastry, G.S.R.; Vairamani, M. Chemical characteristics of rainwater at an urban site of south-central India. Atmos. Environ. 2003, 37, 3019–3026. [Google Scholar] [CrossRef]
- Mouli, P.C.; Mohan, S.V.; Reddy, S.J. Rainwater chemistry at a regional representative urban site: Influence of terrestrial sources on ionic composition. Atmos. Environ. 2005, 39, 999–1008. [Google Scholar] [CrossRef]
- Wang, Y.; Yu, W.; Pan, Y.; Wu, D. Acid neutralization of precipitation in Northern China. J. Air Waste Manag. Assoc. 2012, 62, 204–211. [Google Scholar] [CrossRef]
- Wu, Q.; Han, G.; Tao, F.; Tang, Y. Chemical composition of rainwater in a karstic agricultural area, Southwest China: The impact of urbanization. Atmos. Res. 2012, 111, 71–78. [Google Scholar] [CrossRef]
- Demirak, A.; Balci, A.; Karaoglu, H.; Tosmur, B. Chemical characterization of rain water at an urban site of south western Turkey. Environ. Monit. Assess. 2006, 123, 271–283. [Google Scholar] [CrossRef] [PubMed]
- Daum, P.H.; Kelly, T.J.; Schwartz, S.E.; Newman, L. Measurements of the chemical composition of stratiform clouds. Atmos. Environ. 1984, 18, 2671–2684. [Google Scholar] [CrossRef]
- Al-Moman, I.F.; Ayugun, S. Wet deposition of major ions and trace elements in the eastern Mediterranean basin. J. Geophys. Res. 1998, 103, 8287–8299. [Google Scholar] [CrossRef]
- Balasubramanian, R.; Victor, T.; Chun, N. Chemical and statistical analysis of precipitation in Singapore. Water Air Soil Pollut. 2001, 130, 451–456. [Google Scholar] [CrossRef]
- Kaya, G.; Tuncel, G. Trace element and major ion composition of wet and dry deposition in Ankara, Turkey. Atmos. Environ. 1997, 31, 3985–3998. [Google Scholar] [CrossRef]
- Migliavacca, D.; Teizeira, E.C.; Wiegand, F.; Machado, A.C.M.; Sanchez, J. Atmospheric precipitation and chemical composition of an urban site, Guaíba hydrographic basin, Brazil. Atmos. Environ. 2005, 39, 1829–1844. [Google Scholar] [CrossRef]
- Noguchi, I.; Kato, T.; Matsumoto, Y.; Araki, K. Study of rain water in Hokkaido. Part 2: Dissolved component in rain waters. Rep. Hokkaido Res. Inst. Environ. Pollut. 1989, 15, 39–51. [Google Scholar]
- Kitamura, M.; Katou, T.; Sekiguchi, K.; Taguchi, K.; Tamaki, M.; Ohara, M.; Mori, A.; Murano, K.; Wakamatsu, S.; Yamanaka, Y.; et al. pH and its frequency distribution patterns of acid precipitation in Japan. Nippon Kagaku Kaishi 1991, 6, 913–919. (In Japanese) [Google Scholar] [CrossRef]
- He, J.; Balasubramanian, R. Rain-aerosol coupling in the tropical atmosphere of Southeast Asia: Distribution and scavenging ratios of major ionic species. J. Atmos. Chem. 2008, 60, 205–220. [Google Scholar] [CrossRef]
- Sakihama, H.; Ishiki, M.; Tokuyama, A. Chemical characteristics of precipitation in Okinawa Island, Japan. Atmos. Environ. 2008, 42, 2320–2325. [Google Scholar] [CrossRef]
- Chang, C.T.; Yang, C.J.; Huang, K.H.; Huang, J.C.; Lin, T.C. Changes of precipitation acidity related to sulfur and nitrogen deposition in forest across three continents in north hemisphere over last two decades. Sci. Total Environ. 2022, 806, 150552. [Google Scholar] [CrossRef] [PubMed]
- Granat, L. On the relation between pH and the chemical composition in atmospheric precipitation. Tellus 1972, 24, 550–560. [Google Scholar] [CrossRef]
- Seinfeld, J.H.; Pandis, S.N. Atmospheric Chemistry and Physics, 2nd ed.; John Wiley & Sons: Hoboken, NJ, USA, 2006. [Google Scholar]
- Charlson, R.J.; Rodhe, H. Factors controlling the acidity of natural precipitation. Nature 1982, 295, 683–685. [Google Scholar] [CrossRef]
- Rodhe, H.; Dentner, F. The global distribution of acidifying wet deposition. Environ. Sci. Technol. 2002, 36, 4382–4388. [Google Scholar] [CrossRef]
- Akimoto, H.; Awan, M.B.; Cho, S.Y.; Gromov, S.A.; Hara, H.; Khummongkol, P.; Ueda, H. (Eds.) Periodic Report of State of Acid Deposition in East Asia, Part I: Regional Assessment; The Network Center for EANET: Niigata-shi, Japan, 2006; pp. 47–50. [Google Scholar]
- Network Center for EANET. Data Report 2023; EANET: Niigata-shi, Japan, 2024; p. 3. [Google Scholar]
- Tarbuck, E.J.; Lutgens, F.K.; Tasa, D. Earth Science, 12th ed.; Pearson Printice Hall: Hoboken, NJ, USA, 2009; pp. 571–584. [Google Scholar]
- Network Center for EANET. Data Report 2021; Publications | Acid Deposition & Air Quality Management; EANET: Niigata-shi, Japan, 2021; Available online: https://monitoring.eanet.asia/document/public/index#:~:text=You%20can%20freely%20download%20the%20data%20report%20%28pdf%29%2C,report%20of%20Inter-Laboratory%20Comparison%20Project%20%28pdf%29%20without%20registration (accessed on 12 May 2024).
- Network Center for EANET. Technical Manual for Wet Deposition Monitoring in East Asia-2010. 2010. Available online: https://www.eanet.asia/wp-content/uploads/2019/04/techwet.pdf (accessed on 12 May 2024).
- Some explanation may be needed for the present usage of the Irkutsk datasets. The measurement itself was carried out by Irkutsk experts while one of the authors (H. H.) has long examined all raw data as a member of EANET Science Committee and of the data verification group. The other author (I.N.) was involved in the revision of the EANET technical manual.
- Available online: https://monitoring.eanet.asia/document/public/index (accessed on 10 June 2023).
Disclaimer/Publisher’s Note: The statements, opinions and data contained in all publications are solely those of the individual author(s) and contributor(s) and not of MDPI and/or the editor(s). MDPI and/or the editor(s) disclaim responsibility for any injury to people or property resulting from any ideas, methods, instructions or products referred to in the content. |
© 2025 by the authors. Licensee MDPI, Basel, Switzerland. This article is an open access article distributed under the terms and conditions of the Creative Commons Attribution (CC BY) license (https://creativecommons.org/licenses/by/4.0/).