Mapping Ecosystem Carbon Storage in the Nanling Mountains of Guangdong Province Using Machine Learning Based on Multi-Source Remote Sensing
Abstract
1. Introduction
2. Data and Methods
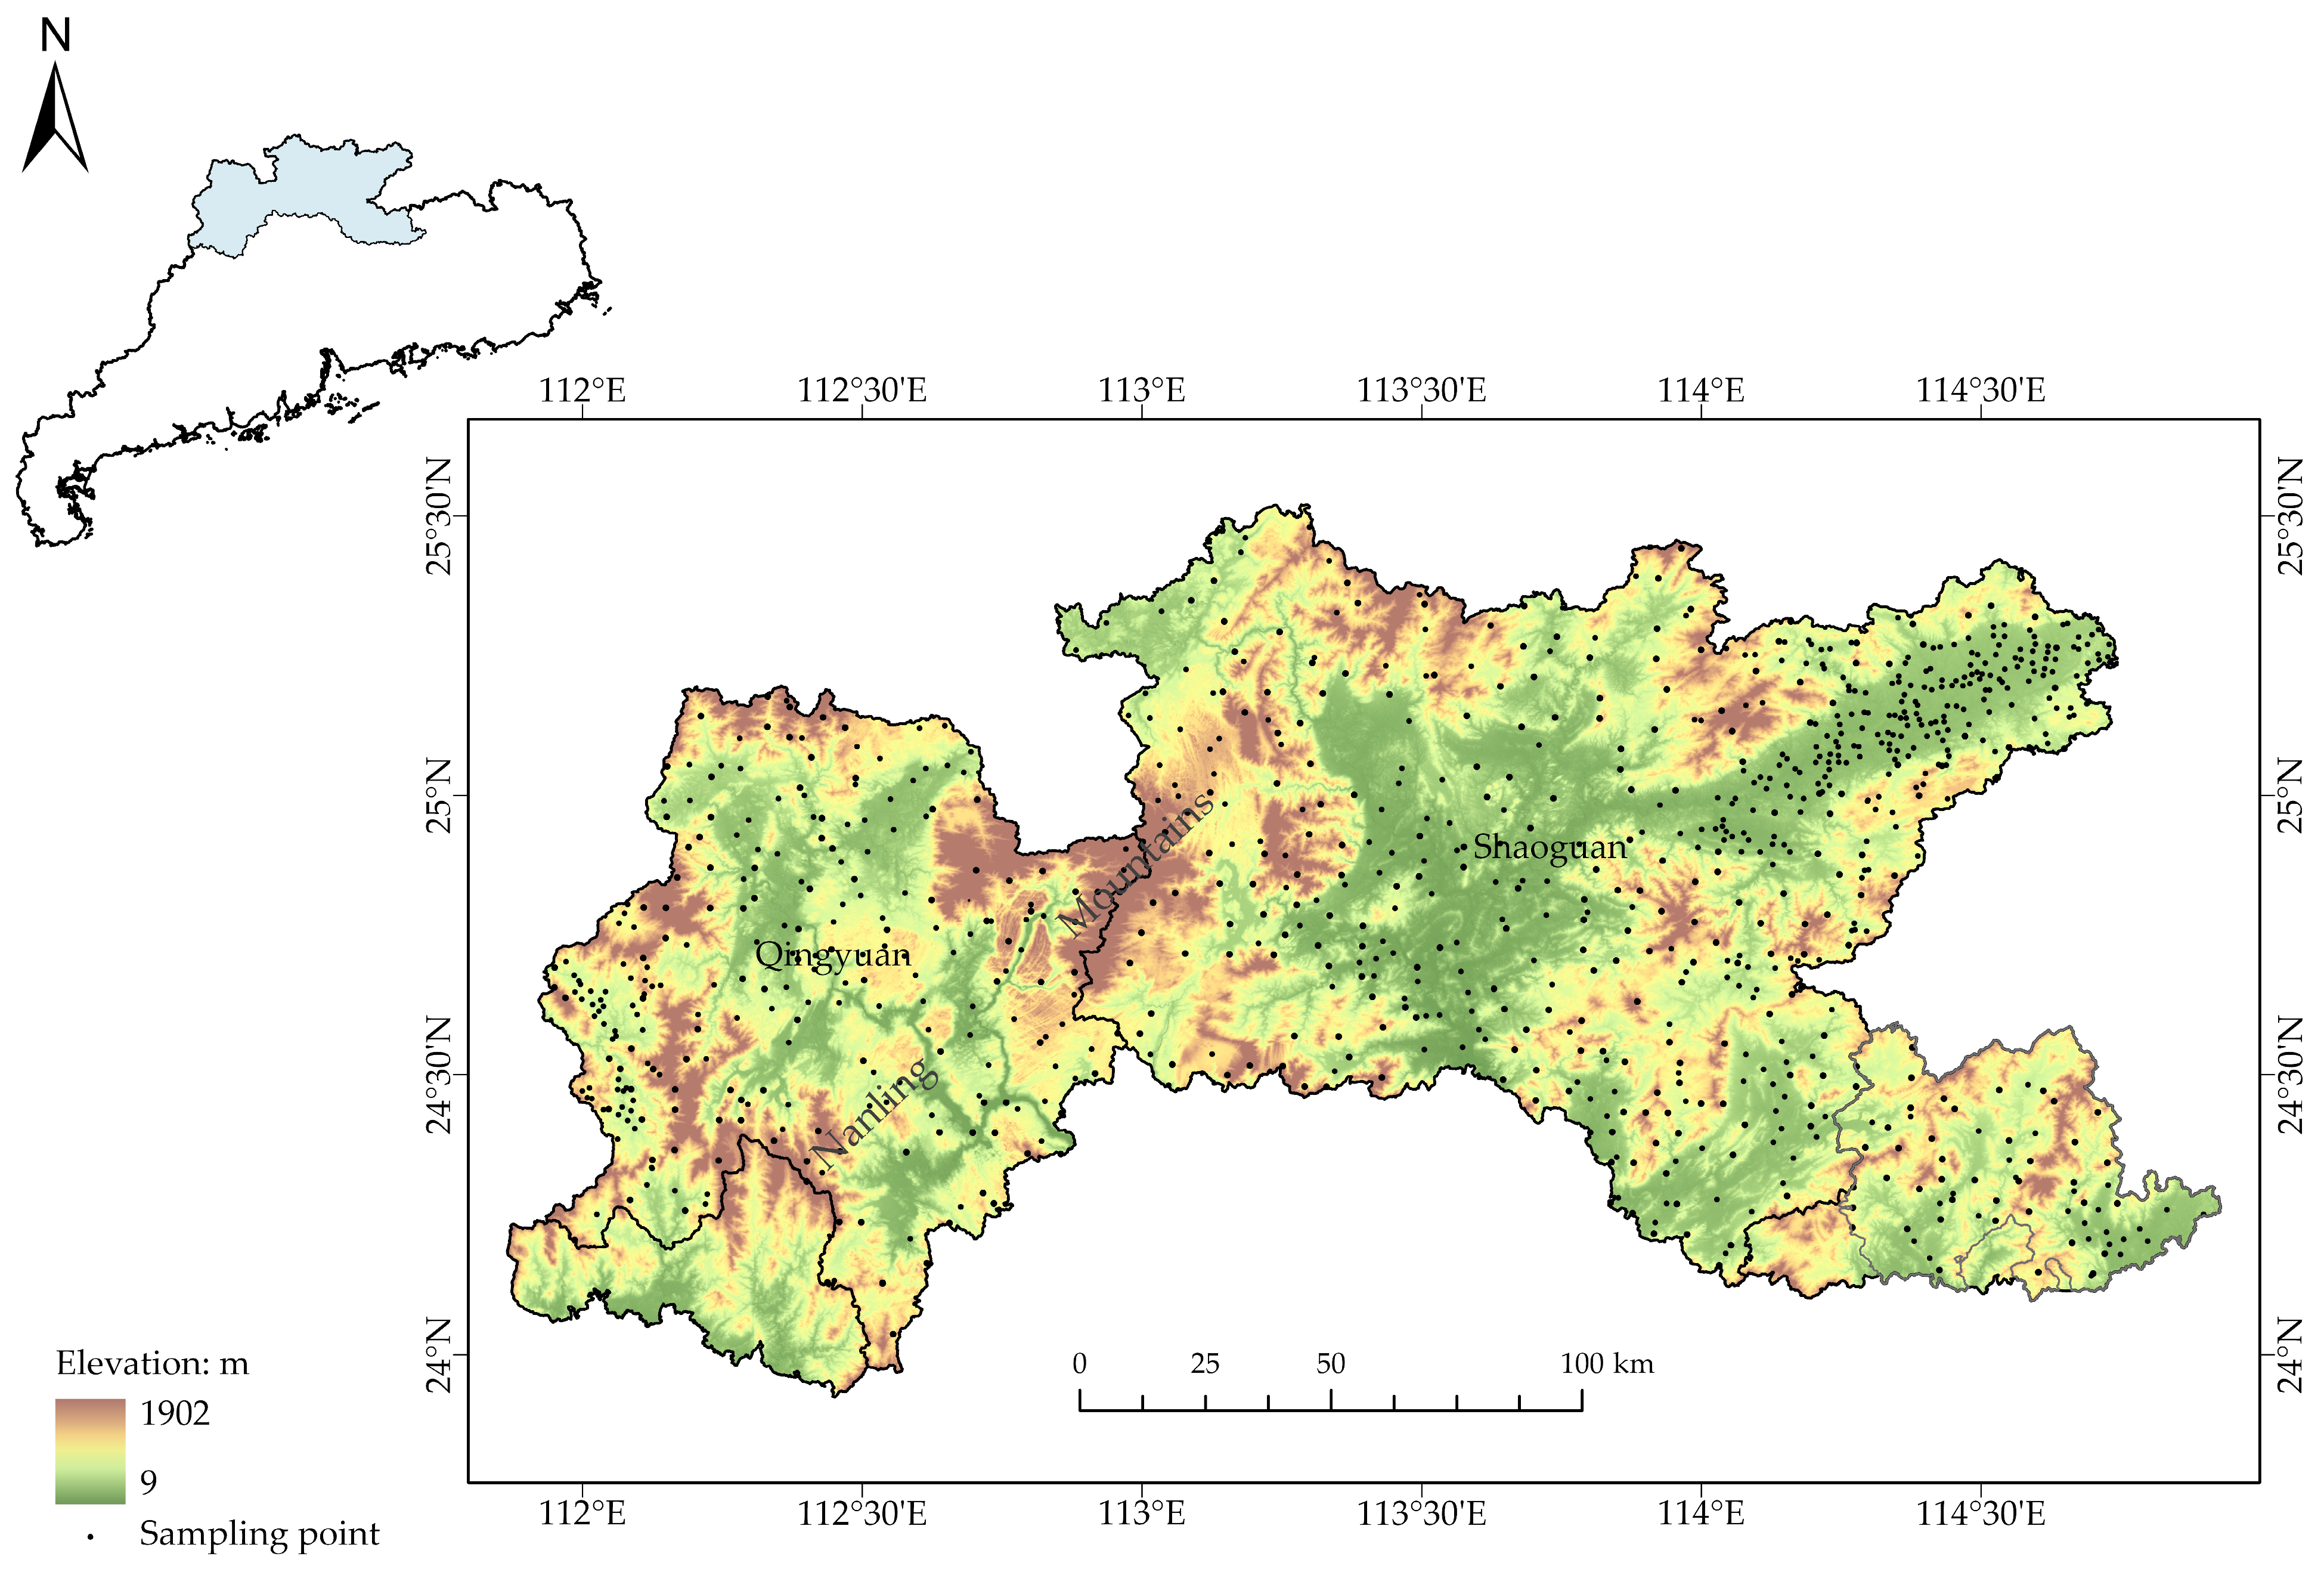
2.1. Study Area
2.2. Data and Sources
2.3. Methods
2.3.1. Environmental Variables
2.3.2. Model Construction
2.3.3. Carbon Storage Calculation
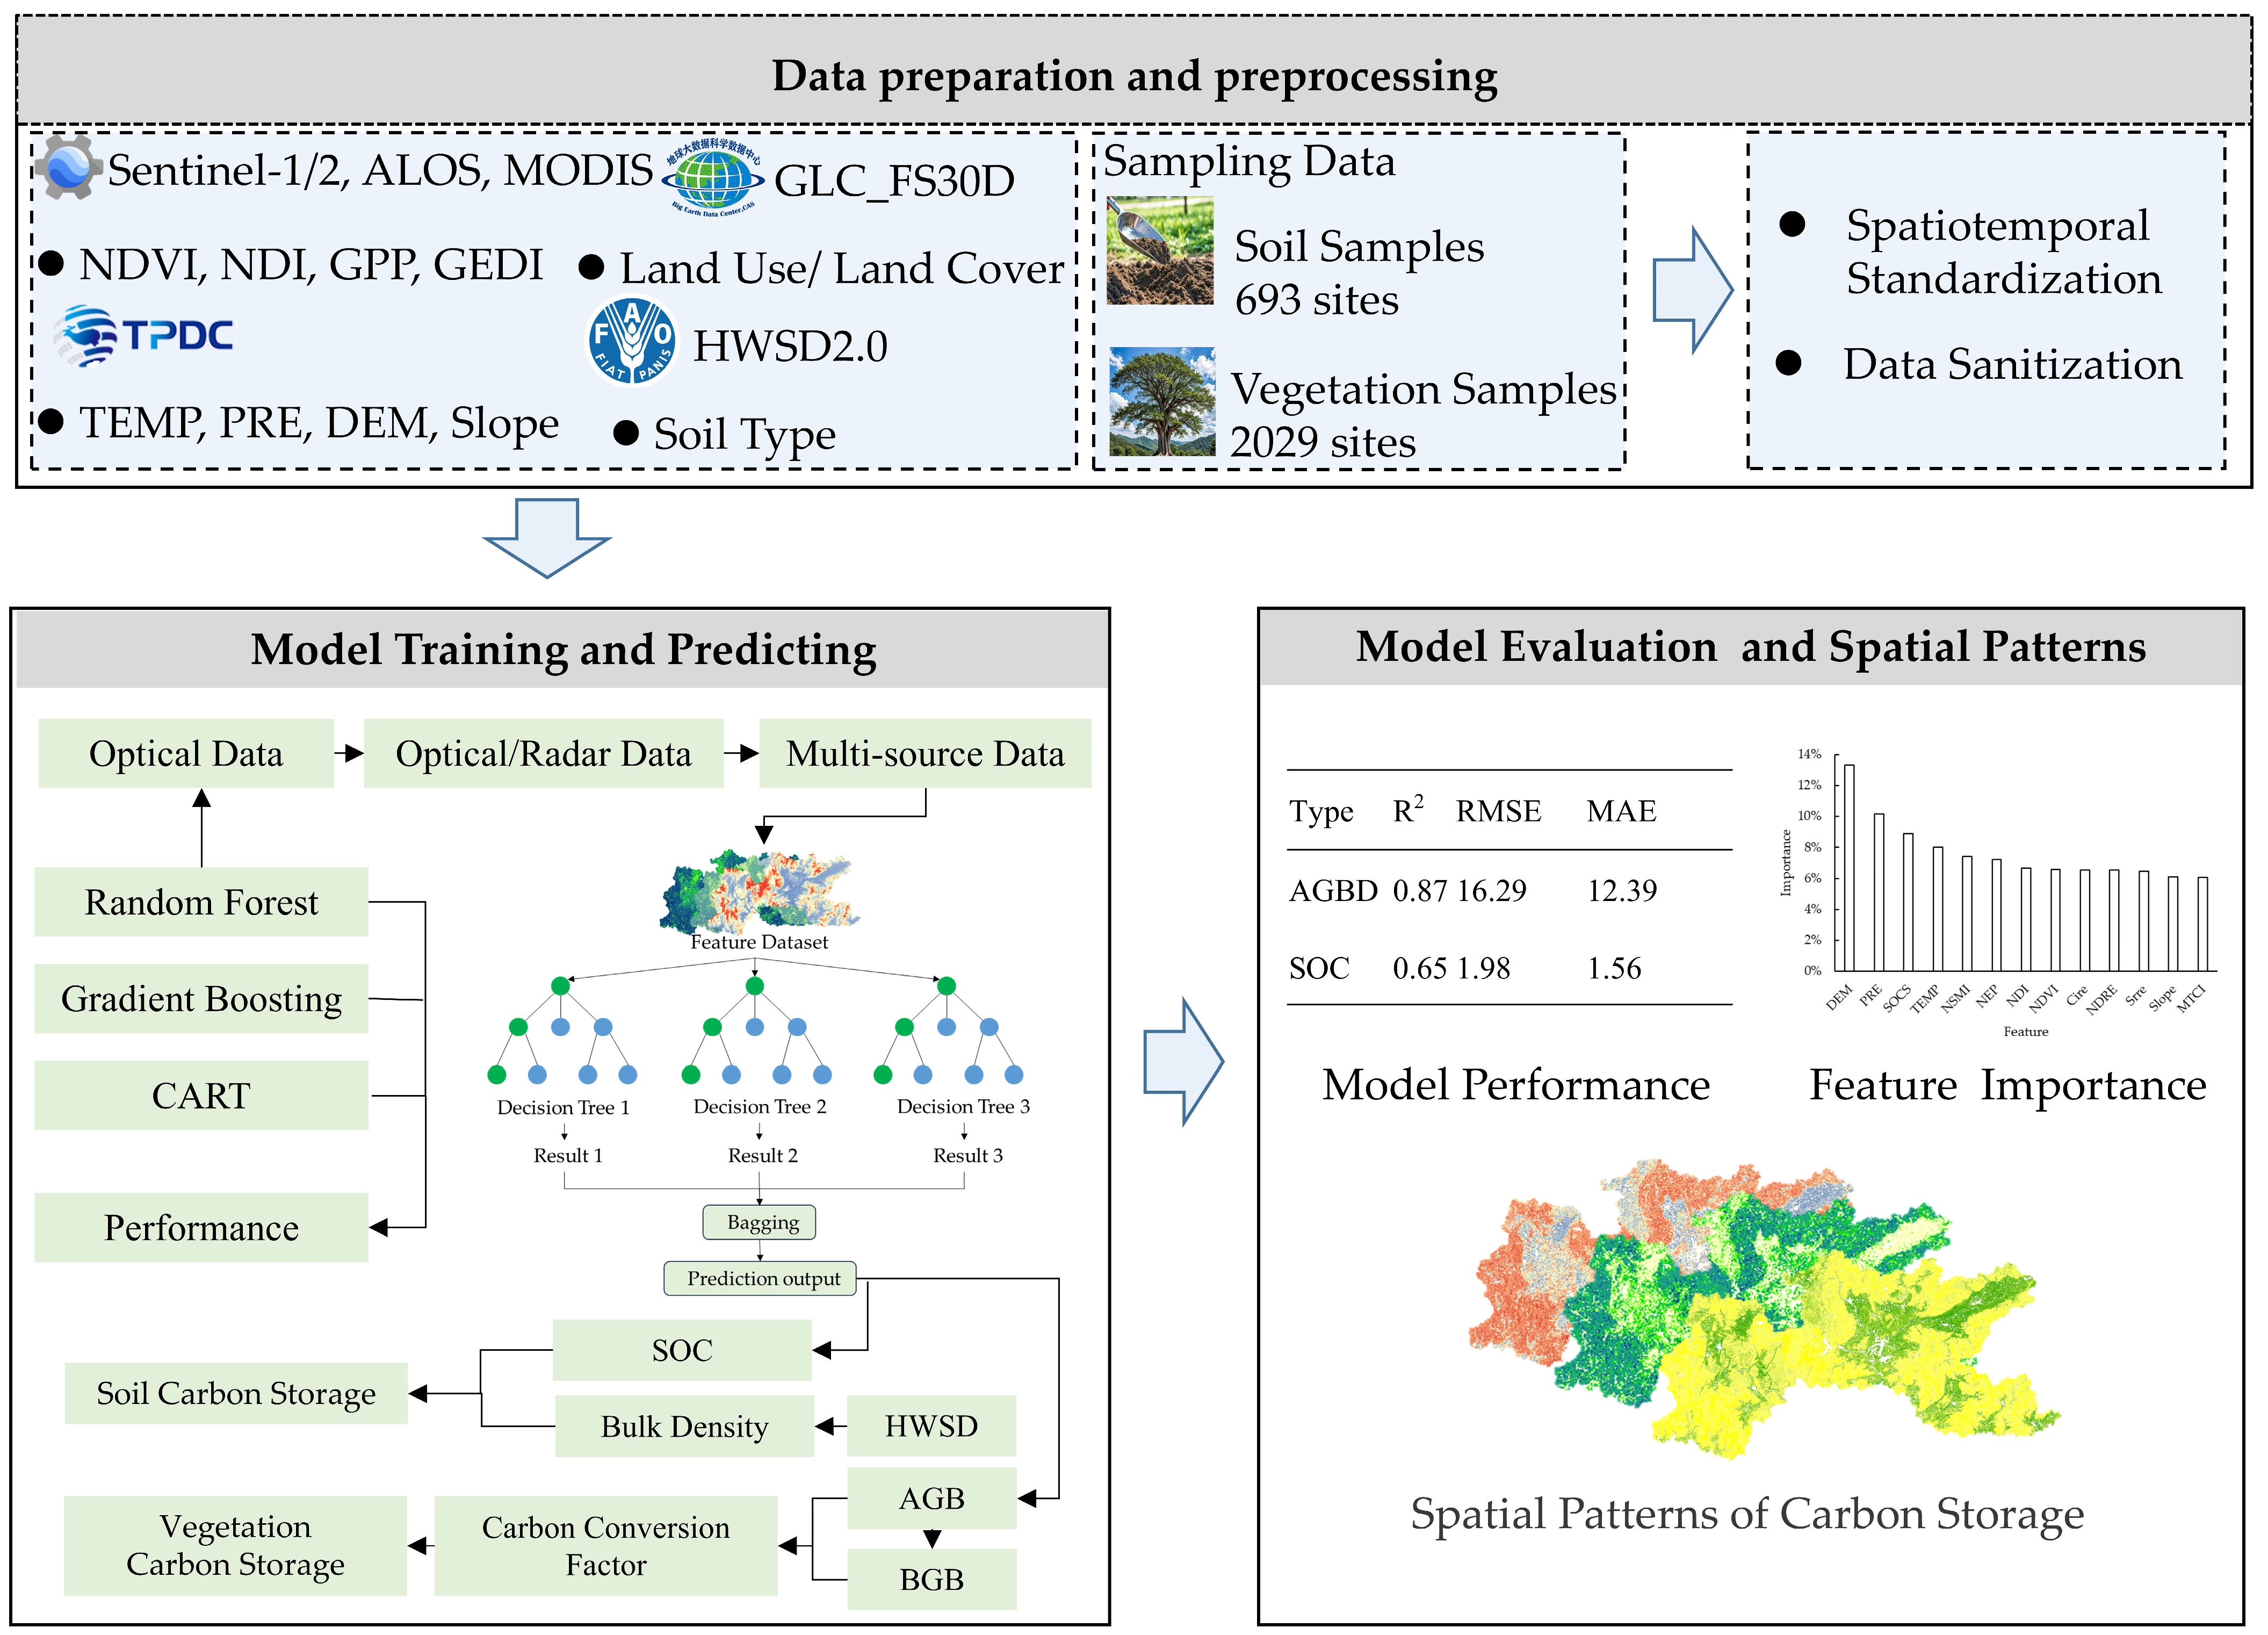
2.3.4. Workflow
3. Results
3.1. Accuracy Assessment with Multi-Source Data
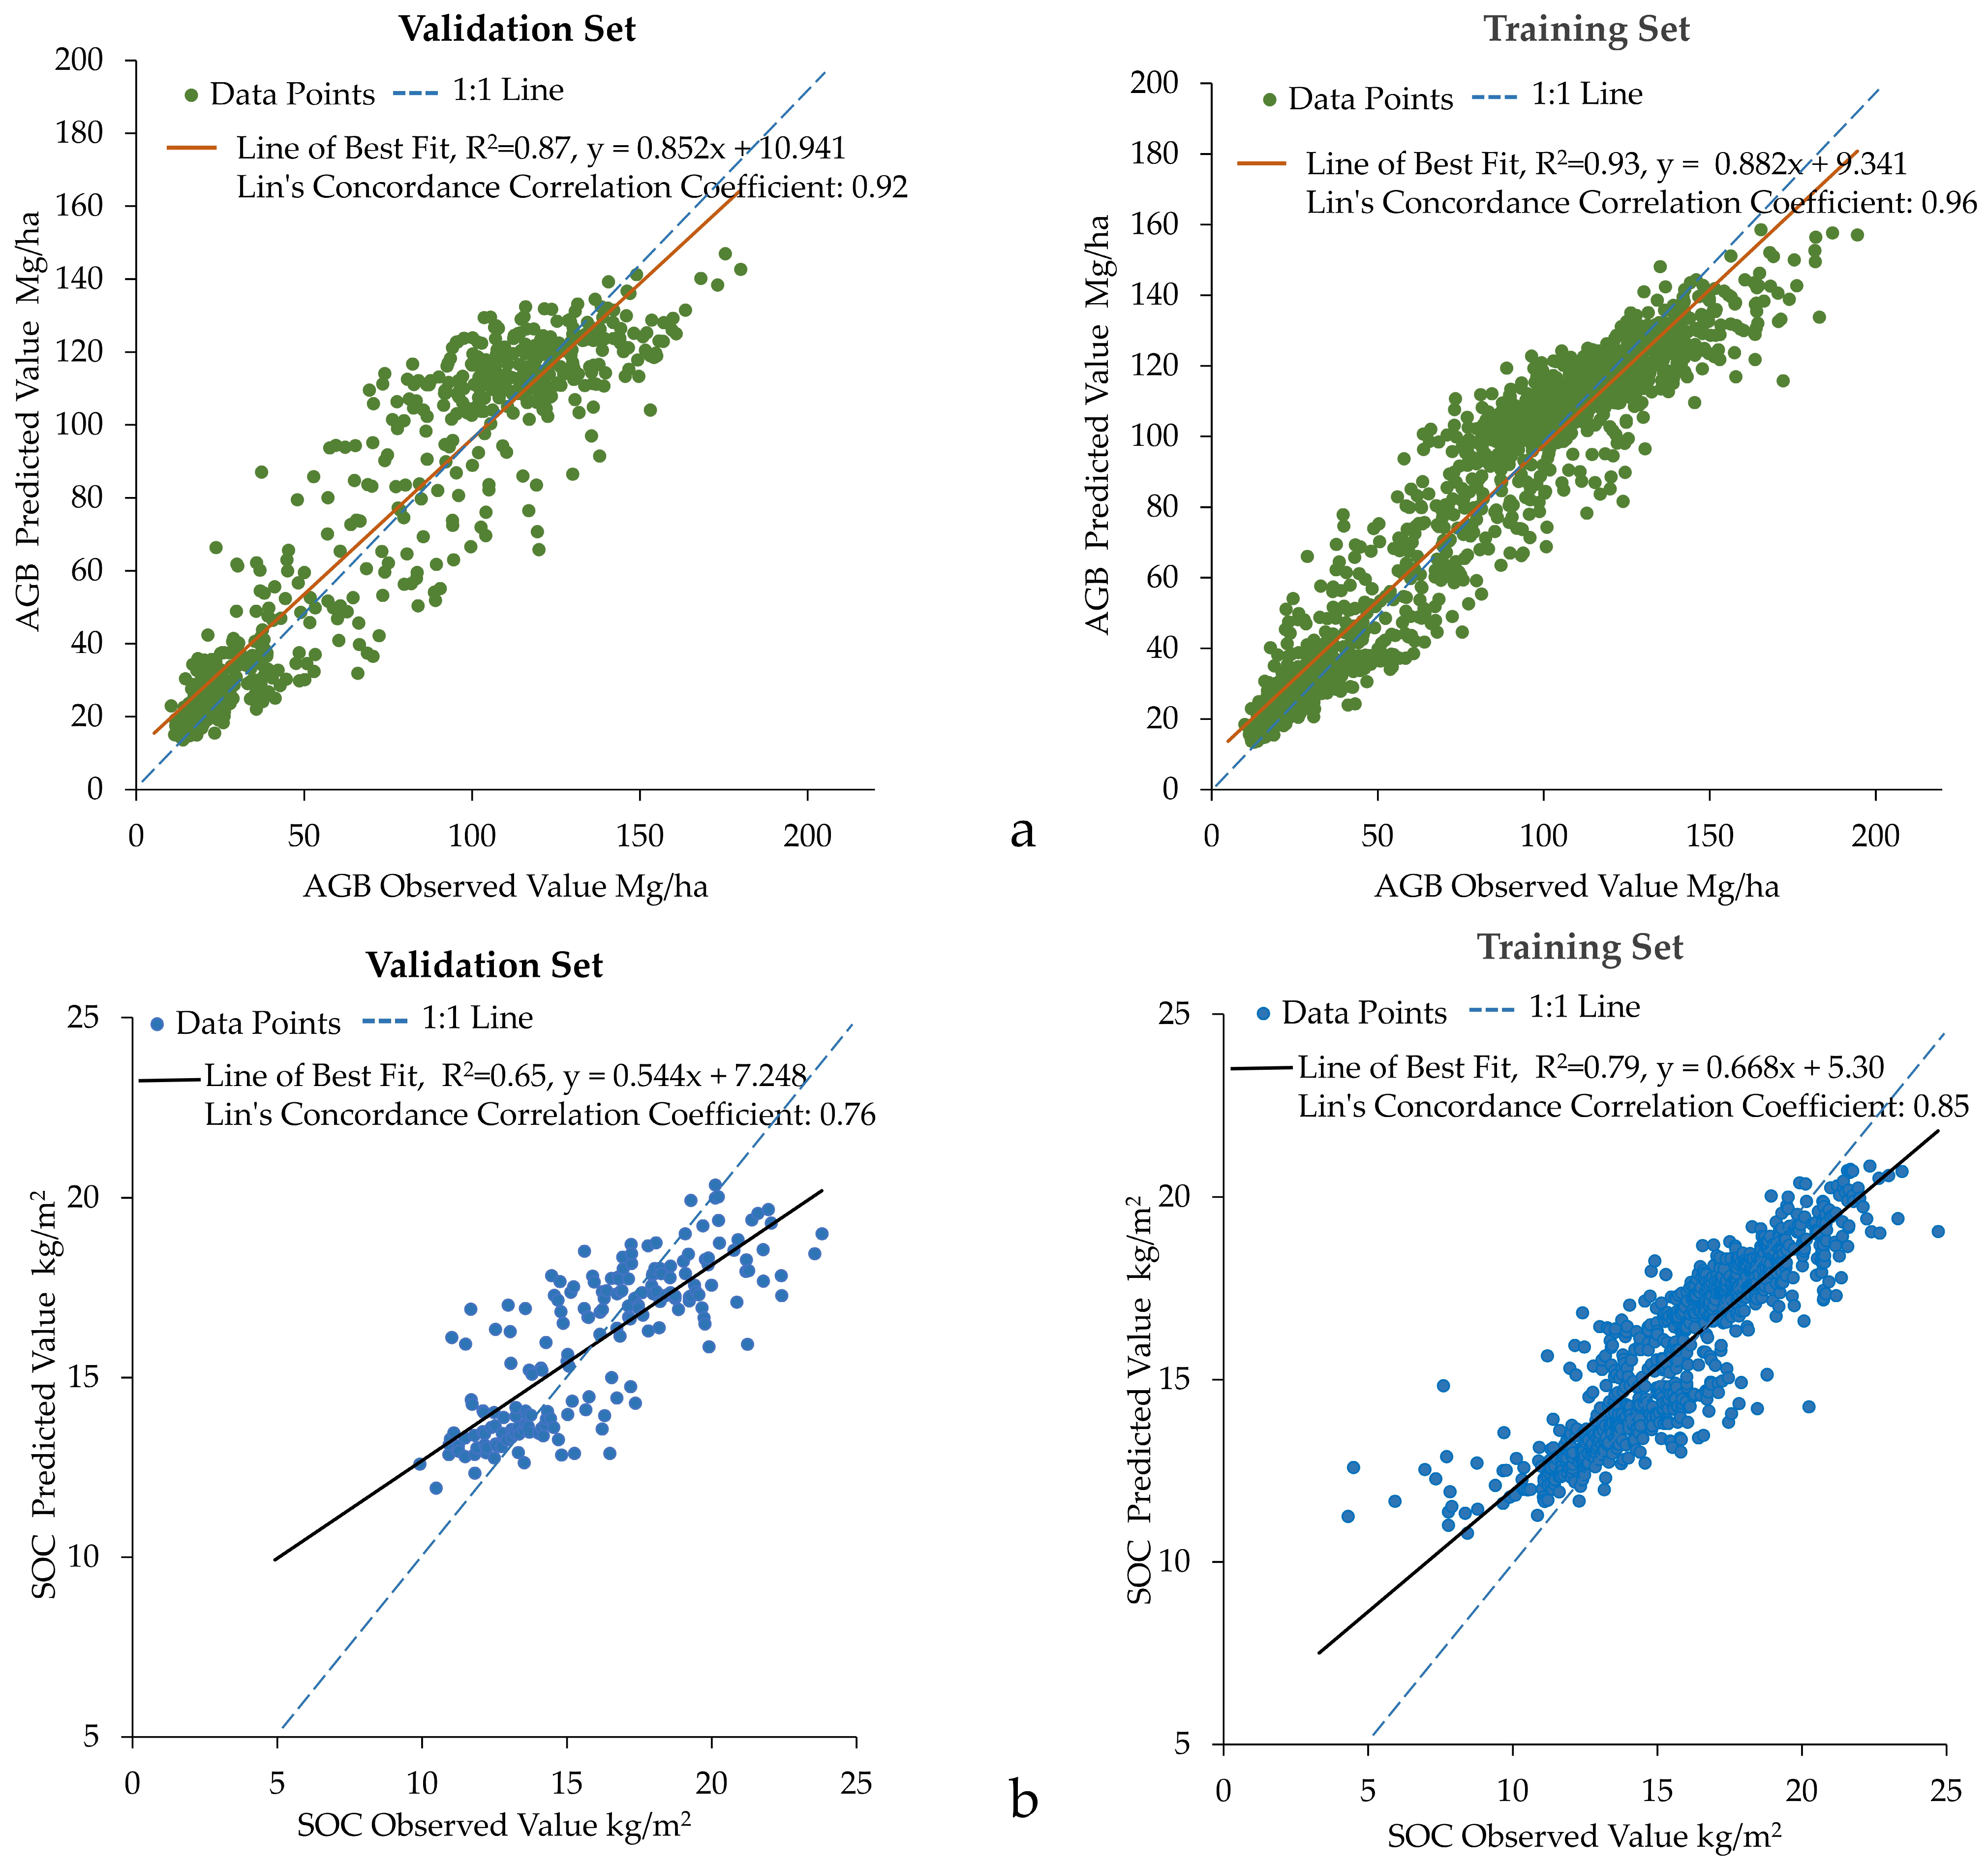
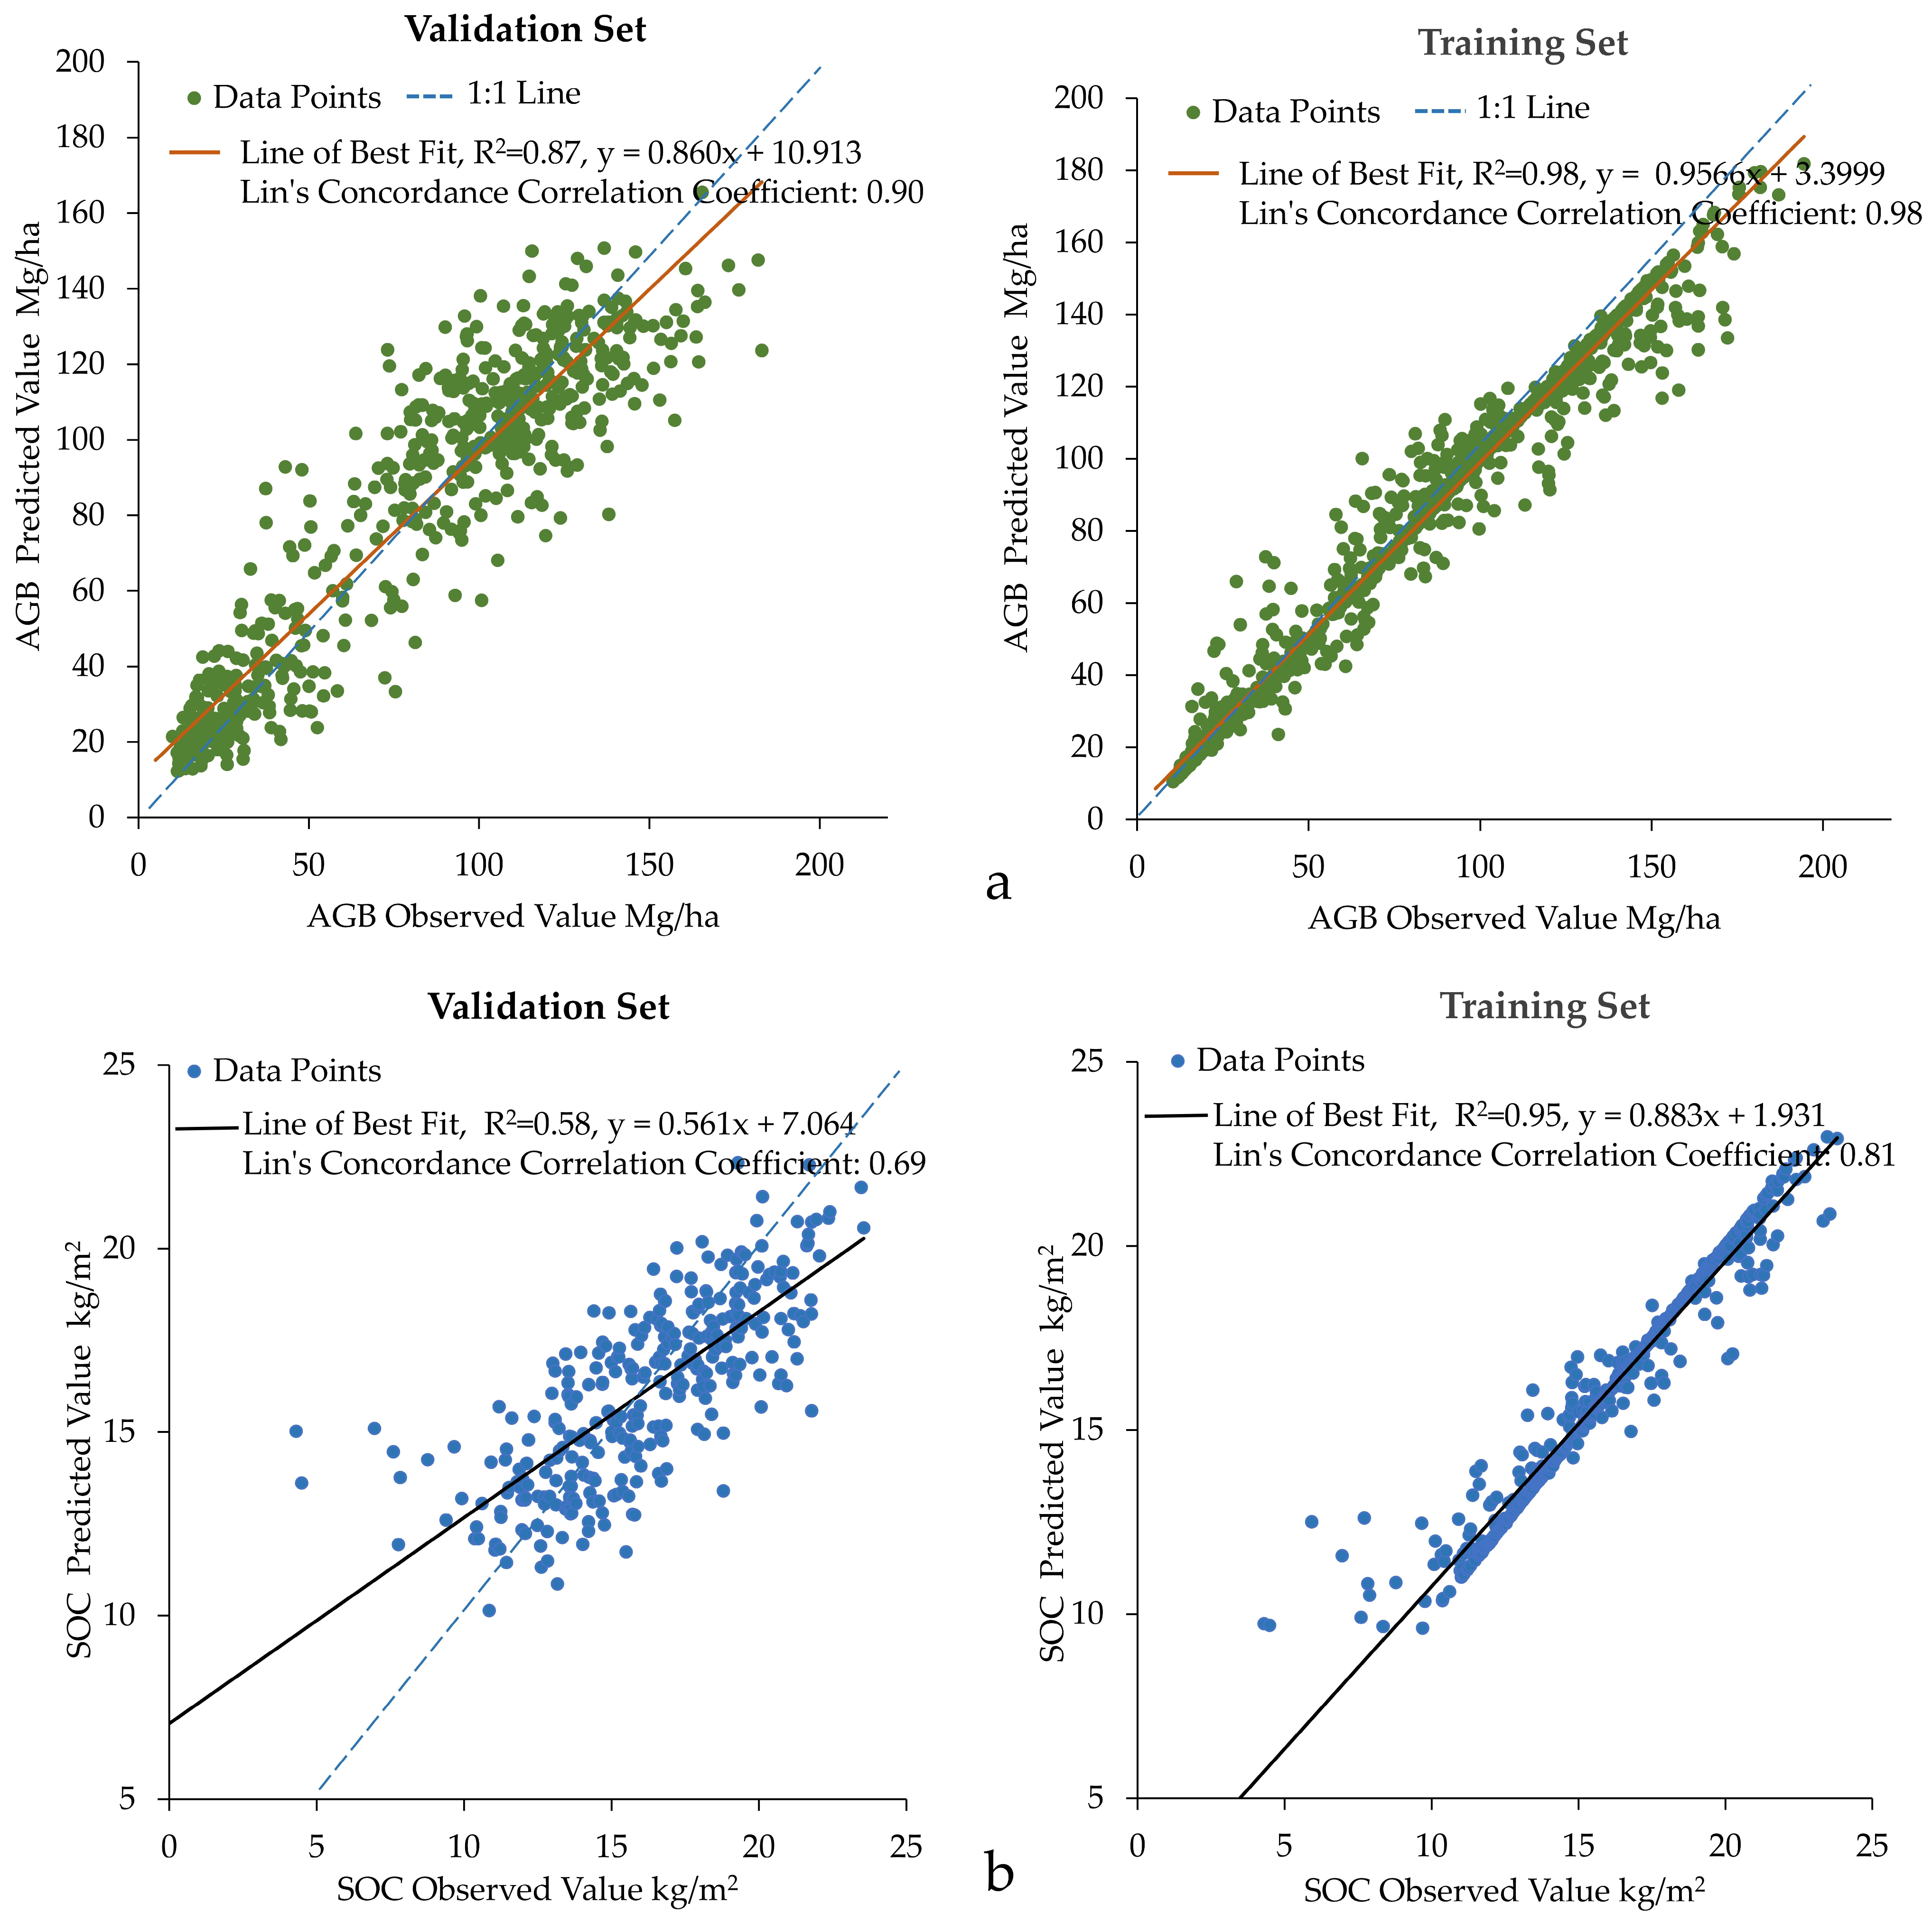
3.2. Machine Learning Model Results
3.2.1. Random Forest Algorithm
3.2.2. Gradient Boosting Decision Tree Algorithm
3.2.3. CART Algorithm
3.3. Importance of Environmental Variables
3.4. Distribution Characteristics of Carbon Storage
4. Discussion
- (1)
- Methodological Innovation and Applicability
- (2)
- The Role of Multi-source Data
- (3)
- Management Implications
- (4)
- Limitations and Future Directions
5. Conclusions
Author Contributions
Funding
Data Availability Statement
Acknowledgments
Conflicts of Interest
References
- Pan, Y.; Birdsey, R.A.; Fang, J.; Houghton, R.; Kauppi, P.E.; Kurz, W.A.; Phillips, O.L.; Shvidenko, A.; Lewis, S.L.; Canadell, J.G.; et al. A large and persistent carbon sink in the world’s forests. Science 2011, 333, 988–993. [Google Scholar] [CrossRef] [PubMed]
- Bonan, G.B. Forests and climate change: Forcings, feedbacks, and the climate benefits of forests. Science 2008, 320, 1444–1449. [Google Scholar] [CrossRef] [PubMed]
- Gatti, L.V.; Basso, L.S.; Miller, J.B.; Gloor, M.; Gatti Domingues, L.; Cassol, H.L.; Tejada, G.; Aragão, L.E.; Nobre, C.; Peters, W.; et al. Amazonia as a carbon source linked to deforestation and climate change. Nature 2021, 595, 388–393. [Google Scholar] [CrossRef] [PubMed]
- Tang, X.; Zhao, X.; Bai, Y.; Tang, Z.; Wang, W.; Zhao, Y.; Wan, H.; Xie, Z.; Shi, X.; Wu, B.; et al. Carbon pools in China’s terrestrial ecosystems: New estimates based on an intensive field survey. Proc. Natl. Acad. Sci. USA 2018, 115, 4021–4026. [Google Scholar] [CrossRef]
- Huang, L.; Yuan, L.; Xia, Y.; Yang, Z.; Luo, Z.; Yan, Z.; Li, M.; Yuan, J. Landscape ecological risk analysis of subtropical vulnerable mountainous areas from a spatiotemporal perspective: Insights from the Nanling Mountains of China. Ecol. Indic. 2023, 154, 110883. [Google Scholar] [CrossRef]
- Issa, S.; Dahy, B.; Ksiksi, T.; Saleous, N. A Review of Terrestrial Carbon Assessment Methods Using Geo-Spatial Technologies with Emphasis on Arid Lands. Remote Sens. 2020, 12, 2008. [Google Scholar] [CrossRef]
- Houghton, R.A.; Nassikas, A.A. Global and regional fluxes of carbon from land use and land cover change 1850–2015. Glob. Biogeochem. Cycles 2017, 31, 456–472. [Google Scholar] [CrossRef]
- Zhu, Z.; Wang, S.; Woodcock, C.E. Improvement and expansion of the Fmask algorithm: Cloud, cloud shadow, and snow detection for Landsats 4–7, 8, and Sentinel 2 images. Remote Sens. Environ. 2015, 159, 269–277. [Google Scholar] [CrossRef]
- Musthafa, M.; Singh, G. Improving forest above-ground biomass retrieval using multi-sensor L-and C-band SAR data and multi-temporal spaceborne LiDAR data. Front. For. Glob. Change 2022, 5, 822704. [Google Scholar] [CrossRef]
- Paustian, K.; Ravindranath, N.H.; Amstel, A.V. 2006 IPCC Guidelines for National Greenhouse Gas Inventories; International Panel on Climate Change: Geneva, Switzerland, 2006. [Google Scholar]
- Baccini, A.G.S.J.; Goetz, S.J.; Walker, W.S.; Laporte, N.T.; Sun, M.; Sulla-Menashe, D.; Hackler, J.; Beck, P.S.A.; Dubayah, R.; Friedl, M.A.; et al. Estimated carbon dioxide emissions from tropical deforestation improved by carbon-density maps. Nat. Clim. Change 2012, 2, 182–185. [Google Scholar] [CrossRef]
- Forkel, M.; Drüke, M.; Thurner, M.; Dorigo, W.; Schaphoff, S.; Thonicke, K.; von Bloh, W.; Carvalhais, N. Constraining modelled global vegetation dynamics and carbon turnover using multiple satellite observations. Sci. Rep. 2019, 9, 18757. [Google Scholar] [CrossRef] [PubMed]
- Zhu, Z.; Wulder, M.A.; Roy, D.P.; Woodcock, C.E.; Hansen, M.C.; Radeloff, V.C.; Healey, S.P.; Schaaf, C.; Hostert, P.; Strobl, P.; et al. Benefits of the free and open Landsat data policy. Remote Sens. Environ. 2019, 224, 382–385. [Google Scholar] [CrossRef]
- Dubayah, R.; Blair, J.B.; Goetz, S.; Fatoyinbo, L.; Hansen, M.; Healey, S.; Hofton, M.; Hurtt, G.; Kellner, J.; Luthcke, S.; et al. The Global Ecosystem Dynamics Investigation: High-resolution laser ranging of the Earth’s forests and topography. Sci. Remote Sens. 2020, 1, 100002. [Google Scholar] [CrossRef]
- Neuenschwander, A.; Pitts, K. The ATL08 land and vegetation product for the ICESat-2 Mission. Remote Sens. Environ. 2019, 221, 247–259. [Google Scholar] [CrossRef]
- Saatchi, S.; Longo, M.; Xu, L.; Yang, Y.; Abe, H.; André, M.; Aukema, J.E.; Carvalhais, N.; Cadillo-Quiroz, H.; Cerbu, G.A.; et al. Detecting vulnerability of humid tropical forests to multiple stressors. One Earth 2021, 4, 988–1003. [Google Scholar] [CrossRef]
- Duncanson, L.; Kellner, J.R.; Armston, J.; Dubayah, R.; Minor, D.M.; Hancock, S.; Healey, S.P.; Patterson, P.L.; Saarela, S.; Marselis, S.; et al. Aboveground biomass density models for NASA’s Global Ecosystem Dynamics Investigation (GEDI) lidar mission. Remote Sens. Environ. 2022, 270, 112845. [Google Scholar] [CrossRef]
- Yang, H.; Qin, Z.; Shu, Q.; Xu, L.; Yu, J.; Luo, S.; Wu, Z.; Xia, C.; Yang, Z. Estimation of Above-Ground Biomass for Dendrocalamus Giganteus Utilizing Spaceborne LiDAR GEDI Data. IEEE J. Sel. Top. Appl. Earth Obs. Remote Sens. 2025, 18, 5271–5286. [Google Scholar] [CrossRef]
- Yu, Y.; Saatchi, S. Sensitivity of L-band SAR backscatter to aboveground biomass of global forests. Remote Sens. 2016, 8, 522. [Google Scholar] [CrossRef]
- Berninger, A.; Lohberger, S.; Stängel, M.; Siegert, F. SAR-Based Estimation of Above-Ground Biomass and Its Changes in Tropical Forests of Kalimantan Using L- and C-Band. Remote Sens. 2018, 10, 831. [Google Scholar] [CrossRef]
- Yan, X.; Li, J.; Smith, A.R.; Yang, D.; Ma, T.; Su, Y.; Shao, J. Evaluation of machine learning methods and multi-source remote sensing data combinations to construct forest above-ground biomass models. Int. J. Digit. Earth 2023, 16, 4471–4491. [Google Scholar] [CrossRef]
- Ali, H.; Mohammadi, J.; Shataee Jouibary, S. Deep and machine learning prediction of forest above-ground biomass using multi-source remote sensing data in coniferous planted forests in Iran. Eur. J. For. Res. 2024, 143, 1731–1745. [Google Scholar] [CrossRef]
- Wang, X.; Liu, C.; Lv, G.; Xu, J.; Cui, G. Integrating Multi-Source Remote Sensing to Assess Forest Aboveground Biomass in the Khingan Mountains of North-Eastern China Using Machine-Learning Algorithms. Remote Sens. 2022, 14, 1039. [Google Scholar] [CrossRef]
- Singha, C.; Chandra Swain, K.; Sahoo, S.; Fadhil Al-Quraishi, A.M.; Omeiza Alao, J.; Almohamad, H.; Fatahalla Mohamed Ahmed, M.; Ghassan Abdo, H. Predicting forest above-ground biomass using SAR imagery and GEDI data through machine learning in GEE cloud. For. Sci. Technol. 2025, 21, 187–206. [Google Scholar] [CrossRef]
- Tamiminia, H.; Salehi, B.; Mahdianpari, M.; Quackenbush, L.; Adeli, S.; Brisco, B. Google Earth Engine for geo-big data applications: A meta-analysis and systematic review. ISPRS J. Photogramm. Remote Sens. 2020, 164, 152–170. [Google Scholar] [CrossRef]
- Zurqani, H.A. A multi-source approach combining GEDI LiDAR, satellite data, and machine learning algorithms for estimating forest aboveground biomass on Google Earth engine platform. Ecol. Inform. 2025, 86, 103052. [Google Scholar] [CrossRef]
- Hengl, T.; Mendes de Jesus, J.; Heuvelink, G.B.; Ruiperez Gonzalez, M.; Kilibarda, M.; Blagotić, A.; Shangguan, W.; Wright, M.N.; Geng, X.; Bauer-Marschallinger, B.; et al. SoilGrids250m: Global gridded soil information based on machine learning. PLoS ONE 2017, 12, 0169748. [Google Scholar] [CrossRef]
- Viscarra Rossel, R.A.; Lee, J.; Behrens, T.; Luo, Z.; Baldock, J.; Richards, A. Continental-scale soil carbon composition and vulnerability modulated by regional environmental controls. Nat. Geosci. 2019, 12, 547–552. [Google Scholar] [CrossRef]
- Poggio, L.; De Sousa, L.M.; Batjes, N.H.; Heuvelink, G.B.; Kempen, B.; Ribeiro, E.; Rossiter, D. SoilGrids 2.0: Producing soil information for the globe with quantified spatial uncertainty. Soil 2021, 7, 217–240. [Google Scholar] [CrossRef]
- Vaudour, E.; Gomez, C.; Fouad, Y.; Lagacherie, P. Sentinel-2 image capacities to predict common topsoil properties of temperate and Mediterranean agroecosystems. Remote Sens. Environ. 2019, 223, 21–33. [Google Scholar] [CrossRef]
- Schillaci, C.; Acutis, M.; Lombardo, L.; Lipani, A.; Fantappie, M.; Märker, M.; Saia, S. Spatio-temporal topsoil organic carbon mapping of a semi-arid Mediterranean region: The role of land use, soil texture, topographic indices and the influence of remote sensing data to modelling. Sci. Total Environ. 2017, 601, 821–832. [Google Scholar] [CrossRef]
- Zhou, T.; Geng, Y.; Ji, C.; Xu, X.; Wang, H.; Pan, J.; Bumberger, J.; Haase, D.; Lausch, A. Prediction of soil organic carbon and the C: N ratio on a national scale using machine learning and satellite data: A comparison between Sentinel-2, Sentinel-3 and Landsat-8 images. Sci. Total Environ. 2021, 755, 142661. [Google Scholar] [CrossRef]
- Ho, V.H.; Morita, H.; Ho, T.H.; Bachofer, F.; Nguyen, T.T. Comparison of geostatistics, machine learning algorithms, and their hybrid approaches for modeling soil organic carbon density in tropical forests. J. Soils Sediments 2025, 25, 1554–1577. [Google Scholar] [CrossRef]
- Wu, T.; Luo, J.; Dong, W.; Sun, Y.; Xia, L.; Zhang, X. Geo-object-based soil organic matter mapping using machine learning algorithms with multi-source geo-spatial data. IEEE J. Sel. Top. Appl. Earth Obs. Remote Sens. 2019, 12, 1091–1106. [Google Scholar] [CrossRef]
- Lei, S.; Zhou, P.; Lin, J.; Tan, Z.; Huang, J.; Yan, P.; Chen, H. Spatiotemporal Variation in Carbon and Water Use Efficiency and Their Influencing Variables Based on Remote Sensing Data in the Nanling Mountains Region. Remote Sens. 2025, 17, 648. [Google Scholar] [CrossRef]
- Peng, S. 1-km Monthly Precipitation Dataset for China (1901–2023); National Tibetan Plateau/Third Pole Environment Data Center: Beijing, China, 2020; Available online: https://data.tpdc.ac.cn/en/data/faae7605-a0f2-4d18-b28f-5cee413766a2 (accessed on 24 June 2025).
- Zhang, X.; Zhao, T.; Xu, H.; Liu, W.; Wang, J.; Chen, X.; Liu, L. GLC_FCS30D: The first global 30 m land-cover dynamics monitoring product with a fine classification system for the period from 1985 to 2022 generated using dense-time-series Landsat imagery and the continuous change-detection method. Earth Syst. Sci. Data. 2024, 16, 1353–1381. [Google Scholar] [CrossRef]
- Zhu, M.; Feng, Q.; Qin, Y.; Cao, J.; Zhang, M.; Liu, W.; Deo, R.C.; Zhang, C.; Li, R.; Li, B. The role of topography in shaping the spatial patterns of soil organic carbon. Catena 2019, 176, 296–305. [Google Scholar] [CrossRef]
- Hegazi, E.H.; Samak, A.A.; Yang, L.; Huang, R.; Huang, J. Prediction of Soil Moisture Content from Sentinel-2 Images Using Convolutional Neural Network (CNN). Agronomy 2023, 13, 656. [Google Scholar] [CrossRef]
- Sims, D.A.; Gamon, J.A. Relationships between leaf pigment content and spectral reflectance across a wide range of species, leaf structures and developmental stages. Remote Sens. Environ. 2002, 81, 337–354. [Google Scholar] [CrossRef]
- Pei, Z.Y.; Ouyang, H.; Zhou, C.P.; Xu, X.L. Carbon Balance in an Alpine Steppe in the Qinghai-Tibet Plateau. J. Integr. Plant Biol. 2009, 51, 521–526. [Google Scholar] [CrossRef]
- Breiman, L. Random Forests. Mach. Learn. 2001, 45, 5–32. [Google Scholar] [CrossRef]
- Cutler, D.R.; Edwards, T.C., Jr.; Beard, K.H.; Cutler, A.; Hess, K.T.; Gibson, J.; Lawler, J.J. Random forests for classification in ecology. Ecology 2007, 88, 2783–2792. [Google Scholar] [CrossRef]
- Friedman, J.H. Greedy function approximation: A gradient boosting machine. Ann. Stat. 2001, 29, 1189–1232. Available online: http://www.jstor.org/stable/2699986 (accessed on 24 June 2025). [CrossRef]
- Natekin, A.; Knoll, A. Gradient boosting machines, a tutorial. Front. Neurorobotics 2013, 7, 21. [Google Scholar] [CrossRef]
- Loh, W.Y. Classification and regression trees. Wiley Interdiscip. Rev. Data Min. Knowl. Discov. 2011, 1, 14–23. [Google Scholar] [CrossRef]
- Fan, Q.; Jiang, Y.; Wang, Y.; Fan, G. Forest Carbon Storage Dynamics and Influencing Factors in Southeastern Tibet: GEE and Machine Learning Analysis. Forests 2025, 16, 825. [Google Scholar] [CrossRef]
- Intergovernmental Panel on Climate Change. 2019 Refinement to the 2006 IPCC Guidelines for National Greenhouse Gas Inventories. IPCC. 2019. Available online: http://www.ipcc.ch/report/2019-refinement-to-the-2006-ipcc-guidelines-for-national-greenhouse-gas-inventories/ (accessed on 24 June 2025).
- Su, H.; Shen, W.; Wang, J.; Ali, A.; Li, M. Machine learning and geostatistical approaches for estimating aboveground biomass in Chinese subtropical forests. For. Ecosyst. 2020, 7, 64. [Google Scholar] [CrossRef]
- Wu, Y.; Chen, Y.; Tian, C.; Yun, T.; Li, M. Estimation of Subtropical Forest Aboveground Biomass Using Active and Passive Sentinel Data with Canopy Height. Remote Sens. 2025, 17, 2509. [Google Scholar] [CrossRef]
- Tang, X.; Xia, M.; Pérez-Cruzado, C.; Guan, F.; Fan, S. Spatial distribution of soil organic carbon stock in Moso bamboo forests in subtropical China. Sci. Rep. 2017, 7, 42640. [Google Scholar] [CrossRef] [PubMed]
- Yao, X.; Yu, K.; Deng, Y.; Zeng, Q.; Lai, Z.; Liu, J. Spatial distribution of soil organic carbon stocks in Masson pine (Pinus massoniana) forests in subtropical China. Catena 2019, 178, 189–198. [Google Scholar] [CrossRef]
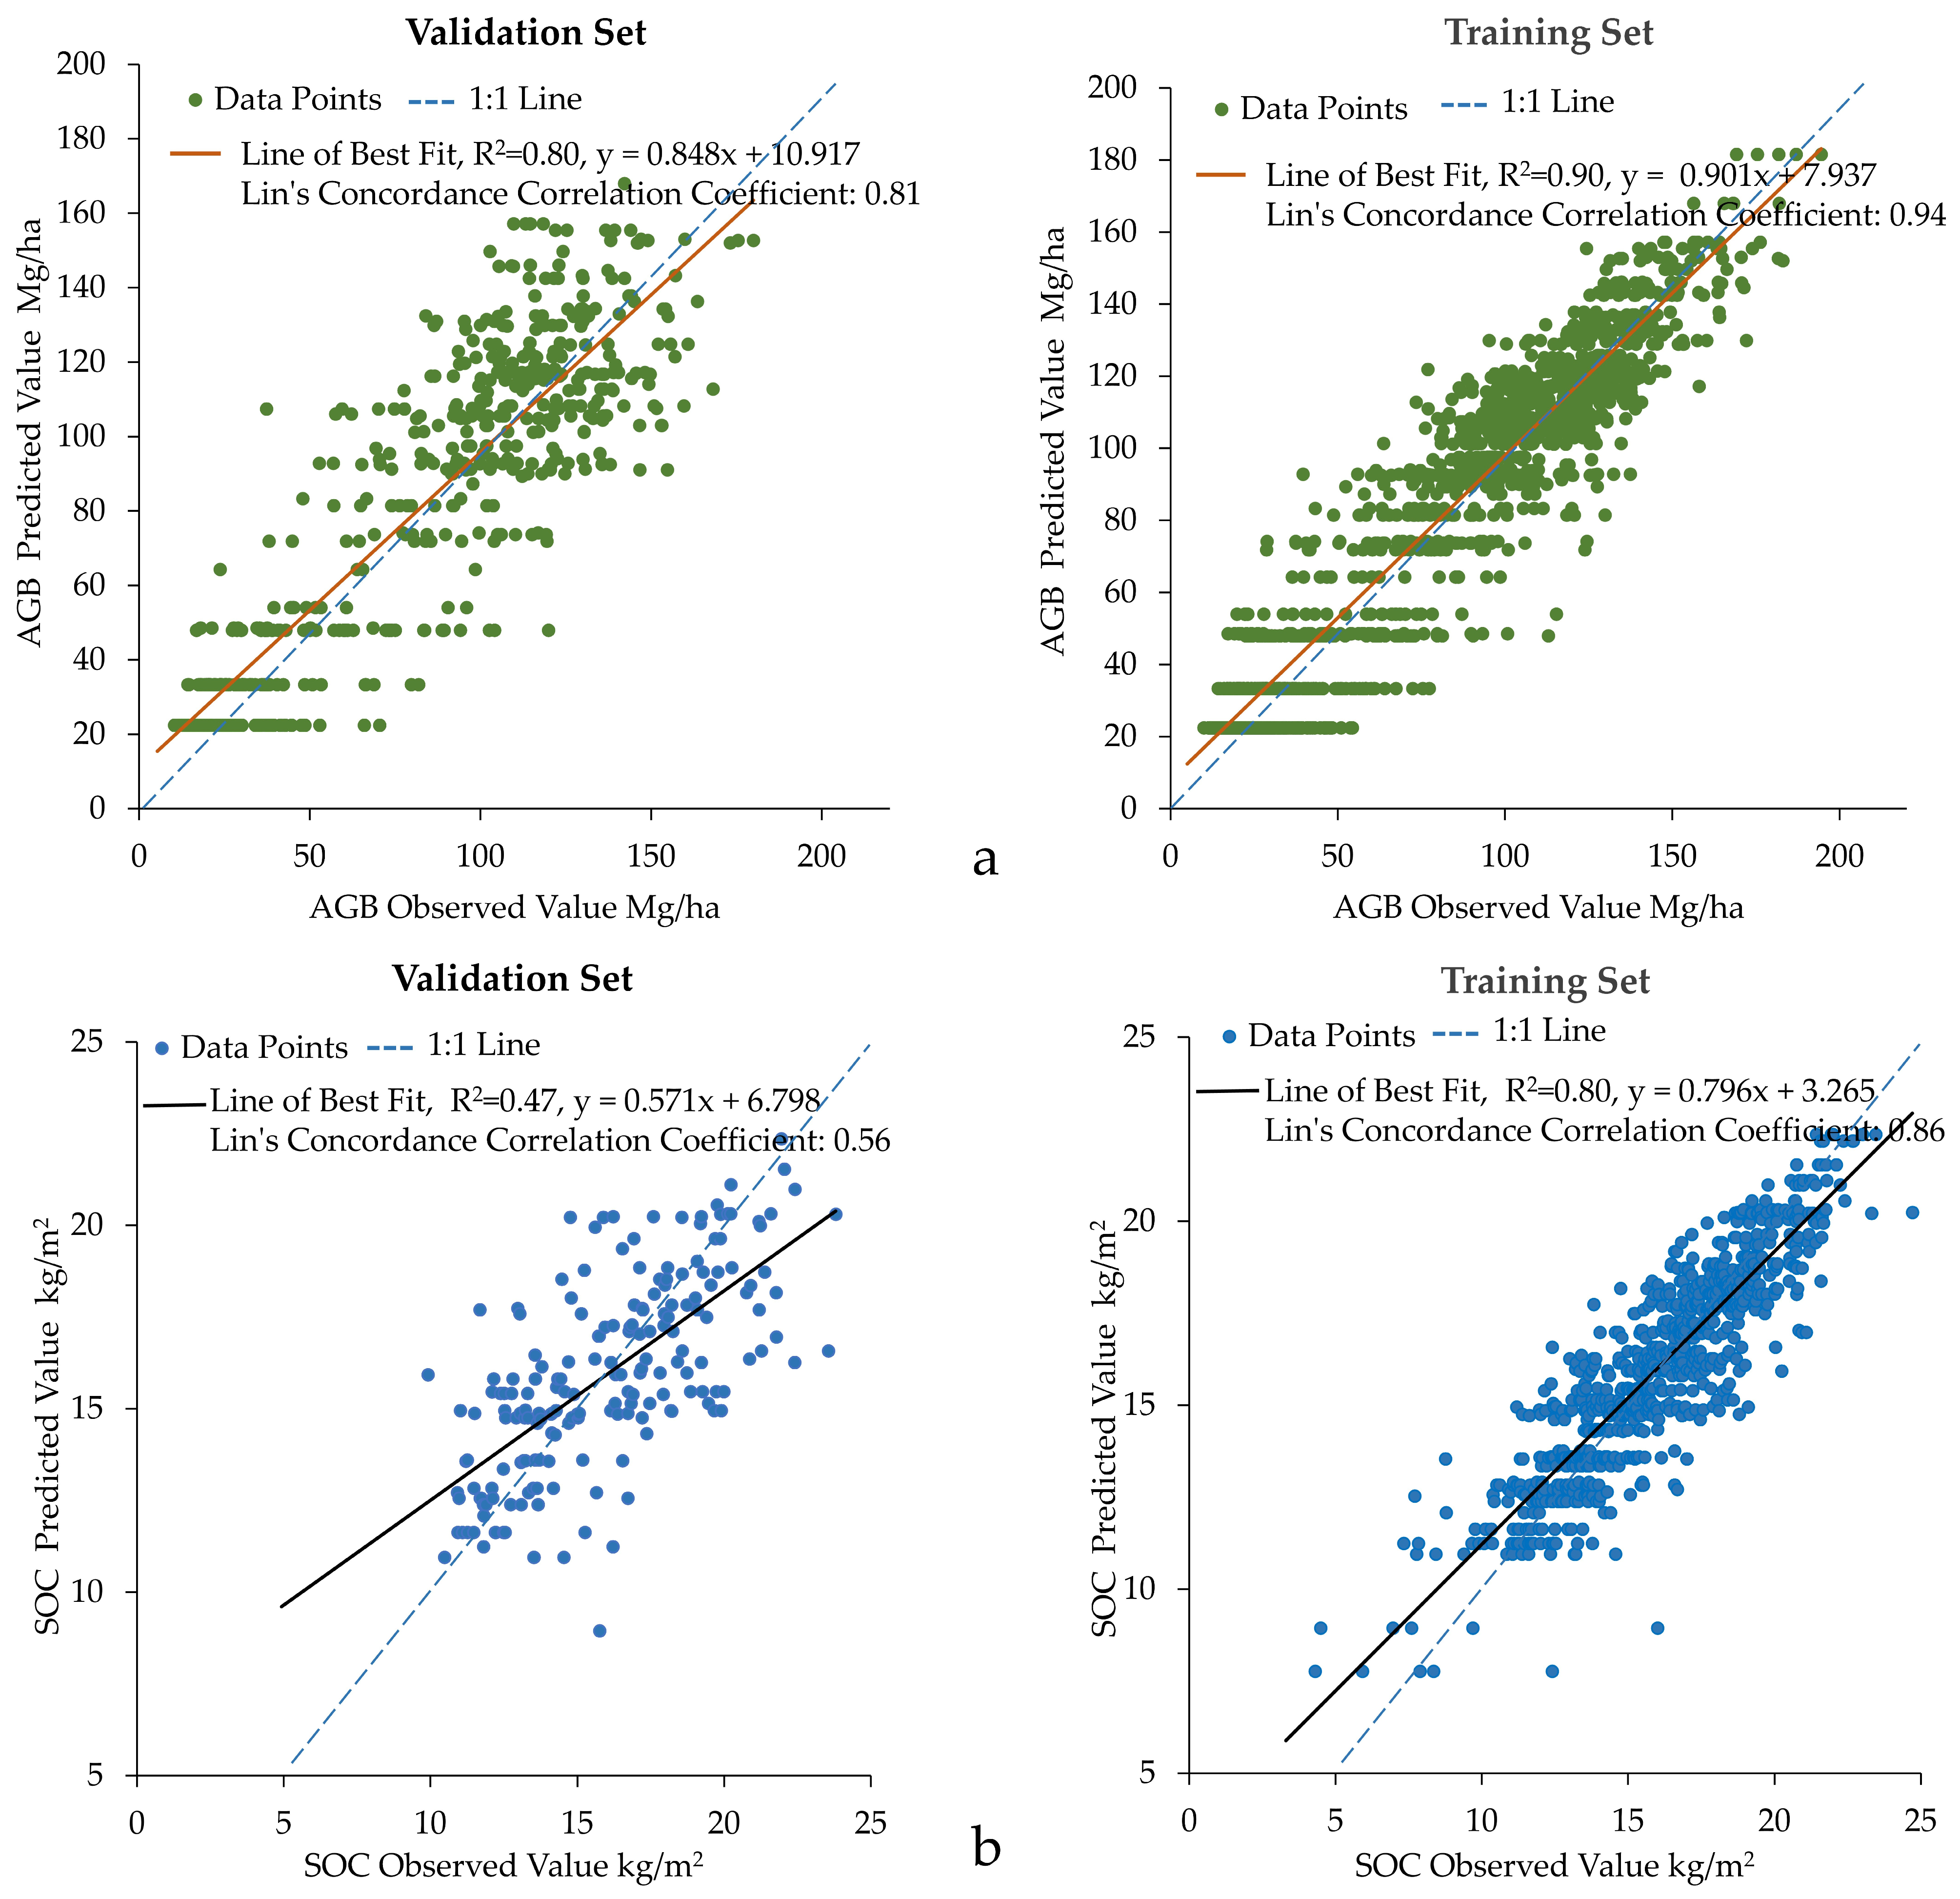
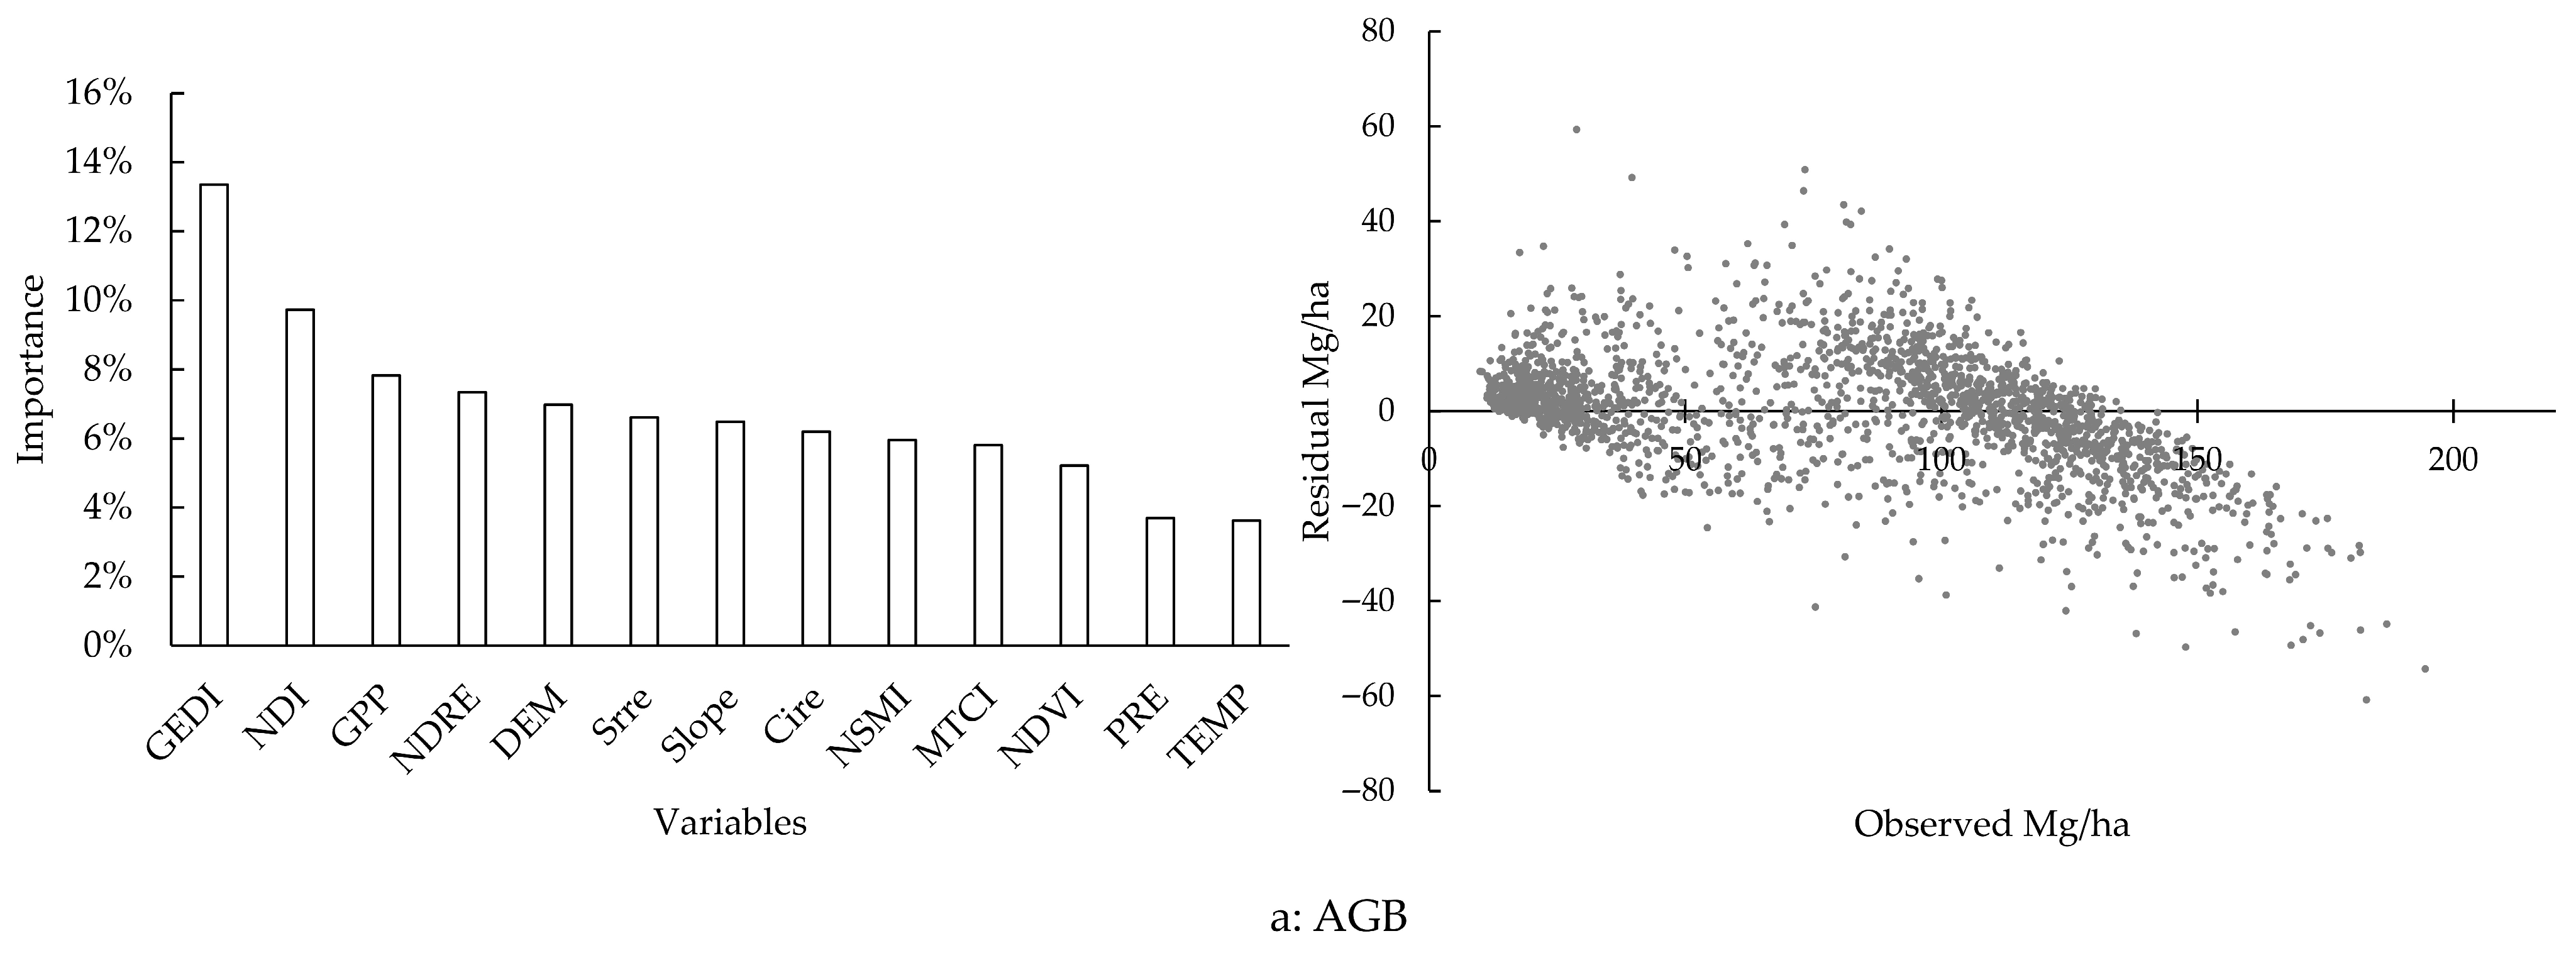
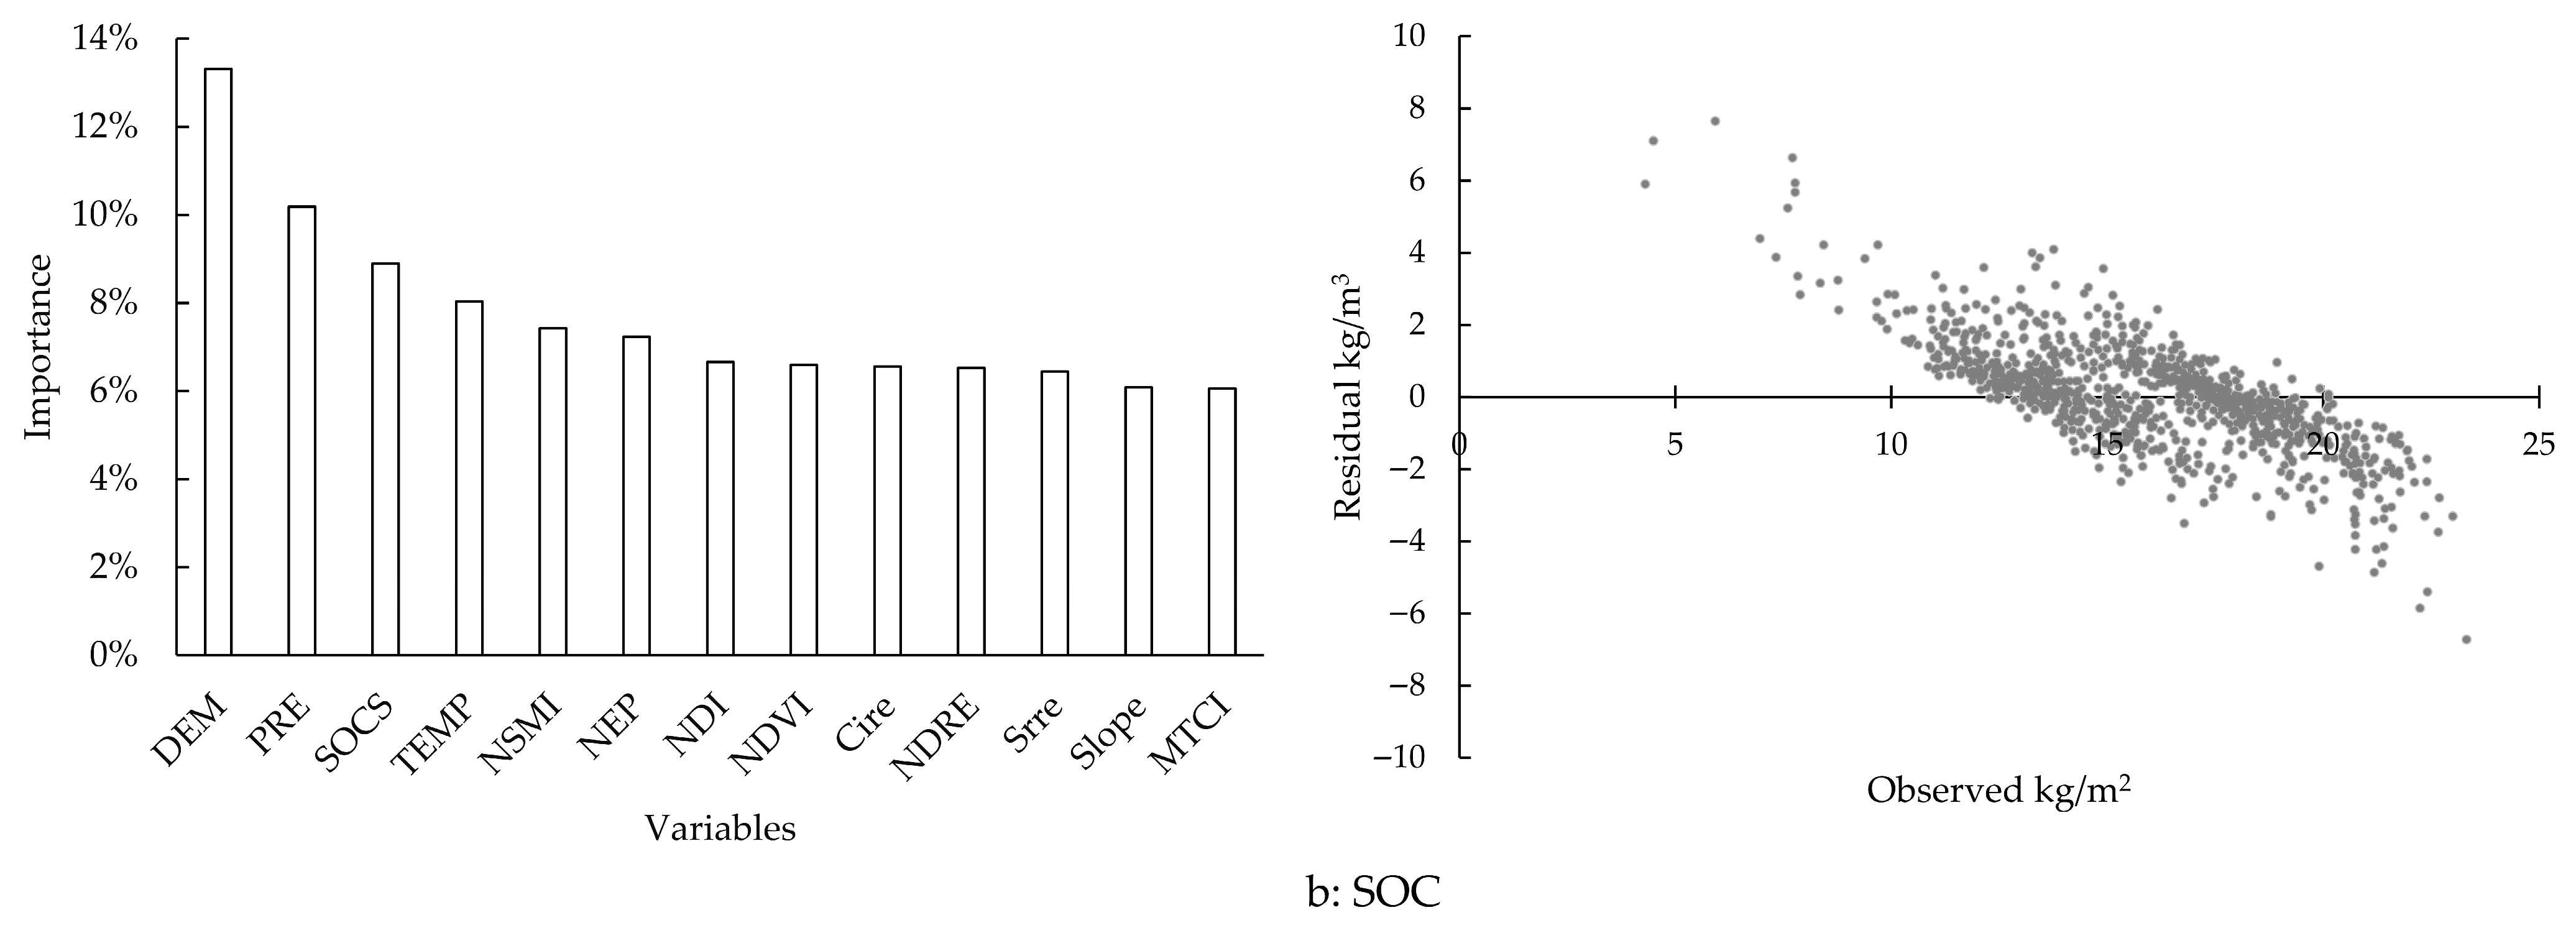
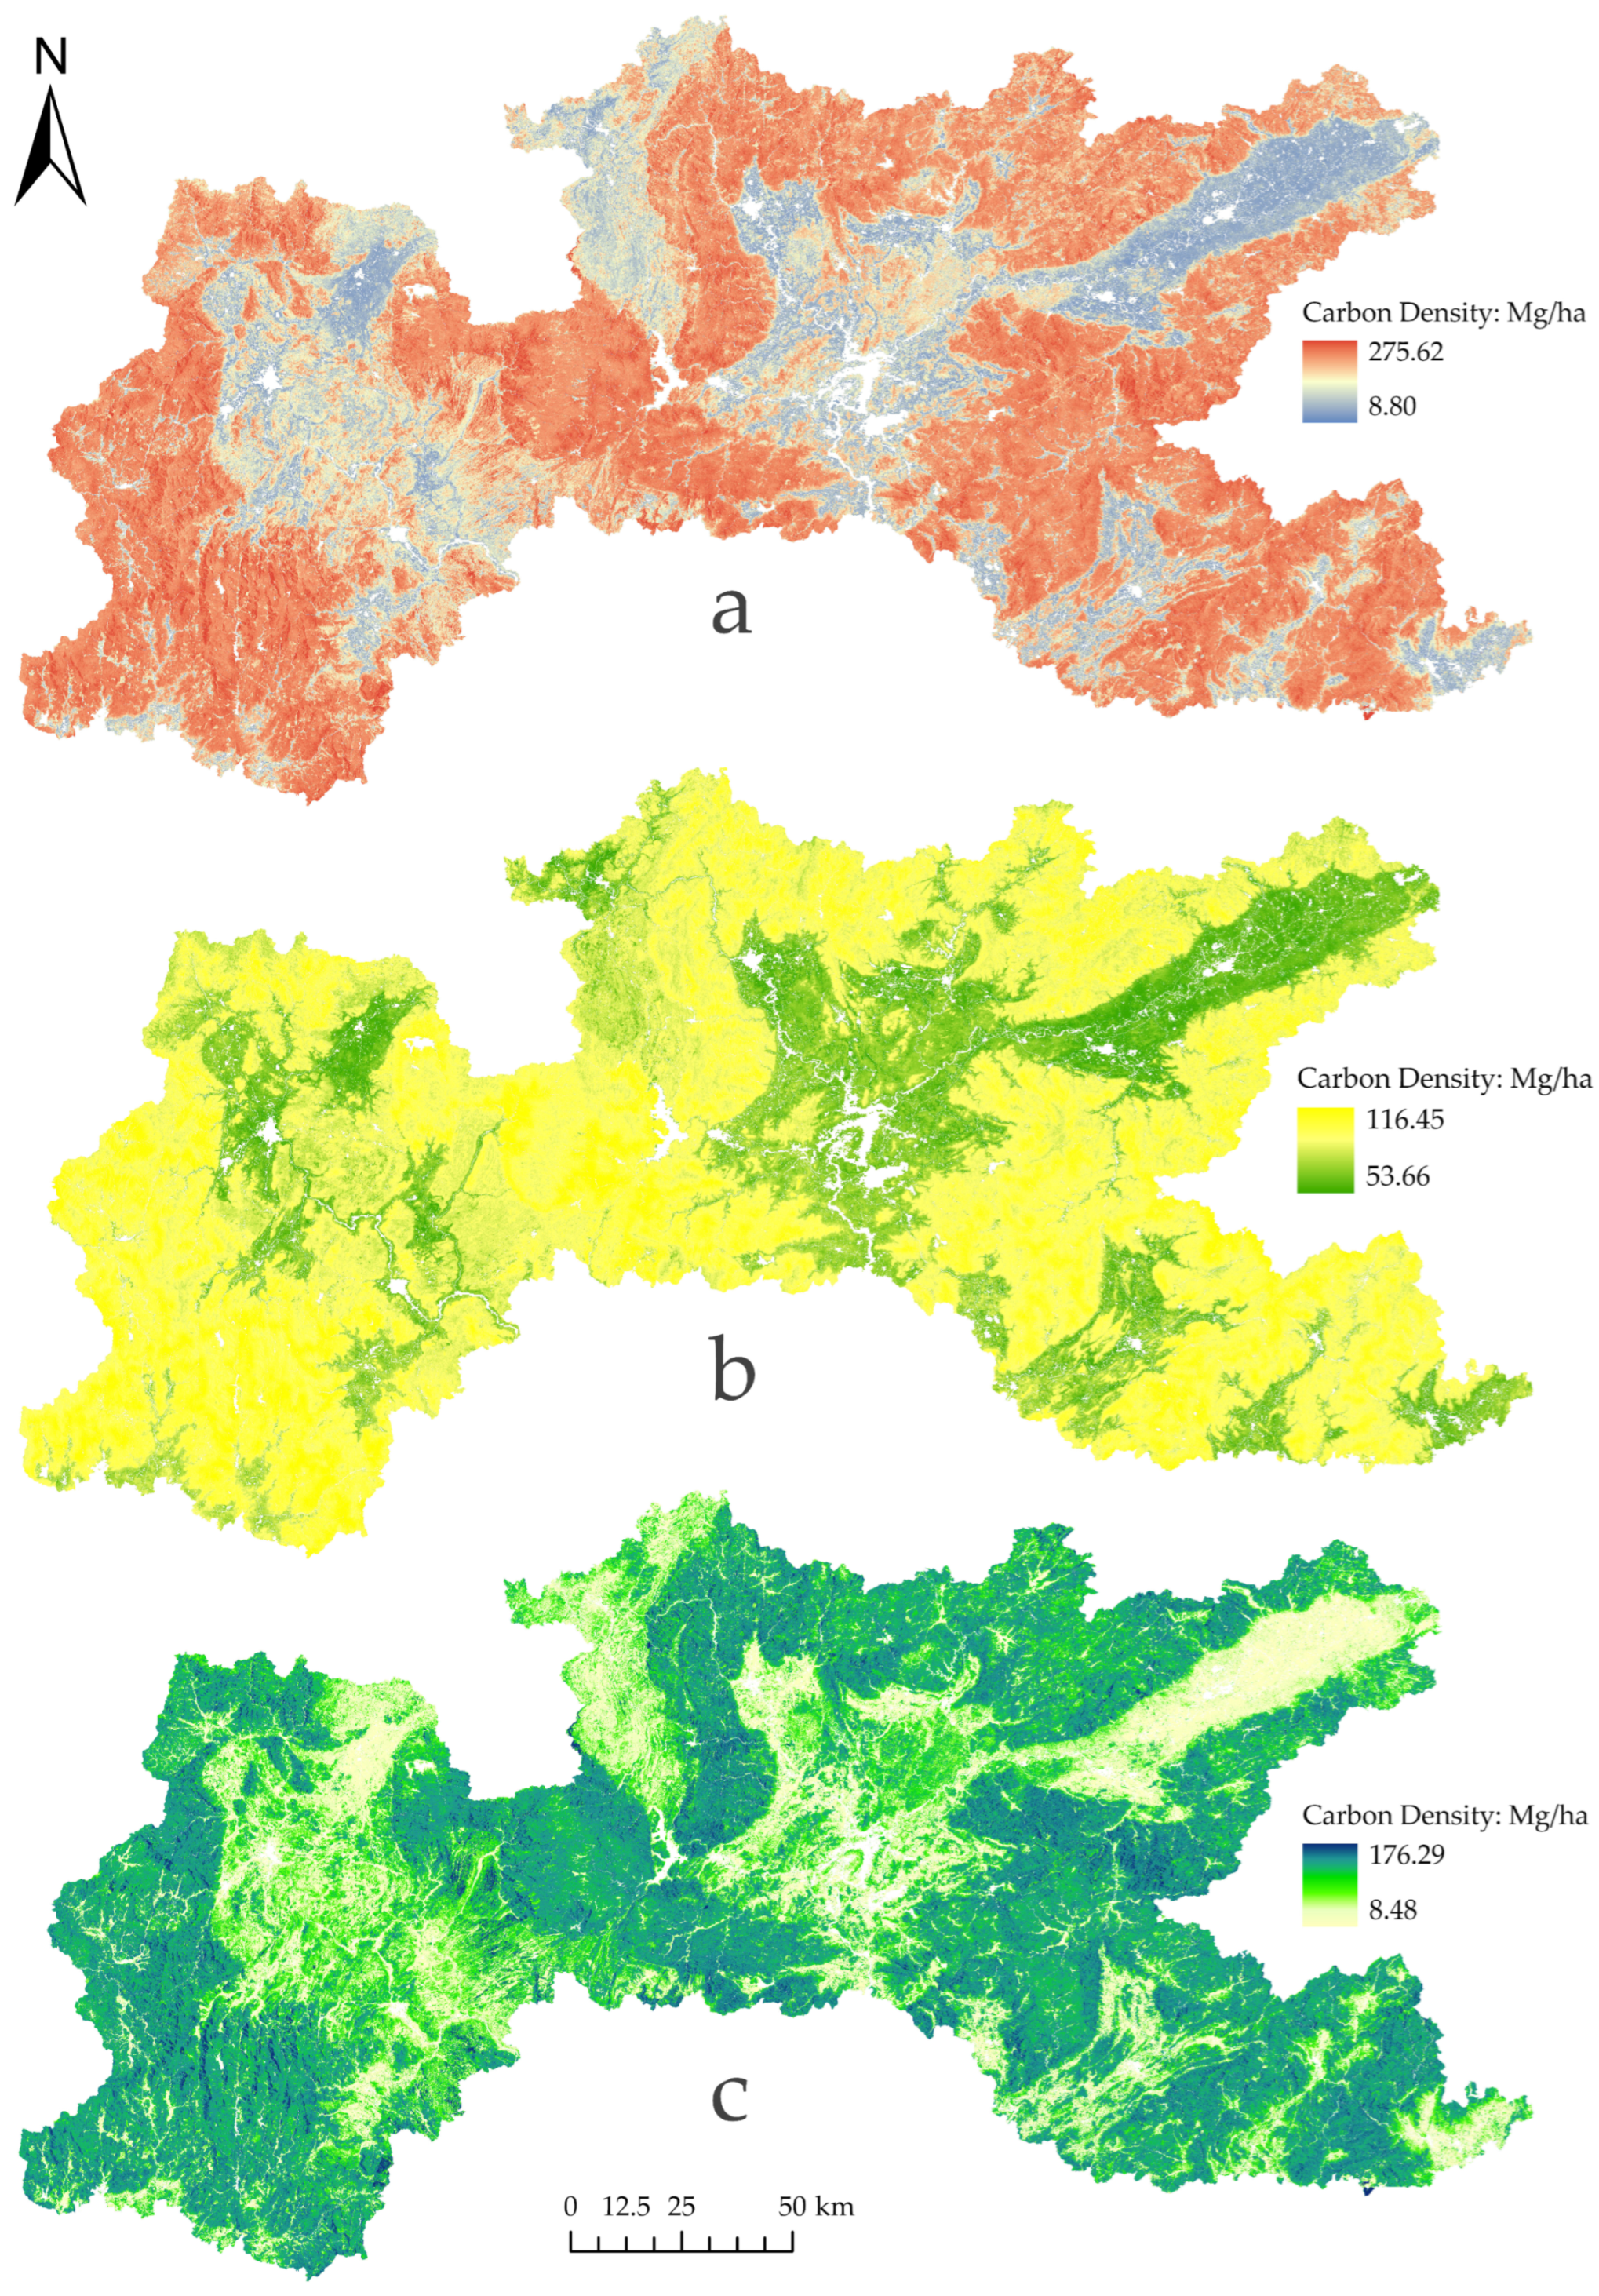
| Data | Resolution | Source |
|---|---|---|
| Sentinel-2 | 10 m/20 m | Harmonized Sentinel-2 MSI, Union/ESA/Copernicus |
| Sentinel-1 | 10 m | Sentinel-1 SAR GRD, Union/ESA/Copernicus |
| ALOS | 25 m | Global PALSAR-2/PALSAR Yearly Mosaic, version 2, JAXA EORC |
| MODIS | 500 m | NASA LP DAAC at the USGS EROS Center |
| DEM | 30 m | USGS/SRTMGL1_003 |
| GEDI | 25 m | Gridded Aboveground Biomass Density, USGS LP DAAC |
| Soil type | 1 km | HWSD2.0, https://openknowledge.fao.org/handle/20.500.14283/cc3823en (accessed on 24 June 2025) |
| Temperature | 1 km | Peng, S. (2020), https://data.tpdc.ac.cn/en/data/faae7605-a0f2-4d18-b28f-5cee413766a2 (accessed on 24 June 2025) [36] |
| Precipitation | 1 km | |
| Land use | 30 m | GLC-FCS30D, Zhang et al., 2024 [37] |
| Field sampling data | Soil sampling and vegetation sampling |
| Type | Variables | Formula |
|---|---|---|
| Optical Remote Sensing | Normalized Difference Vegetation Index (NDVI) | (NIR − Red)/(NIR + Red) [26] NIR: Near Infrared Band 1; Red: Red Band |
| Normalized Difference Red Edge Index (NDRE) | (RedEdge2 − RedEdge1)/RedEdge2 + RedEdge1) [26] RedEdge1/2: Red Edge Band 1/2 | |
| Normalized Soil Moisture Index (NSMI) | (SWIR − NIR)/(SWIR + NIR) [39] SWIR: Shortwave Infrared Band | |
| Chlorophyll Index Red Edge (CIRE) | NIR/RedEdge1 − 1 [40] | |
| Simple Ratio Red Edge (SRRE) | RedEdge3/RedEdge1 [40] | |
| MERIS Terrestrial Chlorophyll Index (MTCI) | (RedEdge2 − RedEdge1)/(RedEdge1 − Red) [26] | |
| Gross Primary Productivity (GPP) | ||
| Net Primary Productivity (NPP) | ||
| Net Ecosystem Productivity (NEP) | NPP-R0 [41], R0: Heterotrophic Respiration T: Temperature, P: Precipitation | |
| Radar Remote Sensing | Normalized Difference Index (NDI) | Log(10 × VV × VH) [19,26] VV: Vertical-Vertical, VH: Vertical-Horizontal |
| Global Ecosystem Dynamics Investigation (GEDI) | ||
| Topography | DEM, Slop | |
| Climate | Precipitation (PRE), Temperature (TEMP) | |
| Others | Land Use/Land Cover (LULC) |
| Type | Variables |
|---|---|
| AGB | NDVI, NDRE, NSMI, SRRE, CIRE, MTCI, NDI, GEDI, DEM, Slope, GPP, TEMP, PRE |
| SOC | NDVI, NDRE, NSMI, SRRE, CIRE, MTCI, NDI, DEM, Slope, NEP, TEMP, PRE |
| Model | Type | R2 | RMSE (Mg/ha, kg/m2) | MAE (Mg/ha, kg/m 2) |
| Optical remote sensing | AGB | 0.79 | 21.03 | 15.66 |
| SOC | 0.31 | 2.61 | 2.01 | |
| Optical/radar fusion | AGB | 0.85 | 17.15 | 12.91 |
| SOC | 0.40 | 2.40 | 1.82 | |
| Optical/radar fusion combined with terrain and climate | AGB | 0.87 | 16.29 | 12.39 |
| SOC | 0.65 | 1.92 | 1.50 |
Disclaimer/Publisher’s Note: The statements, opinions and data contained in all publications are solely those of the individual author(s) and contributor(s) and not of MDPI and/or the editor(s). MDPI and/or the editor(s) disclaim responsibility for any injury to people or property resulting from any ideas, methods, instructions or products referred to in the content. |
© 2025 by the authors. Licensee MDPI, Basel, Switzerland. This article is an open access article distributed under the terms and conditions of the Creative Commons Attribution (CC BY) license (https://creativecommons.org/licenses/by/4.0/).
Share and Cite
Wang, W.; Tang, L.; Zhang, Y.; Cai, J.; Chen, X.; Mao, X. Mapping Ecosystem Carbon Storage in the Nanling Mountains of Guangdong Province Using Machine Learning Based on Multi-Source Remote Sensing. Atmosphere 2025, 16, 954. https://doi.org/10.3390/atmos16080954
Wang W, Tang L, Zhang Y, Cai J, Chen X, Mao X. Mapping Ecosystem Carbon Storage in the Nanling Mountains of Guangdong Province Using Machine Learning Based on Multi-Source Remote Sensing. Atmosphere. 2025; 16(8):954. https://doi.org/10.3390/atmos16080954
Chicago/Turabian StyleWang, Wei, Liangbo Tang, Ying Zhang, Junxing Cai, Xiaoyuan Chen, and Xiaoyun Mao. 2025. "Mapping Ecosystem Carbon Storage in the Nanling Mountains of Guangdong Province Using Machine Learning Based on Multi-Source Remote Sensing" Atmosphere 16, no. 8: 954. https://doi.org/10.3390/atmos16080954
APA StyleWang, W., Tang, L., Zhang, Y., Cai, J., Chen, X., & Mao, X. (2025). Mapping Ecosystem Carbon Storage in the Nanling Mountains of Guangdong Province Using Machine Learning Based on Multi-Source Remote Sensing. Atmosphere, 16(8), 954. https://doi.org/10.3390/atmos16080954


