Article

Expanding Continuous Carbon Isotope Measurements of CO2 and CH4 in the Italian ICOS Atmospheric Consortium: First Results from the Continental POT Station in Potenza (Basilicata)

1
Institute of Methodologies for Environmental Analysis, National Research Council of Italy (CNR-IMAA), Contrada S. Loja, Tito Scalo, I-85050 Potenza, Italy
2
Department of Engineering, University of Basilicata (Unibas DiING), Via dell’Ateneo Lucano 10, I-85100 Potenza, Italy
3
Institute of Atmospheric Sciences and Climate, National Research Council of Italy (CNR-ISAC), Area Industriale Comparto 15, Lamezia Terme, I-88046 Catanzaro, Italy
4
Department of Biology, Ecology and Earth Sciences, University of Calabria (Unical DiBEST), Via Pietro Bucci Cubo 15B, Rende, I-87036 Cosenza, Italy
5
Italian National Agency for New Technologies, Energy and Sustainable Economic Development (ENEA), Via Enrico Fermi 45, Frascati, I-00044 Rome, Italy
*
Authors to whom correspondence should be addressed.
Atmosphere 2025, 16(8), 951; https://doi.org/10.3390/atmos16080951
Submission received: 30 June 2025 / Revised: 17 July 2025 / Accepted: 6 August 2025 / Published: 8 August 2025
(This article belongs to the Section Air Pollution Control)

Abstract

Carbon isotope fractionation is an efficient tool used for the discrimination and differentiation of sinks and emission sources. Carbon dioxide (CO2) and methane (CH4) are among the key drivers of climate change, and a detailed evaluation of variations in the 13C/12C ratio in either compound provides vital information for the field of atmospheric sciences. The Italian atmospheric ICOS (Integrated Carbon Observation System) consortium is currently implementing δ13C-CO2 and δ13C-CH4 measurements, with four observation sites now equipped with Picarro G2201-i CRDS (Cavity Ring-Down Spectrometry) analyzers. In this work, results from the first two months of measurements performed at the Potenza station in southern Italy between 20 February and 20 April 2025 are presented and constitute the first evaluation of continuous atmospheric δ13C-CO2 and δ13C-CH4 measurements from an Italian station. These results provide a first insight on how these measurements can improve the current understanding of CO2 and CH4 variability in the Italian peninsula and the central Mediterranean sector. Although preliminary in nature, the findings of these measurements indicate that fossil fuel burning is responsible for the observed peaks in CO2 concentrations. CH4 has a generally stable pattern; however, abrupt peaks in its isotopic delta, observed during March, may constitute the first direct evidence in Italy of Saharan dust intrusion affecting carbon isotope fractionation in the atmosphere. This study also introduces an analysis of the weekly behavior in isotopic deltas.

1. Introduction

The stable isotopes of carbon differ in their number of neutrons while maintaining the same electronic configuration and chemical behavior; 12C (carbon-12), which constitutes approximately 98.9% of the carbon found in nature, is predominant compared to 13C (carbon-13), whose abundance is estimated at around 1.1% [1,2]. Unlike the radioactive isotope 14C, also referred to as radiocarbon and used as an effective tracer to discriminate natural and anthropogenic sources [3,4,5,6,7], these isotopes are not subject to radioactive decay, thus ensuring their nuclear stability. The isotopic ratio δ13C is referenced against an international standard named VPDB (Vienna Pee Dee Belemnite), based on the 13C/12C ratio observed in a marine fossil belonging to the species Belemnitella americana [8] of the genus Belemnitella [9] discovered in the Pee Dee geological formation in South Carolina, USA [10]. Deviations from the VPDB standard are expressed in per mille or per mil (‰) and are widely used in source apportionment [11]. Specifically, δ13C is valuable in identifying carbon cycle dynamics [12], tracing seasonal biochemical processes [13,14,15,16], and interpreting isotopic signals in paleoclimatic and geological studies [17,18,19,20,21,22]. Stable carbon isotopic ratios have also been used to study the first possible evidence of life on Earth, pinpointed from the biogenic isotopic fingerprint observed in carbon inclusions within zircon minerals dating to the Hadean Eon (4.1 billion years ago) [23].
Stable carbon isotopes are closely tied to the understanding of climate change, serving as tracers for the processes involved in the carbon cycle and greenhouse gas dynamics [24]. Isotopic signatures, or the relative distribution of isotopes in a given sample, provide a sort of “fingerprint” unique to various natural and anthropogenic processes, enabling the identification and distinction of sources and emission dynamics of greenhouse gases such as CO2 and CH4 [25,26].
For CO2, δ13C allows, for instance, differentiation between carbon emissions from fossil fuels like coal and oil [27,28] and those of natural origin, such as emissions resulting from volcanic activity [29] or peculiar soil respiration processes [30,31]. Furthermore, stable isotopes are highly valuable tools in studying the dynamics of the carbon cycle: by analyzing isotopic variations, it becomes possible to understand how oceans and forests act as sinks, absorbing CO2 from the atmosphere, or as sources, releasing carbon under specific conditions [14,15].
The isotopic trends of atmospheric CO2 and CH4 have shown significant variations over time, influenced by a combination of anthropogenic and natural factors [32,33]. For CO2, δ13C has exhibited a steady decline, primarily reflecting the increasing contribution of emissions from fossil fuels that are depleted in 13C [25,34,35]. Seasonal effects play a key role, as photosynthesis and plant respiration drive annual variations linked to vegetative growth cycles [36,37]. Additionally, phenomena such as El Niño can alter δ13C values [38]. Atmospheric background values of δ13C-CO2 are approximately −8‰, with seasonal fluctuations caused by the CO2 uptake of photosynthesis during the summer and increased anthropogenic emissions during the winter [39,40]. In fact, as fossil fuels are characterized by a fingerprint in the ≈−25 to ≈−30‰ range [41], anthropogenic emissions cause CO2 concentrations to increase and δ13C-CO2 to decrease [42]; further analyses can discriminate coal emissions from those attributable to gasoline [43,44].
The differentiation of CO2 sources based on the carbon isotopic ratio relies on the distinct isotopic signature of fossil-derived carbon, the result of photosynthetic isotopic discrimination that occurred during the formation of ancient biomass, wherein autotrophic organisms preferentially assimilated the lighter isotope δ12C instead of the heavier δ13C [13]. The organic matter thus produced was relatively depleted in δ13C and, following long-term geological processes of burial and diagenesis, was converted into fossil fuels [45]. Upon combustion, these fuels release CO2 retaining the original isotopic depletion, with δ13C values typically averaging around −28‰. This contrasts with natural emissions such as those from volcanic activity or contemporary biospheric respiration, which exhibit less negative δ13C values.
For CH4, observed trends indicate a shift in the global budget, with natural sources such as wetlands driving changes in the total isotopic fingerprint of CH4 [46,47]. Anaerobic methanogenesis processes in wetlands are characterized by isotopic fractionation, during which lighter carbon isotopes (12C) are preferentially utilized in biochemical reactions, releasing CH4 with highly negative isotopic values. The isotopic fractionation reflects the underlying mechanisms of CH4 production—primarily hydrogenotrophic methanogenesis (via CO2 reduction), typically yielding δ13C signatures as low as −80‰ or lower, and acetoclastic methanogenesis (from acetate fermentation), which results in relatively less negative values, often between −65‰ and −50‰. This underscores the variability and complexity of natural contributions [48]. The processes that drive changes in the global CH4 budget are still not fully understood, and the study of isotopic fractionation in CH4—also accounting for 14C—has become a key tool to constrain current uncertainties in models [49]. δ13C-CH4 values are generally more depleted than their δ13C-CO2 counterparts: pyrogenic emissions are in the −13 to −25‰ range, while thermogenic emissions are in the −25 to −55‰ range and biogenic emissions are particularly depleted in δ13C, reaching the −55 to −70‰ range [50,51,52]. Fossil fuel-related CH4 can be isotopically distinguished between two principal sources: fugitive emissions and those resulting from incomplete combustion. The former arise from unintentional releases occurring during the extraction, processing, and transportation of natural gas and petroleum: this thermogenic CH4 is typically characterized by δ13C values ranging from −25‰ to −55‰, reflecting its deep geological origin [49]. In contrast, CH4 produced via the incomplete combustion of fossil materials (coal, petroleum, wood, gasoline, etc.)—commonly referred to as pyrogenic methane—exhibits less negative δ13C signatures, generally within the −13‰ to −29‰ range, and presents a more heterogeneous isotopic composition, strongly influenced by the nature of the combusted material and by combustion efficiency [53].
The current δ13C-CH4 value for the atmospheric background is ≈−47‰ [54], with a reported decline to values closer to the −47.5‰ mark [55]. Minor differences have been reported between the northern and southern hemisphere [56].
Analytical techniques for measuring stable isotopologues are primarily distinguished based on their measurement principles, grouping into isotope ratio mass spectrometry (IRMS) [57] and laser absorption spectroscopy (LAS) techniques [58]. The IRMS technique is based on the separation of ions according to their mass-to-charge ratio (m/z) using a magnetic field, enabling the direct measurement of isotopic ratios relative to reference standards with a known isotopic composition. This technique requires the conversion of the sample into a gaseous phase and is traditionally used in laboratory settings, although developments such as continuous-flow IRMS (CF-IRMS) [59] have improved analysis speed. Conversely, LAS relies on the absorption of laser light at specific wavelengths by CO2 molecules, where each isotopologue absorbs light radiation at slightly different frequencies. LAS techniques measure the mixing ratio of individual isotopologues, from which isotopic ratios are calculated, and include various methodologies such as tunable diode laser absorption spectroscopy (TDLAS) [60], quantum cascade laser spectroscopy [61,62] (QCLAS), cavity ring-down spectroscopy (CRDS) [63,64,65,66], off-axis integrated cavity output spectroscopy (OA-ICOS) [67], and Fourier transform infrared spectroscopy (FTIR) [68]. LAS techniques are generally better suited for in situ measurements and offer a higher measurement frequency compared to IRMS.
In Italy, measurements of δ13C were limited to specific circumstances, such as an evaluation of the isotopic fingerprint of Mount Etna’s CO2 outputs [69]. Until recently, the country lacked a well-established and organized consortium of atmospheric stations performing continuous δ13C measurements of CO2 and CH4.
In this work, we present the first results of the measurements performed near Potenza, southern Italy, at the Institute of Methodologies for Environmental Analysis (Istituto di Metodologie per l’Analisi Ambientale, IMAA) of the National Research Council of Italy (Consiglio Nazionale delle Ricerche, CNR) as the new Class 1 atmospheric station in the Integrated Carbon Observation System (ICOS) research infrastructure [70]. These results constitute the first step towards the full implementation of these measurements in the developing cross-country network. A recent study [71] highlighted the addition of the Potenza site as an extra step towards filling notable gaps in the southern European network of ICOS stations, which are not equally distributed across the continent. In addition to presenting the preliminary results, this study relies on the methodology first introduced by C.D. Keeling to pinpoint the isotopic fingerprint of sources [72], thus allowing us to provide an insight into source apportionment at the site. Therefore, this study constitutes a preliminary report on the expansion of advanced greenhouse gas measurements in the central Mediterranean, integrating existing research with new insights into source apportionment and the attribution of observed peaks to natural or anthropogenic sources.
This work is divided as follows: Section 2 describes the Italian network of continuous carbon isotope measurements and the main characteristic of the POT site; Section 3 describes the instrument and methodologies used for these measurements; Section 4 shows the results of the measurements; and Section 5 and Section 6 discuss the results and conclude the paper, respectively.

2. The National Consortium, with a Focus on POT

The ICOS Italian consortium (Figure 1A) is expanding its instrumentation capacity by integrating continuous carbon isotope measurements into its atmospheric research consortium. Currently, four monitoring stations are equipped with Picarro G2201-i analyzers (Santa Clara, CA, USA) to measure δ13C-CO2 and δ13C-CH4, strengthening the consortium’s alignment with European research efforts in atmospheric composition studies. The first station, Lampedusa (LMP), operated by ENEA (Italian National Agency for New Technologies, Energy and Sustainable Economic Development) and located in the Strait of Sicily, 135 km east from Tunisia, initiated these measurements, setting the foundation for long-term isotopic monitoring. Subsequently, under the ITINERIS project (Italian Integrated Environmental Research Infrastructures System), three additional stations belonging to the national consortium were equipped with the isotope analyzer: In July 2024, the Lamezia Terme (LMT), a regional coastal World Meteorological Organization—Global Atmosphere Watch (WMO/GAW) station in the region of Calabria was equipped with the G2201-i analyzer, generating a dataset of continuous measurements (July–December) [73]. The northernmost station, Monte Cimone (CMN), is also performing continuous measurements of stable carbon isotopes in CO2 and CH4, further expanding the consortium’s geographical coverage. The latest addition, the ICOS POT station (February 2025) (Figure 1B,C), completes the current national consortium, ensuring broader observational capabilities.
POT is a new ICOS Class 1 atmospheric station and is part of the CIAO (CNR IMAA Atmospheric Observatory) [74,75], which hosts two ESFRI (European Strategy Forum on Research Infrastructures) research infrastructures (RIs) involved in atmospheric characterization: ICOS and Aerosols, Clouds, and Trace Gases Research Infrastructure (ACTRIS). These two pan-European RIs are dedicated to studying atmospheric phenomena from the near surface to the lower stratosphere, producing high-quality, standardized, and open-access data [76,77].
As of today, the site has successfully completed Step 1 of the ICOS labeling process. This indicates that both the site and its infrastructure have been assessed and approved by ICOS. To achieve official recognition as an operational ICOS station, the final phase, Step 2, must still be completed. This process is currently underway and requires all instruments to be in regular operational mode.
The station is situated on a plain enclosed by low mountain ranges and is located within 150 km of the western, southern, and eastern coastlines of the Mediterranean Sea. This positioning exposes the station to a typical mountainous climate significantly influenced by Mediterranean atmospheric dynamics: the resulting climate pattern is characterized by predominantly arid, hot summers, and cold winters. The surrounding area mainly consists of non-irrigated arable land, forests, and grasslands and, accordingly with ICOS recommendations, the site is located far from large cities or heavy anthropogenic sources that could affect GHG observations: the closest urban center is the regional capital of Potenza (~9 km NE, 819 m a.s.l.; 64.100 inhabitants, 365 inhabitants/km2), and some small villages (Tito, the most populous one, has less than 7500 inhabitants) are at about 10 km from the site. A high-speed road is located 1 km north of the site while the nearest highway (A3) is about 30 km west of the site.
This positioning exposes the station to a typical mountainous climate significantly influenced by Mediterranean atmospheric dynamics. The measurement station consists of a 104 m tall tower with sampling points at 100 m, 50 m, and 10 m heights, in accordance with ICOS requirements for continental stations. The top sampling level (≥100 m) is used to avoid local influences and collect data on atmospheric processes across broader areas, enabling insights into regional greenhouse gas sources and sinks [78]. Air sampling at lower levels (10 m and 50 m) helps to analyze the vertical distribution of greenhouse gas concentrations to understand local phenomena. Situated in the southern region of the Italian peninsula, the station holds a strategic position within the Mediterranean basin, linking the hints from atmospheric circulation from different European region domains and allowing the observation of interactions and transitions between them, providing insights into atmospheric dynamics, gas transport, and other environmental phenomena that may not be evident when measuring in only one of the regions. Measurements of stable carbon isotopes from tall towers have provided numerous details on the extent and nature of anthropogenic and natural emission sources at various scales [79].
In POT’s case, whose measurement footprint—shaped by its configuration as a tall-tower atmospheric station—extends over a broad and regionally representative area, similar to what has been observed at sites like LMP and CMN [80,81], stable isotope measurements would provide the first estimate of δ13CO2 and δ13CH4 background levels in the central Mediterranean Basin.

3. Data Gathering and Evaluation Methodology

The measurements evaluated in this study were performed for 60 continuous days, from 20 February to 20 April 2025. A 60-day window was selected as it represents a sufficiently long period to capture meaningful isotope variability while remaining well within the manufacturer’s recommended calibration interval. Measurements were taken using a Picarro G2201-i (Santa Clara, CA, USA) CRDS analyzer; the dataset used in this work is available on the ITINERIS (Italian Integrated Environmental Research Infrastructures System) HUB [82]. Air was sampled from the top level of the tower (100 m) by Synflex 1300 aluminum/polyethylene composite tubing of 12 mm OD (EATON, Dublin, Ireland). Two vacuum pumps were used: one pump, KNF model KTE N815 (KNF, Schenkon, Switzerland), drew air from the top level of the tower, while the other one (instrument pump) delivered the sampled air to the analyzer. Sampled air passes through two filters: One of 2 mm porosity (M&C F2, Ratingen, Germany) provides protection from particulate and allows us to also detect possible water intrusion due to tubing damages, thanks to the external glass bulb. The second filter of 0.5 mm porosity (Swagelok, Solon, OH, USA) is placed at the inlet of the analyzer and serves to protect the instrument’s internal filter from any intrusion of finer particulate matter. The analyzer also measures the water vapor content of the sample, but internal water correction is insufficient for this type of analyzer [83]. To avoid artifacts in the measurements, a Perma Pure MD 070-144 S-4 Nafion dryer (Perma Pure, Lakewood, NJ, USA) was connected in line. The flow rate of the sampled air into the instrument was approximately 25 mL/min.
The Picarro G2201-i used at POT station operates in CO2-CH4 simultaneous mode, which allows us to measure CO2 and CH4 mole fractions, as well as the carbon isotope fractionation of both compounds. The reported precision in this mode for δ13C-CO2 is <0.16‰, while that of δ13C-CH4 in High Precision (HP) is <1.15‰. The HP mode of CH4 has been selected due to measured concentrations being in the HP range (1.8–12 ppm); High Dynamic Range mode (HR) is recommended for higher concentrations (10–500 ppm), which were not observed during the entire measurement period. The instrument performs one measurement per second. All measurements were aggregated on both an hourly and a 10 min basis to generate a dataset yielding a 98.47% (hours) and 98.26% (10 min blocks) coverage rate during the observation period (20 February–20 April). During the entire measurement period, H2O was constantly below the Guaranteed Spec Range limit of 2.4% recommended by the manufacturer: the highest reported value of water vapor was in fact 0.055%, with an average of 0.013% ± 0.016% (one standard deviation). All data were processed using an algorithm developed by the CNR-ISAC (National Research Council—Institute of Atmospheric Sciences and Climate) Lamezia Terme, Italy, to generate a G2201-i dataset in the Calabria neighboring region [73]. The algorithm parses through raw data and excludes from further processing all measurements that do not have optimal status flags.
The instrument started data gathering operations shortly before the beginning of the measurements evaluated in this study, and its initial conditions reflected the manufacturer’s setup and configuration. This guarantees the quality of the data and the absence of drifts for the whole period considered in our study (60 days): the manufacturer recommends long-term calibration via the primary standard every 3–4 months [84].
In order to verify the stability of measurements, G2201-i mole fractions of CO2 and CH4 corrected for H2O (“dry”) were compared with the Picarro G2401 CRDS counterparts operating at POT at the same time. A total of 1015 h of measurements of both instruments were compared using the Bland & Altman methodology [85,86] using the blandr package and library in R 4.5.1 [87]. The graphical results yielded by the method (Figure 2) and the statistics of the comparison (Table 1) indicate good agreement between the two instruments. These results do not constitute an alternate procedure for G2201-i calibrations; however, they provide information on the stability of measurements during the study period at POT.
This analysis aims to provide an initial insight on carbon isotope variability over the country and to gather information about the ranges in isotopic deltas that should be considered in future calibration procedures accordingly to the recommendations of both the manufacturer [84] and—specifically for CH4—the IAEA (International Atomic Energy Agency) [88].
Daily [89] and weekly [90] cycles were investigated based on the methodologies seen in previous studies from the other Italian sites equipped with the same kind of instrument. The daily cycle evaluated in this study considers, for the first time, the 10 min block aggregation in addition to hourly averages and standard deviations. It is important to note that this analysis is representative of the specific observation period between February and April and does not reflect annual patterns.

4. Results

4.1. Observed Values

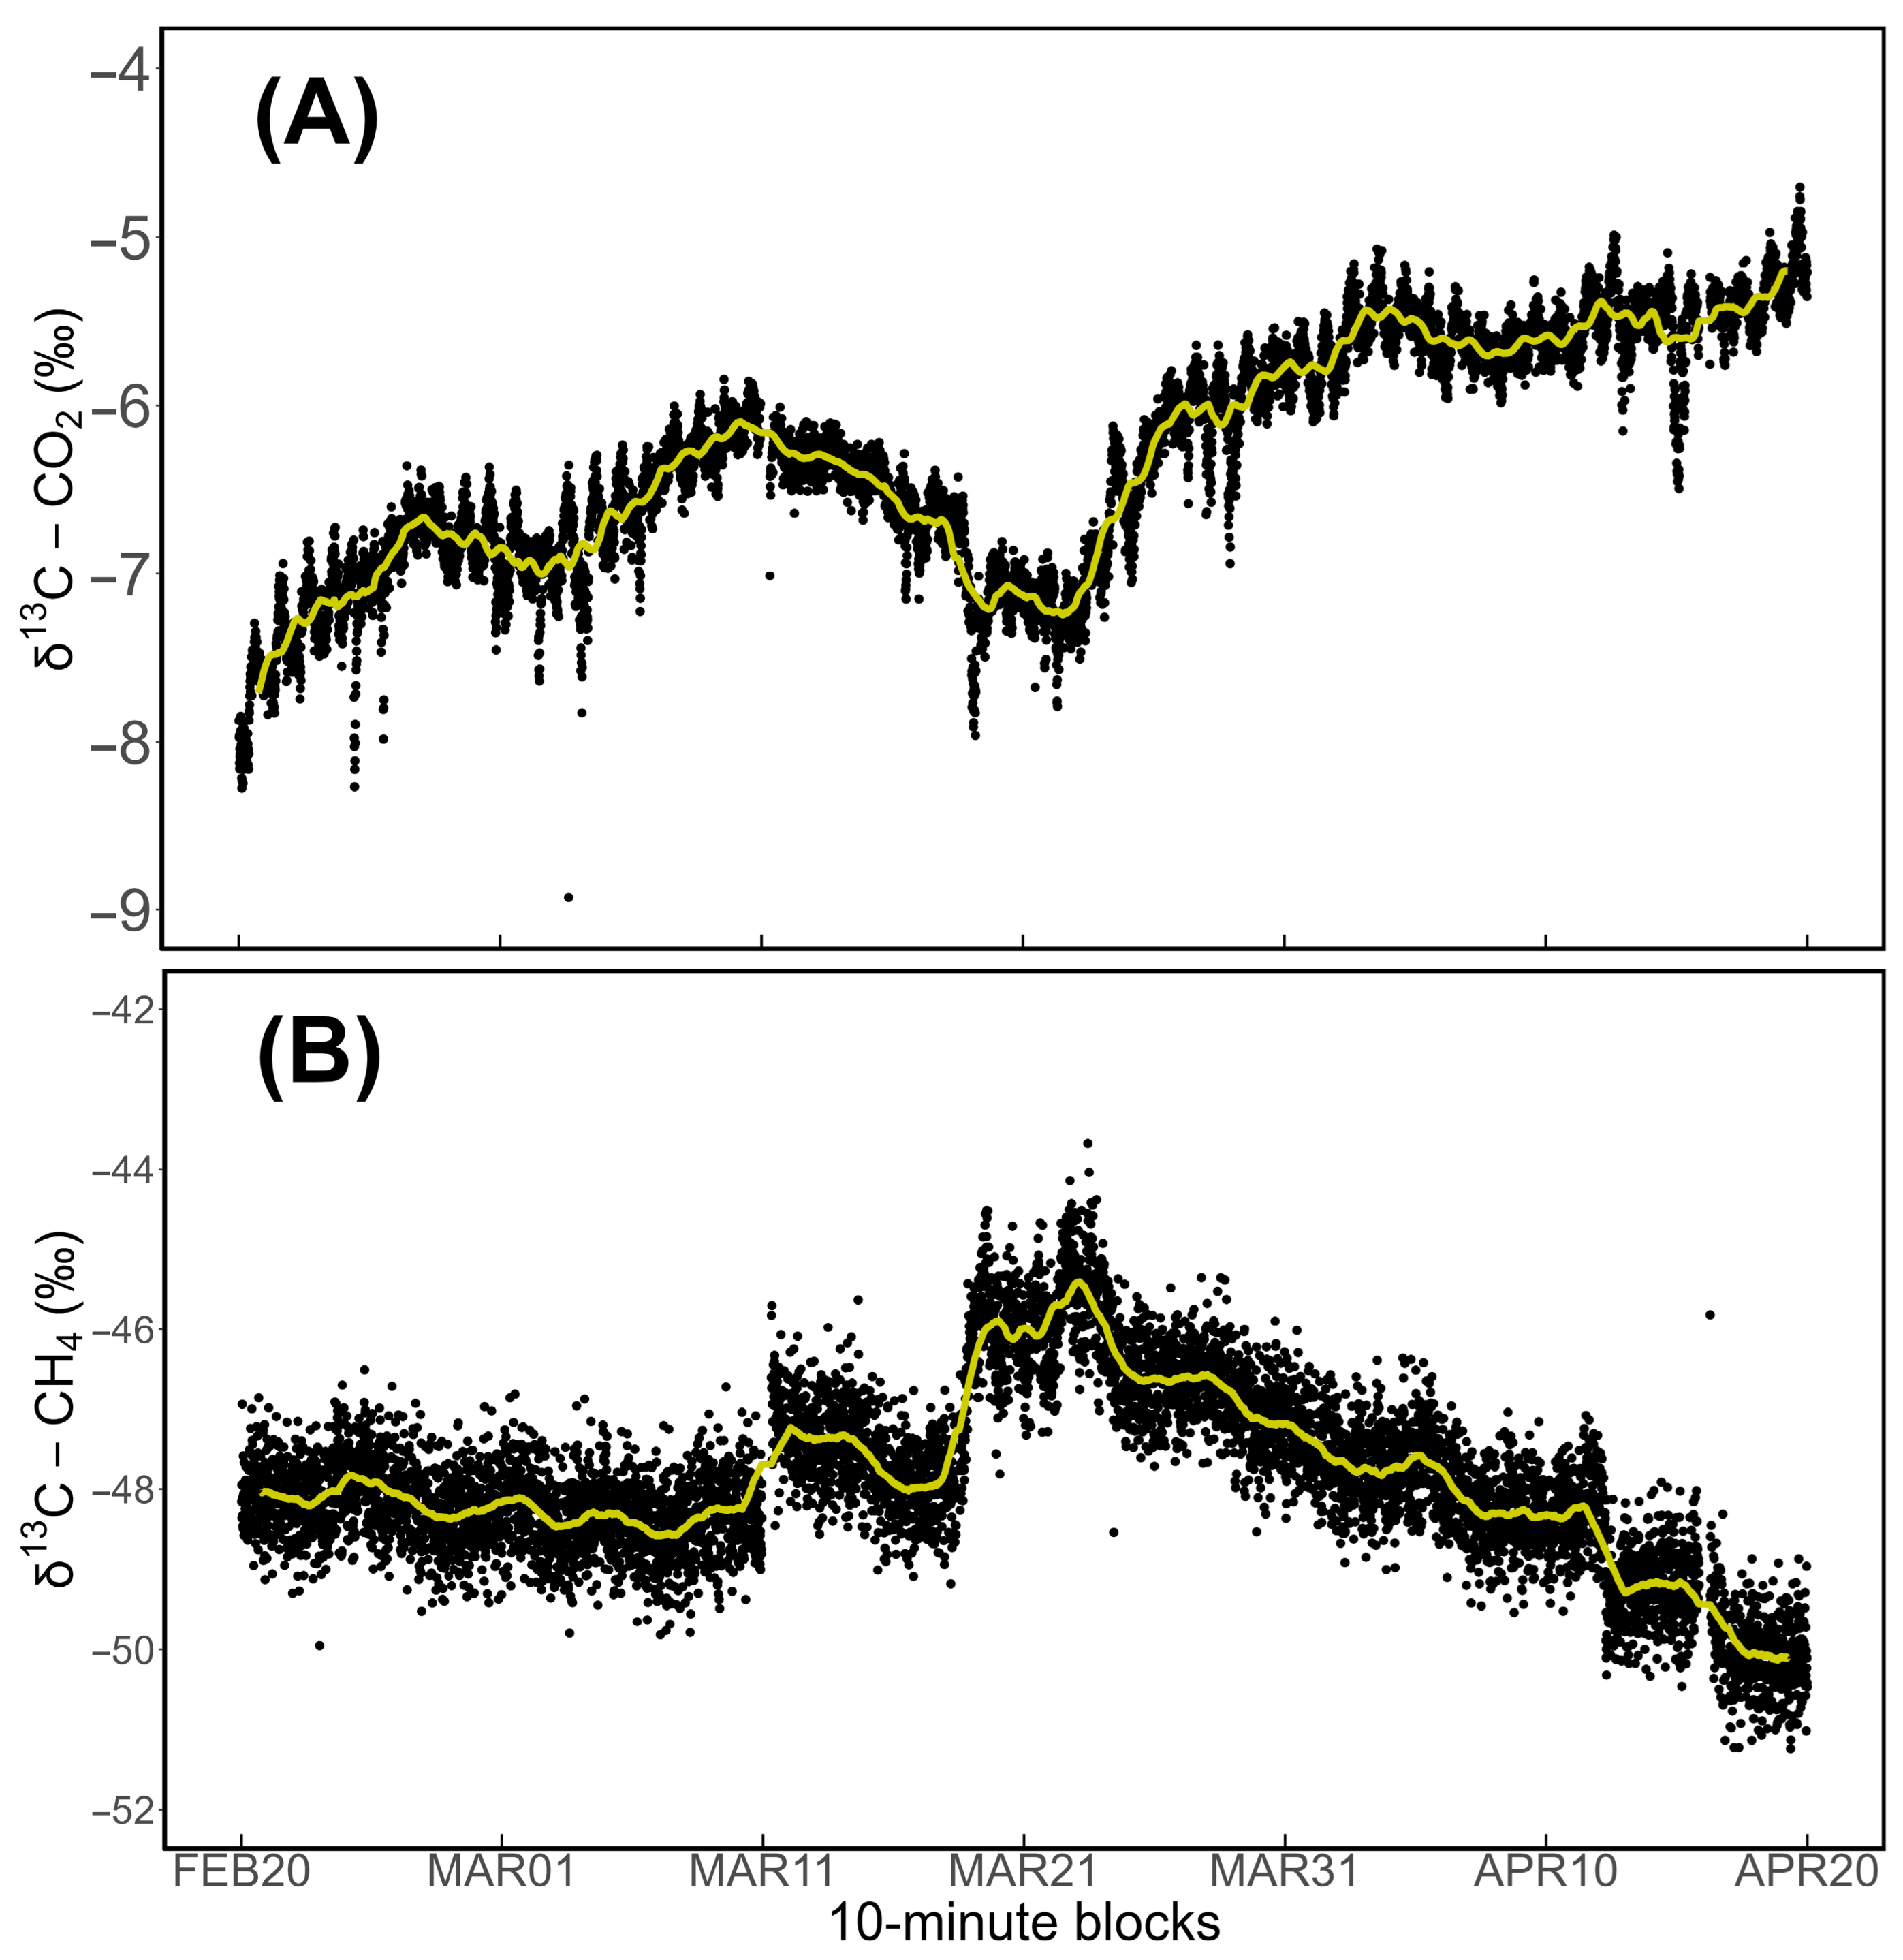
Figure 3 and Figure 4 report CO2 and CH4 and their isotopic deltas, respectively. Along with the original data collected, a 36 h moving average is reported.
Mole fractions and isotopic deltas show distinct behaviors, which are attributable to changes in the balance between different sources of emissions. Specifically, δ13C-CH4 tendencies are affected by abrupt increases, followed by a gradual decrease. Table 2 shows the results of these measurements and their respective standard deviation intervals.

4.2. Daily Cycle Variability

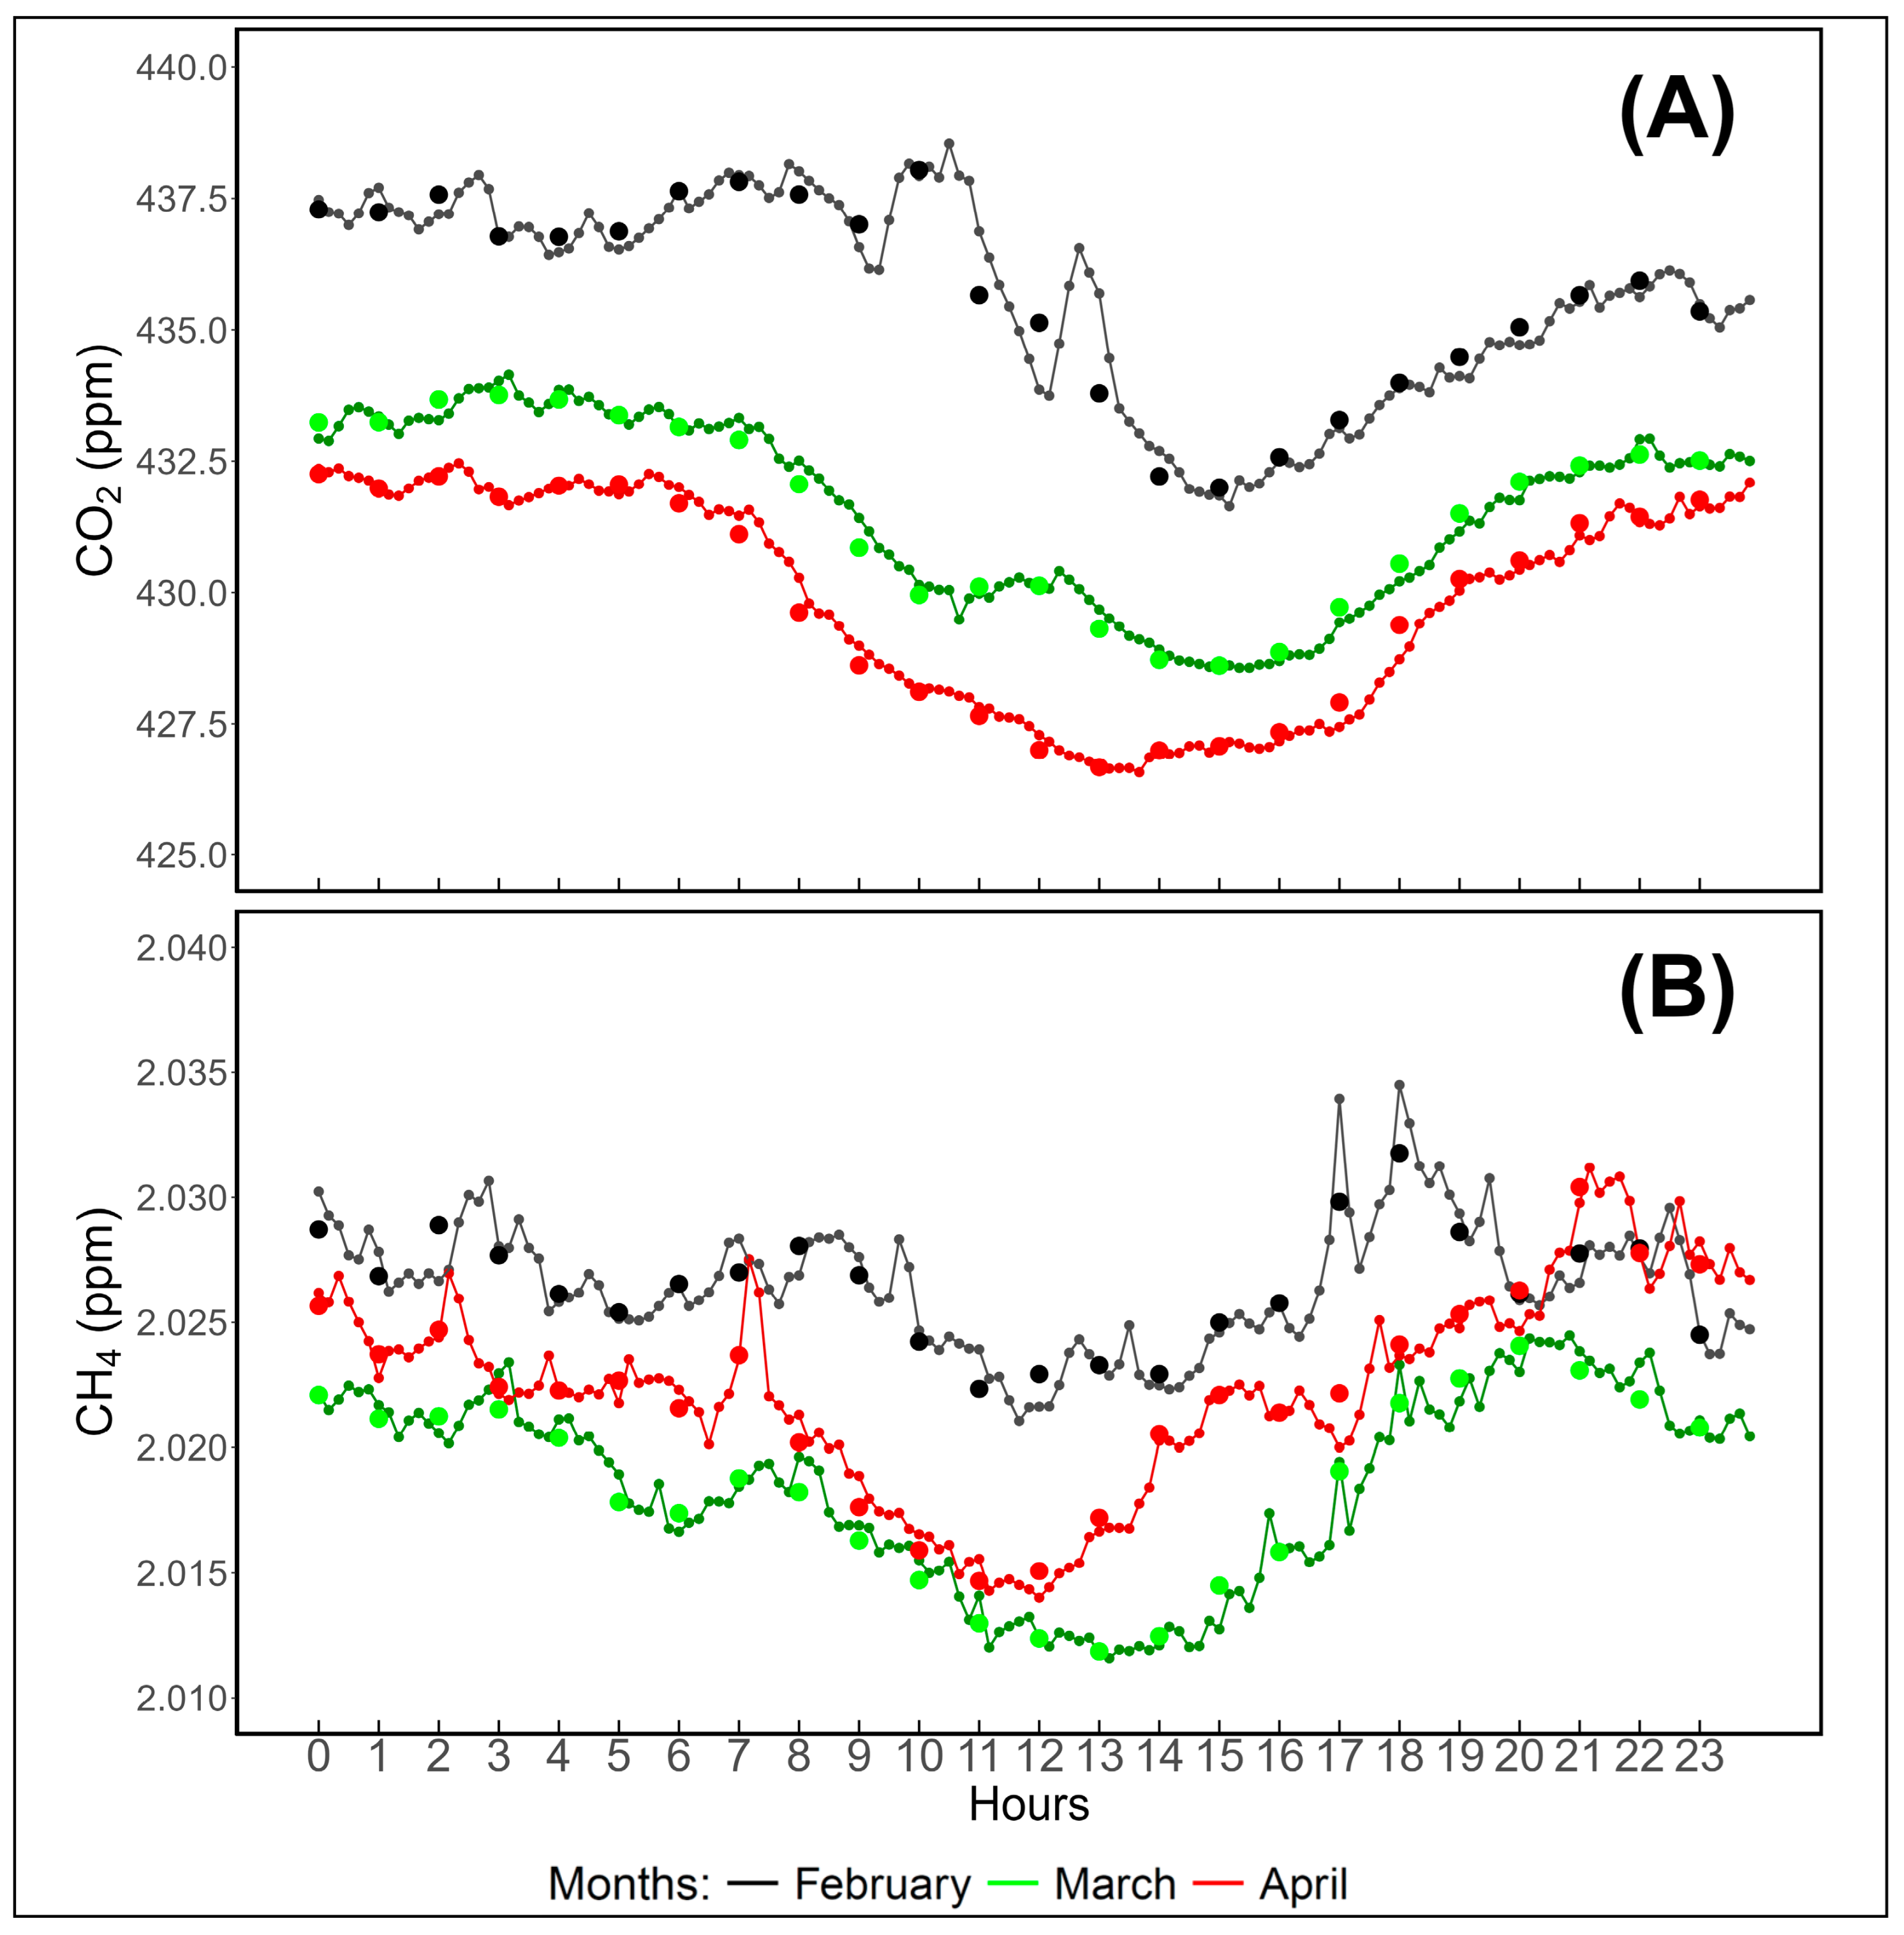
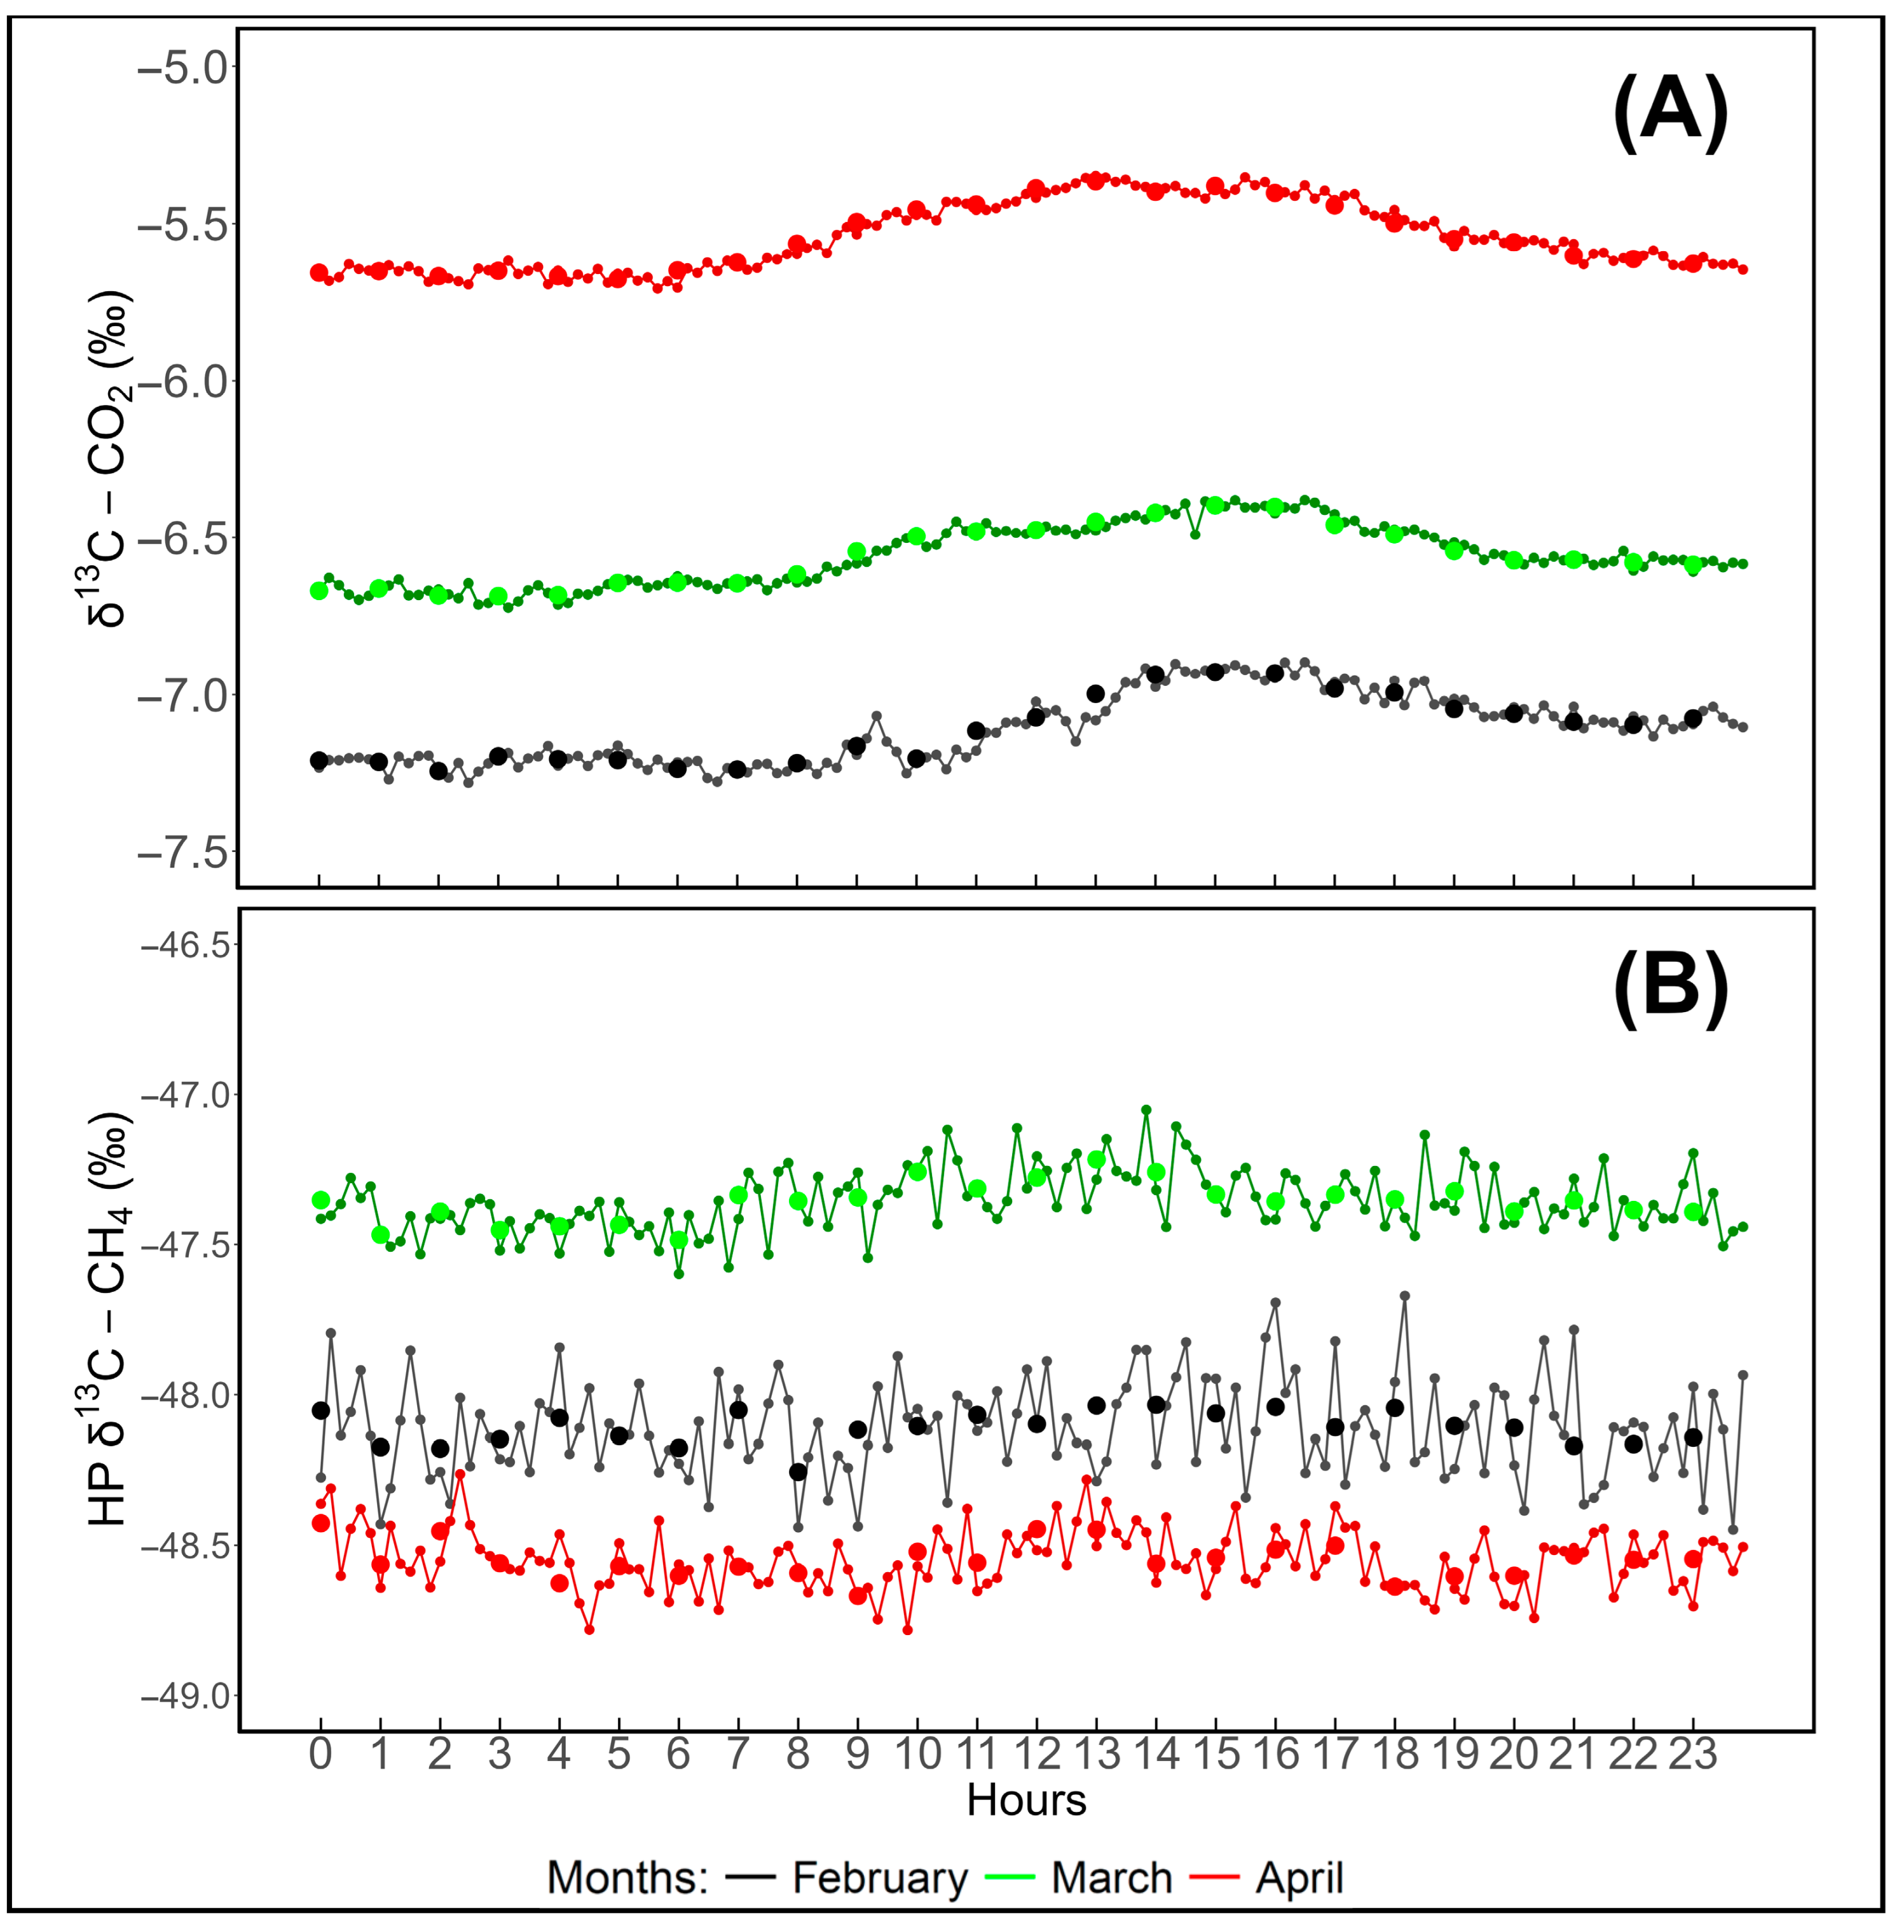
Other studies from the national consortium have highlighted peculiar patterns in daily cycle variability, largely driven by local circulation patterns and changes in anthropic activities [89]. In this work, the daily cycle is evaluated with enhanced time resolution via the implementation of 10 min blocks. The results are shown in Figure 5 for CO2 and CH4 variability and Figure 6 for their respective isotopic deltas. The data are aggregated on a monthly basis to reflect longer timescale changes during the period.
Overall, the aggregation by month allows us to pinpoint, for CO2 in particular, that with increasing temperatures and photosynthesis, δ13C-CO2 leans towards higher values. Regarding CH4, there is no monotonic behavior with time: a decrease is observed from February to March but then values in April are higher than in March. This is probably linked to anomalies observed in March. This reflects also on δ13C-CH4: the highest values are observed in March for all hours of the day.

4.3. Weekly Cycle Variability

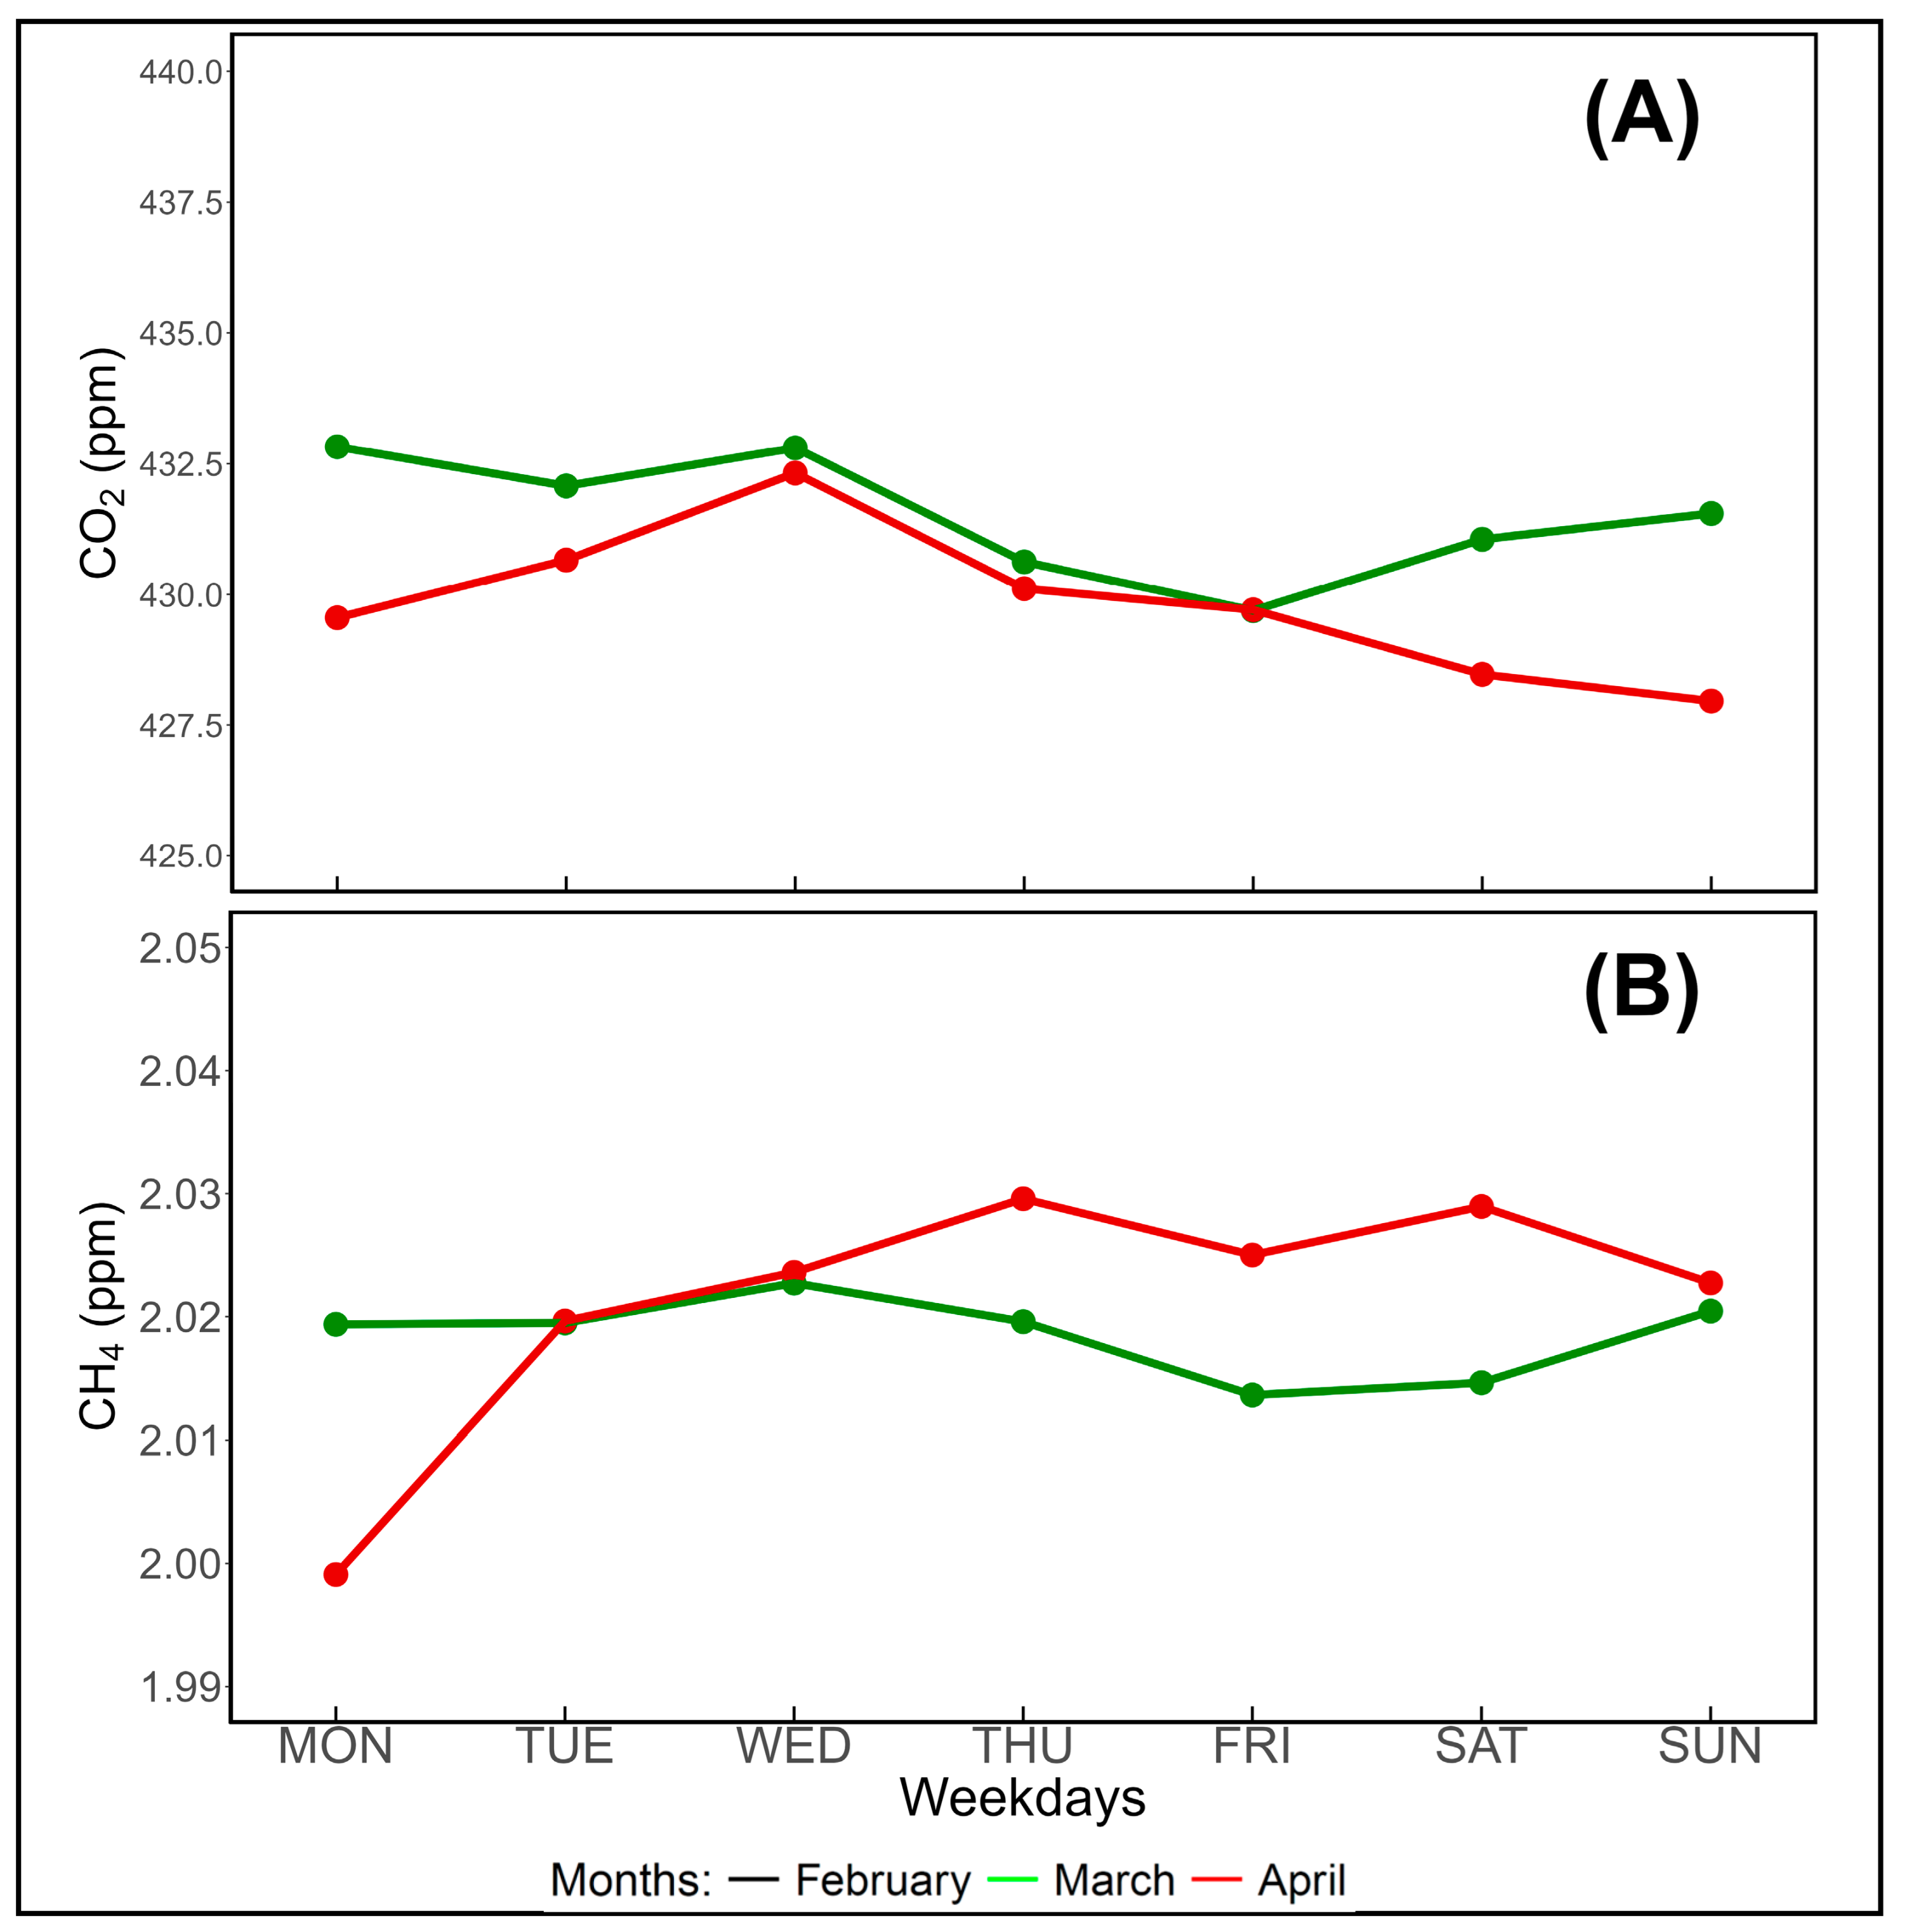
The evaluation of weekly cycles has been used in other studies to highlight anthropic influences, as natural processes—unlike daily, seasonal, and annual cycles—are not affected by changes during a standard week [90,91,92]. Weekly cycles (MON-SUN) of CO2 and CH4 during the period March–April are shown in Figure 7, while the isotopic deltas are shown in Figure 8.
The weekly data for February were not considered because the sampling period was only eight days.
The plots do not allow us to determine substantial differences between weekdays. Therefore, the data were further evaluated to assess the statistical significance of possible differences in the averages between weekday (WD, MON-FRI) and weekend (WE, SAT-SUN) concentrations/isotopic deltas. In order to apply the non-parametric Kruskal–Wallis test [93], the normality of the data distribution was assessed via the Shapiro–Wilk test [94] in R. CO2 and CH4 concentrations, as well as their respective isotopic deltas, which yielded p-values < 0.05, thus indicating that the data did not follow a normal distribution. Consequently, the Kruskal–Wallis tests allowed us to determine the presence of a statistically significant difference between WD and WE concentrations of CO2, while δ13C-CO2, CH4, and δ13C-CO2, did not show a consistent weekly cycle.

4.4. Keeling Plot and Source Apportionment

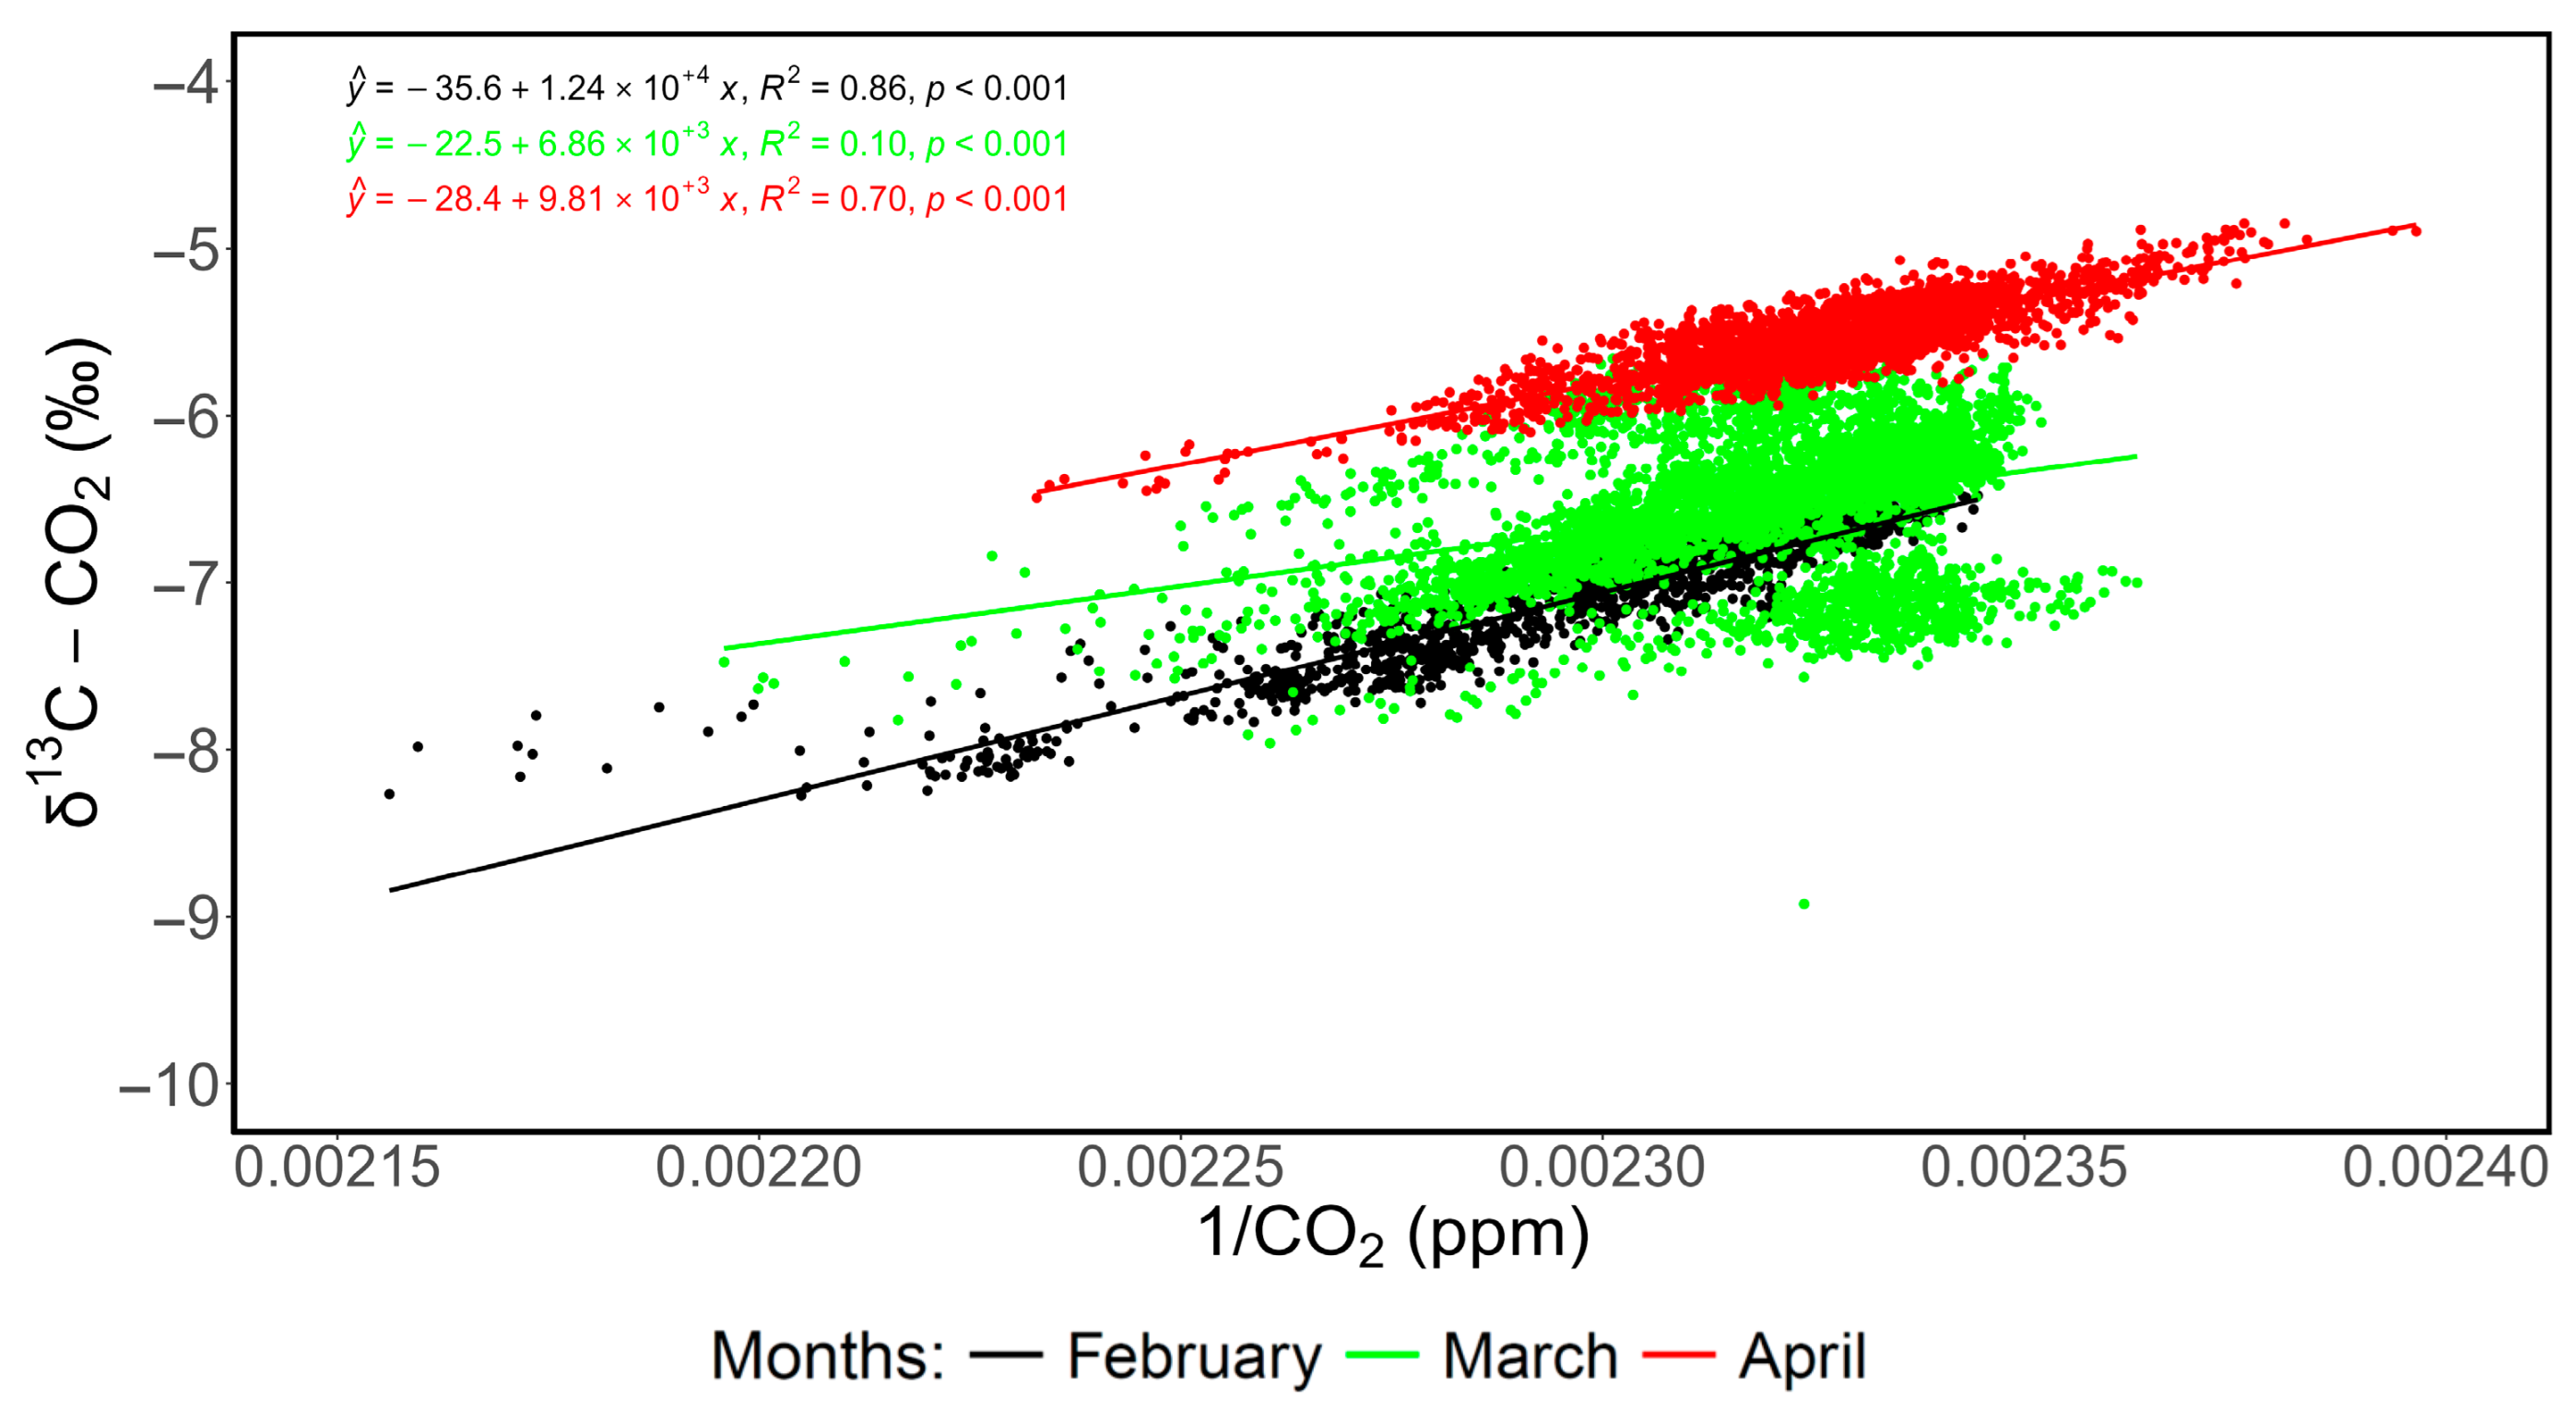
Keeling plots [72] is an effective methodology by which it is possible to pinpoint the isotopic fingerprint of emission sources. In this study, the first Keeling plot computed by the Italian atmospheric monitoring consortium is shown (Figure 9); however, this is limited to CO2 only, as the analysis of CH4 did not yield statistically relevant results. The evaluated data are categorized on a monthly basis, an approach employed in research works such as Hoheisel et al. [95].
All regression lines are statistically very significant (p-value < 0.001), while the R2 values range between 0.10 (March) and 0.86 (February). The intercepts, which according to the Keeling plot methodology are representative of the characteristic isotopic fingerprint of the observed emission source(s), indicate that increased CO2 concentrations are compatible with fossil fuel emissions. March’s poor correlation, and its intercept leaning towards a higher δ13C-CO2 value, further corroborate the hypothesis by which the month was affected by anomalous events for the period. Notably, Saharan dust intrusions recorded in mid to late March (10–14, 16–18 and 22–24) contributed to several disturbances in the data and such events were not observed during April. The effects of Saharan intrusions on CO2 isotopic fractionation, in addition to the effects on CH4, need to be further evaluated in future research.

5. Discussion

At the new ICOS POT station (Figure 1), the preliminary data gathered by a Picarro G2201-i analyzer of δ13C-CO2 and δ13C-CH4 were evaluated to provide the first insight on isotopic trends in the area. The study of GHGs at scales ranging from global to local is extremely important for the introduction of emission mitigation measures [96]. The importance of carbon isotope fractionation as a tool to discriminate between anthropogenic and natural sources has been known for decades [97]; however, the Italian ICOS atmospheric consortium lacked the infrastructure and instruments to perform these analyses. With a national consortium now in development [73], carbon isotope measurements are expected to increase the level of accuracy in source apportionment efforts performed in Italy. This study presents the first results related to the measurements of stable carbon isotopes in CO2 and CH4, representing the first published findings within the national consortium.
The accuracy of the measurements evaluated in the measurements is affected by the current lack of a national standard for isotopic measurements of δ13C-CO2 and δ13C-CH4. The measurements’ duration (60 days) was specifically selected to remain in an acceptable range of uncertainty, as the manufacturer Picarro recommends calibration with primary standards at least once every 3–4 months, in addition to regular calibration procedures [84]. The measurement period is characterized by an optimal coverage rate, over 98% for both the hourly and 10 min aggregations.
Although calibration standards of isotopes are presently not available in the national consortium, the stability of G2201-i measurements at POT was assessed via a direct comparison with a Picarro G2401 CRDS analyzer measuring mole fractions of CO2 and CH4 at the same site. The Bland & Altman methodology [85,86], which is commonly used to compare two instruments measuring the same parameter(s), allowed us to verify that G2201-i measurements were in good agreement with their G2401 counterparts (Figure 2, Table 1). This procedure does not replace full calibration using isotopic standards; however, it still allowed us to ensure the stability levels required to perform the assessments presented in this work.
The general tendencies observed during the study period allow us to highlight differences in the behavior of both compounds (Figure 3) compared to their isotopic deltas (Figure 4). CO2’s mole fractions show a decline typical of transitions from low to high temperatures (Figure 3A), which results in an increase in δ13C-CO2 (Figure 4A). This behavior is consistent with increased photosynthetic activity, which normally peaks during the summer and results in the lowest CO2 concentrations and the highest δ13C-CO2 values of the year [36]. CH4 does not show a clear transition between February and April (Figure 3B); however, abrupt changes in δ13C-CH4 are observed during March (Figure 3B), matching the occurrence of three Saharan dust intrusion events that affected Southern Italy in mid to late March [98,99]. These values diverge from those observed in nearby urban areas [100].
In the atmosphere, CH4 is characterized by more uncertainties in the attribution of sources and sinks, with natural emissions being a key driver of global scale shifts [101]. Changes in δ13C-CH4 may be caused by sinks such as chlorine (Cl) or hydroxyl radical (•HO), which are known to have a characteristic isotopic fingerprint [102,103]. A previous study on CH4 variability in the neighboring region of Calabria highlighted the potential of δ13C shifts in CH4 as a tool to assess the effects of this sink [89]. The observed changes in CH4’s isotopic delta could be attributable to the interaction between Saharan dust and sodium chloride (NaCl), which results in mineral dust–sea spray aerosol (MDSA) [104]. The consequent chemical reactions can release reactive Cl radicals [54], which can alter the atmosphere’s oxidizing capacity [105]. This phenomenon may then cause an increase in isotopic deltas [106,107], which requires further investigation.
Potential shifts that occurred during the study period can be seen in Table 2. CO2 concentrations show a gradual decline, which is compatible with reduced anthropogenic emissions and increased photosynthetic activity in the transition from cold (435.65 ± 5.58 ppm) to warm seasons (429.82 ± 3.47 ppm); this also results in an increase in δ13CO2 due to the isotopic fractionation of plants that favor the lighter isotopologue 12CO2 (from −7.11 ± 0.38‰ to −5.54 ± 0.22‰). CH4 shows overall stable concentrations during the study period (2.02 ± 0.02 ppm); however, its isotopic fingerprint is less depleted in March (−47.36 ± 1.06‰) compared to February (−48.11 ± 0.47‰) and April (−48.55 ± 1.00‰), further corroborating the hypothesis by which Saharan dust intrusions in March may have triggered isotopic fractionation processes in CH4.
The daily cycle of CO2 (Figure 5A) follows a characteristic pattern: the lowest concentrations are recorded during the central hours of the day, coinciding with peak photosynthetic activity and a consequent increase in δ13C-CO2 (Figure 6A), while they decrease at night. The δ13C-CO2 values highlight the daily variations in atmospheric CO2: the increase in δ13C-CO2 during daytime results from isotopic fractionation associated with biochemical photosynthesis processes [37]. This phenomenon is due to the preferential uptake of the lighter isotopologue, 12CO2, by plants, leaving higher values of 13CO2 in the atmosphere. Moreover, an increase in the average δ13C-CO2 value is observed from February to April, coinciding with the rise in photosynthetic activity typical of the warm boreal period [39,40]. Additionally, this variation is accompanied by a reduction in CO2 emissions from thermogenic activities, which are characterized by an enrichment in 12CO2. The average concentration of CO2 tends to decrease from February to April, likely due to the reduced use of domestic heating sources as the transition from winter to spring occurs. CH4, on the other hand, exhibits less pronounced daily variations (Figure 5B), with a slight decrease in concentration during the day, though less significant compared to CO2, especially when considering the relative abundance of both compounds in the atmosphere. However, its average mole fraction does not appear to follow typical seasonal variations: a decrease in concentration is observed from February to March, as expected, followed by an increase from March to April, contrary to the usual pattern of CH4. This phenomenon, currently under investigation in an ongoing study [98], could be another piece of evidence of Saharan dust influence on the chemistry of CH4 in the central Mediterranean [108], in particular on its stable isotope chemistry [106,107]. With the average δ13C-CH4 values measured in March being consistently different from their February and April counterparts (Figure 6B), the effects of rapid anomalies such as Saharan dust events deviating from seasonal trends further supports the hypothesis of a Cl effect on δ13C-CH4.
Based on the methodologies introduced by other studies from the national consortium [90,109], an evaluation was aimed at the weekly pattern of CO2 and CH4 (Figure 7), and their respective isotopic variations (Figure 8). These evaluations allow us to determine the extent of anthropogenic emissions on continuous measurements, as anthropic activities are affected by weekly patterns that are not present in nature and therefore cannot be reported in daily, seasonal, and annual cycles. Possible influences linked to a weekly cycle include, but are not limited to, reduced photosynthesis caused by increased atmospheric pollution, which would result in a lower δ13C-CO2 value [110,111]. The analysis showed that no clear weekly patterns are present as the differences are primarily of a seasonal nature and reflect the variability of CO2 and CH4 in a Mediterranean climate. One exception is CO2 during the month of April, which yields higher δ13C-CO2 and lower mole fractions during weekends, possibly reflecting reduced anthropogenic emissions and a higher influence of photosynthesis as a sink.
Finally, the Keeling plot [72] method was used to assess the extent and influence of specific sources over POT’s preliminary results. The Keeling plot assessment of CH4 did not yield statistically significant results; however, that of CO2 (Figure 9) provided the first insight from the national consortium on the influence of anthropogenic sources of CO2. In fact, the intercepts of regression lines indicate emission sources with a δ13C of ≈−25/−30‰, consistent with fossil fuel burning. A lower R2 is reported for March as the values are distributed over a wider range and likely reflect the influence of Saharan dust events on photosynthesis. Overall, the results of the measurements allowed us to highlight both general trends, such as environmental responses to seasonal changes in the central Mediterranean, and specific circumstances such as Saharan dust events.

6. Conclusions

The results of δ13CO2 and δ13CH4 measurements performed over 60 continuous days (20 February–20 April 2025) at the new ICOS POT station in Potenza, Italy, using a Picarro G2201-i CRDS analyzer are presented. POT is part of the CIAO (CNR IMAA Atmospheric Observatory) and integrates other measurements performed in the area. The data gathered at POT during the measurement period were evaluated to assess general tendencies during a period characterized by a winter-to-spring transition and provided the first insight into stable carbon isotope variability in the atmosphere from the developing cross-country consortium, which includes three more stations. These preliminary results constitute the first step towards a more coordinated measurement coordination effort within the consortium itself.
The preliminary results indicate that trends driven by changes in anthropogenic emissions and photosynthetic activity in the transition from low to high temperatures in a Mediterranean climate can be affected by rapid events, i.e., Saharan dust intrusions and their consequent effects on δ13C-CO2 and δ13C-CH4. δ13C-CH4 in particular showed abrupt changes that may be attributable to chemical reactions between sodium chloride and mineral dust and changes in atmospheric oxidation; these phenomena, which are currently under investigation, represent the first direct evidence of similar carbon fractionation processes in the area. Although a decrease in CH4 concentrations is observed from the beginning to the end of the measurements, the trend observed does not align with its usual seasonality. The data on CO2 mole fractions and δ13C-CO2 reveal a degree of variability consistent with the typical tendencies observed in the northern hemisphere.
Analyses of the daily and weekly cycles also provided insights on the balance between natural and anthropic influences. The daily cycles of CO2 and δ13C-CO2 show tendencies compatible with the effects of photosynthesis, which are expected to peak during the boreal summer season: specifically, lower CO2 concentrations are directly linked to higher δ13C-CO2 values during diurnal hours, a pattern consistent with photosynthesis. Weekly cycles do not show specific patterns with the exception of CO2 during April, thus indicating that changes in local anthropic activities across the course of a standard week do not have a tangible impact on local measurements at POT. Finally, a Keeling plot of CO2 allowed us to determine, during the transition from cold (February) to warm (April) months, that higher CO2 concentrations are almost entirely attributable to fossil fuel burning and related phenomena with a similar isotopic fingerprint. These results, although preliminary in nature, provide an initial foundation for the isotopic characterization of the site and the observational footprint of the station. A more comprehensive characterization of the Mediterranean’s isotopic footprint will be achieved by analyzing the relationship between isotopic compositions and meteorological parameters, such as wind speed and direction, to determine the origin and nature of the intercepted air masses and integrating the results obtained at this station with those from other stations within the national consortium, contributing to a deeper understanding of regional biogeochemical processes.

Author Contributions

Conceptualization, A.B., I.Z. and F.D.; methodology, A.B., I.Z. and F.D.; software, F.D., E.L. and C.C.; validation, A.B., I.Z. and F.D.; formal analysis, A.B., I.Z. and F.D.; investigation, A.B., I.Z., F.D., E.L., F.C. and T.L.; resources, D.A. and A.G.; data curation, M.V.; writing—original draft preparation, A.B., I.Z. and F.D.; writing—review and editing, A.B., I.Z., F.D., E.L., F.C., T.L., D.A., C.C., G.D.F., A.G., M.V., A.G.d.S., C.R.C., S.T. and L.M.; visualization, A.B., F.D., E.L. and C.C.; supervision, A.G.d.S., C.R.C., S.T. and L.M.; funding acquisition, G.D.F., S.T. and L.M. All authors have read and agreed to the published version of the manuscript.

Funding

This research was funded by MUR (Italian Ministry of University and Research) through PON “Ricerca e Innovazione 2014–2020” under the following projects: PRO ICOS MED “Potenziamento della Rete di Osservazione ICOS-Italia nel Mediterraneo”, contract PIR01_00019, CUP B85D18000340001 (7 June 2019–18 February 2022), PRO ICOS MED (Potenziamento della Rete di Osservazione ICOS-Italia nel Mediterraneo—Rafforzamento del capitale umano)—Avviso MUR D.D. n. 2595 del 24 December 2019 Piano Stralcio “Ricerca e Innovazione 2015–2017”, CIR01_00019, CUP B58I20000210001, ITINERIS, Italian Integrated Environmental Research Infrastructure System (IR0000032, D.D. n.130/2022—CUPB53C22002150006) Funded by EU—Next Generation EU PNRR—Mission 4—Component 2—Investment 3.1. Ordinary Fund for Research Institutions and Organizations (FOE), funded by the Italian Ministry of University and Research (D.M. n. 744, 8 October 2020).

Institutional Review Board Statement

Not applicable.

Informed Consent Statement

Not applicable.

Data Availability Statement

The dataset featuring 10 min aggregated blocks of stable carbon isotope data (d13CO2, d13CH4) and the respective mole fractions of CO2 and CH4 is available via the ITINERIS HUB: https://doi.org/10.71763/nv6c-ek15.

Acknowledgments

ICOS activities were supported by the Joint Research Unit “ICOS Italia”, funded by the Ministry of University and Researches, throughout CNR-DSSTTA and PRO–ICOS_MED Potenziamento della rete di osservazione ICOS-Italia nel Mediterraneo—“Rafforzamento del Capitale Umano” PIR01_00019/CIR01_00019. The authors would also like to acknowledge the efforts and contributions of the four anonymous reviewers who helped expand and improve the manuscript.

Conflicts of Interest

The authors declare no conflicts of interest.

References

  1. Craig, H. The geochemistry of the stable carbon isotopes. Geochim. Cosmochim. Acta 1953, 3, 53–92. [Google Scholar] [CrossRef]
  2. Coplen, T.B. Normalization of oxygen and hydrogen isotope data. Chem. Geol. Isot. Geosci. 1988, 72, 293–297. [Google Scholar] [CrossRef]
  3. Trumbore, S.E. Carbon respired by terrestrial ecosystems—Recent progress and challenges. Glob. Chang. Biol. 2006, 12, 141–153. [Google Scholar] [CrossRef]
  4. Etiope, G.; Lassey, K.R.; Klusman, R.W.; Boschi, E. Reappraisal of the fossil methane budget and related emission from geologic sources. Geophys. Res. Lett. 2008, 35, L09307. [Google Scholar] [CrossRef]
  5. He, Y.; Trumbore, S.E.; Torn, M.S.; Harden, J.W.; Vaughn, L.J.S.; Allison, S.D.; Randerson, J.T. Radiocarbon constraints imply reduced carbon uptake by soils during the 21st century. Science 2016, 353, 1419–1424. [Google Scholar] [CrossRef]
  6. Yu, M.-Y.; Lin, Y.-C.; Zhang, Y.-L. Estimation of Atmospheric Fossil Fuel CO2 Traced by Δ14C: Current Status and Outlook. Atmosphere 2022, 13, 2131. [Google Scholar] [CrossRef]
  7. Zazzeri, G.; Graven, H.; Xu, X.; Saboya, E.; Blyth, L.; Manning, A.J.; Chawner, H.; Wu, D.; Hammer, S. Radiocarbon Measurements Reveal Underestimated Fossil CH4 and CO2 Emissions in London. Geophys. Res. Lett. 2023, 50, e2023GL103834. [Google Scholar] [CrossRef]
  8. Morton, S.G. Synopsis of the organic remains of the Ferruginous Sand Formation of the United States, with geological remarks. Amer. J. Sci. Arts 1830, 18, 243–250. Available online: https://www.biodiversitylibrary.org/page/30953798 (accessed on 30 March 2025).
  9. d’Orbigny, A.D. Terrains Crétacés. [Cephalopoda]. In Paléontologie Française; L’Auteur: Paris, France, 1840; Volume 1, 662p, Available online: https://www.biodiversitylibrary.org/page/22587199 (accessed on 30 March 2025).
  10. Craig, H. Isotopic standards for carbon and oxygen and correction factors for mass-spectrometric analysis of carbon dioxide. Geochim. Cosmochim. Acta 1957, 12, 133–149. [Google Scholar] [CrossRef]
  11. Zazzeri, G.; Lowry, D.; Fisher, R.E.; France, J.L.; Lanoisellé, M.; Grimmond, C.S.B.; Nisbet, E.G. Evaluating methane inventories by isotopic analysis in the London region. Sci. Rep. 2017, 7, 4854. [Google Scholar] [CrossRef]
  12. Voglar, G.E.; Zavadlav, S.; Levanič, T.; Ferlan, M. Measuring techniques for concentration and stable isotopologues of CO2 in a terrestrial ecosystem: A review. Earth Sci. Rev. 2019, 199, 102978. [Google Scholar] [CrossRef]
  13. Bowling, D.R.; Pataki, D.E.; Randerson, J.T. Carbon isotopes in terrestrial ecosystem pools and CO2 fluxes. New Phytol. 2008, 178, 24–40. [Google Scholar] [CrossRef]
  14. Scartazza, A.; Moscatello, S.; Matteucci, G.; Battistelli, A.; Brugnoli, E. Combining stable isotope and carbohydrate analyses in phloem sap and fine roots to study seasonal changes of source-sink relationships in a Mediterranean beech forest. Tree Physiol. 2015, 35, 829–839. [Google Scholar] [CrossRef]
  15. Becker, M.; Steinhoff, T.; Körtzinger, A. A detailed view of the seasonality of stable carbon isotopes across the North Atlantic. Global Biogeochem. Cycles 2018, 32, 1406–1419. [Google Scholar] [CrossRef]
  16. Li, C.; Fan, R.; Jiang, W.; Zhang, H.; Li, X.; Chen, F.; Zhang, H. Inter- and Intra-Annual Variations in Oak Tree Ring δ13C Values across Different Elevations and Their Climatic Responses in Qinling Mountains. Atmosphere 2024, 15, 1228. [Google Scholar] [CrossRef]
  17. Des Marais, D.J.; Moore, J.G. Carbon and its isotopes in mid-oceanic basaltic glasses. Earth Planet. Sci. Lett. 1984, 69, 43–57. [Google Scholar] [CrossRef]
  18. Deines, P. The carbon isotope geochemistry of mantle xenoliths. Earth Sci. Rev. 2002, 58, 247–278. [Google Scholar] [CrossRef]
  19. Weissert, H.; Erba, E. Volcanism, CO2 and palaeoclimate: A Late Jurassic-Early Cretaceous carbon and oxygen isotope record. J. Geol. Soc. 2004, 161, 695–702. [Google Scholar] [CrossRef]
  20. Wan, Z.; Shi, Q.; Guo, F.; Zhong, Y.; Xia, B. Gases in Southern Junggar Basin mud volcanoes: Chemical composition, stable carbon isotopes, and gas origin. J. Nat. Gas Sci. Eng. 2013, 14, 108–115. [Google Scholar] [CrossRef]
  21. Werner, C.; Fischer, T.P.; Aiuppa, A.; Edmonds, M.; Cardellini, C.; Carn, S.; Chiodini, G.; Cottrell, E.; Burton, M.; Shinohara, H.; et al. Carbon dioxide emissions from subaerial volcanic regions. In Deep Carbon: Past to Present; Orcutt, B.N., Daniel, I., Dasgupta, R., Eds.; Cambridge University Press: Cambridge, UK, 2019; pp. 188–236. [Google Scholar] [CrossRef]
  22. Peng, Q.; E, C.; Li, X.; Sun, Y.; Zhang, J.; Zhang, S.; Shi, Y.; Ji, X.; Zhang, Z. Holocene Paleoclimate Changes around Qinghai Lake in the Northeastern Qinghai-Tibet Plateau: Insights from Isotope Geochemistry of Aeolian Sediment. Atmosphere 2024, 15, 833. [Google Scholar] [CrossRef]
  23. Bell, E.A.; Boehnke, P.; Harrison, T.M.; Mao, W.L. Potentially biogenic carbon preserved in a 4.1 billion-year-old zircon. Proc. Natl. Acad. Sci. USA 2015, 112, 14518–14521. [Google Scholar] [CrossRef]
  24. Graven, H.; Allison, C.E.; Etheridge, D.M.; Hammer, S.; Keeling, R.F.; Levin, I.; Meijer, H.A.J.; Rubino, M.; Tans, P.P.; Trudinger, C.M.; et al. Compiled records of carbon isotopes in atmospheric CO2 for historical simulations in CMIP6. Geosci. Model Dev. 2017, 10, 4405–4417. [Google Scholar] [CrossRef]
  25. Keeling, C.D.; Mook, W.G.; Tans, P.P. Recent trends in the 13C/12C ratio of atmospheric carbon dioxide. Nature 1979, 277, 121–123. [Google Scholar] [CrossRef]
  26. Sowers, T.; Bernard, S.; Aballain, O.; Chappellaz, J.; Barnola, J.-M.; Marik, T. Records of the δ13C of atmospheric CH4 over the last 2 centuries as recorded in Antarctic snow and ice. Global Biogeochem. Cycles 2005, 19, GB2002. [Google Scholar] [CrossRef]
  27. Cao, J.; Chow, J.C.; Tao, J.; Lee, S.; Watson, J.G.; Ho, K.; Wang, G.; Zhu, C.; Han, Y. Stable carbon isotopes in aerosols from Chinese cities: Influence of fossil fuels. Atmos. Environ. 2011, 45, 1359–1363. [Google Scholar] [CrossRef]
  28. Graven, H.; Keeling, R.F.; Rogelj, J. Changes to carbon isotopes in atmospheric CO2 over the Industrial Era and into the future. Global Biogeochem. Cycles 2020, 34, e2019GB006170. [Google Scholar] [CrossRef] [PubMed]
  29. Lopez, T.; Aguilera, F.; Tassi, F.; de Moor, J.M.; Bobrowski, N.; Aiuppa, A.; Tamburello, G.; Rizzo, A.L.; Liuzzo, M.; Viveiros, F.; et al. New insights into the magmatic-hydrothermal system and volatile budget of Lastarria volcano, Chile: Integrated results from the 2014 IAVCEI CCVG 12th Volcanic Gas Workshop. Geosphere 2018, 14, 983–1007. [Google Scholar] [CrossRef]
  30. Yang, W.; Magid, J.; Christensen, S.; Rønn, R.; Ambus, P.; Ekelund, F. Biological 12C-13C fractionation increases with increasing community-complexity in soil microcosms. Soil Biol. Biochem. 2014, 69, 197–201. [Google Scholar] [CrossRef]
  31. Philben, M.; Bowering, K.; Podrebarac, F.A.; Laganière, J.; Edwards, K.; Ziegler, S.E. Enrichment of 13C with depth in soil organic horizons is not explained by CO2 or DOC losses during decomposition. Geoderma 2022, 424, 116004. [Google Scholar] [CrossRef]
  32. Keeling, C.D. The concentration and isotopic abundances of carbon dioxide in rural and marine air. Geochim. Cosmochim. Acta 1961, 24, 277–298. [Google Scholar] [CrossRef]
  33. Kirschke, S.; Bousquet, P.; Ciais, P.; Saunois, M.; Canadell, J.G.; Dlugokencky, E.J.; Bergamaschi, P.; Bergmann, D.; Blake, D.R.; Bruhwiler, L.; et al. Three decades of global methane sources and sinks. Nature Geosci. 2013, 6, 813–823. [Google Scholar] [CrossRef]
  34. Andres, R.J.; Marland, G.; Boden, T.; Bischof, S. Carbon dioxide emissions from fossil fuel consumption and cement manufacture, 1751–1991, and an estimate of their isotopic composition and latitudinal distribution. In The Carbon Cycle; Wigley, T.M., Schimel, D.S., Eds.; Cambridge University Press: Cambridge, UK, 1991; pp. 53–62. [Google Scholar]
  35. Widory, D. Combustibles, fuels and their combustion products: A view through carbon isotopes. Combust. Theory Model. 2006, 10, 831–841. [Google Scholar] [CrossRef]
  36. Pataki, D.E.; Bowling, D.R.; Ehleringer, J.R. Seasonal cycle of carbon dioxide and its isotopic composition in an urban atmosphere: Anthropogenic and biogenic effects. J. Geophys. Res.—Atmos. 2003, 108, 4735. [Google Scholar] [CrossRef]
  37. Quirk, T.; Asten, M. Atmospheric CO2 Isotopic Variations, with Estimation of Ocean and Plant Source Contributions. Atmosphere 2023, 14, 1623. [Google Scholar] [CrossRef]
  38. Keeling, C.D.; Whorf, T.P.; Wahlen, M.; van der Plichtt, J. Interannual extremes in the rate of rise of atmospheric carbon dioxide since 1980. Nature 1995, 375, 666–670. [Google Scholar] [CrossRef]
  39. Ghasemifard, H.; Yuan, Y.; Luepke, M.; Schunk, C.; Chen, J.; Ries, L.; Leuchner, M.; Menzel, A. Atmospheric CO2 and δ13C Measurements from 2012 to 2014 at the Environmental Research Station Schneefernerhaus, Germany: Technical Corrections, Temporal Variations and Trajectory Clustering. Aerosol Air Qual. Res. 2019, 19, 657–670. [Google Scholar] [CrossRef]
  40. Bezyk, Y.; Górka, M.; Sówka, I.; Nęcki, J.; Strąpoć, D. Temporal dynamics and controlling factors of CO2 and CH4 variability in the urban atmosphere of Wroclaw, Poland. Sci. Total Environ. 2023, 893, 164771. [Google Scholar] [CrossRef]
  41. Bučinskas, L.; Garbarienė, I.; Mašalaitė, A.; Šapolaitė, J.; Ežerinskis, Ž.; Jasinevičienė, D.; Garbaras, A. Evaluating the Impact of Increased Heavy Oil Consumption on Urban Pollution Levels through Isotope (δ13C, δ34S, 14C) Composition. Atmosphere 2024, 15, 883. [Google Scholar] [CrossRef]
  42. Lopez, M.; Schmidt, M.; Delmotte, M.; Colomb, A.; Gros, V.; Janssen, C.; Lehman, S.J.; Mondelain, D.; Perrussel, O.; Ramonet, M.; et al. CO, NOx and 13CO2 as tracers for fossil fuel CO2: Results from a pilot study in Paris during winter 2010. Atmos. Chem. Phys. 2013, 13, 7343–7358. [Google Scholar] [CrossRef]
  43. Clark-Thorne, S.T.; Yapp, C.J. Stable carbon isotope constraints on mixing and mass balance of CO2 in an urban atmosphere: Dallas metropolitan area, Texas, USA. Appl. Geochem. 2003, 18, 75–95. [Google Scholar] [CrossRef]
  44. Widory, D.; Javoy, M. The carbon isotope composition of atmospheric CO2 in Paris. Earth Planet. Sci. Lett. 2003, 215, 289–298. [Google Scholar] [CrossRef]
  45. Horsfield, B.; Rullkötter, J. Diagenesis, Catagenesis, and Metagenesis of Organic Matter. In The Petroleum System—From Source to Trap; Magoon, L.B., Dow, W.G., Eds.; American Association of Petroleum Geologists: Tulsa, OK, USA, 1994; Volume 60. [Google Scholar] [CrossRef]
  46. Nisbet, E.G.; Dlugokencky, E.J.; Manning, M.R.; Lowry, D.; Fisher, R.E.; France, J.L.; Michel, S.E.; Miller, J.B.; White, J.W.C.; Vaughn, B.; et al. Rising atmospheric methane: 2007–2014 growth and isotopic shift. Global Biogeochem. Cycles 2016, 30, 1356–1370. [Google Scholar] [CrossRef]
  47. Nisbet, E.G.; Manning, M.R.; Dlugokencky, E.J.; Fisher, R.E.; Lowry, D.; Michel, S.E.; Lund Myhre, C.; Platt, S.M.; Allen, G.; Bousquet, P.; et al. Very strong atmospheric methane growth in the 4 years 2014–2017: Implications for the Paris Agreement. Global Biogeochem. Cycles 2019, 33, 318–342. [Google Scholar] [CrossRef]
  48. Fisher, R.E.; France, J.L.; Lowry, D.; Lanoisellé, M.; Brownlow, R.; Pyle, J.A.; Cain, M.; Warwick, N.; Skiba, U.M.; Drewer, J.; et al. Measurement of the 13C isotopic signature of methane emissions from northern European wetlands. Global Biogeochem. Cycles 2017, 31, 602–623. [Google Scholar] [CrossRef]
  49. Fujita, R.; Graven, H.; Zazzeri, G.; Hmiel, B.; Petrenko, V.V.; Smith, A.M.; Michel, S.E.; Morimoto, S. Global fossil methane emissions constrained by multi-isotopic atmospheric methane histories. J. Geophys. Res.-Atmos 2025, 130, e2024JD041266. [Google Scholar] [CrossRef]
  50. Wahlen, M.; Tanaka, N.; Henry, R.; Yoshinari, T. 13C, D and 14C in methane. Eos Trans. AGU 1987, 68, 1220. [Google Scholar]
  51. Neef, L.; van Weele, M.; van Velthoven, P. Optimal estimation of the present-day global methane budget. Global Biogeochem. Cycles 2010, 24, GB4024. [Google Scholar] [CrossRef]
  52. Monteil, G.; Houweling, S.; Dlugockenky, E.J.; Maenhout, G.; Vaughn, B.H.; White, J.W.C.; Rockmann, T. Interpreting methane variations in the past two decades using measurements of CH4 mixing ratio and isotopic composition. Atmos. Chem. Phys. 2011, 11, 9141–9153. [Google Scholar] [CrossRef]
  53. Chanton, J.P.; Rutkowski, C.M.; Schwartz, C.C.; Ward, D.E.; Boring, L. Factors influencing the stable carbon isotopic signature of methane from combustion and biomass burning. J. Geophys. Res. Atmos. 2000, 105, 1867–1877. [Google Scholar] [CrossRef]
  54. Allan, W.; Lowe, D.C.; Gomez, A.J.; Struthers, H.; Brailsford, G.W. Interannual variation of 13C in tropospheric methane: Implications for a possible atomic chlorine sink in the marine boundary layer. J. Geophys. Res.-Atmos 2005, 110, D11306. [Google Scholar] [CrossRef]
  55. Basu, S.; Lan, X.; Dlugokencky, E.; Michel, S.; Schwietzke, S.; Miller, J.B.; Bruhwiler, L.; Oh, Y.; Tans, P.P.; Apadula, F.; et al. Estimating emissions of methane consistent with atmospheric measurements of methane and δ13C of methane. Atmos. Chem. Phys. 2022, 22, 15351–15377. [Google Scholar] [CrossRef]
  56. Umezawa, T.; Machida, T.; Ishijima, K.; Matsueda, H.; Sawa, Y.; Patra, P.K.; Aoki, S.; Nakazawa, T. Carbon and hydrogen isotopic ratios of atmospheric methane in the upper troposphere over the Western Pacific. Atmos. Chem. Phys. 2012, 12, 8095–8113. [Google Scholar] [CrossRef]
  57. O’Malley, V.P.; Burke, R.A.; Schlotzhauer, W.S. Using GC-MS/Combustion/IRMS to determine the 13C/12C ratios of individual hydrocarbons produced from the combustion of biomass materials-application to biomass burning. Org. Geochem. 1997, 27, 567–581. [Google Scholar] [CrossRef]
  58. Tittel, F.K.; Weidmann, D.; Oppenheimer, C.; Gianfrani, L. Laser Absorption Spectroscopy for volcano monitoring. Opt. Photonics News 2006, 17, 24–31. [Google Scholar] [CrossRef]
  59. Fisher, R.E.; Lowry, D.; Wilkin, O.; Sriskantharajah, S.; Nisbet, E.G. High-precision, automated stable isotope analysis of atmospheric methane and carbon dioxide using continuous-flow isotope-ratio mass spectrometry. Rapid Commun. Mass Spectrom. 2006, 20, 200–208. [Google Scholar] [CrossRef]
  60. Cui, X.; Zhang, Z.; Pang, T.; Xia, H.; Sun, P.; Wu, B.; Yu, R. Development of a stable carbon isotopes analysis instrument based on tunable diode laser absorption spectroscopy. IOP Conf. Ser. Mater. Sci. Eng. 2020, 730, 012005. [Google Scholar] [CrossRef]
  61. Tuzson, B.; Mohn, J.; Zeeman, M.; Werner, R.A.; Eugster, W.; Zahniser, M.S.; Nelson, D.D.; McManus, J.B.; Emmenegger, L. High precision and continuous field measurements of δ13C and δ18O in carbon dioxide with a cryogen-free QCLAS. Appl. Phys. B 2008, 92, 451–458. [Google Scholar] [CrossRef]
  62. Eyer, S.; Tuzson, B.; Popa, M.E.; van der Veen, C.; Röckmann, T.; Rothe, M.; Brand, W.A.; Fisher, R.; Lowry, D.; Nisbet, E.G.; et al. Real-time analysis of δ13C- and δD-CH4 in ambient air with laser spectroscopy: Method development and first intercomparison results. Atmos. Meas. Tech. 2016, 9, 263–280. [Google Scholar] [CrossRef]
  63. Crosson, E.R.; Ricci, K.N.; Richman, B.A.; Chilese, F.C.; Owano, T.G.; Provencal, R.A.; Todd, M.W.; Glasser, J.; Kachanov, A.A.; Paldus, B.A.; et al. Stable isotope ratios using cavity ring-down spectroscopy: Determination of 13C/12C for carbon dioxide in human breath. Anal. Chem. 2002, 74, 2003–2007. [Google Scholar] [CrossRef]
  64. Maher, D.T.; Santos, I.R.; Tait, D.R. Mapping methane and carbon dioxide concentrations and δ13C values in the atmosphere of two Australian coal seam gas fields. Water Air Soil. Pollut. 2014, 225, 2216. [Google Scholar] [CrossRef]
  65. Rella, C.W.; Hoffnagle, J.; He, Y.; Tajima, S. Local- and regional-scale measurements of CH4, δ13CH4, and C2H6 in the Uintah Basin using a mobile stable isotope analyzer. Atmos. Meas. Tech. 2015, 8, 4539–4559. [Google Scholar] [CrossRef]
  66. Dickinson, D.; Bodé, S.; Boeckx, P. System for δ13C-CO2 and xCO2 analysis of discrete gas samples by cavity ring-down spectroscopy. Atmos. Meas. Tech. 2017, 10, 4507–4519. [Google Scholar] [CrossRef]
  67. Sprenger, M.; Tetzlaff, D.; Soulsby, C. No influence of CO2 on stable isotope analyses of soil waters with off-axis integrated cavity output spectroscopy (OA-ICOS). Rapid Commun. Mass Spectrom. 2017, 31, 430–436. [Google Scholar] [CrossRef] [PubMed]
  68. Griffith, D.W.T.; Deutscher, N.M.; Caldow, C.; Kettlewell, G.; Riggenbach, M.; Hammer, S. A Fourier transform infrared trace gas and isotope analyser for atmospheric applications. Atmos. Meas. Tech. 2012, 5, 2481–2498. [Google Scholar] [CrossRef]
  69. Rizzo, A.L.; Liuzzo, M.; Ancellin, M.A.; Jost, H.J. Real-time measurements of δ13C, CO2 concentration, and CO2/SO2 in volcanic plume gases at Mount Etna, Italy, over 5 consecutive days. Chem. Geol. 2015, 411, 182–191. [Google Scholar] [CrossRef]
  70. Lapenna, E.; Buono, A.; Mauceri, A.; Zaccardo, I.; Cardellicchio, F.; D’Amico, F.; Laurita, T.; Amodio, D.; Colangelo, C.; Di Fiore, G.; et al. ICOS Potenza (Italy) atmospheric station: A new spot for the observation of greenhouse gases in the Mediterranean basin. Atmosphere 2025, 16, 57. [Google Scholar] [CrossRef]
  71. Villalobos, Y.; Gómez-Ortiz, C.; Scholze, M.; Monteil, G.; Karstens, U.; Fiore, A.; Brunner, D.; Thanwerdas, J.; Cristofanelli, P. Towards improving top-down national CO2 estimation in Europe: Potential from expanding the ICOS atmospheric network in Italy. Environ. Res. Lett. 2025, 20, 054002. [Google Scholar] [CrossRef]
  72. Keeling, C.D. The concentration and isotopic abundances of atmospheric carbon dioxide in rural areas. Geochim. Cosmochim. Acta 1958, 13, 322–334. [Google Scholar] [CrossRef]
  73. Calidonna, C.R.; D’Amico, F.; Ammoscato, I.; Malacaria, L.; Gulli, D.; Lo Feudo, T.; Sinopoli, S.; De Benedetto, G.; Mona, L.; Dema, C.; et al. Continuous δ13C-CO2 and δ13C-CH4 Measurements in the Atmosphere—Data Gathered at Lamezia Terme (Calabria, Southern Italy) Between July and December 2024. Version 1. Available online: https://hub.itineris.cnr.it/datasets/ (accessed on 30 March 2025).
  74. National Research Council of Italy—Institute of Methodologies for Environmental Analysis. CNR-IMAA Atmospheric Observatory (CIAO). Available online: https://ciao.imaa.cnr.it (accessed on 31 May 2025).
  75. Laurita, T.; Mauceri, A.; Cardellicchio, F.; Lapenna, E.; De Rosa, B.; Trippetta, S.; Mytilinaios, M.; Amodio, D.; Giunta, A.; Ripepi, E.; et al. CIAO observatory main upgrade: Building up an ACTRIS compliant aerosol in-situ laboratory. Atmos. Meas. Tech. 2025, 18, 2373–2396. [Google Scholar] [CrossRef]
  76. Heiskanen, J.; Brümmer, C.; Buchmann, N.; Calfapietra, C.; Chen, H.; Gielen, B.; Gkritzalis, T.; Hammer, S.; Hartman, S.; Herbst, M.; et al. The Integrated Carbon Observation System in Europe. Bull. Am. Meterol. Soc. 2022, 103, E855–E872. [Google Scholar] [CrossRef]
  77. Laj, P.; Myhre, C.L.; Riffault, V.; Amiridis, V.; Fuchs, H.; Eleftheriadis, K.; Petäjä, T.; Salameh, T.; Kivekäs, N.; Juurola, E.; et al. Aerosol, Clouds and Trace Gases Infrastructure (ACTRIS); The European Research Infrastructure Supporting Atmospheric Science. B. Am. Meteor. Soc. 2024, 105, E1098–E1136. [Google Scholar] [CrossRef]
  78. Adame, J.A.; Padilla, R.; Gutierrez-Alvarez, I.; Bogeat, J.A.; Lopez, A.; Yela, M. Greenhouse gases in the tall tower of El Arenosillo station in Southwestern Europe: First-year of measurements. Atmos. Res. 2024, 299, 107221. [Google Scholar] [CrossRef]
  79. Röckmann, T.; Eyer, S.; van der Veen, C.; Popa, M.E.; Tuzson, B.; Monteil, G.; Houweling, S.; Harris, E.; Brunner, D.; Fischer, H.; et al. In situ observations of the isotopic composition of methane at the Cabauw tall tower site. Atmos. Chem. Phys. 2016, 16, 10469–10487. [Google Scholar] [CrossRef]
  80. Storm, I. ICOS Atmospheric Stations: Spatial Characterization of CO2 Footprint Areas and Evaluating the Uncertainties of Modelled CO2 Concentrations. Master’s Thesis, Lund University, Lund, Sweden, 2020. [Google Scholar]
  81. Storm, I.; Karstens, U.; D’Onofrio, C.; Vermeulen, A.; Peters, W. A view of the European carbon flux landscape through the lens of the ICOS atmospheric observation network. Atmos. Chem. Phys. 2023, 23, 4993–5008. [Google Scholar] [CrossRef]
  82. Buono, A.; Zaccardo, I.; D’Amico, F.; Mona, L.; Ripepi, E.; Dema, C. Continuous δ13C-CO2 and δ13C-CH4 measurements in the atmosphere—Data gathered at Potenza (Basilicata, Southern Italy) in 2025. Version 1 . Available online: https://hub.itineris.cnr.it/datasets/ (accessed on 25 June 2025).
  83. Hoheisel, A.; Yeman, C.; Dinger, F.; Eckhardt, H.; Schmidt, M. An improved method for mobile characterisation of δ13CH4 source signatures and its application in Germany. Atmos. Meas. Tech. 2019, 12, 1123–1139. [Google Scholar] [CrossRef]
  84. Picarro. G2201-i Analyzer User Manual for Isotopic CO2/CH4. Available online: https://www.picarro.com/environmental/g2201i_analyzer_user_manual_for_isotopic_CO2_CH4 (accessed on 5 February 2025).
  85. Altman, D.G.; Bland, J.M. Measurement in Medicine: The Analysis of Method Comparison Studies. J. R. Stat. Soc. D 1983, 32, 307–317. [Google Scholar] [CrossRef]
  86. Bland, J.M.; Altman, D.G. Statistical methods for assessing agreement between two methods of clinical measurement. Lancet 1986, 327, 307–310. [Google Scholar] [CrossRef]
  87. Datta, D. blandr: Bland-Altman Method Comparison Package for R, version 0.6.0; Zenodo: Geneva, Switzerland, 2024. [Google Scholar] [CrossRef]
  88. International Atomic Energy Agency (IAEA). IAEA-TECDOC-2066—Measurement of the Stable Carbon Isotope Ratio in Atmospheric CH4 Using Laser Spectroscopy for CH4 Source Characterization; IAEA: Vienna, Austria, 2024. [Google Scholar] [CrossRef]
  89. D’Amico, F.; Ammoscato, I.; Gullì, D.; Avolio, E.; Lo Feudo, T.; De Pino, M.; Cristofanelli, P.; Malacaria, L.; Parise, D.; Sinopoli, S.; et al. Integrated analysis of methane cycles and trends at the WMO/GAW station of Lamezia Terme (Calabria, Southern Italy). Atmosphere 2024, 15, 946. [Google Scholar] [CrossRef]
  90. D’Amico, F.; Ammoscato, I.; Gullì, D.; Avolio, E.; Lo Feudo, T.; De Pino, M.; Cristofanelli, P.; Malacaria, L.; Parise, D.; Sinopoli, S.; et al. Anthropic-induced variability of greenhouse gasses and aerosols at the WMO/GAW coastal site of Lamezia Terme (Calabria, Southern Italy): Towards a new method to assess the weekly distribution of gathered data. Sustainability 2024, 16, 8175. [Google Scholar] [CrossRef]
  91. Belikov, D.; Arshinov, M.; Belan, B.; Davydov, D.; Fofonov, A.; Sasakawa, M.; Machida, T. Analysis of the Diurnal, Weekly, and Seasonal Cycles and Annual Trends in Atmospheric CO2 and CH4 at Tower Network in Siberia from 2005 to 2016. Atmosphere 2019, 10, 689. [Google Scholar] [CrossRef]
  92. Peccarrisi, D.; Romano, S.; Fragola, M.; Buccolieri, A.; Quarta, G.; Calcagnile, L. New insights from seasonal and weekly evolutions of aerosol absorption properties and their association with PM2.5 and NO2 concentrations at a central Mediterranean site. Atmos. Pollut. Res. 2024, 15, 102131. [Google Scholar] [CrossRef]
  93. Kruskal, W.H.; Wallis, W.A. Use of Ranks in One-Criterion Variance Analysis. J. Am. Stat. Assoc. 1952, 47, 583–621. [Google Scholar] [CrossRef]
  94. Shapiro, S.S.; Wilk, M.B. An Analysis of Variance Test for Normality (Complete Samples). Biometrika 1965, 52, 591–611. [Google Scholar] [CrossRef]
  95. Hoheisel, A.; Schmidt, M. Six years of continuous carbon isotope composition measurements of methane in Heidelberg (Germany)—A study of source contributions and comparison to emission inventories. Atmos. Chem. Phys. 2024, 24, 2951–2969. [Google Scholar] [CrossRef]
  96. Nisbet, E.G.; Fisher, R.E.; Lowry, D.; France, J.L.; Allen, G.; Bakkaloglu, S.; Broderick, T.J.; Cain, M.; Coleman, M.; Fernandez, J.; et al. Methane mitigation: Methods to reduce emissions, on the path to the Paris Agreement. Rev. Geophys. 2020, 58, e2019RG000675. [Google Scholar] [CrossRef]
  97. Tyler, S.C.; Ajie, H.O.; Gupta, M.L.; Cicerone, R.J.; Blake, D.R.; Dlugokencky, E.J. Stable carbon isotopic composition of atmospheric methane: A comparison of surface level and free tropospheric air. J. Geophys. Res.-Atmos 1999, 104, 13895–13910. [Google Scholar] [CrossRef]
  98. Zaccardo, I.; Buono, A.; D’Amico, F.; Laurita, T.; Amodio, D.; Cardellicchio, F.; Colangelo, C.; De Rosa, B.; Di Fiore, G.; Gargano, G.; et al. Stable carbon isotope shifts in CO2 and CH4 during Saharan dust intrusions: Insights from CIAO observatory, Southern Italy. Under review.
  99. Copernicus Aerosol Alerts. Available online: https://aerosol-alerts.atmosphere.copernicus.eu/?date=2025-03-15&lat=16.028464282037497&lon=16.611328125&parameter=od550dust&coords=[[40.41,15.3],[40.82,15.3],[40.82,16.41],[40.41,16.41]]&zoom=4&height=9776000&base_layer=none&overlays=null&view=2d (accessed on 30 March 2025).
  100. Berezina, E.; Vasileva, A.; Moiseenko, K.; Pankratova, N.; Skorokhod, A.; Belikov, I.; Belousov, V. Atmospheric CH4 and Its Isotopic Composition (δ13C) in Urban Environment in the Example of Moscow, Russia. Atmosphere 2023, 14, 830. [Google Scholar] [CrossRef]
  101. Lin, X.; Peng, S.; Ciais, P.; Hauglustaine, D.; Lan, X.; Liu, G.; Ramonet, M.; Xi, Y.; Yin, Y.; Zhang, Z.; et al. Recent methane surges reveal heightened emissions from tropical inundated areas. Nat. Commun. 2024, 15, 10894. [Google Scholar] [CrossRef] [PubMed]
  102. Saueressig, G.; Bergamaschi, P.; Crowley, J.N.; Fischer, H.; Harris, G.W. Carbon kinetic isotope effect in the reaction of CH4 with Cl atoms. J. Geophys. Res.-Atmos. 1995, 22, 1225–1228. [Google Scholar] [CrossRef]
  103. Lan, X.; Nisbet, E.G.; Dlugokencky, E.J.; Michel, S.E. Improved Constraints on Global Methane Emissions and Sinks Using δ13C-CH4. J. Geophys. Res.-Atmos. 2021, 35, e2021GB007000. [Google Scholar] [CrossRef]
  104. van Herpen, M.M.J.W.; Li, Q.; Saiz-Lopez, A.; Liisberg, J.B.; Röckmann, T.; Cuevas, C.A.; Fernandez, R.P.; Mak, J.E.; Mahowald, N.M.; Hess, P.; et al. Photocatalytic chlorine atom production on mineral dust–sea spray aerosols over the North Atlantic. Proc. Natl. Acad. Sci. USA 2023, 120, e2303974120. [Google Scholar] [CrossRef]
  105. Arimoto, R. Eolian dust and climate: Relationships to sources, tropospheric chemistry, transport and deposition. Earth Sci. Rev. 2001, 54, 29–42. [Google Scholar] [CrossRef]
  106. Bergamaschi, P.; Brühl, C.; Brenninkmeijer, C.A.M.; Saueressig, G.; Crowley, J.N.; Grooß, J.U.; Fischer, H.; Crutzen, P.J. Implications of the large carbon kinetic isotope effect in the reaction CH4 + Cl for the 13C/12C ratio of stratospheric CH4. Geophys. Res. Lett. 1996, 23, 2227–2230. [Google Scholar] [CrossRef]
  107. Tyler, S.C.; Ajie, H.O.; Rice, A.L.; Cicerone, R.J.; Tuazon, E.C. Experimentally determined kinetic isotope effects in the reaction of CH4 with Cl: Implications for atmospheric CH4. Geophys. Res. Lett. 2000, 27, 1715–1718. [Google Scholar] [CrossRef]
  108. Artuso, F.; Chamard, P.; Piacentino, S.; di Sarra, A.G.; Meloni, D.; Monteleone, F.; Sferlazzo, D.M.; Thiery, F. Atmospheric methane in the Mediterranean: Analysis of measurements at the island of Lampedusa during 1995–2005. Atmos. Environ. 2007, 41, 3877–3888. [Google Scholar] [CrossRef]
  109. D’Amico, F.; Lo Feudo, T.; Gullì, D.; Ammoscato, I.; De Pino, M.; Malacaria, L.; Sinopoli, S.; De Benedetto, G.; Calidonna, C.R. Investigation of carbon monoxide, carbon dioxide, and methane source variability at the WMO/GAW station of Lamezia Terme (Calabria, Southern Italy) using the ratio of ozone to nitrogen oxides as a proximity indicator. Atmosphere 2025, 16, 251. [Google Scholar] [CrossRef]
  110. Ghasemifard, H.; Vogel, F.R.; Yuan, Y.; Luepke, M.; Chen, J.; Ries, L.; Leuchner, M.; Schunk, C.; Noreen Vardag, S.; Menzel, A. Pollution Events at the High-Altitude Mountain Site Zugspitze-Schneefernerhaus (2670 m a.s.l.), Germany. Atmosphere 2019, 10, 330. [Google Scholar] [CrossRef]
  111. He, L.; Rosa, L.; Lobell, D.B.; Wang, Y.; Yin, Y.; Doughty, R.; Yao, Y.; Berry, J.A.; Frankenberg, C. The weekly cycle of photosynthesis in Europe reveals the negative impact of particulate pollution on ecosystem productivity. Proc. Natl. Acad. Sci. USA 2023, 120, e2306507120. [Google Scholar] [CrossRef]
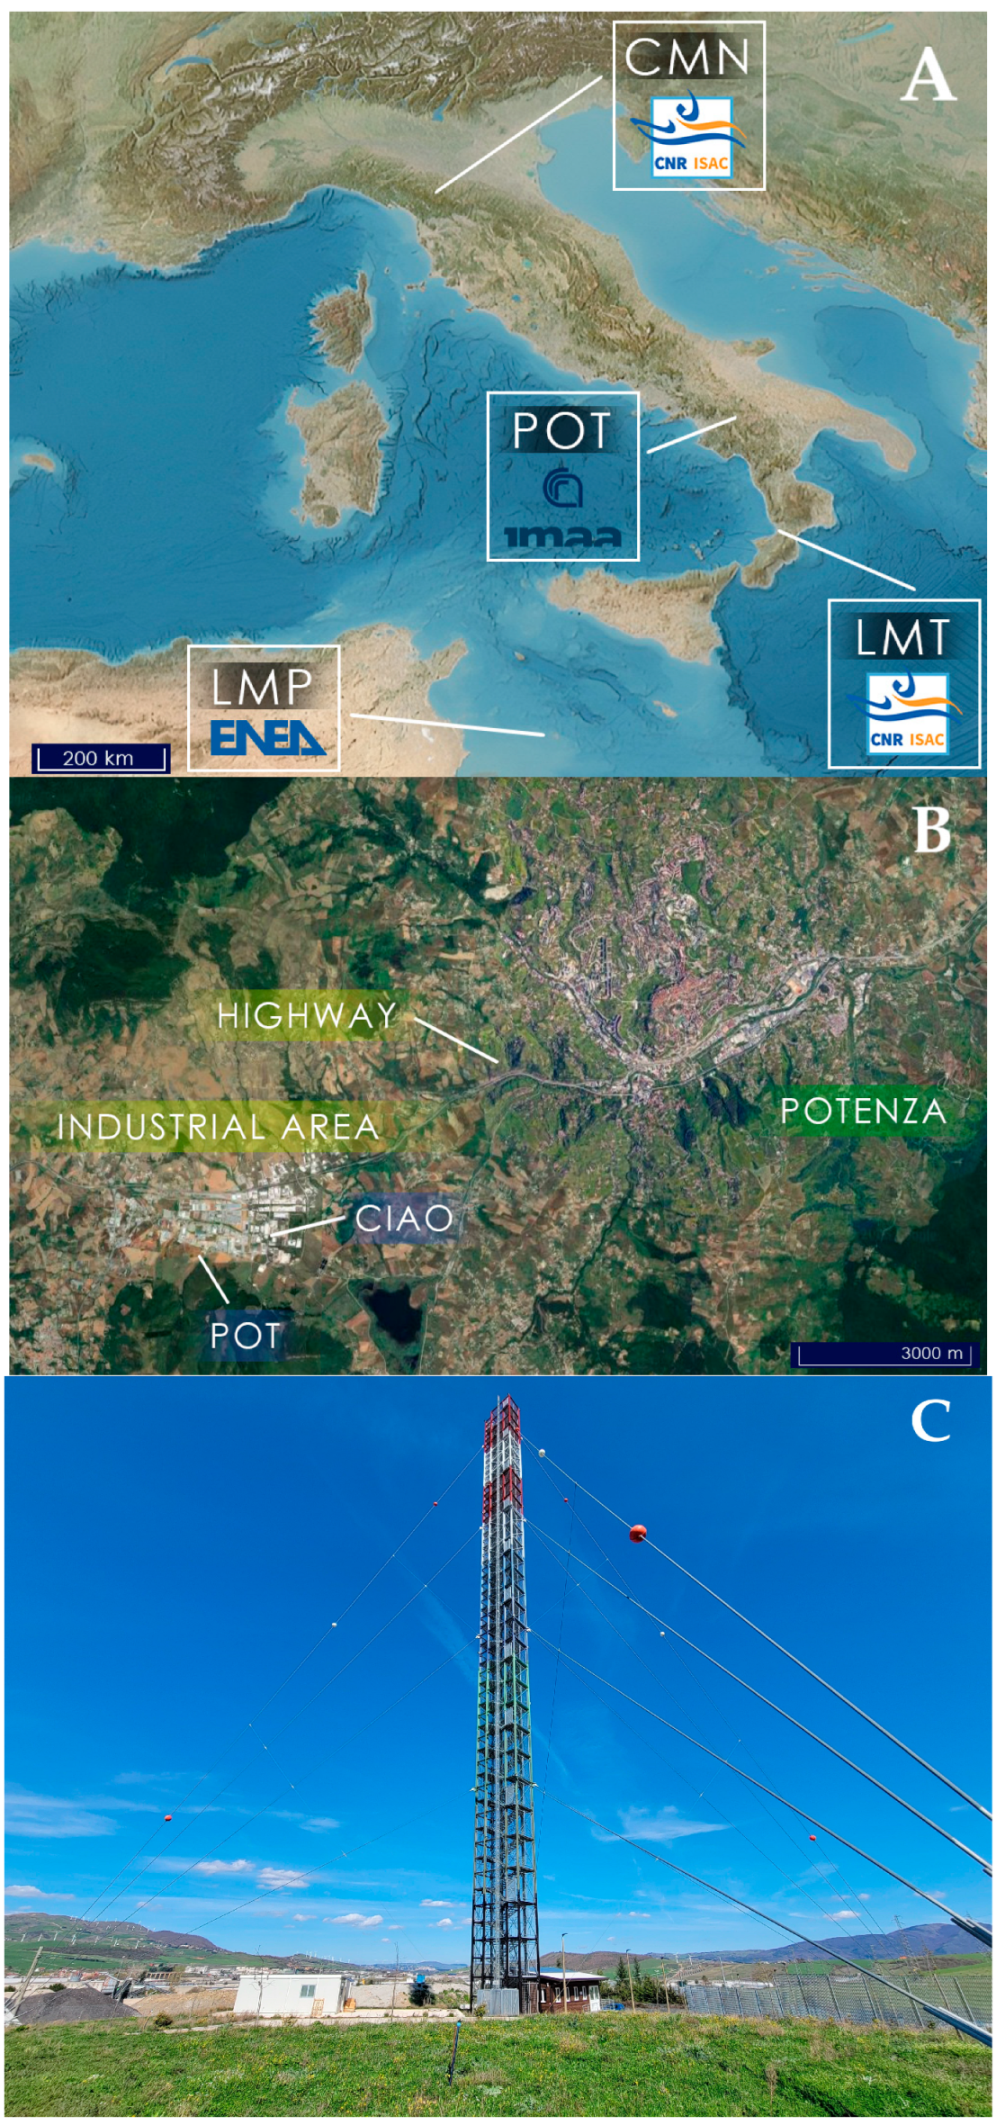
Figure 1. (A) A Map of Italy showing the general outline of the cross-country consortium of atmospheric observation sites performing continuous carbon isotope measurements. (B) Focus on the area where POT is located with respect to the regional capital of Potenza and nearby infrastructures. (C) A side view of the tower.
Atmosphere 16 00951 g001
Figure 2. Graphical results of the Bland & Altman method applied to (A) CO2 and (B) CH4 measurements performed at POT by Picarro G2201-i and G2401 CRDS analyzers. The x axes show the means of both measurements, while the y axes indicate their differences. The central blue band indicates the bias of measurements, while the green and red bands indicate the upper and lower boundaries of the confidence level.
Atmosphere 16 00951 g002
Figure 3. Variability in (A) CO2 and (B) CH4 during the measurement period (20 February–20 April 2025). Yellow lines indicate a moving average of 36 h. Saharan dust intrusion events occurred on 10–14, 16–18, and 22–24 March.
Atmosphere 16 00951 g003
Figure 4. Variability in (A) δ13C-CO2 and (B) δ13C-CH4 during the measurement period (20 February–20 April 2025). Yellow lines indicate a moving average of 36 h. Saharan dust intrusion events occurred on 10–14, 16–18, and 22–24 March.
Atmosphere 16 00951 g004
Figure 5. Daily cycles of (A) CO2 and (B) CH4 during the measurement period (20 February–20 April 2025). The larger dots indicate hourly averaged data, while the smaller ones refer to 10 min blocks.
Atmosphere 16 00951 g005
Figure 6. Daily cycles of (A) δ13C-CO2 and (B) δ13C-CH4 during the measurement period (20 February–20 April 2025). The larger dots indicate hourly averaged data, while the smaller ones refer to 10 min blocks.
Atmosphere 16 00951 g006
Figure 7. Weekly cycles (MON-SUN) of (A) CO2 and (B) CH4 during the measurement period (1 March–20 April 2025).
Atmosphere 16 00951 g007
Figure 8. Weekly cycles (MON-SUN) of (A) δ13C-CO2 and (B) δ13C-CH4 during the measurement period (1 March–20 April 2025).
Atmosphere 16 00951 g008
Figure 9. Keeling plot of δ13C-CO2, also featuring regression equation statistics, based on 10 min blocks. Intercepts indicate the isotopic fingerprint of emission sources.
Atmosphere 16 00951 g009
Table 1. Statistical results of the Bland & Altman method applied to G2201-i and G2401 measurements of CO2 and CH4 at POT station.
StatisticsCO2CH4
Max. Means446.362.08
Min. Means420.451.96
Max. Difference35.630.13
Min. Difference−16.21−0.08
Bias1.71−0.00 (5)
Bias std. dev.3.200.00 (9)
Bias up 95% CI1.93−0.00 (4)
Bias low 95% CI1.48−0.00 (5)
Table 2. Average concentrations (ppm) and isotopic deltas (‰) of CO2 and CH4 during the study period, aggregated on a monthly basis with their respective standard deviation intervals (±1σ).
MonthCO2CH4
Conc. (ppm)δ13C (‰)Conc. (ppm)δ13C (‰)
February435.65 ± 5.58−7.11 ± 0.392.03 ± 0.02−48.11 ± 0.47
March431.53 ± 3.91−6.56 ± 0.442.02 ± 0.02−47.36 ± 1.06
April429.82 ± 3.47−5.54 ± 0.222.02 ± 0.02−48.55 ± 1.00
Disclaimer/Publisher’s Note: The statements, opinions and data contained in all publications are solely those of the individual author(s) and contributor(s) and not of MDPI and/or the editor(s). MDPI and/or the editor(s) disclaim responsibility for any injury to people or property resulting from any ideas, methods, instructions or products referred to in the content.