Article

Global Land Monsoon Area Response to Natural Forcing Drivers over the Last Millennium in a Community Earth System Model Ensemble

1
Zhejiang Key Laboratory of Digital Intelligence Monitoring and Restoration of Watershed Environment, Zhejiang Normal University, Jinhua 321004, China
2
China-Mozambique “Belt and Road” Joint Laboratory on Smart Agriculture, Zhejiang Normal University, Jinhua 321004, China
3
College of Geography and Environmental Sciences, Zhejiang Normal University, Jinhua 321004, China
*
Author to whom correspondence should be addressed.
Atmosphere 2025, 16(8), 952; https://doi.org/10.3390/atmos16080952
Submission received: 27 June 2025 / Revised: 27 July 2025 / Accepted: 7 August 2025 / Published: 9 August 2025
(This article belongs to the Section Climatology)

Abstract

The spatial extent of the global land monsoon (GLM), known as the global land monsoon area, is a fundamental climate characteristic with significant socio-ecological implications. While the influence of natural external forcing on GLM intensity during the last millennium (950–1850) is becoming increasingly understood, the responses of the GLM area remain less explored. This study investigates the forced interdecadal variability in the GLM area using the Community Earth System Model Ensemble, focusing on two key drivers: global mean surface temperature (GMST) changes and variations in the tropical Pacific temperature gradient (TPTG). Our analysis reveals that these drivers explain approximately 33% of forced GLM area variance. Global cooling (Cool-GMST) and weakened Pacific gradients (Weak-TPTG) induce significant area contractions of −0.37% and −0.74%, respectively. Most notably, the response to compound forcing is highly non-linear. Concurrent episodes of strong cooling and Weak-TPTG induce a substantially amplified GLM area reduction of −1.37%, far exceeding the linear sum of the individual driver effects. This non-linear amplification, driven by synergistic decreases in both APR and SPF, challenges the conventional assumptions used to model and attribute monsoon boundary changes. This discovery of a non-linear threshold-dependent behavior in the monsoon’s spatial extent, which contrasts with the more linear response of monsoon intensity, is a key finding of our study. This distinction is critical for interpreting paleoclimate records, and serves as a strong indication that future climate projections must account for such non-linearities to avoid underestimating the risk of abrupt monsoon boundary shifts under combined natural and anthropogenic stressors.

1. Introduction

The geographical extent of the global land monsoon (GLM), a critical determinant of water resources and ecological stability for billions of people [1,2], is not static. While variations in monsoon intensity have received considerable attention, the dynamics governing shifts in the area itself, particularly in response to past natural climate forcings, remain a significant knowledge gap. This distinction is crucial, as emerging evidence suggests that monsoon area and intensity can exhibit divergent responses to climatic drivers [3], underscoring the need for a dedicated focus on the spatial dimension of monsoon variability.
To comprehend the variability in the GLM system, it is essential to scrutinize the influence of dominant large-scale climate drivers on both its intensity and spatial extent. Observations reveal a complex tapestry of recent GLM changes, including fluctuations in intensity and shifts in regional monsoon boundaries, occurring against a backdrop of rising global mean surface temperature (GMST) and pervasive El Niño–Southern Oscillation (ENSO) activity, which is intrinsically linked to variations in the tropical Pacific temperature gradient (TPTG) [4,5,6,7,8,9]. Indeed, GMST and TPTG are widely recognized as primary modulators of monsoon climate. GMST changes directly influence the hydrological cycle, atmospheric moisture capacity, and large-scale thermal contrasts crucial for monsoon development [10,11,12,13]. Simultaneously, alterations in the TPTG, reflecting shifts in tropical Pacific Walker circulation, exert profound and spatially complex impacts on regional monsoon precipitation and atmospheric teleconnections globally [14,15,16,17,18]. Consequently, understanding the individual and combined influences of GMST and TPTG is fundamental to deciphering changes in both the intensity and the geographical area of the GLM.
While the fundamental roles of GMST and TPTG in modulating monsoon characteristics are recognized, rigorously isolating their distinct impacts and interactions, particularly for the GLM area, presents considerable challenges in the contemporary era. Modern climate change involves the complex interplay of these natural drivers with escalating anthropogenic forcings, such as greenhouse gas emissions and aerosol loading, which themselves exert significant and often confounding influences on monsoon systems [19,20,21,22]. This intricate web of interactions makes it difficult to cleanly attribute GLM area changes solely to variations in GMST or TPTG.
To circumvent these complexities and better isolate the responses to natural drivers, paleoclimatology offers invaluable insights. The last millennium (850–1850), predating significant industrial-era anthropogenic disturbances, serves as a crucial natural laboratory. This period was characterized by substantial natural external forcing variability, primarily driven by recurrent volcanic eruptions that induced notable global cooling episodes (negative GMST anomalies) alongside fluctuations in solar irradiance [23,24,25,26]. Intriguingly, major volcanic events during the last millennium were often not only associated with direct global cooling, but are also implicated in subsequently triggering El Niño-like states, characterized by a weakened TPTG, through complex ocean–atmosphere feedback [27,28,29,30]. Thus, the last millennium provides a unique setting to investigate how monsoon systems responded to significant, naturally driven variations in both GMST and TPTG, often acting in concert. Existing research on last-millennium monsoons, often leveraging these volcanically induced climate shifts, has indeed significant documented impacts on regional monsoon intensity and precipitation patterns. For example, cooling following large volcanic eruptions has been linked to weakened summer monsoons over most monsoon regions through thermodynamics, while ENSO-like variability has influenced regional monsoon performance through teleconnections [31,32,33,34,35,36,37]. However, these foundational studies have predominantly focused on monsoon intensity or regional rainfall anomalies. In contrast, the response of the monsoon’s spatial area remains less explored. Specifically, a comprehensive understanding of how the sensitivities and mechanisms governing the GLM’s boundary shifts might differ from those controlling its intensity, particularly in response to GMST and TPTG, remains a significant research gap.
Our recent investigations have begun to bridge this gap by establishing, within the CESM-LME framework for the last millennium, that GMST and TPTG changes served as crucial mediators translating natural external forcing signals (dominated by volcanic eruptions) into the leading mode of forced interdecadal variability in GLM intensity [38]. Furthermore, we have elucidated the distinct physical mechanisms involved, linking cooling-driven GMST changes primarily to thermodynamic pathways that suppress seasonal precipitation, as well as linking TPTG variations predominantly to dynamic adjustments that alter seasonal precipitation patterns [39]. While these foundational studies have significantly advanced our understanding of GLM intensity, the response of the monsoon’s spatial area remains a significant knowledge gap. It is unclear whether the mechanisms and sensitivities governing the vast spatial extent of the monsoon are the same as those controlling its intensity. Furthermore, whether the monsoon area responds linearly to the superposition of multiple climate drivers—a common assumption—has not been rigorously tested in a paleoclimate context. This study aims to address these specific gaps. The primary novelty of our work lies in (1) providing a dedicated mechanistic analysis of GLM area response to key natural drivers, (2) demonstrating the decoupled and distinct sensitivities of monsoon area versus intensity, and (3) revealing a strong non-linear amplification in the area’s response to compound forcing, which contrasts with the largely linear behavior of monsoon intensity [38]. Building upon this foundation, the present study aims to specifically dissect the response of the GLM area during the last millennium by addressing three central questions: (1) To what extent do GMST and TPTG explain the forced interdecadal variability in the GLM area? (2) Are the sensitivity and response mechanisms of the GLM area fundamentally decoupled from those of GLM intensity? (3) Does the GLM area’s response to concurrent, strong forcing follow a simple linear superposition, or does it exhibit non-linear amplification, and what are the underlying physical pathways that govern this behavior? Answering these questions is vital for a comprehensive understanding of monsoon dynamics under natural forcing, and provides an essential baseline for interpreting past and future monsoon changes. The remainder of this paper is organized as follows: Section 2 describes the model data and the methodology. The main results are presented in Section 3. A discussion of the findings is provided in Section 4, and Section 5 summarizes our conclusions.

2. Materials and Methods

2.1. Model Data

This study utilizes output from the Community Earth System Model Last Millennium Ensemble (CESM-LME) project [40]. We analyze the 13-member ensemble simulations (all-forcing runs) covering the period 850–1850, driven by reconstructed natural and anthropogenic forcings (solar irradiance, volcanic aerosols, greenhouse gases, land use/land cover change, orbital parameters). Each member was initiated with perturbed atmospheric temperature conditions to sample internal climate variability. The model version is CESM1.1, incorporating CAM5 (atmosphere), CLM4 (land), and POP2 (ocean), with horizontal resolutions of approximately 2.5° × 1.875° for atmosphere/land and 1° nominal for ocean. Consistent with our previous studies [38,39], we primarily focus on the 13-member ensemble mean to isolate the externally forced climate response, although individual member results are discussed where relevant to internal variability. The CESM-LME’s ability to simulate key aspects of last millennium climate and monsoon characteristics has been extensively evaluated (e.g., [32,40,41]). A detailed evaluation of this model’s performance in simulating the global monsoon climatology, including its strengths (e.g., realistic representations of the annual cycle and monsoon domain) and known biases (e.g., the double-ITCZ), is provided in our foundational study [38]. That work confirmed that the model is well-suited for investigating the large-scale forced responses analyzed here. Therefore, to avoid redundancy, we refer readers to that publication for the detailed model validation.

2.2. Definition of Global Land Monsoon Area

The GLM domain is defined following the widely used criteria based on the precipitation characteristics established by Wang and Ding (2008) and Liu et al. (2012) [7,42]. These foundational studies provided physical justification and conducted sensitivity tests, demonstrating that these specific thresholds robustly delineate the global monsoon domain from other climate regimes. By adopting this standard definition, we ensure that our results are comparable with the extensive body of literature on this topic. Applied to gridded monthly precipitation data, a land grid cell is identified as part of the GLM domain if two conditions are met simultaneously: (1) The annual precipitation range (APR), defined as the local summer mean precipitation minus the local winter mean precipitation, exceeds a threshold of 2.0 mm/day. Local summer is May–September (MJJAS) in the Northern Hemisphere (NH) and November–March (NDJFM) in the Southern Hemisphere (SH); local winter is NDJFM in the NH and MJJAS in the SH. (2) The summer precipitation fraction (SPF), calculated as the ratio of local summer precipitation (MJJAS or NDJFM sum) to the total annual precipitation, must be greater than 55%.
To focus on interdecadal variability, all time series data were smoothed using an 11-year moving average prior to analysis. The GLM area was calculated based on these 11-year averaged precipitation fields. For comparison, area-averaged GLM intensity metrics (annual precipitation, summer precipitation, APR) over the climatological monsoon domain were also calculated using the same smoothed data. Unless otherwise specified, the total GLM area for any given period is calculated by summing the area of all land grid cells satisfying both criteria, accounting for varying grid cell areas with latitude.

2.3. Identification of Driver Episodes

To isolate the influence of the two primary drivers, we classify distinct climate background states based on anomalies in the 11-year moving averaged ensemble mean time series of GMST and TPTG. Crucially, all anomalies discussed in this study, including those used for classification and subsequent analyses, are calculated relative to the climatology derived from the 1151-year control simulation (CTRL), which was also processed with an 11-year moving average. TPTG is defined as the temperature difference between the western (135° E–180° E, 10° S–10° N) and eastern (245°–280° E, 0°–20° S) equatorial Pacific, serving as a proxy for Walker circulation strength [38,43].
While the anomalies are referenced to CTRL, the standard deviation used to define the thresholds for significant episodes is calculated from the 11-year averaged ensemble mean time series (all forcing runs) over the last millennium (950–1850). This approach uses the forced signal’s variability range to define extreme events, avoiding the much larger variability inherent in the CTRL run itself. Years defining these episodes follow a “Monsoon Year” definition (from May to April). Sensitivity tests confirmed that this definition does not alter the main conclusions compared to using a calendar year.
The rationale for using the CTRL climatology as the reference for anomalies while defining the extremity thresholds based on the last millennium 13-member ensemble mean standard deviation is to leverage the CTRL simulation for a stable, unforced baseline, thereby clearly identifying deviations caused by external forcings active during the last millennium. Simultaneously, using the variability characteristics of the forced last millennium period itself to define statistical extremity ensures that episode selection is sensitive to the magnitude of climatically significant forced events, rather than being skewed by the potentially different variability spectrum or long-term drifts inherent in the unforced CTRL run.
The resulting episode categories, based on these criteria applied to the ensemble mean anomalies relative to CTRL, are as follows:
  • Cool-GMST-only episodes (215 episodes): Identified when the GMST anomaly is below −1.5 standard deviations and the corresponding TPTG anomaly remains within ±1.0 standard deviations.
  • Weak-TPTG-only episodes (18 episodes): Identified when the TPTG anomaly is below −1.5 standard deviations and the corresponding GMST anomaly remains within ±1.0 standard deviations.
  • Compound episodes (36 episodes): Identified when both the GMST anomaly is below −1.5 standard deviations and the TPTG anomaly is below −1.5 standard deviations.
The efficacy of our episode selection criteria in isolating distinct and physically meaningful climate states is validated by both the composite mean characteristics of the driver variables themselves (Figure 1) and the corresponding composite spatial patterns of surface temperature anomalies (Figure S1). As intended with the selection criteria, Cool-GMST-only episodes are characterized by a significant negative mean GMST anomaly, while the mean TPTG anomaly remains close to its CTRL climatological mean (Figure 1). Spatially, this manifests as a coherent large-scale cooling across the globe, particularly amplified over landmasses, without a concomitant strong zonal gradient anomaly in the tropical Pacific (Figure S1a). Conversely, Weak-TPTG-only episodes exhibit a significantly negative mean TPTG anomaly, while the mean GMST anomaly is minimal relative to CTRL (Figure 1). Their spatial signature (Figure S1b) is dominated by an El Niño-like pattern in the tropical Pacific, with a weakened east–west temperature gradient, and lacks the pronounced, spatially coherent global cooling seen in Cool-GMST episodes. Although a slight negative mean GMST anomaly is observed for these Weak-TPTG-only episodes (Figure 1), this likely reflects the generally cooler background state of the last millennium within the ALLR simulations compared to the 850 reference conditions of the CTRL run [40], rather than indicating a strong global cooling event as the primary characteristic. Furthermore, the small number of Weak-TPTG-only episodes (N = 18) limits statistical power. However, these events are the result of a strict selection process designed to isolate a specific forced state. The fact that a coherent and significant signal emerges from the large background of internal climate variability (as seen in the CTRL run) gives us confidence that these episodes represent a robust, externally forced response. Finally, Compound episodes, defined by the simultaneous strong negative excursions in both drivers, predictably display the most intense and spatially extensive global cooling pattern (Figure S1c), alongside the strongest negative mean anomalies in both GMST and TPTG (Figure 1, green bars).
Taken together, the distinct mean anomaly magnitudes for GMST and TPTG within each category and their characteristic, physically interpretable spatial temperature anomaly footprints confirm that our methodology successfully identifies episodes representing significant and differentiable deviations in GMST, TPTG, or their combined state, all benchmarked against the CTRL climatology. This establishes a robust framework for investigating the differential responses of GLM area to these specific climate background states.

3. Results

3.1. Forced Variability of GLM Area and Contributions from GMST and TPTG

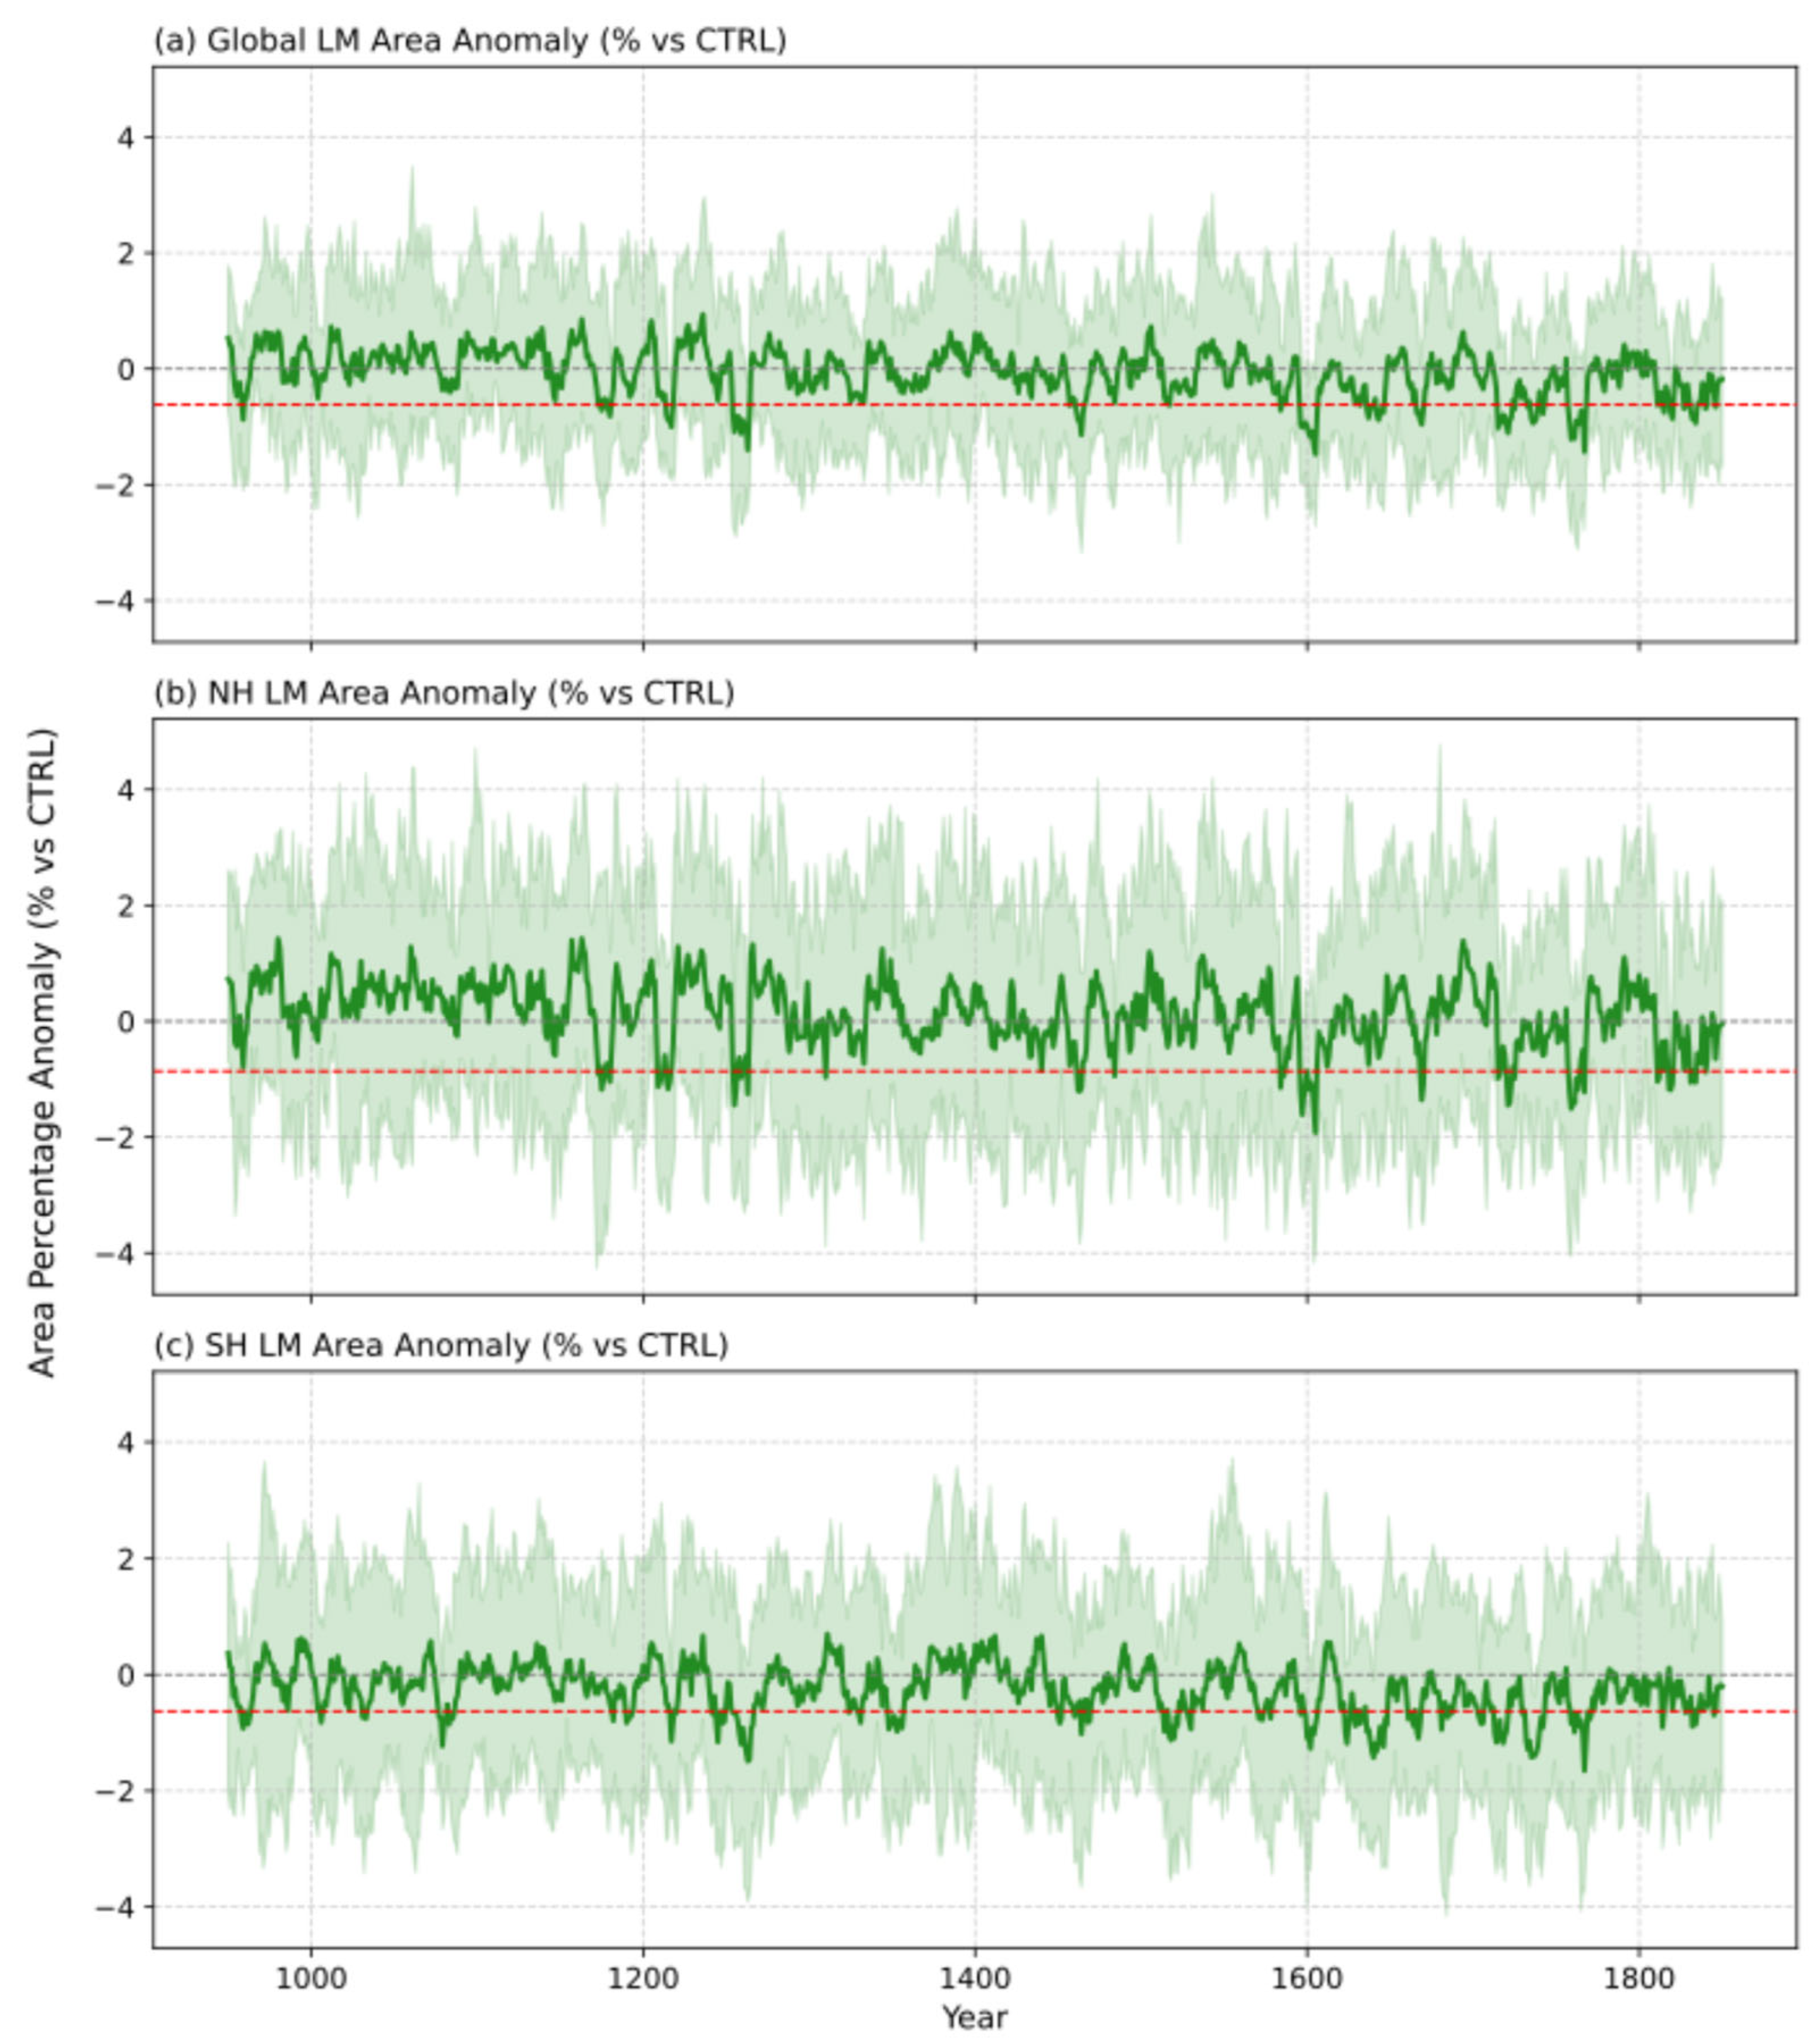
The 13-member ensemble mean of the GLM area, representing the externally forced response relative to the CTRL climatology, exhibits distinct interdecadal variability over the last millennium (Figure 2, dark green lines). Anomalies in the GLM area typically fluctuate within ±1% of the CTRL mean, while hemispheric anomalies can reach ±1.5−2% (Figure 2a–c). Notably, several periods show pronounced decreases in the ensemble mean GLM area exceeding −1.5 standard deviations (red dashed line in Figure 2a). These intervals of significant GLM area contraction broadly coincide with known periods of strong volcanic forcing and low solar activity during the last millennium [44,45], suggesting their strong links with external drivers. The considerably larger spread among individual ensemble members (Figure 2, light green shading) highlights the significant masking effect of internal climate variability on the forced signal in any single realization. Within the forced response, variations in GLM area in the NH and SH are significantly correlated with the total GLM area variation (r = 0.88 and 0.70 for the NH and SH, respectively). The consistently stronger correlation for the NH suggests a somewhat larger contribution from NH land monsoon area changes to the overall forced GLM area signal during the last millennium in the CESM-LME framework.
To quantify the contributions of the primary hypothesized drivers to this forced GLM area variability, a multiple linear regression analysis was applied to the 11-year averaged ensemble mean time series. The results reveal that anomalies in GMST and TPTG jointly explain 33.0% (p < 0.05) of the variance in the ensemble mean GLM area percentage anomalies over the last millennium. The standardized regression equation is approximately GLM area ≈ 0.42 × GMST + 0.32 × TPTG, with both predictors being highly significant (p < 0.05). This indicates that both global cooling (negative GMST anomaly) and a weakened TPTG are robustly associated with reductions in the externally forced component of the GLM area. While these two drivers explain a significant portion (33.0%) of the forced variance, the remaining two-thirds highlight the influence of other factors. This unexplained variance is likely attributable to a combination of residual internal climate variability not fully removed by the ensemble averaging, the smaller effects of other external forcings not included in the model (e.g., solar variability), and inherent non-linearities in the monsoon system’s response. Indeed, as we will demonstrate later in this paper (Section 4.4), the response to concurrent strong forcing is highly non-linear, and such effects are not captured by this linear regression framework. Therefore, this analysis confirms GMST and TPTG as crucial linear drivers, while also underscoring the complex, multi-faceted nature of GLM area variability.
Furthermore, a key finding emerges when comparing the sensitivity of the GLM area to that of GLM intensity. As reported in Wang et al. [38], GMST and TPTG collectively explain 75% of the variance in the leading forced mode of GLM intensity. Similarly, for the area-averaged GLM intensity metrics calculated over the climatological monsoon domain (such as annual precipitation, summer precipitation, or APR), these two drivers jointly account for a considerably higher proportion of the variance, ranging from approximately 54% to 69%. The markedly lower explained variance (33.0%) for the GLM area therefore suggests that the spatial extent of the GLM during the last millennium was considerably less sensitive to, or less linearly predictable by, these specific natural forcing agents compared to various measures of monsoon intensity. Furthermore, the standardized coefficient for GMST (0.42) is slightly larger than that for TPTG (0.32) in the GLM area regression. This suggests a potential primary influence of GMST changes on the GLM area, similar to its influence on area-averaged intensity metrics, but contrasting with the TPTG dominance previously identified for the leading forced mode of GLM intensity [38]. This difference in driver importance hints at distinct underlying mechanisms modulating the monsoon area versus its intensity, which will be explored further.

3.2. Composite GLM Area Response to Driver Episodes

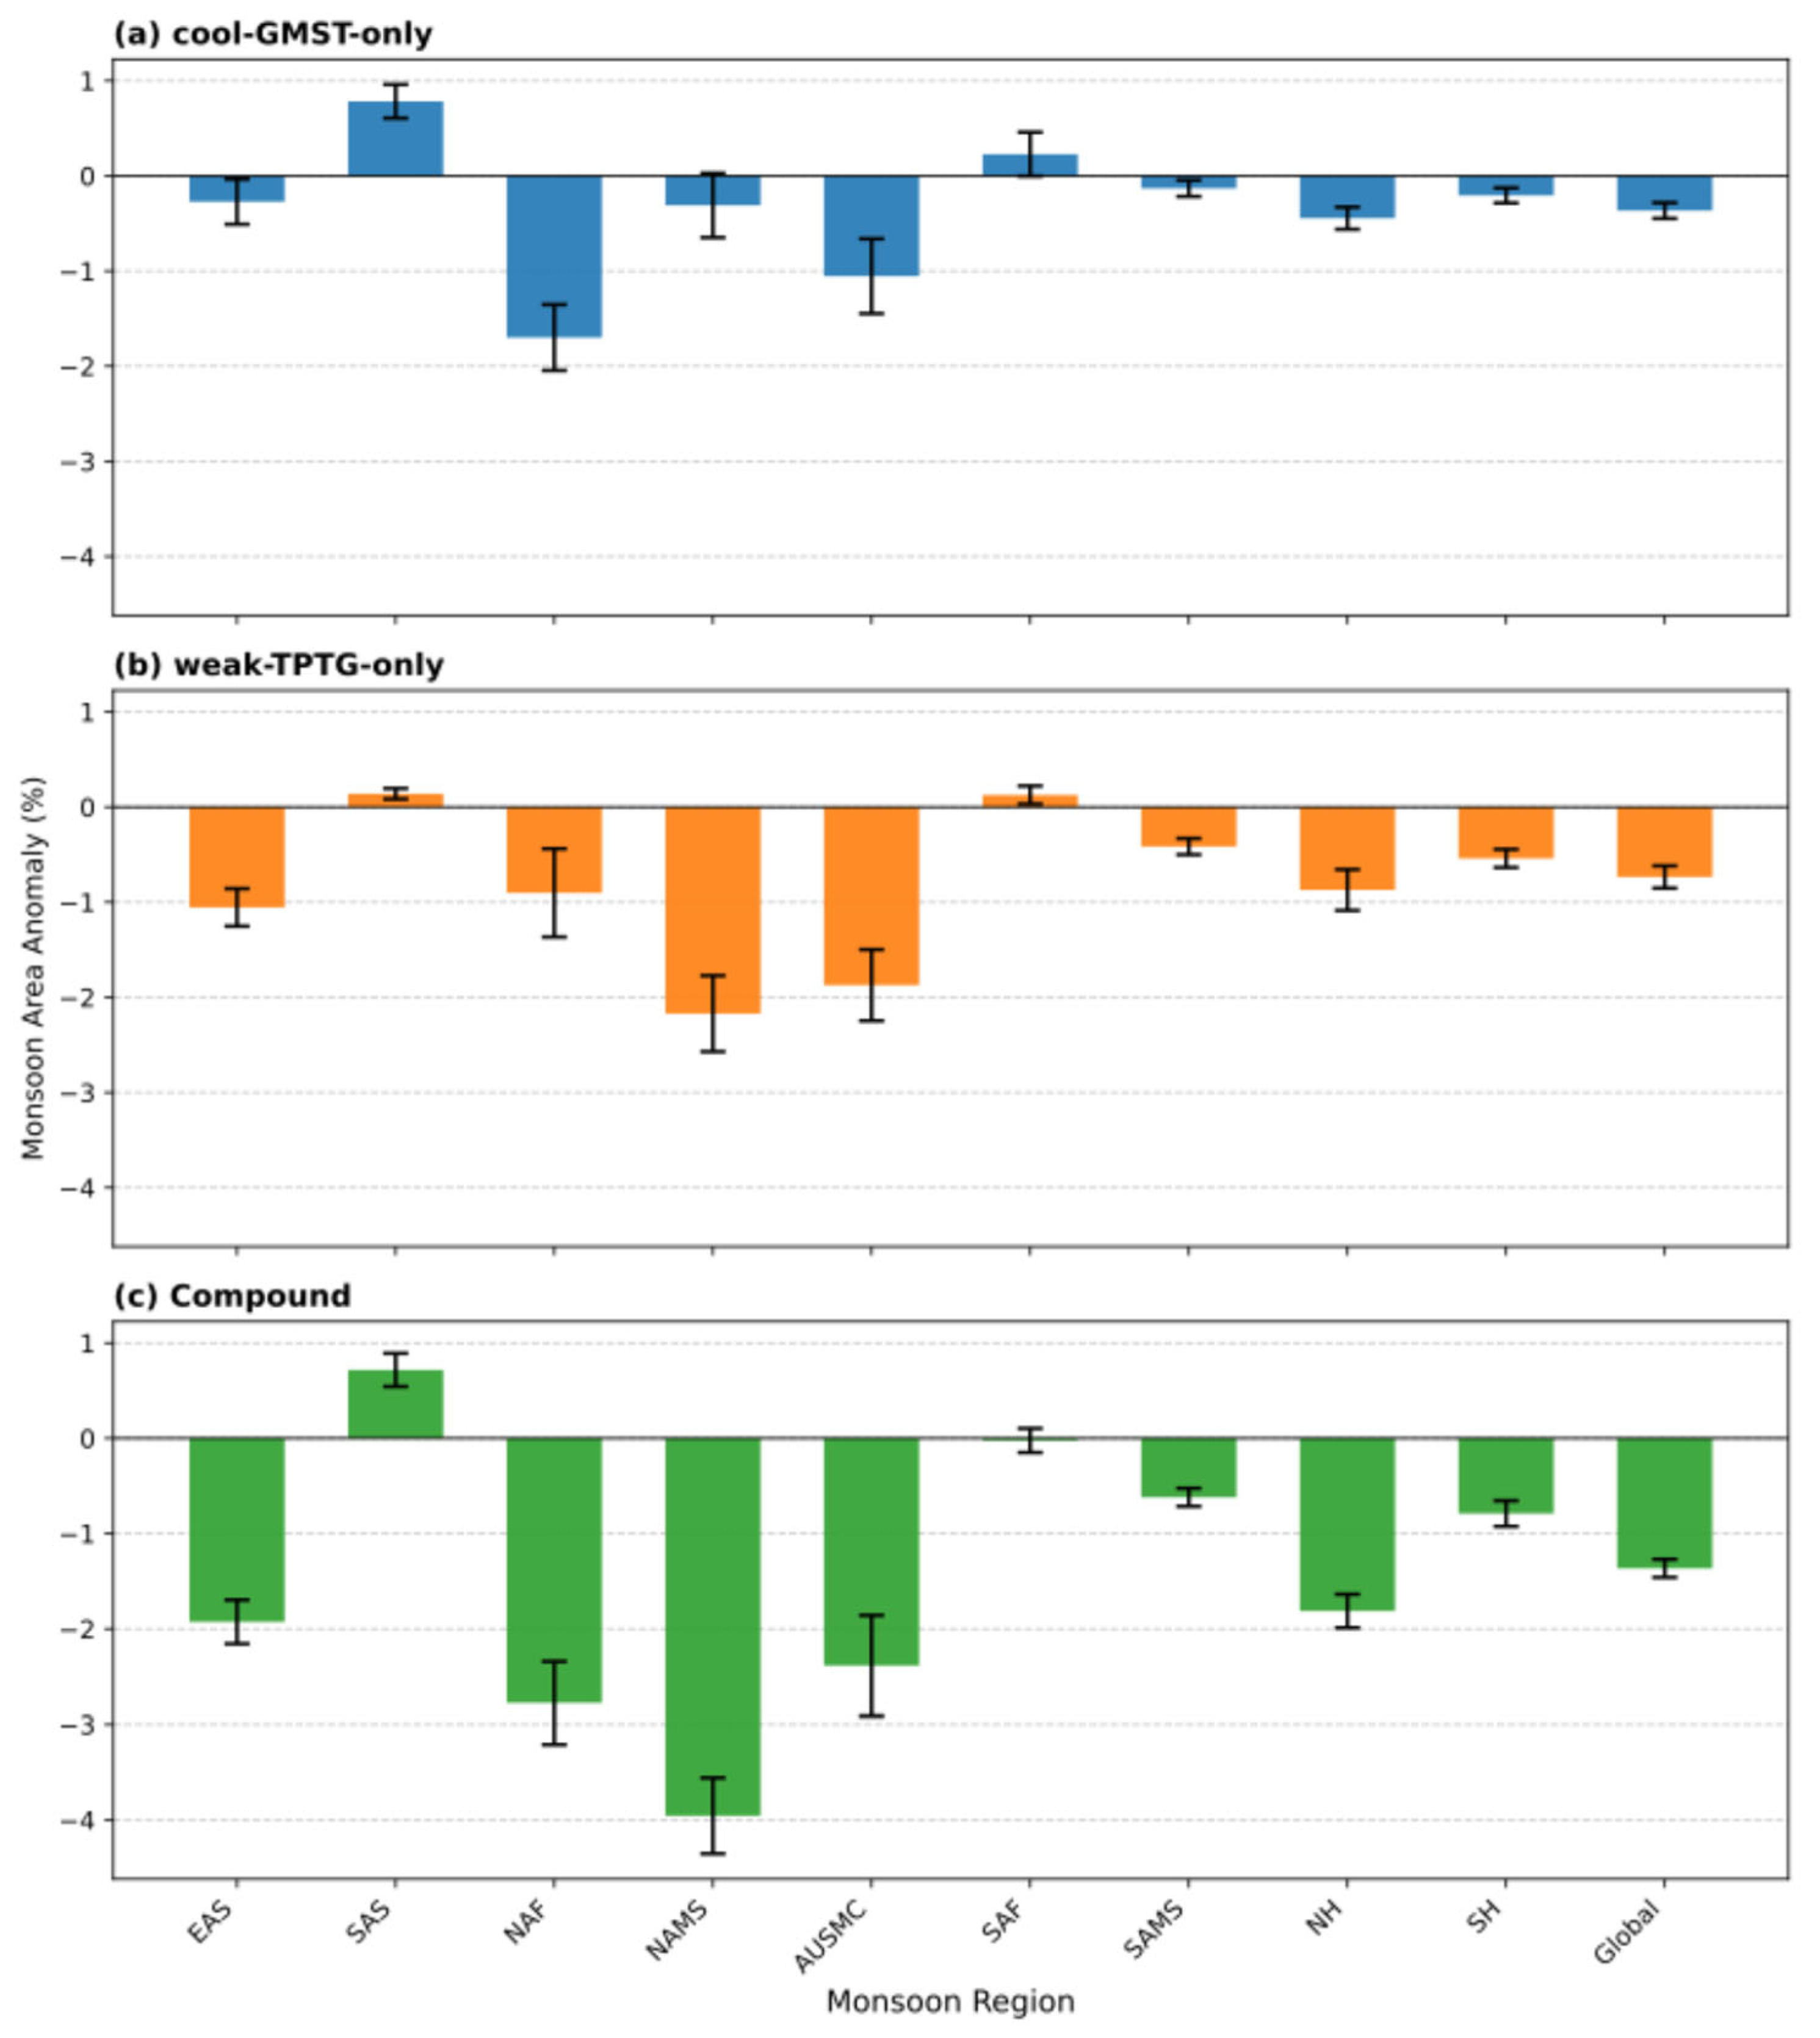
Composite analysis of the GLM area anomalies under the Cool-GMST-only and Weak-TPTG-only conditions reveals clear and differing response patterns, both globally and regionally (Figure 3). Globally, both single-driver scenarios induce significant GLM area reductions. As shown by the ‘Global’ bars in Figure 3a,b, Cool-GMST-only episodes result in a −0.37% contraction, while Weak-TPTG-only episodes lead to a more substantial contraction of −0.74%. It is noteworthy that the compound episodes, representing periods with simultaneously strong negative anomalies in both GMST and TPTG (Figure 1), trigger the largest observed global contraction at −1.37% (Figure 3c), a magnitude substantially greater than that under single-driver conditions.
Examining the regional contributions to these global responses reveals significant heterogeneity and driver-dependent sensitivities under the single-driver conditions. Under Cool-GMST-only conditions (Figure 3a), significant area loss is prominent in NAF (−1.70%) and AUSMC (−1.05%). In contrast, SAS (South Asia Summer monsoon regions) shows a significant area increase (0.78%) during these global cooling episodes, while other regions like EAS and SAMS show relatively minor but significant contractions. The Weak-TPTG-only conditions (Figure 3b) elicit a stronger overall global contraction and are characterized by more widespread regional monsoon area reductions. Notably, substantial and significant decreases in monsoon area are observed in NAMS (−2.17%), AUSMC (−1.87%), and EAS (−1.06%). These contractions align well with the known teleconnection patterns where El Niño-like conditions typically suppress monsoon precipitation and activity in these regions [16,18], suggesting a direct consequence of altered rainfall patterns pushing marginal areas below the thresholds defining the GLM area. NAF also experiences considerable area loss (−0.90%) under Weak-TPTG conditions. Interestingly, the SAS response remains slightly positive (0.14%), but is significant and much smaller than the increase observed under Cool-GMST conditions, indicating a different regional modulation by TPTG.

3.3. Spatial Patterns of GLM Area Change

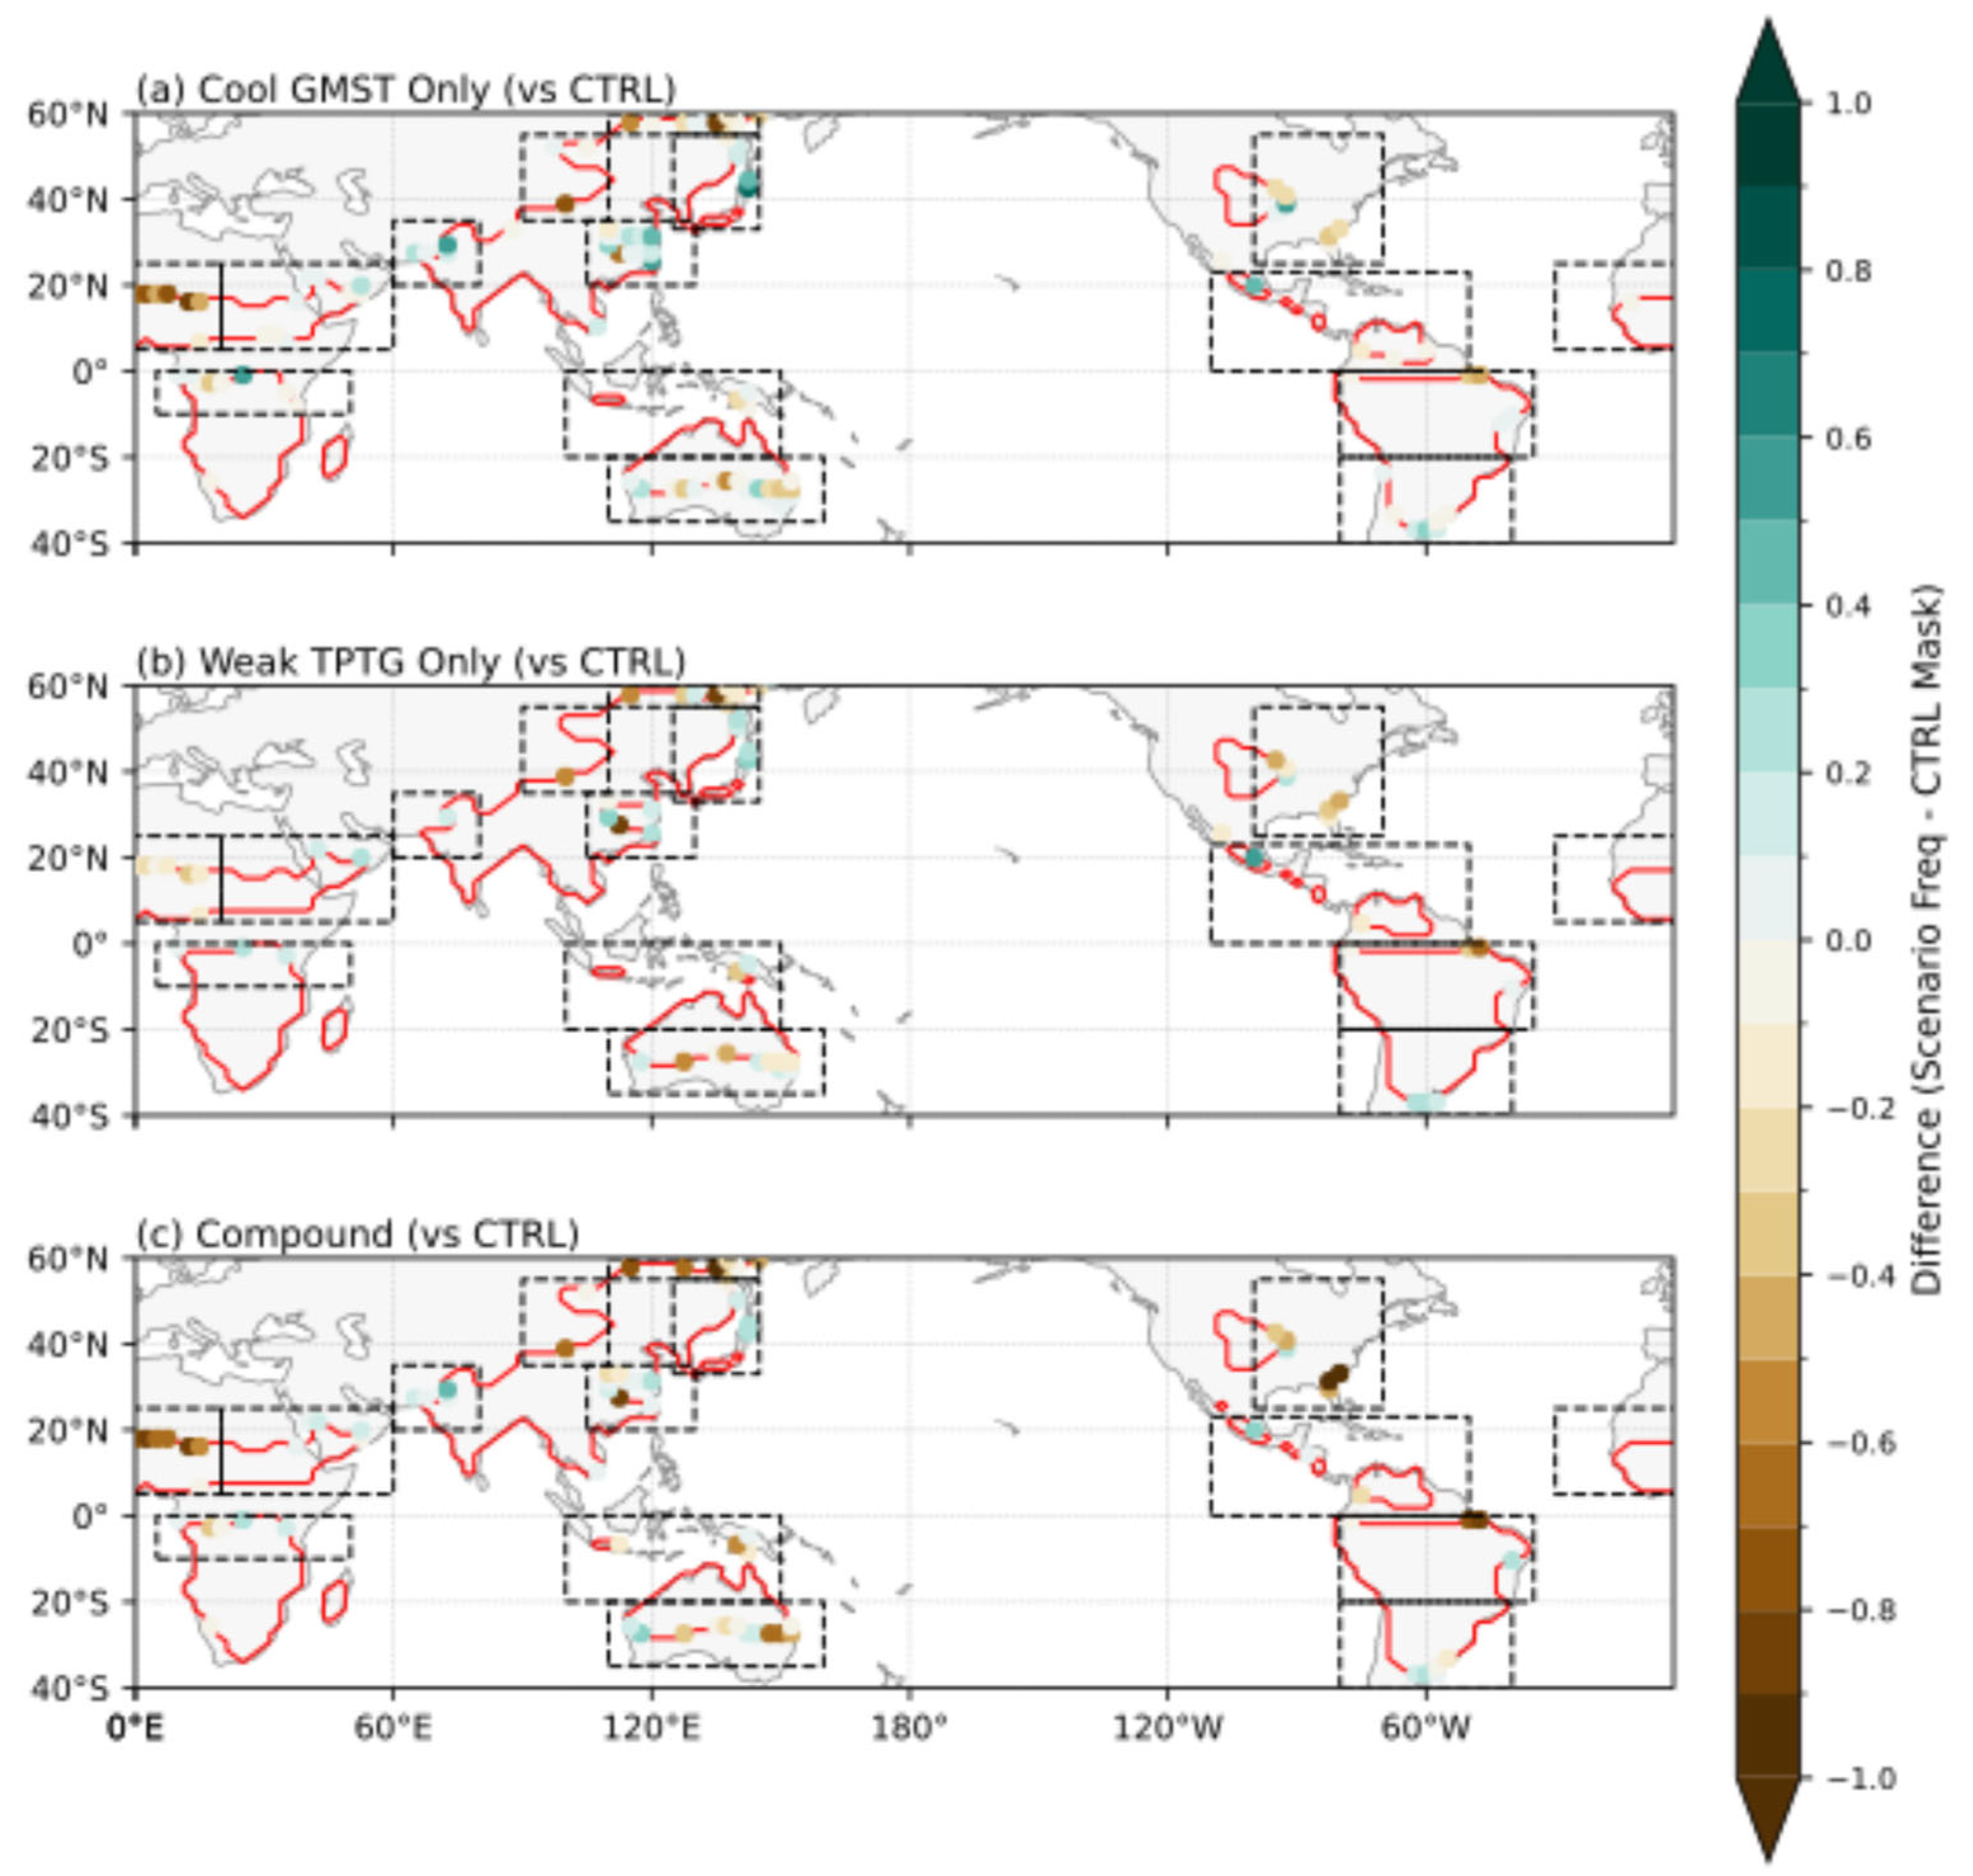
Our spatial analysis reveals that forced changes in monsoon occurrence are predominantly concentrated along the vulnerable margins of the climatological monsoon domain, while core monsoon regions remain largely stable (Figure 4). This analysis maps the composite mean difference in the frequency of monsoon occurrence between each driver condition and the CTRL climatology. Positive values indicate an increased frequency (tendency towards expansion or stabilization), while negative values signify a decreased frequency (tendency towards contraction or destabilization). Significant changes in monsoon occurrence frequency are predominantly concentrated along the margins of the climatological monsoon domain under Cool-GMST-only and Weak-TPTG-only conditions (Figure 4). The core regions within the established monsoon domain, by contrast, generally exhibit no changes in occurrence frequency across these conditions. This spatial pattern strongly suggests that the forced monsoon domain variability primarily manifests as shifts, expansions, or retractions of the monsoon boundaries in specific vulnerable transition zones, rather than wholesale advances or retreats of the entire domain, highlighting a notable degree of resilience within the core monsoon regions, as previous research has suggested [9].
Furthermore, spatial analysis reveals distinct regional patterns and sensitivities, with some boundary segments showing consistent responses across the two single-driver conditions, while others are highly dependent on the specific nature of the forcing. For instance, certain marginal areas exhibit consistent tendencies irrespective of whether the primary conditions are global cooling or a weakened TPTG state. Notably, the northwestern sector of SAS persistently shows an increased monsoon occurrence frequency under Cool-GMST-only (Figure 4a) and, to a lesser extent, Weak-TPTG-only (Figure 4b) conditions, aligning with the positive net monsoon area changes observed for this region (Figure 3). Similarly, NAF displays a robust west–east dipole pattern in both conditions, with contraction tendencies along the western Sahelian boundary and expansion tendencies towards the east, suggesting a relatively stable dipole response pattern in this region, although the net effect differs (Figure 3a,b).
In contrast, other regions demonstrate responses that clearly intensify or qualitatively change depending on the specific driver. Contraction signals are dominant in NAMS, particularly along its southeastern boundary, and in AUSMC along its northern boundary. These contraction signals are moderate under Cool-GMST-only (Figure 4a), but intensify markedly and become more spatially coherent under Weak-TPTG-only conditions (Figure 4b). This corresponds well with the substantial net monsoon area losses reported for these regions under Weak-TPTG conditions (Figure 3b) and underscores their sensitivity to ENSO-like teleconnections. EAS also exhibits stronger and more coherent contraction signals along its northern and northwestern boundaries under Weak-TPTG (Figure 4b) compared to the more mixed or weaker signals under Cool-GMST (Figure 4a); moreover, the slight southeastern expansion tendency seen in EAS under Cool-GMST is largely absent or reversed under Weak-TPTG.
In summary, the forced GLM area changes during the last millennium manifest primarily as adjustments along specific marginal zones. While some of these boundary segments exhibit somewhat consistent directional responses to both Cool-GMST and Weak-TPTG conditions, the intensity and overall spatial extent of boundary shifts, particularly the contraction signals in regions like NAMS, AUSMC, and EAS, are significantly more pronounced and widespread under Weak-TPTG conditions compared to Cool-GMST conditions. The underlying mechanisms driving these diverse spatial patterns and driver-dependent sensitivities will be explored further in the Section 4.

4. Discussion

This study examines the GLM area response to GMST and TPTG changes within the CESM-LME framework. Our findings on the roles of GMST and TPTG should be interpreted within the context of the primary natural forcing active during the last millennium in the CESM-LME simulations. Consistent with numerous studies utilizing this ensemble [15,34,41], our own analyses comparing various single-forcing experiments confirm that volcanic eruptions are the dominant driver of externally forced interdecadal climate variability in this model during the last millennium [39]. Therefore, the key climate responses discussed here, particularly the global cooling influencing monsoon area, should be understood as being predominantly triggered by volcanic activity within this specific model framework, with influences from solar or other natural forcings being comparatively smaller. Therefore, the identified statistical links between the GLM area and key drivers should be largely understood as reflecting the pathways through which dominant volcanic forcing modulates the monsoon’s spatial extent via large-scale adjustments in temperature and circulation.

4.1. Validation of the Forced GLM Area Response

Before delving into the specific mechanisms by which GMST and TPTG modulate the GLM area, it is crucial to ascertain the extent to which the observed interdecadal GLM area variability in last-millennium simulations represents a deterministic response to external forcings rather than an artifact of internal climate variability. As established in our previous work and consistent with numerous studies utilizing the CESM-LME [15,34,37,38], volcanic eruptions are the predominant external forcing driving interdecadal climate variability in this model ensemble during this period. Consequently, the statistical linkages identified between GLM area and key drivers should primarily reflect the pathways through which this dominant volcanic forcing modulates the monsoon’s spatial extent.
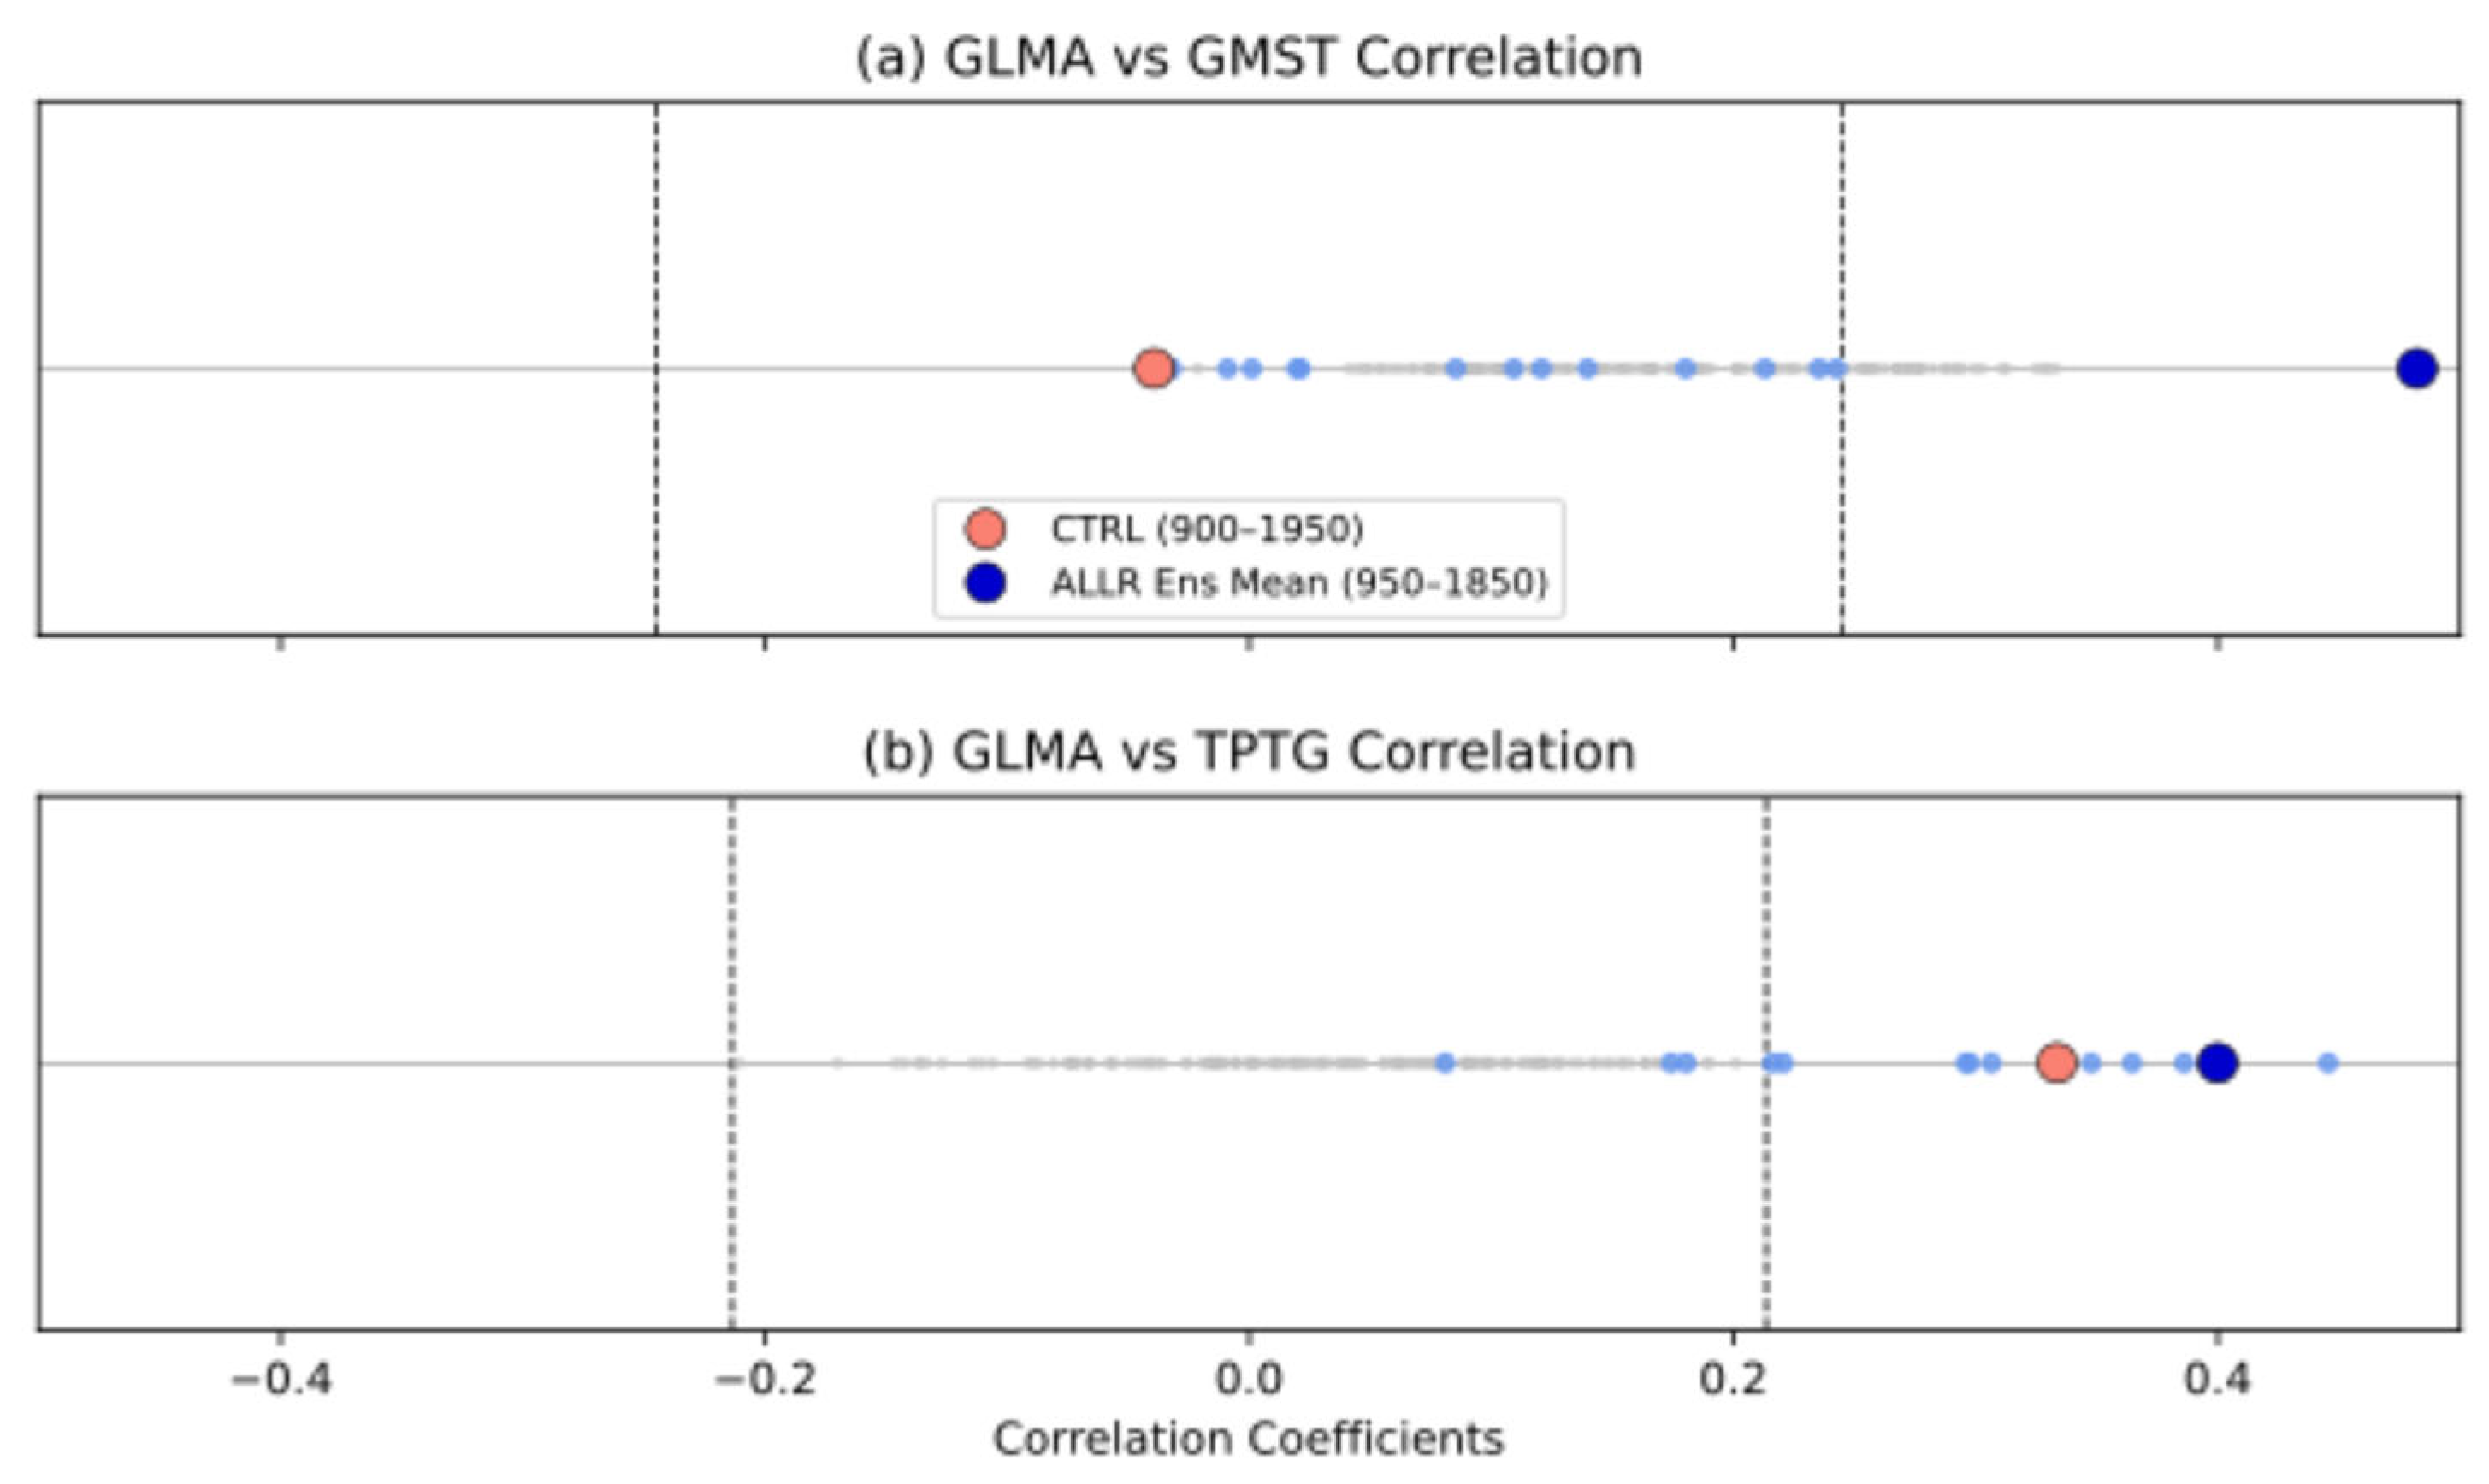
Figure 5 provides compelling evidence for this forced interpretation by dissecting the influence of forced signals versus internal climate variability. The ensemble mean GLM area exhibits significant positive correlations with both ensemble mean GMST and TPTG anomalies (Figure 5, large blue dots), representing the coherent, externally forced climate response effectively isolated through ensemble averaging. In contrast, when examining correlations within individual ensemble members (Figure 5, small blue dots), which inherently blend this forced response with unique realizations of internal climate variability, the GMST and GLM area relationship becomes considerably weaker and more scattered. This highlights the substantial masking effect of internal climate variability on the forced GMST-GLM area link in any single simulation. The TPTG-GLM area connection, however, remains relatively robust, even across individual members. This is likely because prominent internal modes of variability, such as ENSO-like phenomena, can themselves drive a positive TPTG-GLM area correlation (Figure 5b, large red dot for CTRL), thereby reinforcing the externally forced signal in the all-forcing runs.
The critical distinction between forced and internal responses is further clarified by comparison with the CTRL. The GMST-GLM area correlation is weak and insignificant in the CTRL run (Figure 5a, large red dot), indicating that internal variability alone does not generate a strong, systematic link between GMST fluctuations and monsoon area changes. While a significant TPTG-GLM area correlation exists in CTRL, likely reflecting intrinsic ENSO-GLMA teleconnections, the strength and consistency of this link in the ensemble mean of all-forcing runs, especially when considering that external forcings like volcanic eruptions are known to modulate TPTG itself [29,38], points to an additional layer of forced modulation. Furthermore, cross-member correlations (Figure 5, small gray dots) also reveal significant underlying positive correlations for both the GMST-GLM area and TPTG-GLM area, effectively isolating the common forced signal shared across the ensemble.
Collectively, these analyses, by differentiating the clear signals in the ensemble mean from the noise in individual members and the distinct behavior in the CTRL, strongly support the conclusion that the GLM area responses linked to GMST and TPTG variations reported in this study are indeed primarily attributable to external forcing, with volcanic activity being the principal driver, rather than being predominantly a manifestation of internal climate variability.

4.2. Differential Sensitivity of GLM Area Versus Intensity

A primary finding of this study is the markedly lower linear sensitivity of the GLM area to key drivers compared to metrics representing GLM intensity. This discrepancy highlights that the spatial extent of the monsoon system responds differently, or less directly, to these large-scale forcings than the precipitation intensity does within established monsoon regions. However, when GLM intensity metrics are calculated using a time-varying monsoon domain, the variance explained by GMST and TPTG drops significantly to a range of approximately 32–42%. This latter range is much closer to the sensitivity observed for the GLM area itself (~33%). This crucial finding demonstrates that incorporating the dynamics of boundary shifts—which, as shown, are relatively less sensitive to the drivers—into the domain over which intensity is calculated significantly modulates and reduces the apparent linear sensitivity of the resulting intensity metric. Therefore, the lower sensitivity of the GLM area is not merely an isolated characteristic, but also fundamentally influences how we perceive and quantify monsoon intensity changes if the domain itself is allowed to fluctuate [12].
Several factors likely contribute to this intrinsically lower sensitivity of the GLM area. Firstly, the definition of the GLM area relies on fixed absolute thresholds for APR (>2.0 mm/day) and SPF (>55%). Our spatial analysis, which consistently shows that forced changes in monsoon occurrence frequency are predominantly concentrated along the monsoon margins while core areas remain largely stable (Figure 4), strongly supports this buffering effect. Secondly, the response of monsoon boundaries to forcing may be inherently non-linear or exhibit strong threshold-dependence. While the composite mean GLM area shows significant net reductions during pronounced driver episodes (Figure 3), preliminary analysis of the linear correlation between driver anomalies and the GLM area within these selected extreme episodes sometimes reveals weaker or insignificant relationships (Figure S2). This could imply that monsoon boundaries react more abruptly once certain forcing levels are crossed, rather than responding proportionally across the full spectrum of driver variability, thus contributing to the lower variance explained by simple linear models over the entire period.
This finding of potentially decoupled or differing sensitivities between monsoon area and intensity resonates with observations from other climatic periods and proxy records. For instance, paleo-reconstructions indicated substantial variations in monsoon intensity, while core domains remained relatively stable over extended timescales, or vice versa [46,47,48,49]. Similarly, modern observational studies have reported periods where trends in monsoon area are insignificant despite significant changes in intensity, in addition to where these trends show contrasting behaviors [3]. Our results, situated within the context of natural forcing during the last millennium, suggest that this differential sensitivity is shaped by a combination of factors: the inherent buffering provided by threshold-based definitions, the potentially non-linear and margin-focused nature of boundary responses, and the modulating influence that changes in monsoon area exert on the perceived changes in monsoon intensity when dynamic domains are considered.

4.3. Mechanisms of GLM Area Change: Roles of APR and SPF Criteria

The observed changes in GLM area under these conditions are ultimately determined by how grid cells, particularly those situated near the climatological monsoon boundaries, respond to the two defining criteria: APR exceeding 2.0 mm/day and SPF greater than 55%. Understanding the mechanisms driving GLMA variability therefore necessitates a detailed examination of how APR and SPF are modulated under Cool-GMST-only and Weak-TPTG-only conditions.

4.3.1. GLM Area Response Mechanisms Under Cool-GMST-Only Conditions

Under Cool-GMST-only conditions, the tendency for GLM area contraction (Figure 3a and Figure 4a) appears to be primarily driven by widespread reductions in APR. Spatially, a significant decrease in APR anomalies and an increased probability of APR falling below the 2.0 mm/day threshold are evident across many monsoon margins (Figure 6a). This prevalent APR decline is mechanistically linked to the dominant thermodynamic effect of global cooling. Such cooling substantially suppresses local summer precipitation across most monsoon regions (Figure S3a) due to reduced atmospheric moisture-holding capacity and decreased evaporation [39]. This suppression of summer rainfall is generally more pronounced than the impact on local winter precipitation (Figure S3b), resulting in a marked decrease in the seasonal precipitation difference and, hence, a lower APR.
In contrast, the SPF criterion under Cool-GMST conditions exhibits a more complex and hemispherical asymmetric response. In the NH, the regional mean SPF anomaly is small yet significantly positive (Figure S4c), and, spatially, changes in the probability of exceeding the SPF threshold are generally weak and lack coherence along most NH margins (Figure 6c). This muted SPF response in the NH occurs because the thermodynamic cooling tends to proportionally reduce both the local summer precipitation sum and the annual precipitation sum [39]. Consequently, in the NH, the GLM area contraction under Cool-GMST seems almost entirely attributable to the failure of many marginal cells to meet the APR criterion. While the net effect driven by APR failure leads to contraction, it is worth noting that the response at the monsoon margins can exhibit complex regional variations, reflecting a mixture of local expansion and contraction tendencies, which may contribute to the relatively moderate net GLM area contraction under global cooling.
However, in the SH, a significant decrease in the mean SPF anomaly is observed (Figure S4c), primarily driven by strong negative anomalies in regions like AUSMC and SAMS. Spatially, this corresponds to areas with a decreased probability of meeting the SPF > 55% threshold along SH monsoon margins (Figure 6c). This SH-specific SPF reduction arises because, while summer precipitation decreases due to cooling (Figure S4a), the reduction in the annual precipitation total is often considerably smaller (Figure S4b), likely due to complex winter season responses (e.g., altered circulation or relative humidity changes) that may counteract the overall drying trend or even lead to slight precipitation increases in some SH regions during winter, thereby reducing the summer share.

4.3.2. GLM Area Response Mechanisms Under Weak-TPTG-Only Conditions

The mechanisms governing the GLM area response under Weak-TPTG-only conditions are different, reflecting the dominant role of dynamic adjustments in atmospheric circulation rather than direct thermodynamic constraints [39]. This scenario leads to more complex and heterogeneous changes in both the APR and SPF criteria.
The APR response under Weak-TPTG, while also generally leading to decreases in many monsoon regions where GLM area contracts (Figure 6b), arises differently than under Cool-GMST. Here, the reduction in APR is often primarily driven by a significant increase in local winter precipitation (Figure S3b), a dynamically forced response linked to shifts in large-scale circulation patterns (e.g., altered Walker and Hadley circulations). This enhancement in winter rainfall can outweigh the comparatively smaller or more regionally varied changes in local summer precipitation (Figure S3a), thereby reducing the APR. This contrasts with the thermodynamically driven suppression of summer rainfall being the primary cause of APR reduction under Cool-GMST.
Concurrently, Weak-TPTG conditions induce a relatively widespread tendency towards SPF reduction across many monsoon regions (Figure 6d). This SPF decrease is primarily caused by a significant increase in the annual precipitation total (Figure S4b), largely fueled by the dynamically enhanced local winter precipitation. As the annual total precipitation increases more substantially than, or at the expense of, summer precipitation, the fraction of annual rainfall occurring in summer diminishes. This highlights how dynamic adjustments under Weak-TPTG significantly alter the seasonal balance of precipitation, reducing summer dominance, unlike the more proportional (thermodynamically driven) suppression of both seasonal and annual totals typically seen under Cool-GMST. The consequence is that under Weak-TPTG, both APR and SPF criteria can fail in various regions due to these dynamically driven shifts in seasonal rainfall patterns, contributing to the observed GLM area contractions (Figure 3b and Figure 4b). However, it is also these dynamic adjustments that can lead to regionally specific expansions, such as the notable both defining criteria increase and consequent area expansion observed in parts of NAF (Figure 4b and Figure 6b,d).
It is noteworthy that while the fundamental mechanisms by which Cool-GMST (primarily thermodynamic) and Weak-TPTG (primarily dynamic) forcings impact APR and SPF differ, the resulting GLM area boundary adjustments at the regional scale can sometimes exhibit superficially similar spatial patterns, albeit often with driver-dependent nuances in their intensity or precise manifestation (Figure S5). For instance, both global cooling and El Niño-like conditions have been linked to weak rainfall responses in the EAS, frequently manifests as a meridional dipole or “southern-flood-northern-drought” pattern rather than a spatially uniform change in precipitation [50,51,52,53]. Such dipole patterns have been attributed to the southward displacement or weakening of the primary EAS rain-bearing systems and associated large-scale circulation changes, including a more southward position of the Western Pacific Subtropical High, in response to both global cooling and El Niño events [54,55,56]. A common feature emerging under both Cool-GMST and Weak-TPTG conditions is a tendency for the northern and northwestern peripheries of the EAS to retract, while its southern and eastern margins display a contrasting stability or even expansionary behavior (Figure S5). Similarly, NAF margins can display a west–east dipole response (western contraction, eastern expansion) under both types of forcing (Figure S5), a phenomenon also documented in paleoclimate and modern contexts, although this is attributed to distinct large-scale drivers such as ITCZ shifts and hemispheric temperature gradients under cooling, versus Pacific teleconnections and Indian Ocean coupling under El Niño [57,58,59,60,61,62]. These examples highlight that, while the overarching GLM area response is a direct consequence of APR/SPF threshold crossings, the specific regional expressions of these boundary changes are deeply intertwined with complex regional climate dynamics. A comprehensive, region-by-region dissection of these intricate boundary mechanisms, while beyond the primary scope of this global-scale GLM area focused study, certainly warrants dedicated future research.
In summary, Cool-GMST forcing primarily leverages thermodynamic mechanisms to induce widespread reductions in APR by suppressing summer precipitation more than winter precipitation, making APR failure the principal cause for GLM area contraction, especially in the NH, with SPF playing a more complex, secondary role that can vary hemispherically. Conversely, Weak-TPTG forcing operates mainly through dynamic adjustments, resulting in heterogeneous changes in seasonal precipitation balances that can lead to both APR and SPF failure (or increase in specific regions), thereby shaping GLM area through more intricate and regionally varied pathways.

4.4. Synergistic Effects and Amplified GLM Area Response Under Compound Conditions

Having established the individual impacts of GMST changes and TPTG variations on the GLM area in the preceding sections, we now turn to a scenario of climatic relevance: the concurrent occurrence of strong manifestations of both drivers. Such compound episodes (as defined in Section 2.3) are frequently associated with major natural forcing events like large volcanic eruptions, which were the dominant external forcing in the last-millennium simulations [29,30,38,63,64]. This context motivates a critical question: when these two potent drivers operate simultaneously at high intensity, does the GLM area respond as a simple linear sum of their isolated effects, or does the climate system reveal a more complex, potentially non-linear and amplified, response? Addressing this is vital for a comprehensive understanding of past monsoon dynamics and for anticipating the intricacies of monsoon behavior under future multi-stressor scenarios.
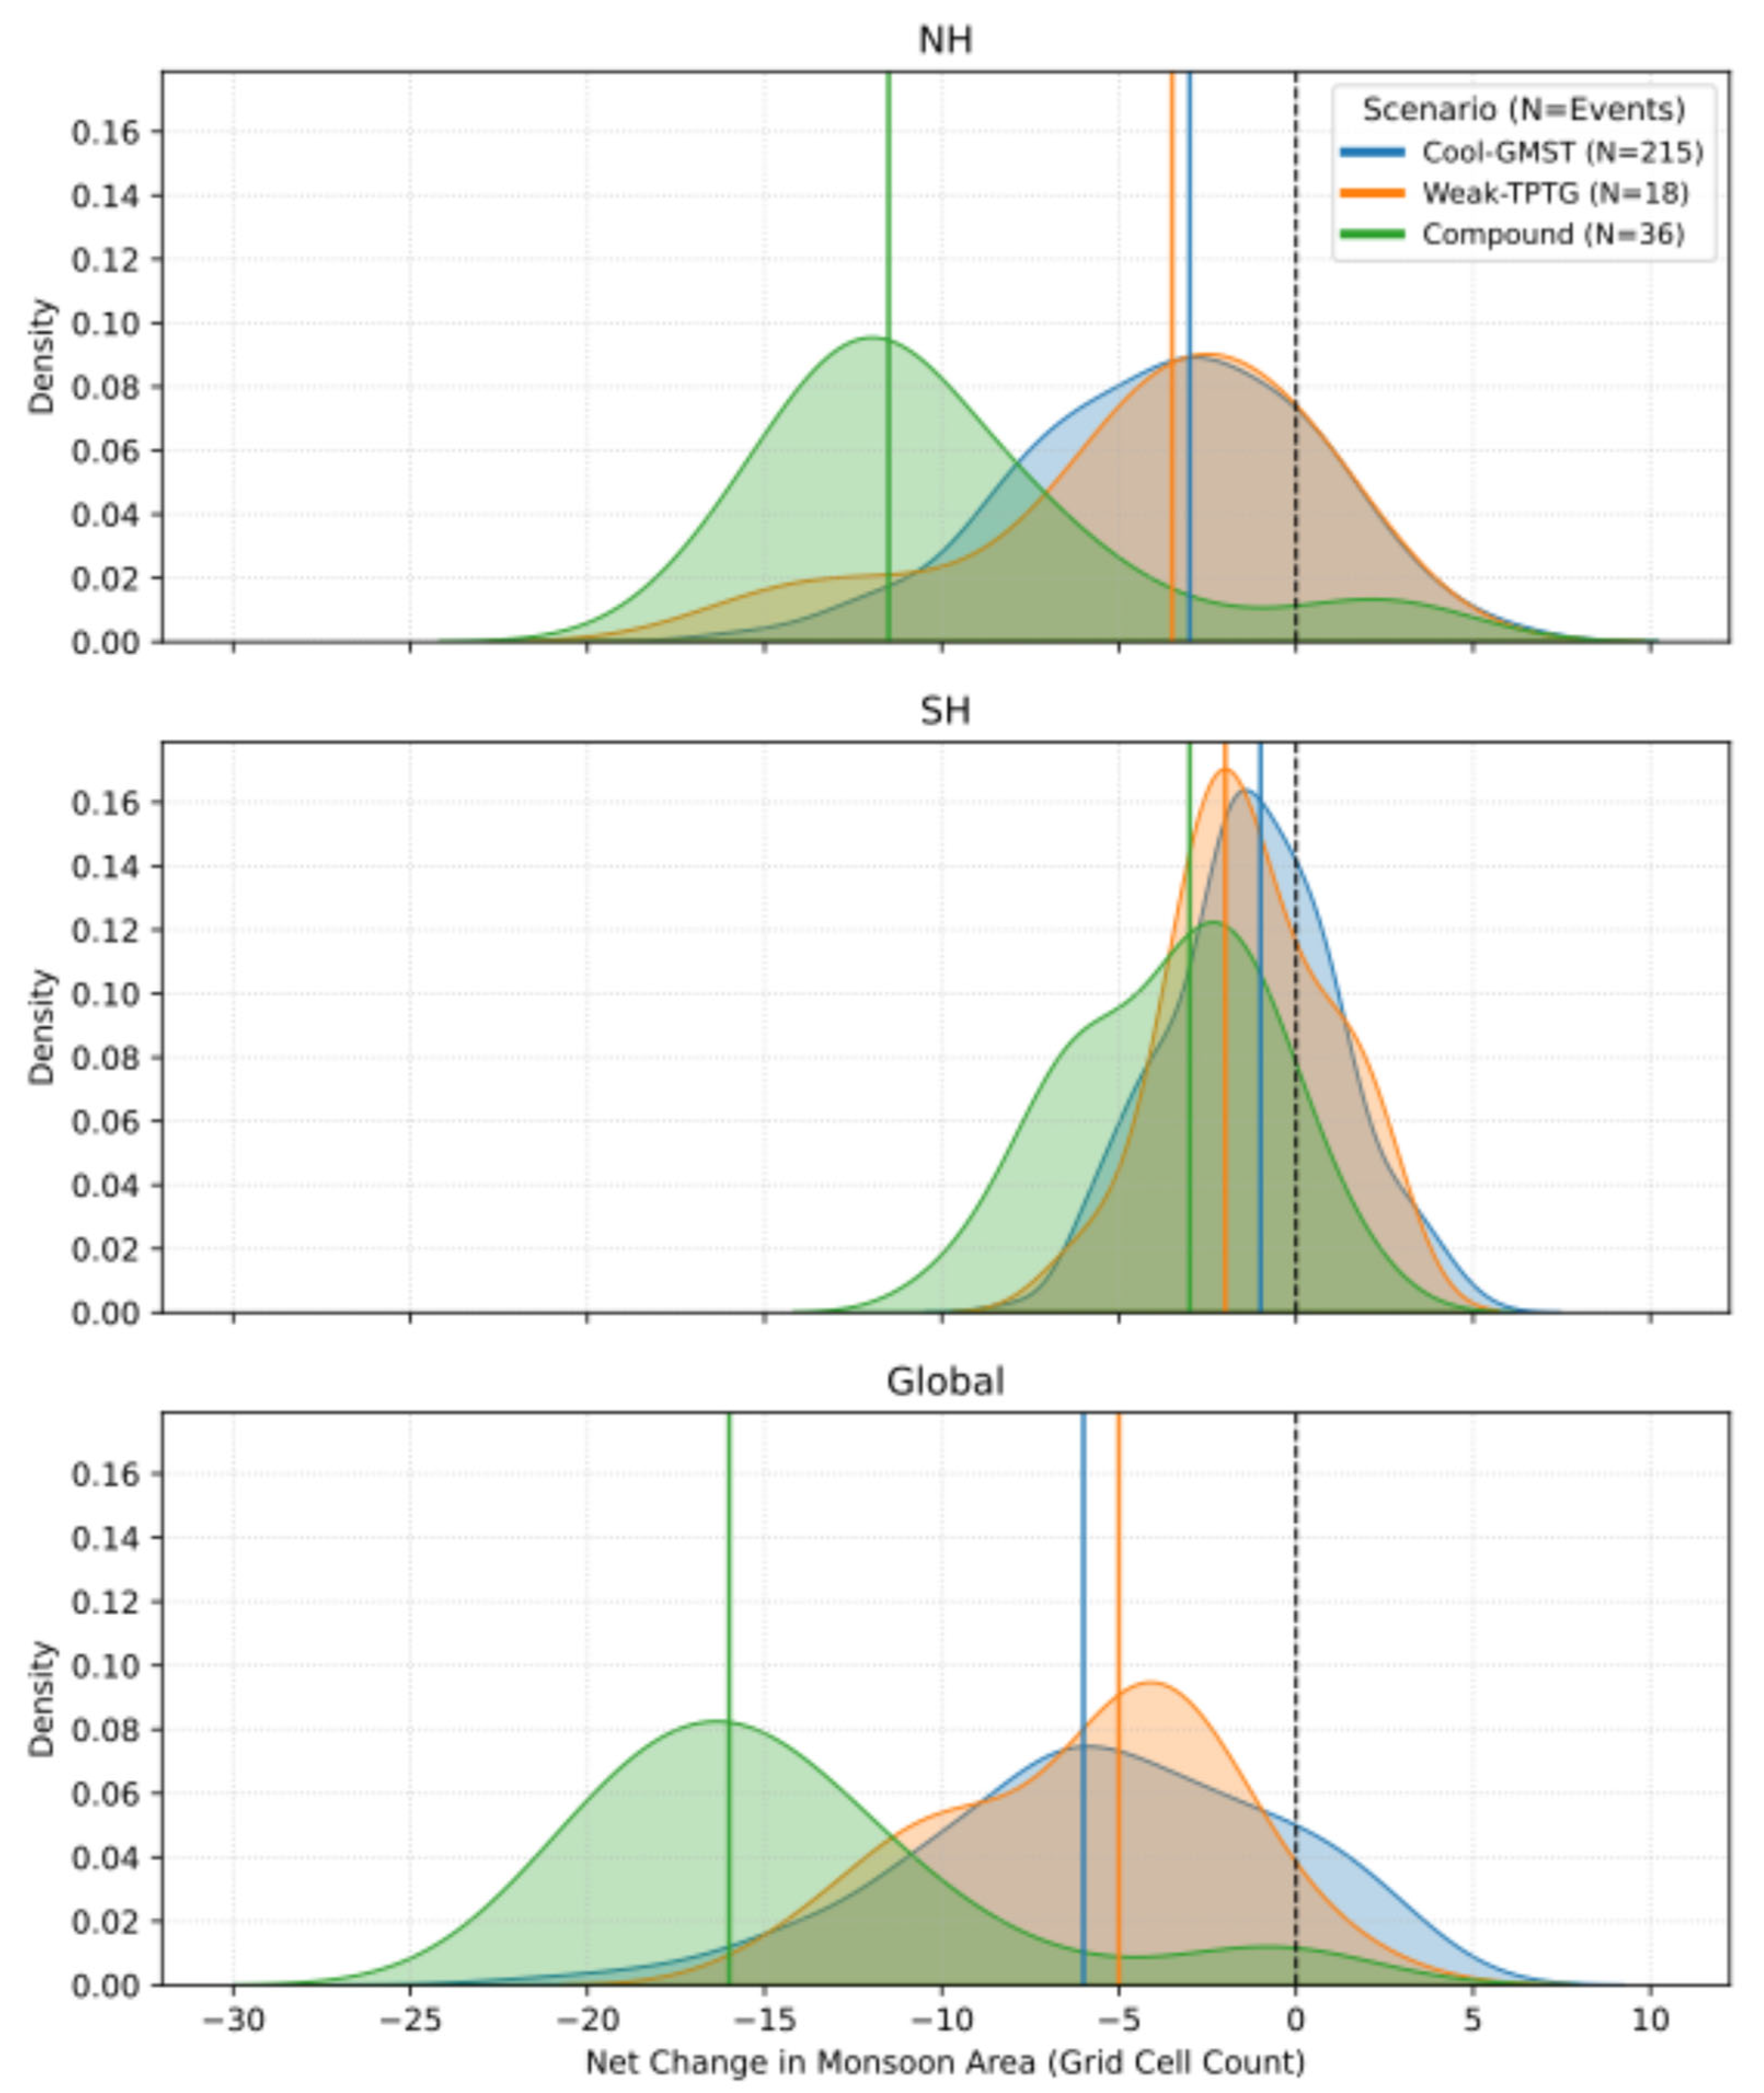
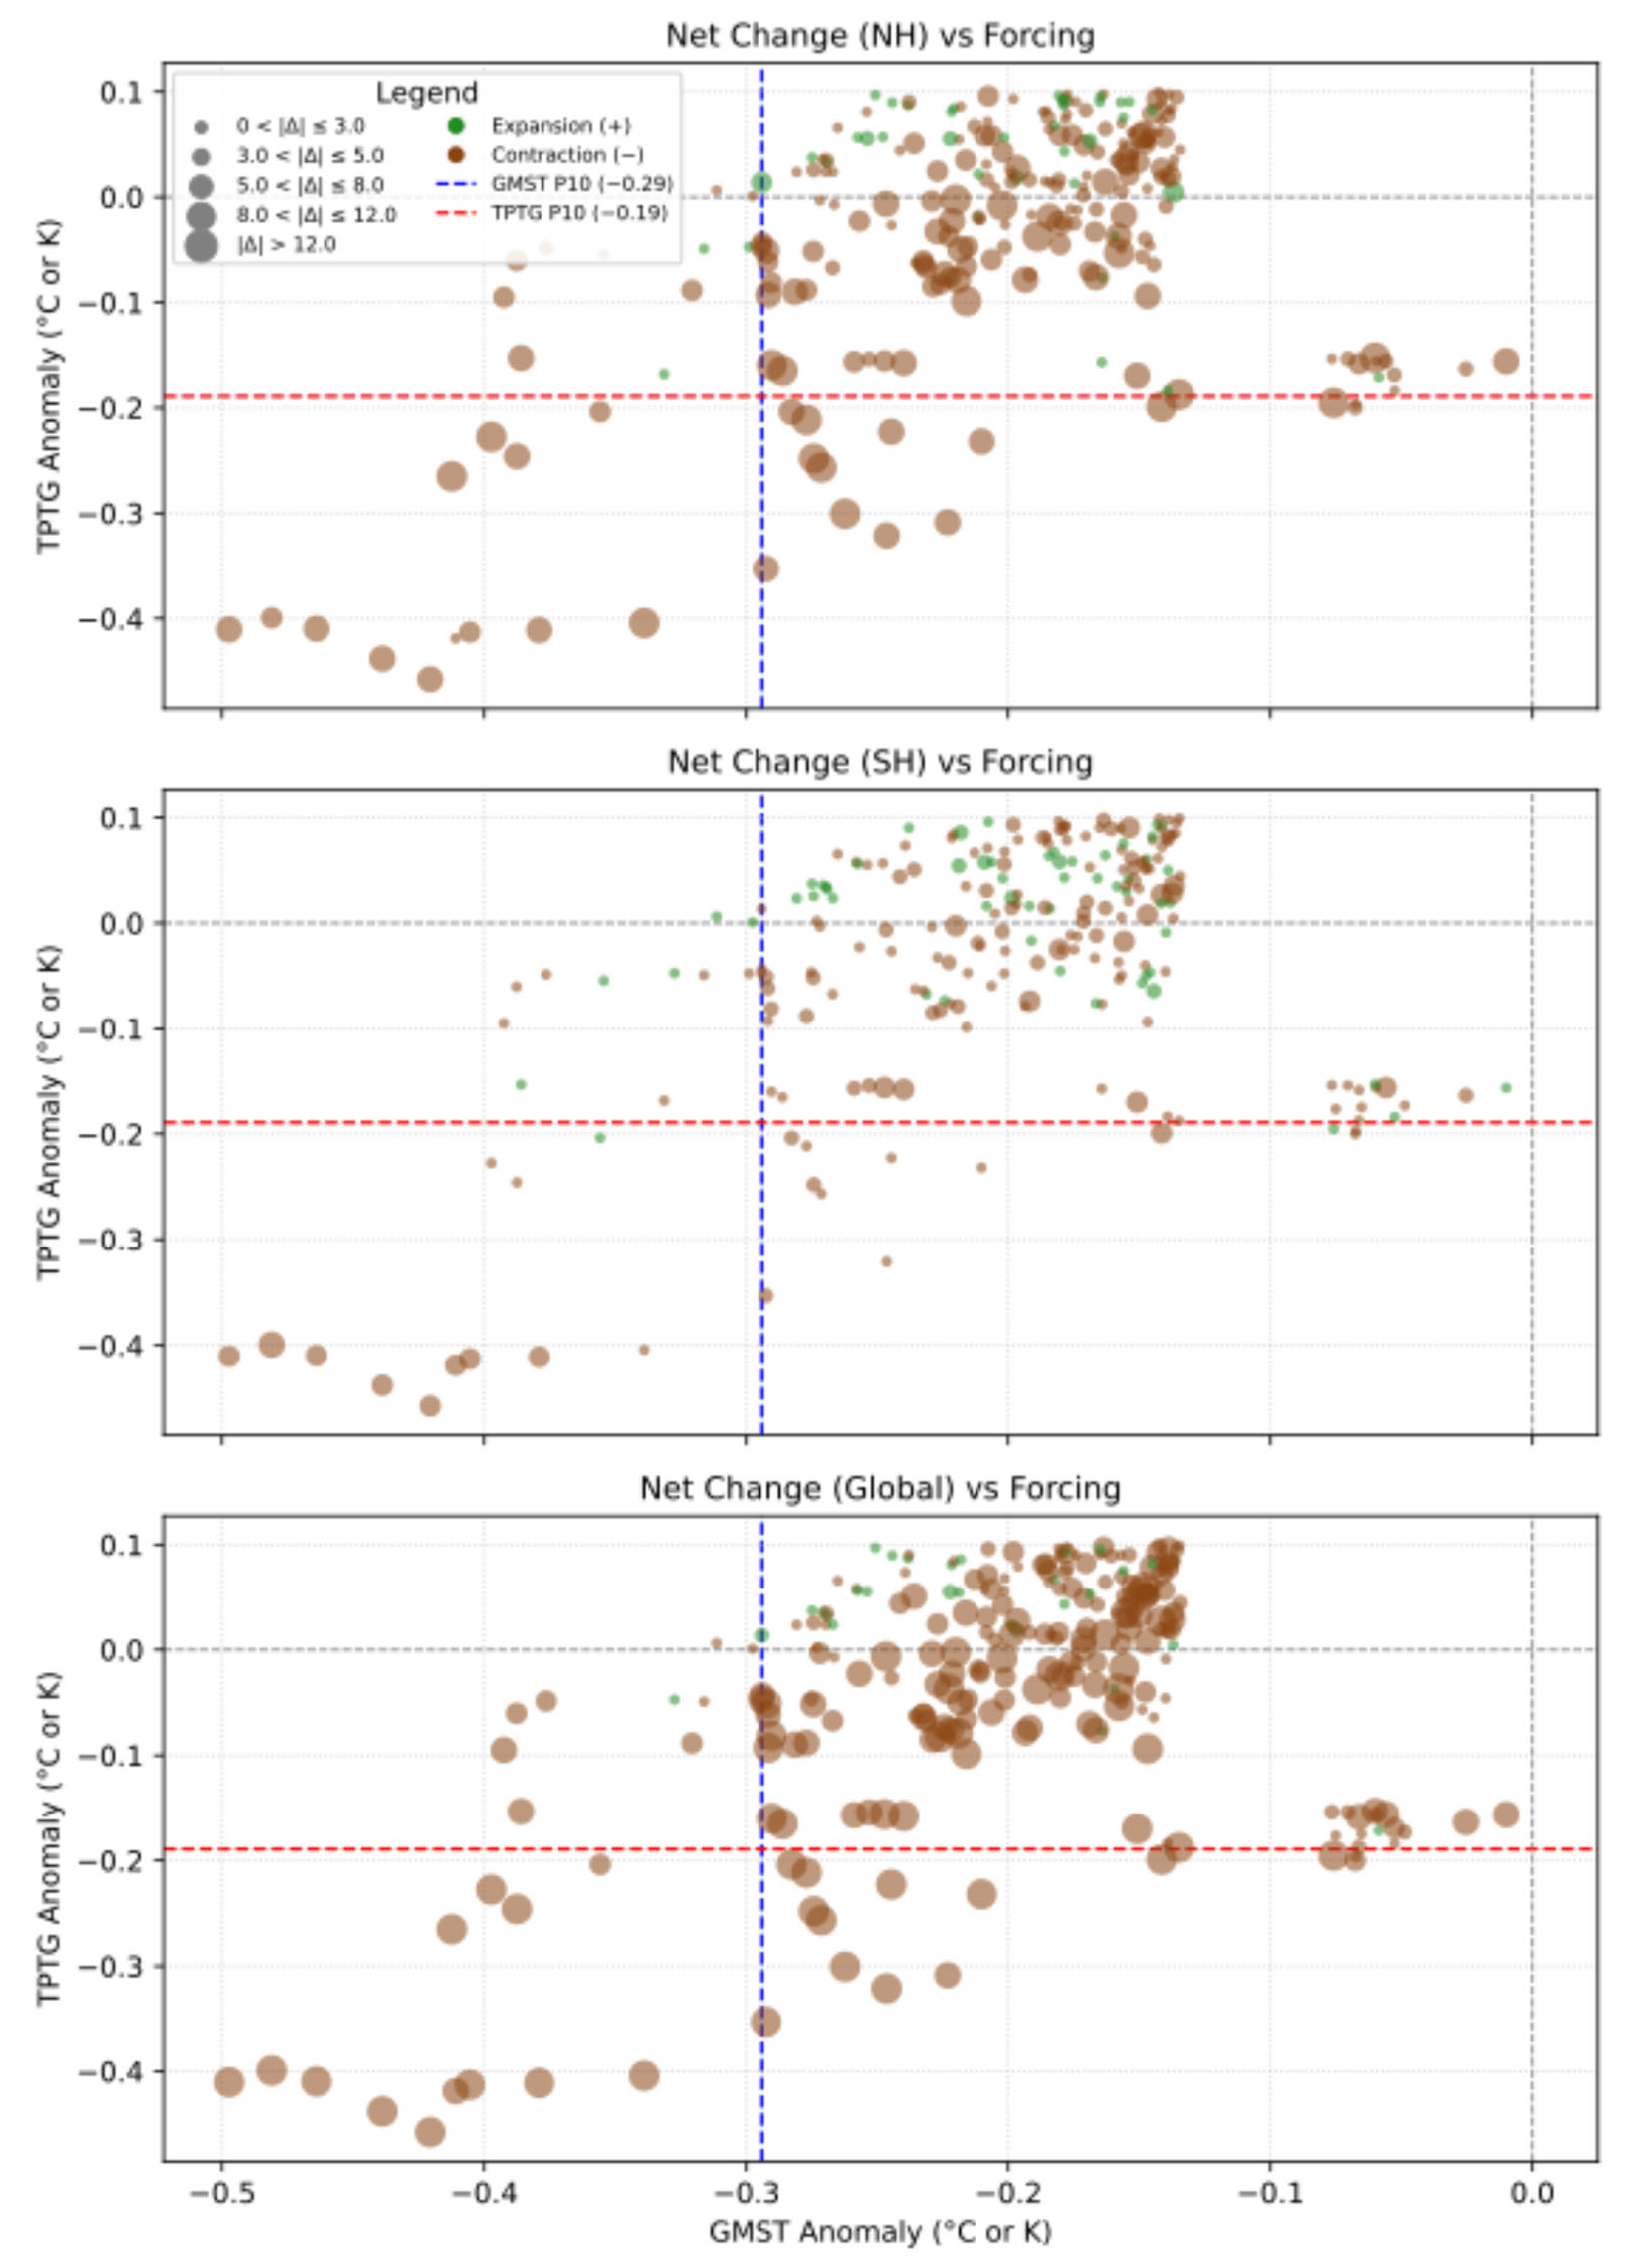
Consistent with the expectation of a distinct climatic impact, our analyses reveal that these compound episodes trigger the most substantial and widespread contractions of the GLM area observed during the last millennium. Composite analysis demonstrates that, on average, compound conditions induce the largest mean reductions in monsoon area globally (−1.37%) and across both hemispheres (NH: −1.81%, SH: −0.79%) when compared to episodes driven by either Cool-GMST-only or Weak-TPTG-only (Figure 3c). Spatially, this intensified response manifests as the most extensive and pronounced contraction signals along the climatological monsoon margins, particularly impacting regions such as NAMS, NAF, AUSMC, and EAS more severely than under single-driver forcing (Figure 4c). Further robust statistical support for this amplified contraction comes from the kernel density estimation of net monsoon area changes (Figure 7). The entire probability distribution of GLM area contraction under compound conditions is significantly shifted towards more negative values compared to both Cool-GMST-only and Weak-TPTG-only conditions across global and hemispheric domains. It is particularly noteworthy that, while the overall magnitudes of GLM area contraction induced by isolated Cool-GMST and Weak-TPTG episodes are indistinguishable from each other, the contraction during compound episodes is significantly more severe. Reinforcing this, an examination of GLM area changes within the GMST-TPTG forcing space (Figure 8) unequivocally shows that the most extreme GLM area contractions (represented by the largest brown dots, indicating substantial negative net change in monsoon grid cells) are overwhelmingly concentrated within the joint-extreme quadrant, where strong cooling and a significantly weakened TPTG co-occur.
The greater GLM area contraction observed under compound conditions strongly suggests that the climate system’s response to these combined forcings is not merely additive, but indicative of non-linear synergistic interactions. While the average forcing during compound episodes is indeed stronger for both GMST and TPTG compared to their respective isolated extreme episodes (Figure 1), the magnitude of the GLM area response appears disproportionately amplified. For instance, the mean global monsoon area contraction of −1.37% under compound forcing (Figure 3c) considerably exceeds a simple linear summation of the mean contractions observed under isolated Cool-GMST-only (−0.37%, Figure 3a) and Weak-TPTG-only (−0.74%, Figure 3b) conditions, which would only yield an expected contraction of approximately −1.11%. This notable deviation from linear additivity, visually underscored by the disproportionate concentration of the most severe GLM area contractions within the joint-extreme (compound) quadrant of the GMST-TPTG forcing space (Figure 8), points towards mechanisms where the simultaneous presence of intense global cooling and a significantly weakened TPTG triggers a GLM area response more potent than their individual effects would linearly imply.
This apparent non-linear amplification of GLM area contraction under compound forcing conditions strongly suggests that the underlying physical mechanisms governing monsoon boundary shifts are fundamentally altered when both strong cooling and a weakened TPTG act in concert. The mechanisms responsible for such synergistic responses in GLM area are likely rooted in the non-linear behavior of seasonal precipitation, which directly determines the APR and SPF criteria defining the monsoon area. Specifically, it was found that, during such compound episodes, particularly in local summer, the cooling-induced thermodynamic suppression of precipitation (driven by reduced atmospheric moisture and evaporation) becomes overwhelmingly dominant. This thermodynamically driven drying was often amplified compared to Cool-GMST-only conditions and could simplify or even override the more complex and spatially heterogeneous dynamic adjustments (e.g., anomalous subsidence or convergence) typically associated with Weak-TPTG conditions acting alone. We hypothesize that it is this intensified and potentially non-linearly amplified alteration of the seasonal precipitation cycle under compound conditions—particularly the severe reduction in summer rainfall coupled with significant impacts on the annual total and winter precipitation—that leads to a more widespread and concurrent failure of both the APR and SPF criteria at the monsoon margins, thus driving the observed amplified contraction of GLM area.
A closer examination of how the two defining criteria of the GLM area respond under compound forcing conditions provides direct mechanistic evidence for this amplified contraction. Under these concurrent strong cooling and Weak-TPTG episodes, mean APR exhibits its most substantial and widespread decrease across nearly all monsoon regions (Figure S3c), and, spatially, the probability of APR falling below the critical 2.0 mm/day threshold becomes remarkably high and geographically extensive along most monsoon margins (Figure S6a). This signifies a profound and pervasive weakening of the seasonal precipitation contrast. Simultaneously, the SPF also undergoes its largest and most geographically coherent reductions globally and hemispherically when compared to single-driver scenarios (Figure S4c). This translates into a correspondingly high probability of SPF dropping below the 55% threshold across vast areas that were previously within the monsoon domain (Figure S6b). This “dual failure”—where a large proportion of marginal grid cells concurrently fail to meet both the APR and the SPF criteria—is a hallmark of the compound conditions. It starkly contrasts with the Cool-GMST-only conditions, where APR reduction was the primary driver of GLM area contraction and SPF changes were more muted and hemispherically asymmetric, and it also differs from the Weak-TPTG-only scenario, which induced more heterogeneous and often less severe responses in both APR and SPF. Mechanistically, this concurrent and severe degradation in both APR and SPF under compound conditions is a direct consequence of the intensified and overarching thermodynamic suppression of the hydrological cycle. Intense global cooling (Figure 1 and Figure S1c) leads to a profound reduction in atmospheric moisture [39], which results in a particularly strong and potentially non-linearly amplified suppression of local summer precipitation. This severe summer drying directly and substantially reduces APR. Furthermore, this overwhelming thermodynamic control, by drastically reducing summer rainfall and significantly impacting the annual precipitation total, erodes the dominance of summer rainfall within the annual cycle, thereby broadly and severely depressing SPF across most regions. This pathway provides a robust mechanistic explanation for the uniquely severe and widespread GLM area contraction observed under compound forcing.
In summary, the evidence presented in this section strongly indicates that when strong global cooling and a significantly weakened Pacific gradient occur concurrently—a scenario frequently initiated by major volcanic eruptions during the last millennium—the contraction of the GLM area is substantially amplified beyond a simple linear combination of the individual driver effects. This non-linear response appears to be mechanistically driven by an intensified and potentially non-linearly modulated suppression of the hydrological cycle, particularly summer precipitation, leading to the widespread and concurrent failure of both the APR and SPF criteria at the monsoon margins. These findings, detailing a significant GLM area contraction under volcanically forced cooling conditions, stand in stark contrast to the general monsoon area expansion often projected under future anthropogenic global warming scenarios (driven primarily by increased greenhouse gases) and observed during warmer paleoclimatic intervals such as the Holocene [10,12,13,46,48]. This underscores the fundamental principle that the sign, nature, and interplay of dominant climatic forcings critically determine the direction and magnitude of monsoon area response. For example, our regression analysis demonstrates the higher sensitivity of the GLM area to GMST compared to TPTG. In a future where GHG warming is concurrent with a potential increase in El Niño-like conditions, the strong expansionary influence of warming would likely overwhelm the weaker contractional influence from TPTG changes, leading to the projected net expansion. This consistency validates that the fundamental driver sensitivities identified in our paleoclimate study are relevant for interpreting future projections. Furthermore, the complex, non-linear behavior identified here for the last millennium provides a crucial analog and a cautionary perspective for assessing potential monsoon system responses to future compound events, where background anthropogenic warming may interact with modes of natural variability like ENSO or exceptional volcanic activity. Such interactions could yield similarly complex and non-additive outcomes, posing significant challenges for regional climate prediction and adaptation strategies [3,19,35,65].

5. Conclusions

This study provides a new perspective on last millennium of monsoon variability by shifting the focus from the well-studied metric of intensity to the often-overlooked dimension of spatial area. Our findings reveal that the GLM area is not merely a passive reflection of its intensity; instead, it is governed by distinct sensitivities and response mechanisms that represent a fundamental decoupling in the monsoon system.
We demonstrated that while GMST and TPTG are key drivers explaining a third of the forced GLM area variance, the area’s sensitivity to these forcings is markedly lower than that of intensity. The most significant conceptual advance of our work is the discovery of a strong non-linear amplification in the area’s response to compound forcing. This behavior, which contrasts with the largely linear response of monsoon intensity, challenges the common assumption of additivity in climate attribution. We provide a physical mechanism for this non-linearity, showing that it arises from a widespread, concurrent failure of the threshold-based APR and SPF criteria at the monsoon margins.
These findings have critical implications for the climate science community. They offer a new framework for interpreting paleoclimate reconstructions, suggesting that proxy records from monsoon core and marginal zones may reflect these decoupled intensity and area responses, respectively. Furthermore, our work serves as a strong recommendation for future climate projections. To accurately assess the risks of abrupt shifts in water availability for billions of people, climate models must account for the potential for such non-linear behavior at monsoon boundaries, especially when simulating compound events involving both anthropogenic warming and strong natural variability. However, several limitations should be acknowledged. This study relies on a single model (CESM1), and, while its performance is well-documented, inter-model differences exist, particularly in regional precipitation simulation, climate sensitivity, and the parameterization of convection, which can influence the stability of monsoon thresholds. The use of an 11-year filter might obscure responses at shorter timescales that could affect boundaries. The GLM area definition relies on fixed thresholds, and sensitivity to these thresholds exists, although the main conclusions regarding driver responses are likely robust. Further work exploring these aspects using multi-model ensembles, such as those from the Paleoclimate Modelling Intercomparison Project Phase 4 (PMIP4) once the data becomes fully available, would be valuable to assess the generalizability of our findings.

Supplementary Materials

The following supporting information can be downloaded at: https://www.mdpi.com/article/10.3390/atmos16080952/s1, Figure S1: Composite mean surface temperature anomalies (K; shading) relative to the CTRL climatology under different driver episodes. Anomalies are shown for (a) Cool-GMST-only episodes, (b) Weak-TPTG-only episodes, and (c) compound (Concurrent) episodes. Figure S2: Scatter plots showing the relationship between driver anomalies and Global Land Monsoon Area (GLMA) percentage anomalies (%) during single-driver episodes. Relationships are shown for (a) Global Mean Surface Temperature (GMST) anomaly vs. GLMA anomaly during Cool-GMST-only episodes (blue dots), and (b) Tropical Pacific Temperature Gradient (TPTG) anomaly vs. GLMA anomaly during Weak-TPTG-only episodes (orange dots). Each dot represents an individual identified episode. Figure S3: Composite mean precipitation anomalies (mm/day) for regional and large-scale domains under different driver scenarios. Comparisons are shown for Cool-GMST-only (blue bars), Weak-TPTG-only (orange bars), and compound (Concurrent; green bars) episodes relative to the CTRL climatology. Panels display anomalies for: (a) Local Summer Precipitation, (b) Local Winter Precipitation, and (c) Annual Precipitation Range (APR, defined as Local Summer minus Local Winter precipitation). Figure S4: Composite mean anomalies in seasonal/annual precipitation sums and summer precipitation fraction under different driver scenarios. Comparisons are shown for Cool-GMST-only (blue bars), Weak-TPTG-only (orange bars), and Compound (Concurrent; green bars) episodes relative to the CTRL climatology. Panels display anomalies for: (a) Local Summer Precipitation Sum (mm/day), (b) Annual Precipitation Sum (mm/day), and (c) Summer Precipitation Fraction (SPF, %). Figure S5: Box plots comparing the net change in Global Land Monsoon Area (GLMA), quantified by the number of grid cells, within different sub-regions under Cool-GMST-only and Weak-TPTG-only driver scenarios. Each panel represents a major monsoon region: EAS, SAS, NAF, NAMS, AUMSC, and SAMS, further divided into specified sub-regions on the x-axis. Box plots illustrate the distribution of net GLMA changes across all identified episodes for Cool-GMST-only (blue boxes) and Weak-TPTG-only (orange boxes) scenarios. Figure S6: Composite mean anomalies and threshold crossing probability changes for Annual Precipitation Range (APR) and Summer Precipitation Fraction (SPF) under Compound (Concurrent) conditions. Panel (a) displays the APR anomaly (mm/day; shading) and the change in probability of APR exceeding the 2.0 mm/day threshold relative to the CTRL climatology (dots). Panel (b) displays the SPF anomaly (%; shading) and the change in probability of SPF exceeding the 55% threshold relative to the CTRL climatology (dots). For the dots in both panels: green indicates an increased probability of exceeding the threshold in the Compound scenario compared to CTRL, while brown indicates a decreased probability. The size of the dot corresponds to the magnitude of this probability change, according to the legend categories.

Author Contributions

Z.W. conceived the original idea and supervised the study. S.G. performed the data analysis, created the figures, and wrote the original manuscript draft. J.J. provided critical feedback and reviewed the manuscript. All authors have read and agreed to the published version of the manuscript.

Funding

This work was supported by the Key Special Funding for the National Key R&D Plan (Grant No. 2023YFE0103500), the Second Tibetan Plateau Scientific Expedition and Research Program (STEP) (Grant No. 2019QZKK0306), and the National Natural Science Foundation of China (Grant No. 42171164).

Data Availability Statement

The CESM Last Millennium Ensemble project data are publicly available and can be accessed via the Earth System Grid Federation (ESGF) nodes, for example, at https://www.earthsystemgrid.org/dataset/ucar.cgd.ccsm4.CESM_CAM5_LME.html (accessed on 6 August 2025).

Acknowledgments

We thank Laurent Li for valuable input to this study. We also thank Yongqiu Wu for guidance on research ideas. We are also grateful to Wenxia Zhang for technical assistance, and to Mi Yan and Wenmin Man for their insightful suggestions. We acknowledge the National Center for Atmospheric Research (NCAR) for providing the CESM-LME simulation output used in this study.

Conflicts of Interest

The authors declare no conflicts of interest.

References

  1. Trenberth, K.E.; Branstator, G.W.; Karoly, D.; Kumar, A.; Lau, N.; Ropelewski, C. Progress During TOGA in Understanding and Modeling Global Teleconnections Associated with Tropical Sea Surface Temperatures. J. Geophys. Res. Oceans 1998, 103, 14291–14324. [Google Scholar] [CrossRef]
  2. Webster, P.J.; Magaña, V.O.; Palmer, T.N.; Shukla, J.; Tomas, R.A.; Yanai, M.; Yasunari, T. Monsoons: Processes, Predictability, and the Prospects for Prediction. J. Geophys. Res. Oceans 1998, 103, 14451–14510. [Google Scholar] [CrossRef]
  3. Zhou, T.; Zhang, L.; Li, H. Changes in Global Land Monsoon Area and Total Rainfall Accumulation over the Last Half Century. Geophys. Res. Lett. 2008, 35, L16707. [Google Scholar] [CrossRef]
  4. Vecchi, G.A.; Soden, B.J.; Wittenberg, A.T.; Held, I.M.; Leetmaa, A.; Harrison, M.J. Weakening of Tropical Pacific Atmospheric Circulation Due to Anthropogenic Forcing. Nature 2006, 441, 73–76. [Google Scholar] [CrossRef]
  5. Collins, M.; An, S.-I.; Cai, W.; Ganachaud, A.; Guilyardi, E.; Jin, F.-F.; Jochum, M.; Lengaigne, M.; Power, S.; Timmermann, A.; et al. The Impact of Global Warming on the Tropical Pacific Ocean and El Niño. Nat. Geosci. 2010, 3, 391–397. [Google Scholar] [CrossRef]
  6. Power, S.; Delage, F.; Chung, C.; Kociuba, G.; Keay, K. Robust Twenty-First-Century Projections of El Niño and Related Precipitation Variability. Nature 2013, 502, 541–545. [Google Scholar] [CrossRef]
  7. Wang, B.; Liu, J.; Kim, H.-J.; Webster, P.J.; Yim, S.-Y. Recent Change of the Global Monsoon Precipitation (1979–2008). Clim. Dyn. 2012, 39, 1123–1135. [Google Scholar] [CrossRef]
  8. Wang, B.; Ding, Q. Changes in Global Monsoon Precipitation over the Past 56 Years. Geophys. Res. Lett. 2006, 33, L06711. [Google Scholar] [CrossRef]
  9. Wang, B.; Ding, Q. Global Monsoon: Dominant Mode of Annual Variation in the Tropics. Dyn. Atmos. Oceans 2008, 44, 165–183. [Google Scholar] [CrossRef]
  10. Kitoh, A.; Endo, H.; Krishna Kumar, K.; Cavalcanti, I.F.A.; Goswami, P.; Zhou, T. Monsoons in a Changing World: A Regional Perspective in a Global Context. J. Geophys. Res. Atmos. 2013, 118, 3053–3065. [Google Scholar] [CrossRef]
  11. Held, I.M.; Soden, B.J. Robust Responses of the Hydrological Cycle to Global Warming. J. Clim. 2006, 19, 5686–5699. [Google Scholar] [CrossRef]
  12. Hsu, P.; Li, T.; Luo, J.; Murakami, H.; Kitoh, A.; Zhao, M. Increase of Global Monsoon Area and Precipitation under Global Warming: A Robust Signal? Geophys. Res. Lett. 2012, 39, L06701. [Google Scholar] [CrossRef]
  13. Lee, J.-Y.; Wang, B. Future Change of Global Monsoon in the CMIP5. Clim. Dyn. 2014, 42, 101–119. [Google Scholar] [CrossRef]
  14. Wang, B.; Xiang, B.; Lee, J.-Y. Subtropical High Predictability Establishes a Promising Way for Monsoon and Tropical Storm Predictions. Proc. Natl. Acad. Sci. USA 2013, 110, 2718–2722. [Google Scholar] [CrossRef] [PubMed]
  15. Zuo, M.; Man, W.; Zhou, T. Dependence of Global Monsoon Response to Volcanic Eruptions on the Background Oceanic States. J. Clim. 2021, 34, 8273–8289. [Google Scholar] [CrossRef]
  16. Ropelewski, C.F.; Halpert, M.S. Global and Regional Scale Precipitation Patterns Associated with the El Niño/Southern Oscillation. Mon. Wea. Rev. 1987, 115, 1606–1626. [Google Scholar] [CrossRef]
  17. Kumar, K.K.; Rajagopalan, B.; Cane, M.A. On the Weakening Relationship Between the Indian Monsoon and ENSO. Science 1999, 284, 2156–2159. [Google Scholar] [CrossRef]
  18. Wang, B.; Wu, R.; Fu, X. Pacific–East Asian Teleconnection: How Does ENSO Affect East Asian Climate? J. Clim. 2000, 13, 1517–1536. [Google Scholar] [CrossRef]
  19. Asutosh, A.; Vinoj, V.; Landu, K.; Wang, H. Fast Response of Global Monsoon Area and Precipitation to Regional Carbonaceous Aerosols. Atmos. Res. 2024, 304, 107354. [Google Scholar] [CrossRef]
  20. Marvel, K.; Schmidt, G.A.; Miller, R.L.; Nazarenko, L.S. Implications for Climate Sensitivity from the Response to Individual Forcings. Nat. Clim. Chang. 2016, 6, 386–389. [Google Scholar] [CrossRef]
  21. Wu, T.; Hu, A.; Gao, F.; Zhang, J.; Meehl, G.A. New Insights into Natural Variability and Anthropogenic Forcing of Global/Regional Climate Evolution. npj Clim. Atmos. Sci. 2019, 2, 18. [Google Scholar] [CrossRef]
  22. Polson, D.; Bollasina, M.; Hegerl, G.C.; Wilcox, L.J. Decreased Monsoon Precipitation in the Northern Hemisphere Due to Anthropogenic Aerosols. Geophys. Res. Lett. 2014, 41, 6023–6029. [Google Scholar] [CrossRef]
  23. Miller, G.H.; Geirsdóttir, Á.; Zhong, Y.; Larsen, D.J.; Otto-Bliesner, B.L.; Holland, M.M.; Bailey, D.A.; Refsnider, K.A.; Lehman, S.J.; Southon, J.R.; et al. Abrupt Onset of the Little Ice Age Triggered by Volcanism and Sustained by Sea-ice/Ocean Feedbacks. Geophys. Res. Lett. 2012, 39, L02708. [Google Scholar] [CrossRef]
  24. Robock, A. Volcanic Eruptions and Climate. Rev. Geophys. 2000, 38, 191–219. [Google Scholar] [CrossRef]
  25. Crowley, T.J. Causes of Climate Change Over the Past 1000 Years. Science 2000, 289, 270–277. [Google Scholar] [CrossRef]
  26. Jungclaus, J.H.; Bard, E.; Baroni, M.; Braconnot, P.; Cao, J.; Chini, L.P.; Egorova, T.; Evans, M.; González-Rouco, J.F.; Goosse, H.; et al. The PMIP4 Contribution to CMIP6—Part 3: The Last Millennium, Scientific Objective, and Experimental Design for the PMIP4 Past1000 Simulations. Geosci. Model Dev. 2017, 10, 4005–4033. [Google Scholar] [CrossRef]
  27. Clement, A.C.; Seager, R.; Cane, M.A.; Zebiak, S.E. An Ocean Dynamical Thermostat. J. Clim. 1996, 9, 2190–2196. [Google Scholar] [CrossRef]
  28. Brad Adams, J.; Mann, M.E.; Ammann, C.M. Proxy Evidence for an El Niño-like Response to Volcanic Forcing. Nature 2003, 426, 274–278. [Google Scholar] [CrossRef] [PubMed]
  29. Emile-Geay, J.; Seager, R.; Cane, M.A.; Cook, E.R.; Haug, G.H. Volcanoes and ENSO over the Past Millennium. J. Clim. 2008, 21, 3134–3148. [Google Scholar] [CrossRef]
  30. McGregor, S.; Timmermann, A. The Effect of Explosive Tropical Volcanism on ENSO. J. Clim. 2011, 24, 2178–2191. [Google Scholar] [CrossRef]
  31. Zuo, M.; Man, W.; Zhou, T.; Guo, Z. Different Impacts of Northern, Tropical, and Southern Volcanic Eruptions on the Tropical Pacific SST in the Last Millennium. J. Clim. 2018, 31, 6729–6744. [Google Scholar] [CrossRef]
  32. Zuo, M.; Zhou, T.; Man, W. Hydroclimate Responses over Global Monsoon Regions Following Volcanic Eruptions at Different Latitudes. J. Clim. 2019, 32, 4367–4385. [Google Scholar] [CrossRef]
  33. Zuo, M.; Zhou, T.; Man, W.; Chen, X.; Liu, J.; Liu, F.; Gao, C. Volcanoes and Climate: Sizing up the Impact of the Recent Hunga Tonga-Hunga Ha’apai Volcanic Eruption from a Historical Perspective. Adv. Atmos. Sci. 2022, 39, 1986–1993. [Google Scholar] [CrossRef]
  34. Man, W.; Zuo, M.; Zhou, T.; Fasullo, J.T.; Bethke, I.; Chen, X.; Zou, L.; Wu, B. Potential Influences of Volcanic Eruptions on Future Global Land Monsoon Precipitation Changes. Earth’s Future 2021, 9, e2020EF001803. [Google Scholar] [CrossRef]
  35. Sun, W.; Wang, B.; Chen, D.; Gao, C.; Lu, G.; Liu, J. Global Monsoon Response to Tropical and Arctic Stratospheric Aerosol Injection. Clim. Dyn. 2020, 55, 2107–2121. [Google Scholar] [CrossRef]
  36. Zhou, T.; Wu, B.; Dong, L.; Zhou, T.; Wu, B.; Dong, L. Advances in Research of ENSO Changes and the Associated Impacts on Asian-Pacific Climate. Asia-Pac. J. Atmos. Sci. 2014, 50, 405–422. [Google Scholar] [CrossRef]
  37. Liu, F.; Chai, J.; Wang, B.; Liu, J.; Zhang, X.; Wang, Z. Global Monsoon Precipitation Responses to Large Volcanic Eruptions. Sci. Rep. 2016, 6, 24331. [Google Scholar] [CrossRef] [PubMed]
  38. Wang, Z.; Li, L.Z.X.; Shi, X.; Wang, J.; Jia, J. Influence of Natural External Forcings on Interdecadal Variation of Global Land Monsoon over the Last Millennium in CESM-LME. J. Clim. 2024, 37, 4807–4820. [Google Scholar] [CrossRef]
  39. Wang, Z.; Li, L.Z.X.; Hu, F.; Wang, J.; Jia, J. Decadal Responses of Global Land Monsoon to Two Surface Thermal Modes in the Last Millennium. J. Clim. 2025. Under Review. [Google Scholar]
  40. Otto-Bliesner, B.L.; Brady, E.C.; Fasullo, J.; Jahn, A.; Landrum, L.; Stevenson, S.; Rosenbloom, N.; Mai, A.; Strand, G. Climate Variability and Change since 850 CE: An Ensemble Approach with the Community Earth System Model. Bull. Am. Meteorol. Soc. 2016, 97, 735–754. [Google Scholar] [CrossRef]
  41. Stevenson, S.; Otto-Bliesner, B.; Fasullo, J.; Brady, E. “El Niño Like” Hydroclimate Responses to Last Millennium Volcanic Eruptions. J. Clim. 2016, 29, 2907–2921. [Google Scholar] [CrossRef]
  42. Liu, J.; Wang, B.; Yim, S.-Y.; Lee, J.-Y.; Jhun, J.-G.; Ha, K.-J. What Drives the Global Summer Monsoon over the Past Millennium? Clim. Dyn. 2012, 39, 1063–1072. [Google Scholar] [CrossRef]
  43. Zinke, J.; Browning, S.A.; Hoell, A.; Goodwin, I.D. The West Pacific Gradient Tracks ENSO and Zonal Pacific Sea Surface Temperature Gradient During the Last Millennium. Sci. Rep. 2021, 11, 20395. [Google Scholar] [CrossRef] [PubMed]
  44. Gao, C.; Robock, A.; Ammann, C. Volcanic Forcing of Climate over the Past 1500 Years: An Improved Ice Core-Based Index for Climate Models. J. Geophys. Res. Atmos. 2008, 113, D23111. [Google Scholar] [CrossRef]
  45. Lean, J.L. Cycles and Trends in Solar Irradiance and Climate. WIREs Clim. Chang. 2010, 1, 111–122. [Google Scholar] [CrossRef]
  46. Wang, J.; Lu, H.; Cheng, J.; Zhao, C. Global Terrestrial Monsoon Area Variations since Last Glacial Maximum Based on TraCE21ka and PMIP4-CMIP6 Simulations. Glob. Planet. Chang. 2023, 231, 104308. [Google Scholar] [CrossRef]
  47. Jiang, D.; Tian, Z.; Lang, X.; Kageyama, M.; Ramstein, G. The Concept of Global Monsoon Applied to the Last Glacial Maximum: A Multi-Model Analysis. Quat. Sci. Rev. 2015, 126, 126–139. [Google Scholar] [CrossRef]
  48. Jiang, D.; Tian, Z.; Lang, X. Mid-Holocene Global Monsoon Area and Precipitation from PMIP Simulations. Clim. Dyn. 2015, 44, 2493–2512. [Google Scholar] [CrossRef]
  49. Yan, M.; Wang, B.; Liu, J. Global Monsoon Change During the Last Glacial Maximum: A Multi-Model Study. Clim. Dyn. 2016, 47, 359–374. [Google Scholar] [CrossRef]
  50. Chen, J.; Chen, F.; Feng, S.; Huang, W.; Liu, J.; Zhou, A. Hydroclimatic Changes in China and Surroundings During the Medieval Climate Anomaly and Little Ice Age: Spatial Patterns and Possible Mechanisms. Quat. Sci. Rev. 2015, 107, 98–111. [Google Scholar] [CrossRef]
  51. Chen, J.; Liu, J.; Zhang, X.; Chen, S.; Huang, W.; Chen, J.; Zhang, S.; Zhou, A.; Chen, F. Unstable Little Ice Age Climate Revealed by High-Resolution Proxy Records from Northwestern China. Clim. Dyn. 2019, 53, 1517–1526. [Google Scholar] [CrossRef]
  52. Liu, J.; Chen, J.; Zhang, X.; Li, Y.; Rao, Z.; Chen, F. Holocene East Asian Summer Monsoon Records in Northern China and Their Inconsistency with Chinese Stalagmite δ18O Records. Earth-Sci. Rev. 2015, 148, 194–208. [Google Scholar] [CrossRef]
  53. Liu, J.; Chen, S.; Chen, J.; Zhang, Z.; Chen, F. Chinese Cave δ18O Records Do Not Represent Northern East Asian Summer Monsoon Rainfall. Proc. Natl. Acad. Sci. USA 2017, 114, E2987–E2988. [Google Scholar] [CrossRef]
  54. Wang, H.; Xie, S.-P.; Kosaka, Y.; Liu, Q.; Du, Y. Dynamics of Asian Summer Monsoon Response to Anthropogenic Aerosol Forcing. J. Clim. 2019, 32, 843–858. [Google Scholar] [CrossRef]
  55. Chen, F.; Chen, J.; Huang, W.; Chen, S.; Huang, X.; Jin, L.; Jia, J.; Zhang, X.; An, C.; Zhang, J.; et al. Westerlies Asia and Monsoonal Asia: Spatiotemporal Differences in Climate Change and Possible Mechanisms on Decadal to Sub-Orbital Timescales. Earth-Sci. Rev. 2019, 192, 337–354. [Google Scholar] [CrossRef]
  56. Webster, P.J.; Yang, S. Monsoon and Enso: Selectively Interactive Systems. Q. J. R. Meteorol. Soc. 1992, 118, 877–926. [Google Scholar] [CrossRef]
  57. Liu, Y.; Lo, L.; Shi, Z.; Wei, K.-Y.; Chou, C.-J.; Chen, Y.-C.; Chuang, C.-K.; Wu, C.-C.; Mii, H.-S.; Peng, Z.; et al. Obliquity Pacing of the Western Pacific Intertropical Convergence Zone over the Past 282,000 Years. Nat. Commun. 2015, 6, 10018. [Google Scholar] [CrossRef]
  58. Chen, Z.; Zhou, T.; Chen, X.; Zhang, W.; Zhang, L.; Wu, M.; Zou, L. Observationally Constrained Projection of Afro-Asian Monsoon Precipitation. Nat. Commun. 2022, 13, 2552. [Google Scholar] [CrossRef]
  59. Nicholson, S.E. Climate and Climatic Variability of Rainfall over Eastern Africa. Rev. Geophys. 2017, 55, 590–635. [Google Scholar] [CrossRef]
  60. Palmer, P.I.; Wainwright, C.M.; Dong, B.; Maidment, R.I.; Wheeler, K.G.; Gedney, N.; Hickman, J.E.; Madani, N.; Folwell, S.S.; Abdo, G.; et al. Drivers and Impacts of Eastern African Rainfall Variability. Nat. Rev. Earth Environ. 2023, 4, 254–270. [Google Scholar] [CrossRef]
  61. Chevalier, M.; Brewer, S.; Chase, B.M. Qualitative Assessment of PMIP3 Rainfall Simulations across the Eastern African Monsoon Domains During the Mid-Holocene and the Last Glacial Maximum. Quat. Sci. Rev. 2017, 156, 107–120. [Google Scholar] [CrossRef]
  62. Khodri, M.; Izumo, T.; Vialard, J.; Janicot, S.; Cassou, C.; Lengaigne, M.; Mignot, J.; Gastineau, G.; Guilyardi, E.; Lebas, N.; et al. Tropical Explosive Volcanic Eruptions Can Trigger El Niño by Cooling Tropical Africa. Nat. Commun. 2017, 8, 778. [Google Scholar] [CrossRef]
  63. Pausata, F.S.R.; Zhao, Y.; Zanchettin, D.; Caballero, R.; Battisti, D.S. Revisiting the Mechanisms of ENSO Response to Tropical Volcanic Eruptions. Geophys. Res. Lett. 2023, 50, e2022GL102183. [Google Scholar] [CrossRef]
  64. Zuo, M.; Zhou, T.; Man, W. Response of Summer Precipitation over the Tibetan Plateau to Large Tropical Volcanic Eruptions in the Last Millennium. Clim. Dyn. 2023, 60, 3121–3138. [Google Scholar] [CrossRef]
  65. Moon, S.; Ha, K.-J.; Lee, S.-S. Impact of Anthropogenic Warming on Emergence of Extreme Precipitation over Global Land Monsoon Area. Environ. Res. Lett. 2024, 19, 034018. [Google Scholar] [CrossRef]
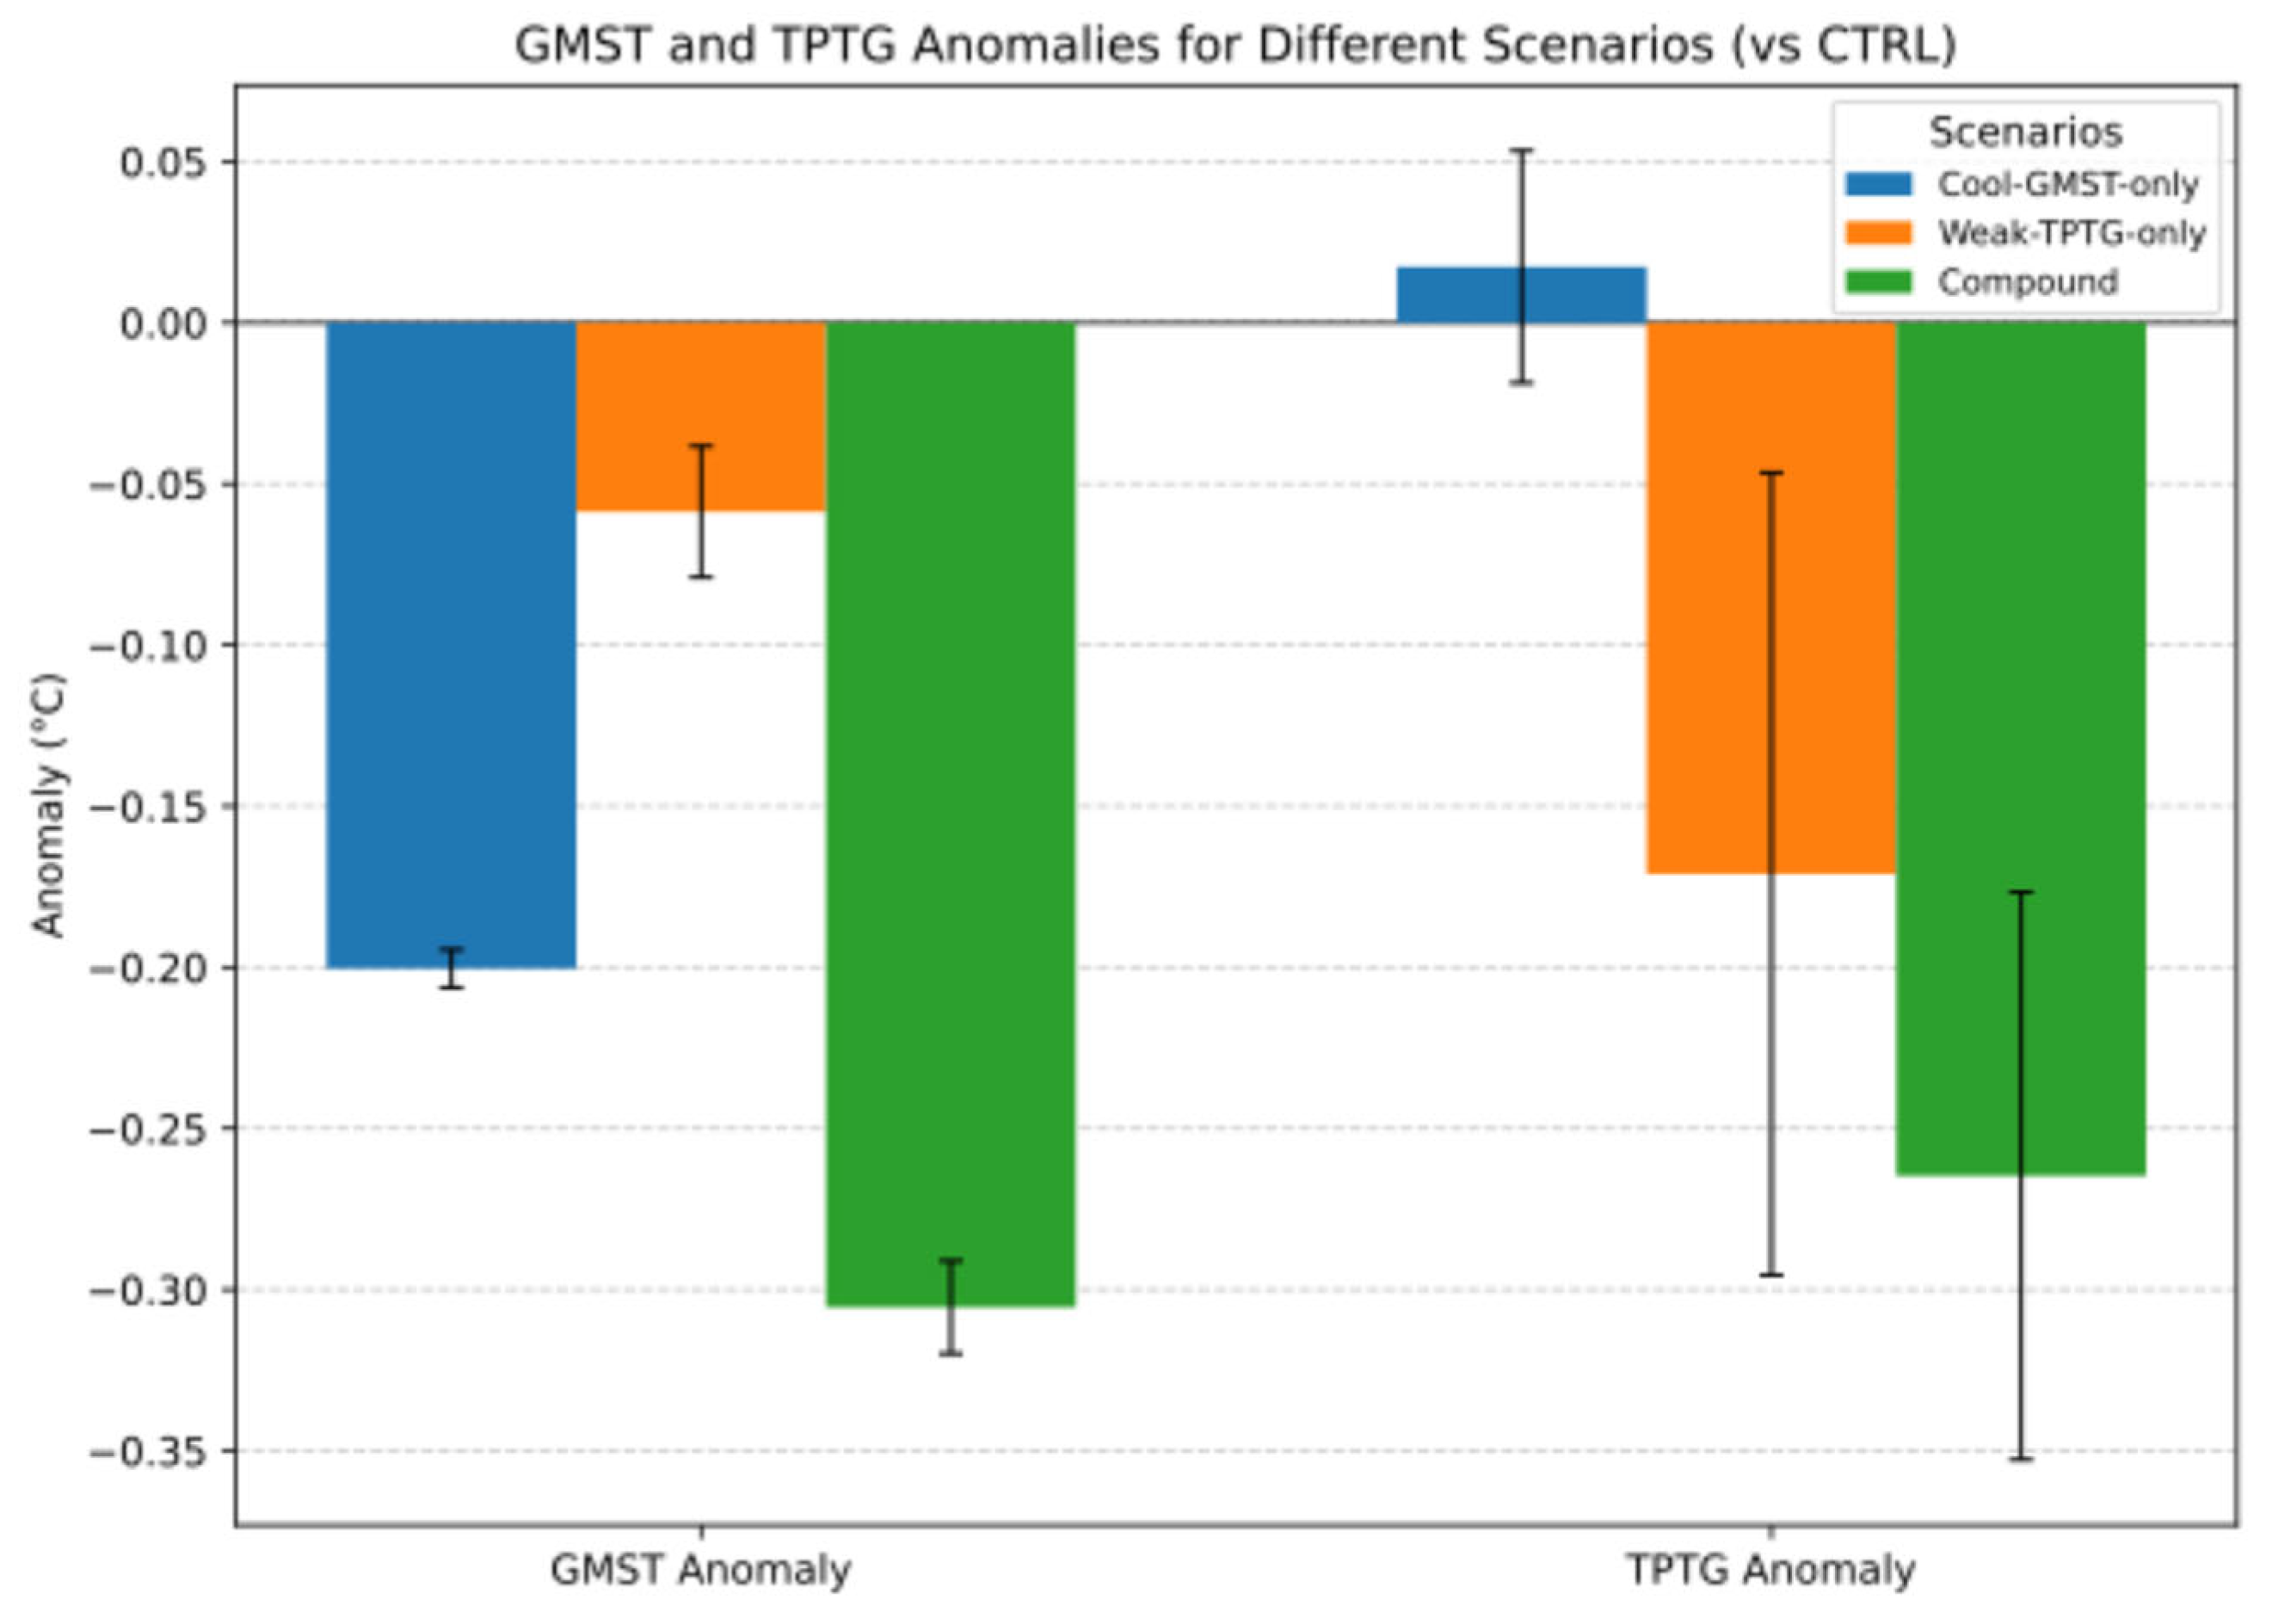
Figure 1. Average anomalies (°C) of global mean surface temperature (GMST) and tropical Pacific temperature gradient (TPTG) for the three defined driver episodes: Cool-GMST-only (blue), Weak-TPTG-only (orange), and Compound (green). Anomalies are calculated relative to the 1151-year CTRL climatology (11-year smoothed). Error bars represent the 5–95% confidence interval derived from 10,000 bootstrap iterations across the episodes within each category.
Atmosphere 16 00952 g001
Figure 2. Time series of 11-year moving averaged global land monsoon area percentage anomalies (%) relative to the 1151-year CTRL climatology (11-year smoothed) for (a) Global, (b) Northern Hemisphere (NH), and (c) Southern Hemisphere (SH) domains. Dark green lines show the 13-member ensemble mean, representing the forced response. Light green shading indicates the 90% confidence interval derived from the ensemble spread, illustrating the range including internal variability. Red dashed lines indicate the −1.5 standard deviation level (calculated based on the 950–1850 variability of the ensemble mean itself), shown for reference to highlight periods of strong negative forced anomalies relevant to episode selection criteria.
Atmosphere 16 00952 g002
Figure 3. Composite mean anomalies (%) of regional Land Monsoon Area relative to the CTRL climatology for (a) Cool-GMST-only episodes, (b) Weak-TPTG-only episodes, and (c) Compound episodes. Regions shown are East Asia (EAS), South Asia (SAS), North Africa (NAF), North America (NAMS), Australia (AUSMC), South Africa (SAF), South America (SAMS), Southern Hemisphere (SH), Northern Hemisphere (NH), and Global. Error bars represent the 5–95% confidence interval derived from 10,000 bootstrap iterations across the episodes within each category. Calculated from 11-year moving averaged data.
Atmosphere 16 00952 g003
Figure 4. Composite mean difference in monsoon occurrence frequency between driver scenarios and the CTRL climatology. Panels show results for (a) Cool-GMST-only, (b) Weak-TPTG-only, and (c) Compound episodes. Frequency at each grid point is calculated as the arithmetic mean of a binary mask (1 if the grid cell satisfies both APR > 2.0 mm/day and SPF > 55% criteria based on 11-year smoothed data, 0 otherwise) across all episodes within a given scenario. Positive values (blue/green) indicate increased frequency relative to CTRL (expansion tendency), while negative values (brown) indicate decreased frequency (contraction tendency). Red contours outline the climatological (CTRL) GLM domain. Black dashed boxes denote the approximate locations of major regional monsoon domains referenced in the text.
Atmosphere 16 00952 g004
Figure 5. Correlation coefficients between 11-year moving averaged global land monsoon (GLM) area anomalies and (a) global mean surface temperature (GMST) anomalies and (b) tropical Pacific temperature gradient (TPTG) anomalies derived from CESM-LME simulations. The large red dot represents the correlation calculated using the control (CTRL) simulation data from 900 to 1950. The large blue dot shows the correlation between the 13-member ensemble means of the all-forcing runs (ALLR Ens Mean) over 950–1850, representing the forced climate response. Small blue dots indicate the correlations calculated within each of the 13 individual ALLR members (950–1850), thus reflecting both the forced response and member-specific internal variability. Small gray dots represent cross-member correlations, computed between the driver variable (GMST or TPTG) from member i and the GLM are from member j (where i ≠ j, i, j = 1…13; 950–1850 AD). This cross-member approach aims to isolate the common forced signal by removing internal coherence specific to individual members. Dashed vertical lines indicate approximate 95% significance levels for the ensemble mean correlation. TPTG anomalies are calculated relative to the full period mean for each respective time series (CTRL or individual ALLR members).
Atmosphere 16 00952 g005
Figure 6. Composite mean anomalies and threshold-crossing probability changes for annual precipitation range (APR) and summer precipitation fraction (SPF) under different driver scenarios relative to the CTRL climatology. Panels show (a) APR anomaly (mm/day, shading) and probability change in APR > 2.0 mm/day (dots) for Cool-GMST-only episodes. Figure (b) shows the same as (a), but for Weak-TPTG-only episodes. (c) SPF anomaly (%, shading) and probability change in SPF > 55% (dots) for Cool-GMST-only episodes. Figure (d) shows the same as (c), but for Weak-TPTG-only episodes. Shading indicates the magnitude of the APR or SPF anomaly. Dots represent the change in probability of exceeding the respective threshold compared to the CTRL climatology (green indicates increased probability, brown indicates decreased probability; dot size corresponds to the magnitude of probability change as per the legend). Green contours outline the climatological (CTRL) GLM domain. Purple dashed lines likely indicate the climatological threshold contour (APR = 2.0 mm/day in (a,b)); SPF = 55% in (c,d)). Black dashed boxes denote approximate regional monsoon domains. Analyses are based on 11-year smoothed ensemble mean data.
Atmosphere 16 00952 g006
Figure 7. Kernel density estimation plots comparing the distributions of net global land monsoon (GLM) area change per episode under different driver scenarios. GLM area change is quantified as the net change in the number of monsoon grid cells relative to the CTRL climatology for each identified episode. Plots are shown for the Northern Hemisphere (NH), Southern Hemisphere (SH), and Global domains. Distributions are compared for Cool-GMST-only (blue curve; N = 215 episodes), Weak-TPTG-only (orange curve; N = 18 episodes), and Compound (green curve; labeled Concurrent in plot legend; N = 36 episodes) scenarios. Solid vertical lines indicate the median net change for the corresponding scenario distribution. The dashed black vertical line represents zero net change. Data are derived from the collection of net grid cell change values calculated for all identified episodes within each scenario, based on 11-year smoothed ensemble mean data relative to CTRL.
Atmosphere 16 00952 g007
Figure 8. Scatter plots illustrating the net change in global land monsoon (GLM) area as a function of the concurrent global mean surface temperature (GMST) anomaly and tropical Pacific temperature gradient (TPTG) anomaly for each identified episode. GLM area net change is quantified as the net change in the number of monsoon grid cells per episode relative to the CTRL climatology. Panels are shown for the Northern Hemisphere (NH, top), Southern Hemisphere (SH, middle), and Global (bottom) domains. Each dot represents an individual episode. The color of the dot indicates the sign of the net GLM area change (green for expansion/positive change, brown for contraction/negative change), and the size of the dot is proportional to the absolute magnitude of this net change. Dashed blue vertical lines indicate the P10 threshold for extreme GMST cooling (GMST P10 ≈ −0.29 °C). Dashed red horizontal lines indicate the P10 threshold for extreme TPTG weakening (TPTG P10 ≈ −0.19 °C). The intersection of these threshold lines in the lower-left quadrant highlights the domain of “Compound extreme” episodes. Data are derived from 11-year smoothed ensemble mean values for GMST/TPTG anomalies and the corresponding calculated net GLM area change for each episode.
Atmosphere 16 00952 g008
Disclaimer/Publisher’s Note: The statements, opinions and data contained in all publications are solely those of the individual author(s) and contributor(s) and not of MDPI and/or the editor(s). MDPI and/or the editor(s) disclaim responsibility for any injury to people or property resulting from any ideas, methods, instructions or products referred to in the content.