Abstract
Mexico City frequently experiences high near-surface ozone concentrations, and exposure to elevated near-surface ozone causes harmful effects to the inhabitants and the environment of Mexico City. This necessitates developing models for Mexico City that predict near-surface ozone levels in advance. Such models are crucial for regulatory procedures and can save a great deal of near-surface ozone detrimental effects by serving as early warning systems. We utilize three machine-learning models, trained on seven-year data (2015–2021) and tested on one-year data (2022), to forecast the near-surface ozone concentrations. The trained models predict the next day’s 24-h near-surface ozone concentrations for up to one month; before forecasting the following months, the models are trained again and updated. Based on prediction results, the convolutional neural network outperforms the rest of the models on a yearly scale with an index of agreement of 0.93 for three stations, 0.92 for nine stations, and 0.91 for one station.
1. Introduction
Near-surface ozone (O3) is a secondary air pollutant and greenhouse gas that has been widely recognized as a destructive air pollutant having negative impacts on living beings and plants [1,2]. Exposure to elevated O3 concentrations has adverse effects on human health and may cause eye and respiratory irritation, trigger asthma attacks in asthmatics, aggravate cardiovascular disease (CVD), and lung-related diseases [3,4,5,6]. It also causes damage to vegetation, crops, and structures, and plays a key role in photochemical smog. With all these harmful impacts, O3 is one of the most prominent air pollutants, and hence, mitigating O3 pollution is a top priority for environmental protection agencies around the world. O3 is formed when its precursors, volatile organic compounds (VOCs) and nitrogen oxides (NOx), react in the presence of the sun’s ultraviolet radiation [7,8]. Furthermore, the levels of O3 concentrations are influenced by meteorological conditions such as solar radiation, temperature, wind, and water vapor in the atmosphere [9,10,11,12,13,14,15]. Hence, both O3 precursors and meteorological factors have been incorporated as predictors in our O3 prediction models.
Mexico City, located in the tropics within a basin (named Valle de Mexico with an altitude ~2240 m above mean sea level) and surrounded by mountains on the south, east and west sides with an opening to the north, experiences O3 episodes due to constrained basin, intense solar radiation, and anthropogenic pollution (vehicular and industrial emissions; see [16], and references therein). Peak O3 concentrations exceeded 200 parts per billion (ppb) by volume level during an ozone episode lasting for six days (12–17 March 2016). Detailed information on this ozone episode can be found in [17,18,19]. High O3 concentrations during an ozone episode in Mexico City pose serious threats to the public health and the environment, and hence prediction of high O3 concentrations prior to the onset of an ozone episode can save a great deal of damage caused by high-level O3 exposure and provide sufficient time to the individuals and policymakers of Mexico City to take precautionary measures. Thus, it necessitates constructing O3 prediction models for Mexico City, which can forecast the upcoming O3 concentration levels on a local scale with high accuracy. Generally, chemical transport models (CTMs), including Weather Research and Forecasting model coupled with chemistry (WRF-Chem) and the Community Multiscale Air Quality (CMAQ), along with WRF, are utilized to forecast O3 concentrations numerically. As CTMs solve systems of partial differential equations by dividing the given regions into grid cells, they require significant computing resources and time. Furthermore, CTMs forecast ozone concentrations with reasonable accuracy at larger scales, but local fluctuations in ozone concentrations, being below models’ resolutions, are not well simulated. Alternative approaches for the O3 forecast include multiple linear regression (MLR) and machine-learning (ML) models. The MLR model can establish linear dependence of a variable on independent variables quite well; the MLR model is not good at capturing nonlinear dependence of ozone on its predictors [20]. On the other hand, ML models’ complex structure enables them to capture the nonlinear dependence of a variable on other variables. Moreover, ML models with greater accuracy consume less computing power and time. Recent studies (Table 1) show that ML models have been widely utilized to investigate the dependence of O3 on meteorological and environmental variables [21] and to predict and forecast O3 concentrations [22]. A first ML approach was implemented to investigate the build-up of O3 during an ozone episode in Mexico City [18], and a prediction function taking in hourly data of eight predictors (two air quality and six meteorological variables) as input and outputting hourly O3 concentrations was learned with three ML models, and the best model (with 92% accuracy) in conjunction with approach was utilized to simulate O3 concentrations and rank the predictors according to their importance in the build-up of O3. In the research conducted by [23], seven ML models were adopted to provide long-term O3 concentrations forecasting with a high temporal resolution in the Houston region. They used historical air pollution concentration levels, meteorological measurements, and traffic status data to train and test the models. Ref. [24] deployed nineteen machine-learning algorithms to predict O3 pollution at King Abdullah University of Science and Technology (KAUST). The models were trained on ambient pollution and weather data collected at KAUST, located in Thuwal, Saudi Arabia, and the importance of the feature was analyzed with a random forest (RF) model. Ref. [25] applied a deep convolutional neural network (Deep-CNN) to predict daily surface NO2 concentrations over Texas in 2019 and utilized Shapley Additive exPlanations (SHAP) to understand the importance of the predictors in the prediction of NO2 concentrations. Ref. [26] applied the group method of data handling (GMDH) artificial neural network time series to predict carbon dioxide concentrations from 2020 to 2025 for six American cities and proposed ways to reduce carbon dioxide concentrations inside a building. Ref. [27] improved the accuracy of an ML model designed to predict O3 concentrations in Shenzhen, China, applying a combination of three optimization strategies and proved that the hybrid model consisting of a long short-term memory network (LSTM) and a support vector machine (SVM) with wavelet decomposition added in it outperforms the other O3 prediction models. Ref. [28] deployed boosted regression trees (BRT) to analyze the functional dependence of O3 on its precursors and meteorological variables in a region located in Southern Italy, and the trained BRT model simulates O3 concentrations for the whole of 2018 with good accuracy. In the research conducted by [29,30], the deep convolutional neural network (CNN) model was adopted to build O3 forecast models that forecast the next day’s hourly and daily maximum ground-level ozone concentrations for Seoul, South Korea, and Texas, USA, respectively. Ref. [31] trained a CNN model to forecast maximum 8 h average O3 concentrations up to four days using daily statistical data of three air quality and six meteorological variables. Utilizing the bootstrapping technique, it was found that the previous-day O3 plays the most important part in the O3 concentrations forecast under all four time horizons, with two-meter temperature being the second most important predictor. A study conducted in Kuala Lumpur Malaysia trained five ML models including one hybrid model to forecast O3 concentrations up to 24-h time lag using different combinations of air pollutants and meteorological parameters as input variables [32], and it was reported that the hybrid model with seven input variables (ozone, humidity, wind speed, NOX, CO, NO2, SO2) and 12-h time lag has the highest O3 forecast accuracy.

Table 1.
Summary of the studies involving machine-learning models for air quality forecast and prediction.
Recently, there has been a lot of interest in the use of ML models as innovative tools to forecast air quality, especially O3 concentrations, in various parts of the world. However, Mexico City is among the places where the utilization of machine-learning models for O3 forecasting is still scarce. Also, the forecasting capacity of the machine-learning models deteriorates after some time because the machine-learning models trained on some training data cannot forecast forever and need a robust upgradation mechanism. Furthermore, hyperparameter tuning (setting of external parameters that control the learning process of a machine-learning model) of machine-learning models designed to forecast O3 concentrations is both time-consuming and frustrating, especially when the models have to be trained on individual stations. Our proposed research addresses the research gaps highlighted above by the following: (1) Machine-learning models were trained station-wise at 14 monitoring stations across Mexico City to forecast the next day’s 24-h O3 concentrations. (2) The trained machine-learning models forecast next 24-h O3 concentrations up to one month; before forecasting the second month, the models are trained on augmented training data (original training data + one month data); prior to forecasting the third month, the models are trained another time utilizing augmented training data (original training data + one and second months data) and so on. (3) The hyperparameter tuning is applicable to the machine-learning models to train them at any individual station out of 14 monitoring stations across Mexico City, and it obviates the need for models’ hyperparameter tuning again and again (fourteen times in case of fourteen stations).
In this study, the three most representative ML models (convolutional neural network (CNN), feedforward neural network (FNN), and long short-term memory network (LSTM)) trained on seven-year data and evaluated on one-year data (collected at 14 monitoring stations across Mexico City) are considered to forecast O3 in Mexico City, Mexico. The station-wise trained ML models forecast the next 24-h O3 concentrations with high accuracy, taking current-day hourly data of eight predictors (five meteorological and three air quality variables) as input. Such models are crucial for regulatory procedures and can save a great deal of near-surface ozone detrimental effects by serving as early warning systems.
2. Study Area and Data Description
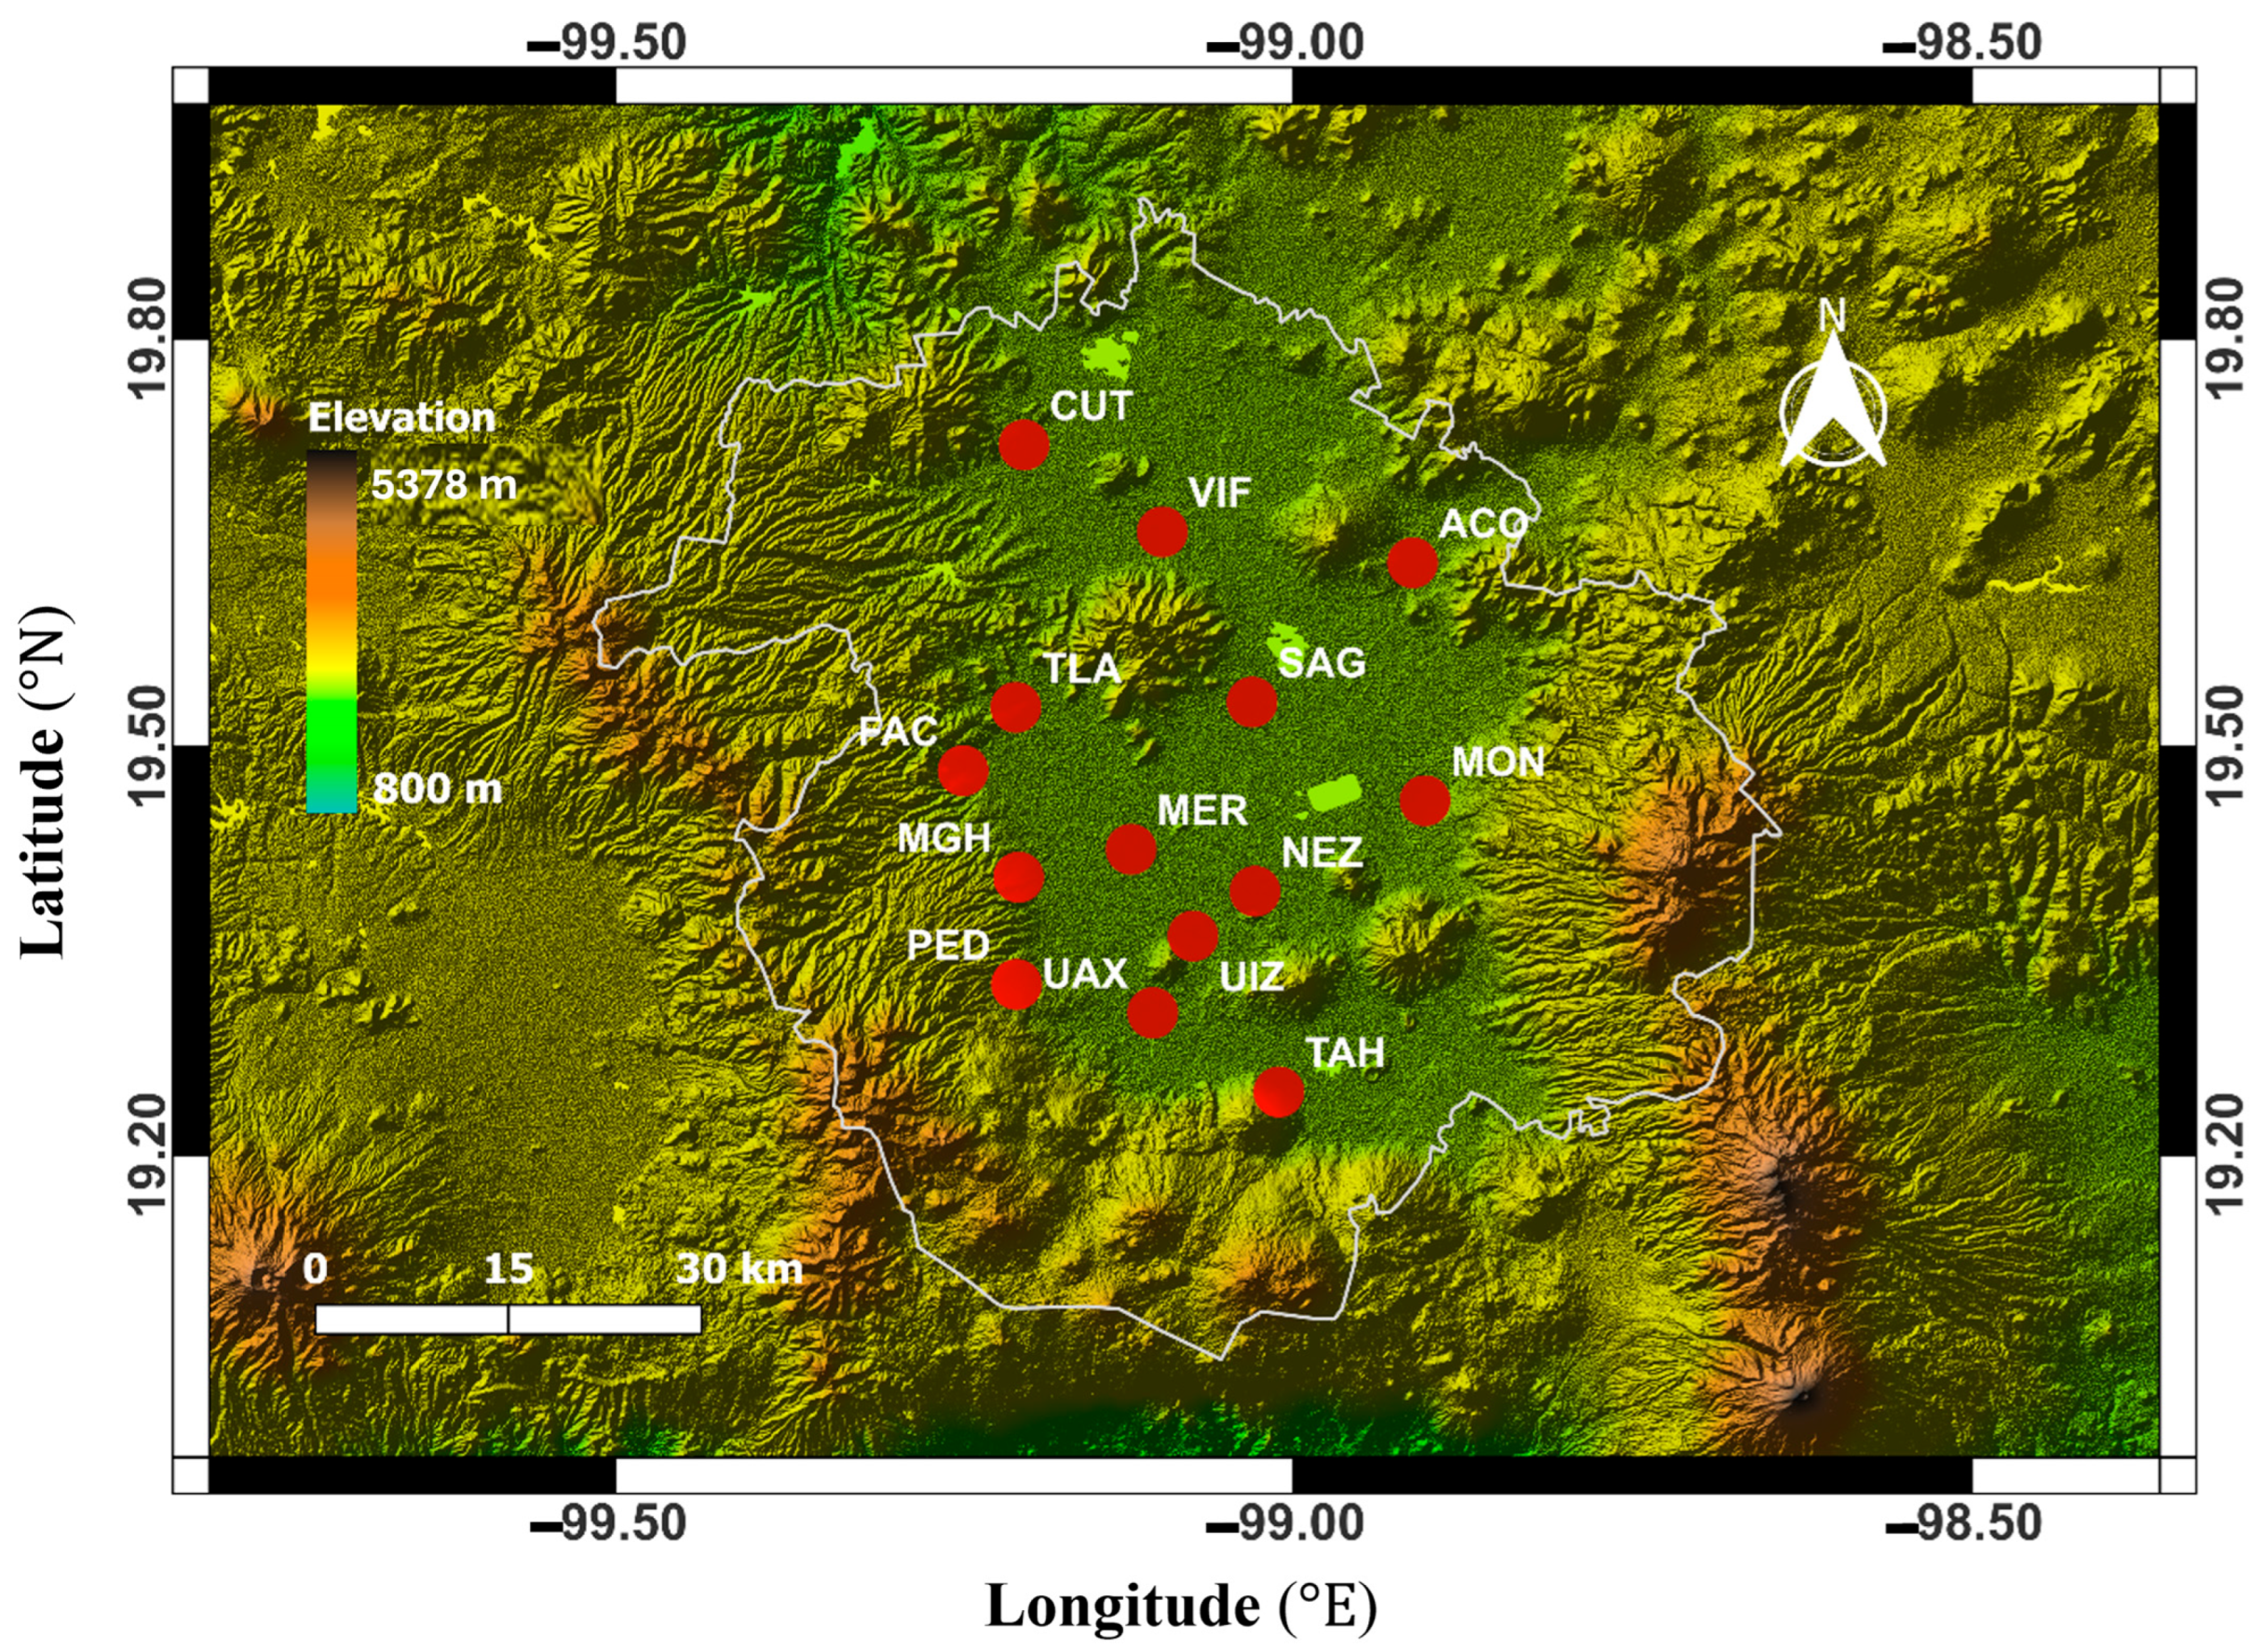
This study focuses on Mexico City, which often experiences air pollution episodes owing to its specific environment and geographical location. The RAMA (Red Automática de Monitoreo Atmosférico) network, with its monitoring stations located across Mexico City, continuously and automatically monitors various air quality and meteorological variables and provides hourly averaged data for air quality assessment and research. All surface air quality and meteorological data for this research was acquired from RAMA network’s monitoring stations including Acolman (ACO, elevation 2257 m), Cuautitlán (CUT, elevation 2252 m), FES Acatlán (FAC, elevation 2287 m), Merced (MER, elevation 2231 m), Miguel Hidalgo (MGH, elevation 2330 m), Montecillo (MON, 2245 m), Nezahualcóyotl (NEZ, 2228 m), Pedregal (PED, 2354 m), San Agustín (SAG, 2230 m), Tláhuac (TAH, 2293 m), Tlalnepantla (TLA, elevation 2289 m), UAM Xochimilco (UAX, elevation 2233 m), UAM Iztapalapa (UIZ, elevation 2250 m), Villa de las Flores (VIF, 2241 m). The geographical locations of the monitoring stations with their acronyms are depicted in Figure 1.
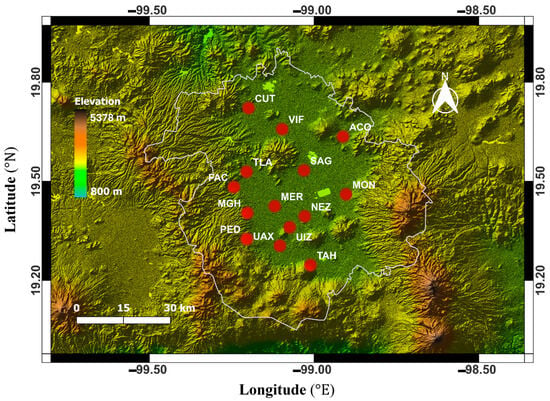
Figure 1.
Geographical locations of the fourteen monitoring stations. The red solid circles with their labels in white color refer to RAMA automatic monitoring stations, and the background color scheme represents the elevation (altitude) above sea level according to the ‘Elevation’ color bar.
As ozone precursors and meteorological indicators significantly affect near-surface ozone (O3) concentrations, they have been incorporated as candidate input variables in our O3 forecast models. Also, it has been reported that the current-day O3 concentrations play an important role in the O3 forecast [31]. Therefore, the air quality and meteorological data, collected from the RAMA network, include hourly averaged O3, nitric oxide, nitrogen dioxide, ambient surface temperature, relative humidity, surface wind speed, wind direction of 14 monitoring stations, and shortwave radiation of four monitoring stations in Mexico City from 1 January 2015 through 31 December 2022. Hitherto, we call these eight years of collected data “historical data”. A master file containing this historical data of the air quality and meteorological variables was constructed for each station. Steps in data preprocessing involve removing any day with more than twelve missing values of any variable, imputing the missing values, and standardizing the data. From the preprocessed master data file, train and test data files are constructed for the ML models’ training and testing. The shortwave radiation data is available only at four stations out of the fourteen selected stations, and for the stations where shortwave radiation data is unavailable, the nearest station with available shortwave radiation data is considered for the shortwave radiation data because shortwave radiation does not change significantly over short distances. The predictors’ abbreviated names, units, and their data’s time resolution are listed in Table 2.

Table 2.
Data used for machine-learning models training and testing for O3 concentration forecasting in Mexico City. Seven-year data (2015–2021) were used to train the models, while one-year data (2022) were utilized to test the performance of the trained machine-learning models.
The selection of the monitoring stations was based on the availability of predictor data for the intended period of time. After carefully analyzing the available data at the monitoring stations, fourteen stations, where hourly data of the predictors from 2015 to 2022 (both inclusive) are available, have been selected to train and test the O3 forecast models. All the stations are in a basin with an elevation ranging from 2228 m to 2354 m. This selection of sites broadly covers the geographic extension of Mexico City with regard to its horizontal topography and its altitude ranges, and also its variation in air pollution exposure. The ozone forecast models were trained and tested on each individual station utilizing the eight years of historical data. Seven years of historical data (2015–2021) were used to train the models, while one year of historical data (2022) was utilized to evaluate the performance of the trained ozone forecast models. The missing values in the historical dataset were imputed with a k-nearest neighbor (KNN) imputer. The KNN imputer nominates the K most similar samples (rows in the dataset) based on the distance from the sample with a missing value of a feature (column in the dataset) and fills in the missing value of the feature by the average value of the feature calculated from the similar samples. A comprehensive explanation of the KNN imputer can be found in [52]. In this study, the KNN imputer was implemented via the Python scikit-learn 0.22 library [53] with the following hyperparameters: (1) number of neighbors as fifteen, (2) weights as uniform, and (3) metric as nan Euclidean.
3. Methodology
The data of the meteorological and air quality variables collected from a monitoring station in Mexico City are put in the form of a matrix X with number of columns equals the number of variables and number of rows equals the number of hours where each column represents hourly data of a variable, and each row contains data of eight variables at a specific hour. The data matrix X is then analyzed day-wise (24 rows at a time), and any day with more than twelve missing values of any variable is discarded to obtain a trimmed data matrix. The missing values in the trimmed data matrix X are imputed by the KNN imputer. As meteorological and air quality variables used for this study have different scales and units, the variable with the largest scale may significantly influence the training process and lead to biased results. To ensure that all the variables are on the same scale and avoid leakage of test data into the training data, first, the training data of a variable was standardized, and then, using the same mean and standard deviation, the test data of the variable was standardized. Mathematically, the standardization of a variable is described by the following equation:
where is the original variable; is the transformed variable; and are ’s training data mean and standard deviation, respectively.
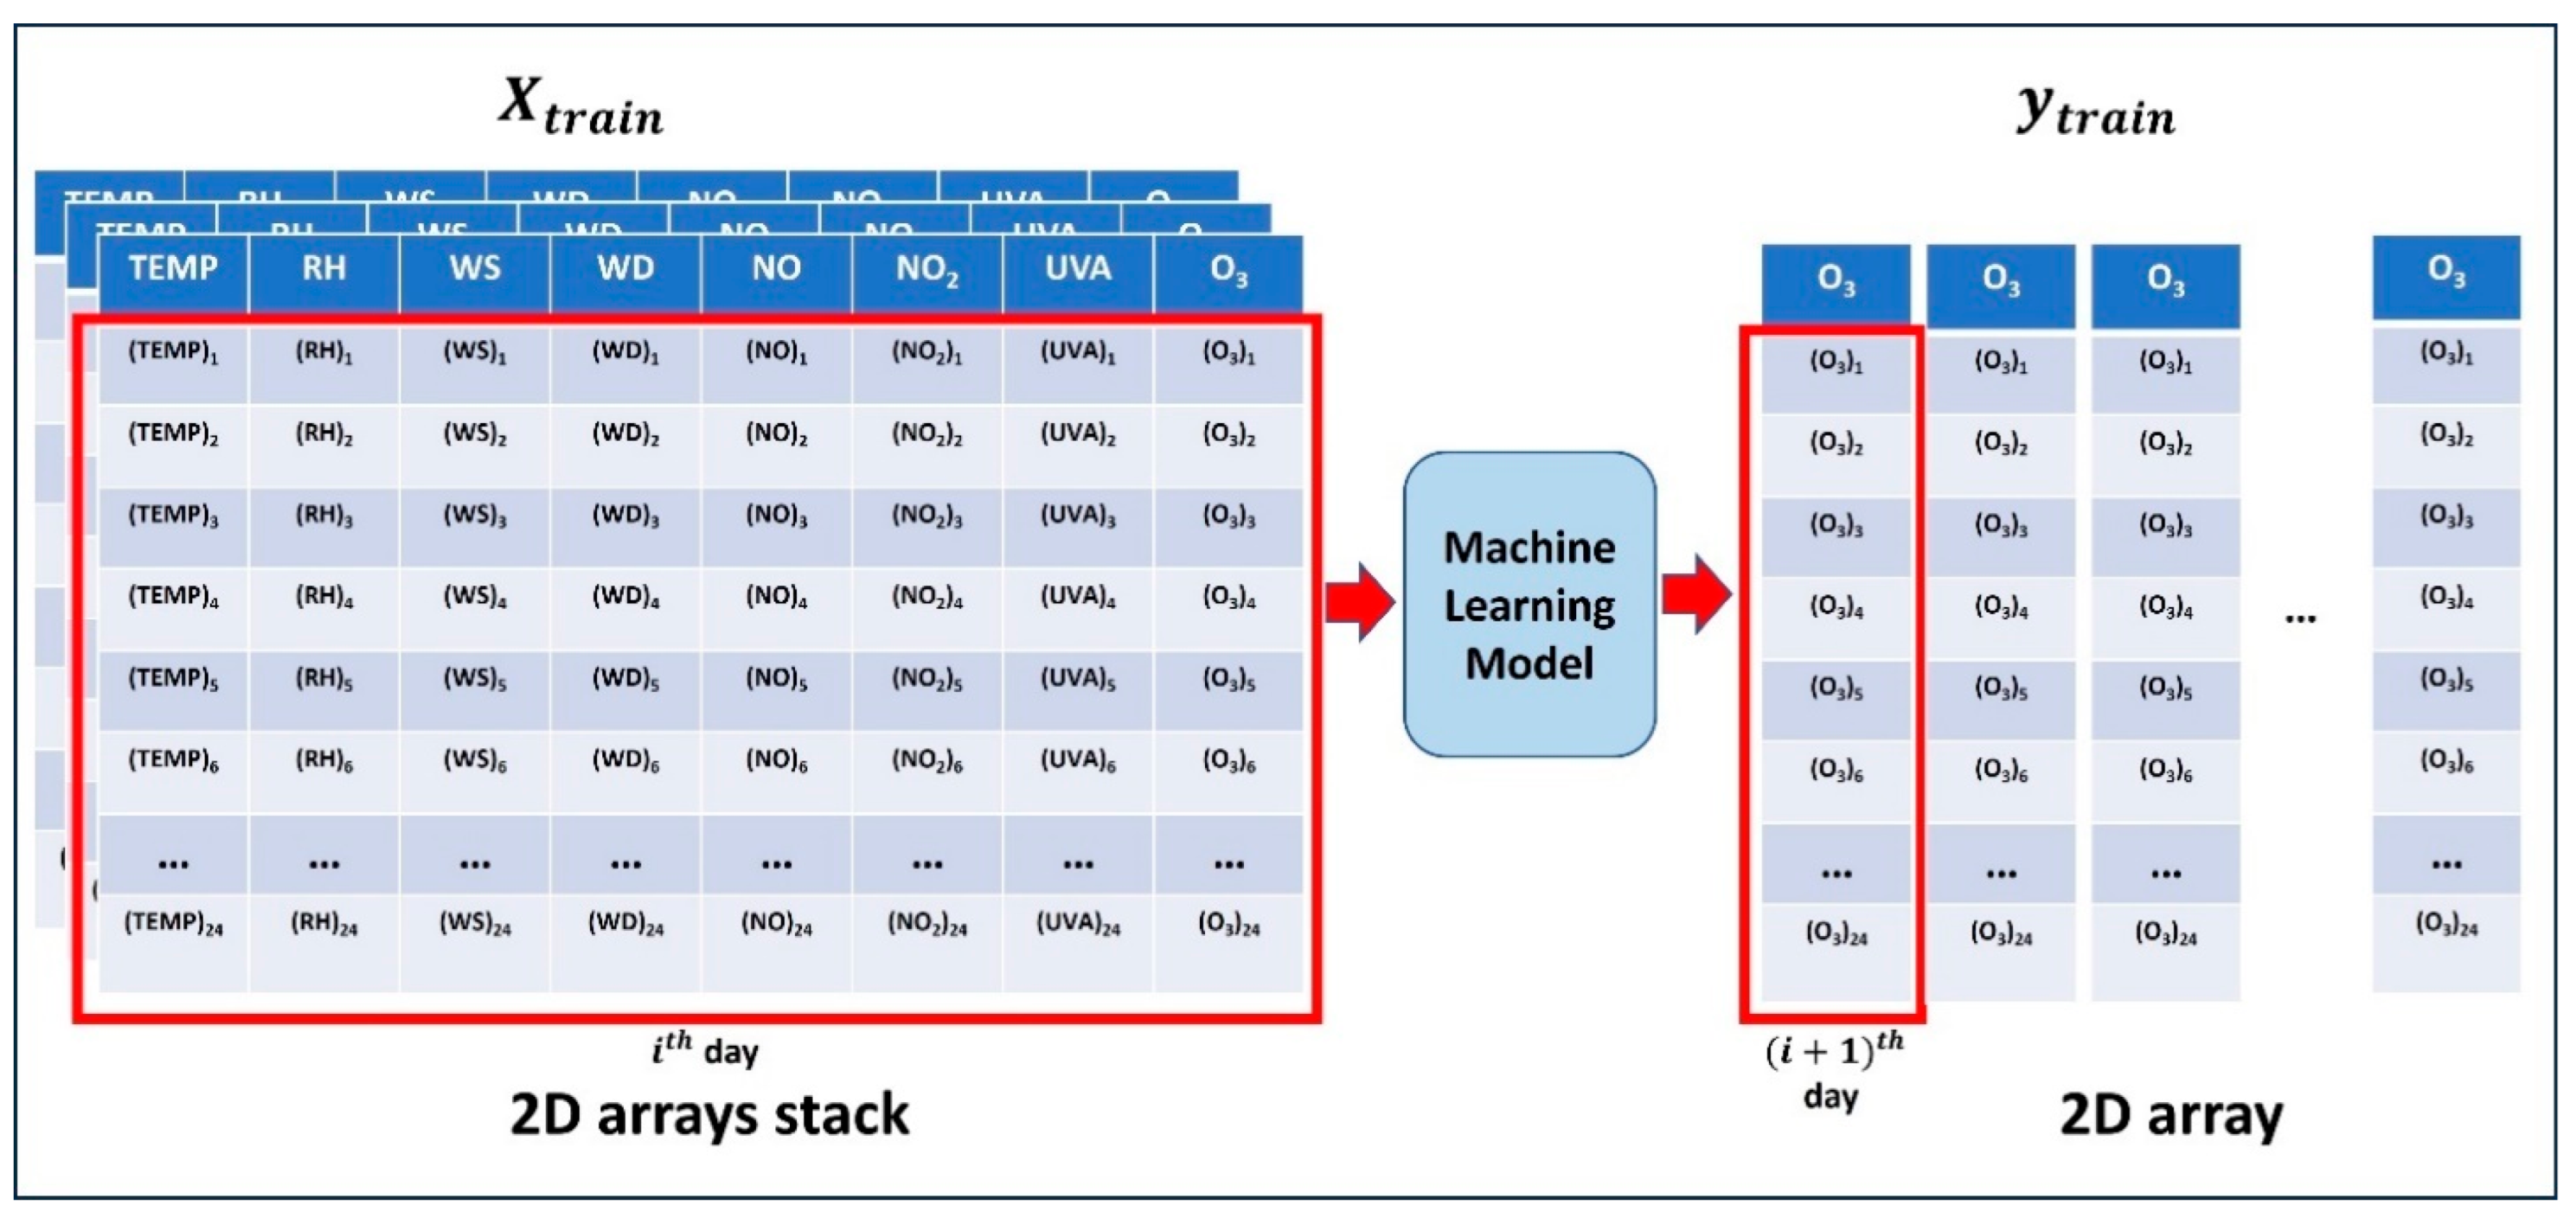
After standardizing all the variables, and are constructed from the training data, where is a stack of two-dimensional (2D) arrays (each 2D array with 24 rows and eight columns contains one-day data of the eight variables; the number of such arrays is one less than the number of days in the training dataset) and is a 2D array (each column of , with 24 rows, contains one-day ozone concentrations; the column contains ozone concentrations of the day; the number of columns in is equal to the number of 2D arrays in ). Following the preprocessing of the data collected from one of the selected stations in Mexico City, the machine-learning models are trained to learn an approximation of the function that maps 2D array of to column of , that is, first day data of eight variables maps onto the second day ozone concentrations, second day data of eight variables maps onto the third day ozone concentrations, day data of eight variables maps onto the day ozone concentrations, and so on. The training process is depicted graphically in Figure 2.
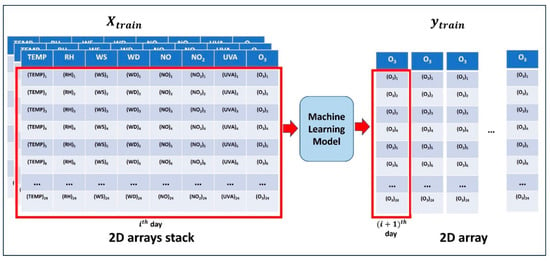
Figure 2.
Schematic of machine-learning models training to forecast the next day ozone concentrations at one station. The machine-learning models are trained to learn an approximation of the function that maps 2D array of to column of , that is, first day data of eight variables maps onto the second day ozone concentrations, second day data of eight variables maps onto the third day ozone concentrations, day data of eight variables maps onto the day ozone concentrations, and so on.
In the end, the first month of test data with and are constructed by applying all the preprocessing steps discussed above; is fed to the trained machine-learning models to get (first month ozone forecast), and the accuracy of the trained machine-learning models is calculated by applying three accuracy metrics (index of agreement, correlation coefficient, and mean absolute error) to the flattened and . Before forecasting the month (), the models are trained again on augmented training data containing month(s) more data as follows. The month of test data with and are constructed by applying all the preprocessing steps discussed above; is fed to the trained machine-learning models to get ( month ozone forecast), and the accuracy of the trained machine-learning models is calculated by applying three accuracy metrics to the flattened and .
where is the function learned by the machine-learning models during their training.
The steps to preprocess, train, and test the models’ performances are narrated in Algorithm 1.
| Algorithm 1 Data preprocessing; models training, evaluation, and upgradation | |
| 1. | Put the data of all the predictors in matrix X with the number of columns equal to the number of variables and the number of rows equal to the number of hours |
| 2. | Analyze matrix X day-wise (24 rows at a time) and discard any day with more than twelve missing values of any variable |
| 3. | Impute missing values in X by KNN imputer (setting number of neighbors as 15, weights as uniform, and metric as nan Euclidean) |
| 4. | Standardize each variable in the training data using Equation (1), and then, using the same mean and standard deviation, standardize each variable in the test data |
| 5. | Construct and from the training data with the following assumptions:#break#(i) is a stack of 2D arrays (each 2D array contains one-day data of the predictors, and the number of such arrays is one less than the number of days in the training dataset)#break#(ii) is a 2D array (each column in contains one-day ozone, and the contains day ozone, and and 2D arrays are the same in number) |
| 6. | Train machine-learning models in regression mode to learn a function that maps 2D array of to column of |
| 7. | Construct and for the first month of test data by applying the instructions given in step 5 |
| 8. | Feed to the trained models to get (first month ozone forecast), and calculate the accuracy of the trained models by applying accuracy metrics to the flattened and |
| 9. | Construct and for the () month test data applying instructions given is step 5, and train the models again on augmented training data containing month(s) more data |
| 10. | Feed to the trained models to get (th () month ozone forecast), and calculate the accuracy of the trained models by applying accuracy metrics to the flattened and |
3.1. Machine-Learning Models
In this study, the three most representative machine-learning (ML) models, including convolutional neural network (CNN), feedforward neural network (FNN), and long short-term memory (LSTM), are considered to forecast near-surface ozone. As we are dealing with continuous input and output data, the candidate ML models are trained in regression mode, a supervised machine-learning approach, to learn a mapping between the current day hourly data of eight input variables and the next day’s hourly ozone concentrations (Figure 3). The decoded mapping is not in the form of an explicit mathematical expression, but it exists in the form of a trained machine-learning model. And the trained machine-learning model works like a classical mathematical function; it takes an input and generates the required output with a level of accuracy achieved through the model’s selection, tuning, and training.

Figure 3.
Schematic of trained machine-learning models to forecast ozone concentrations at a station in Mexico City. The trained machine-learning models take current-day data of eight variables as input and output the next day’s 24-h ozone concentrations.
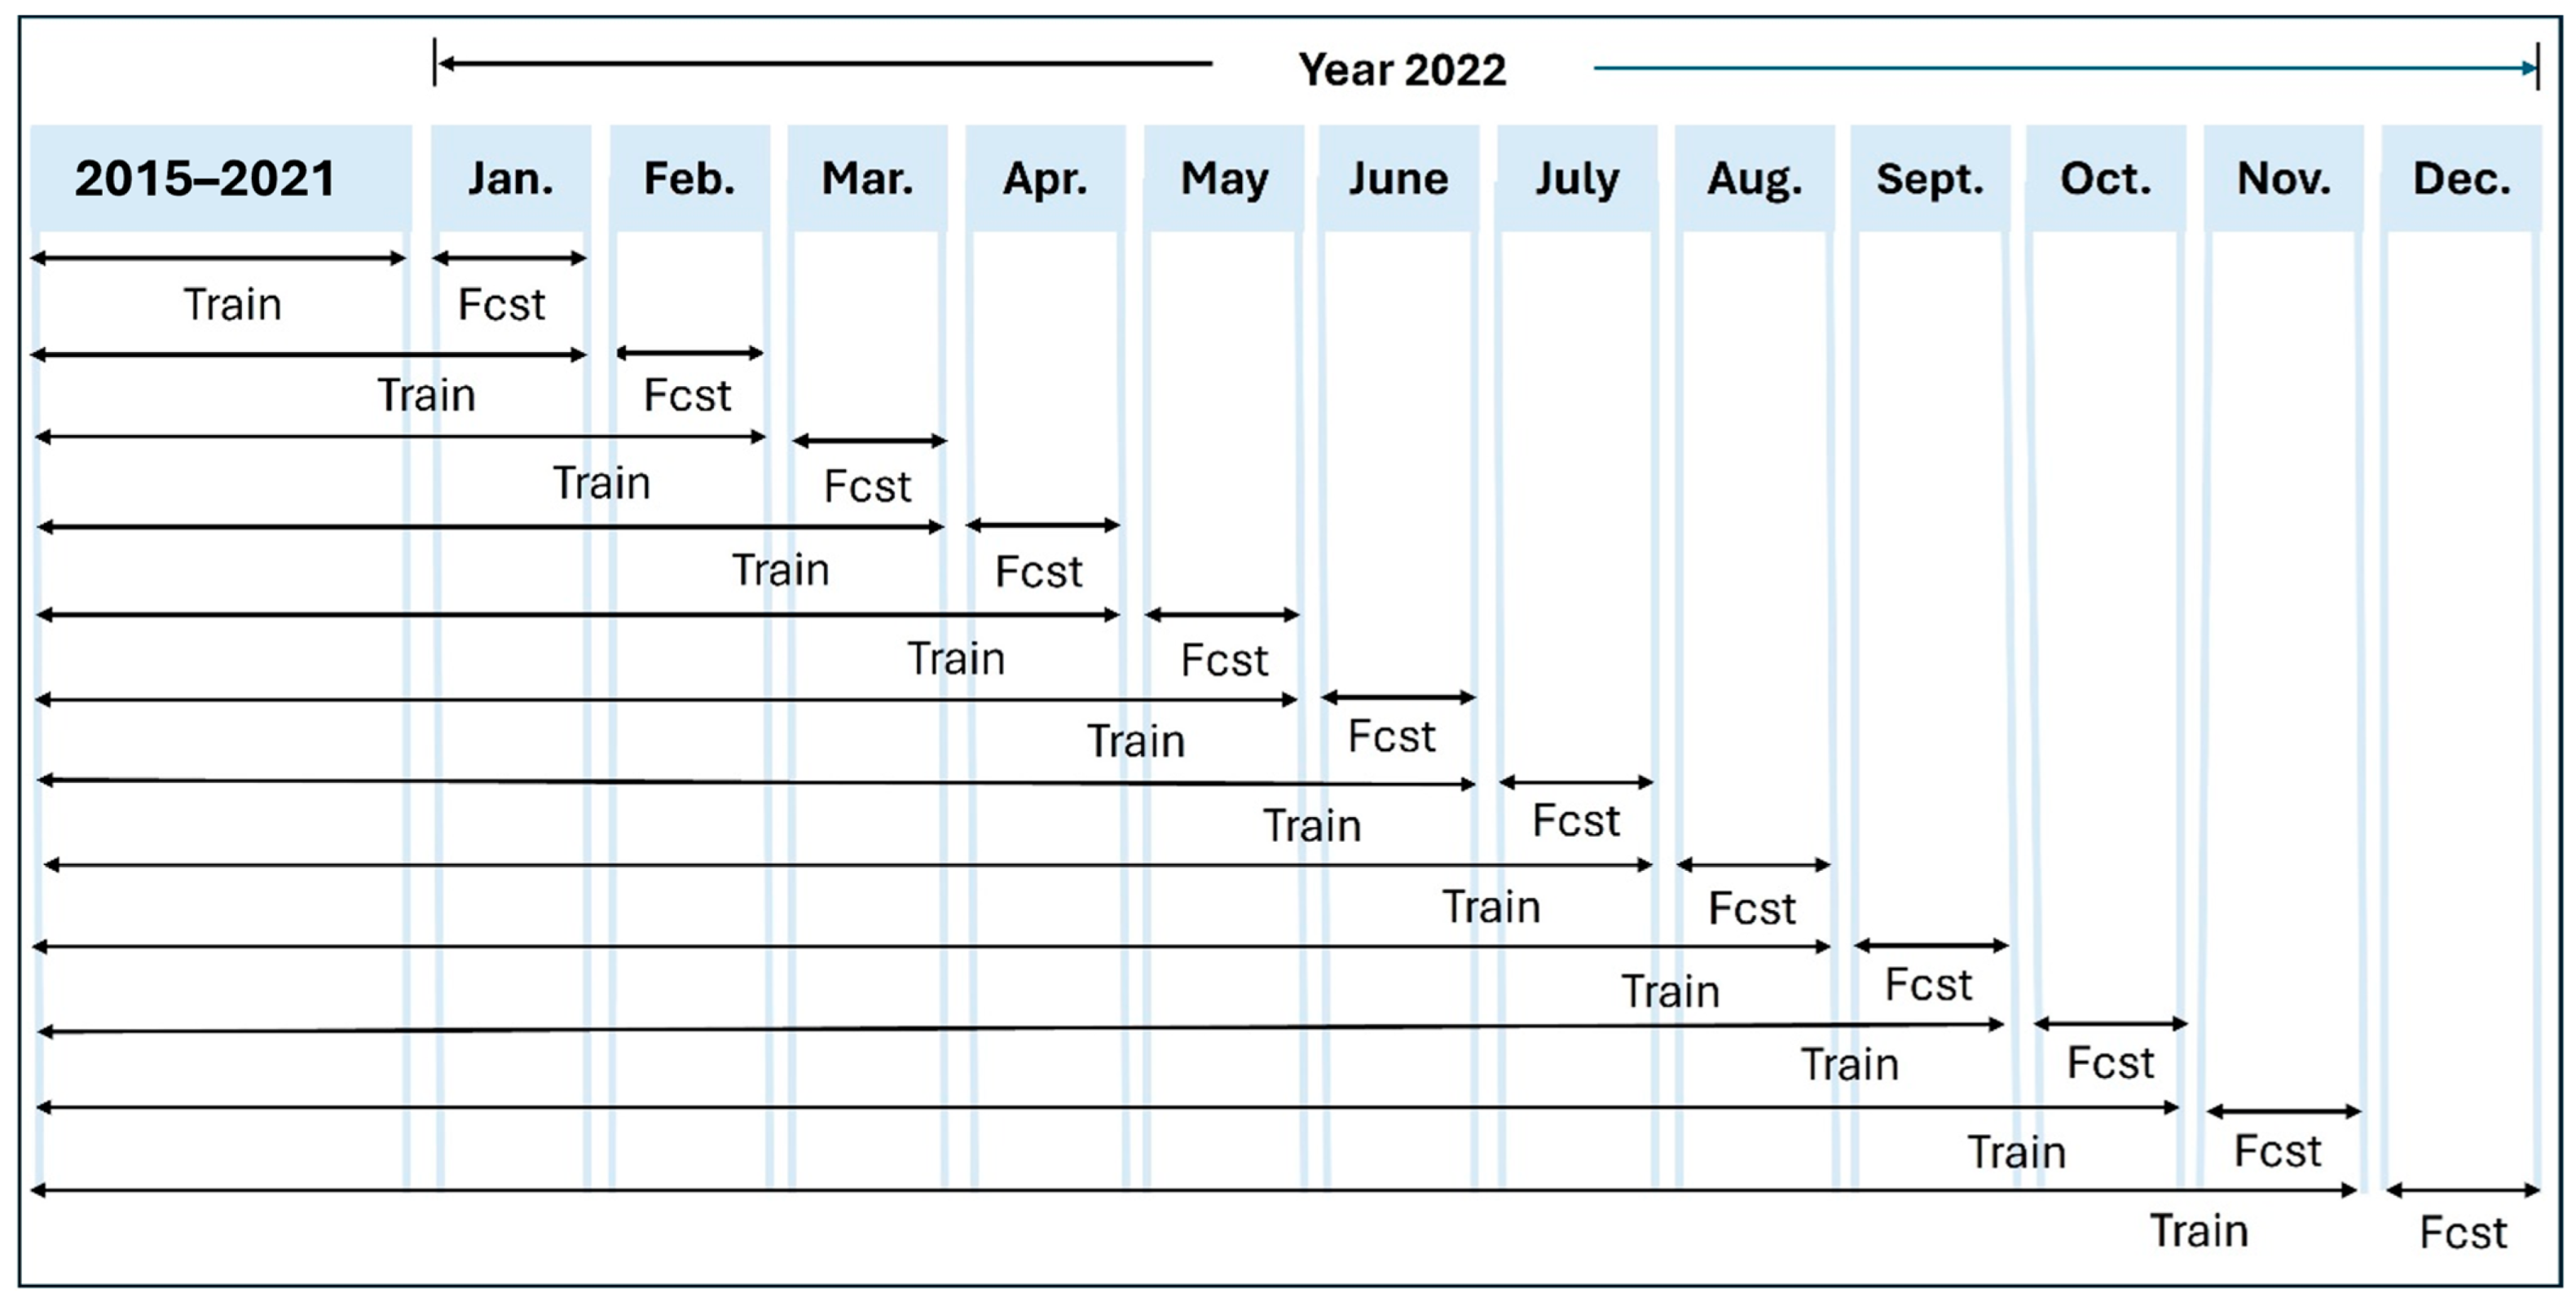
Each model is trained on seven years (2015 to 2021) and tested on one year (2022) of data collected at 14 monitoring stations across Mexico City. The trained ML models utilize current day hourly averaged data of the eight predictors listed in Table 2 to predict next day hourly near-surface ozone concentrations up to January 2022; before forecasting the month of February 2022, the models are trained again using seven years and one month data including January 2022; prior to forecasting the March 2022, the models are trained another time utilizing seven years and two months data, which now would include January and February 2022, and so on. The training and testing process of the ML models at one station in Mexico City is depicted exemplarily in Figure 4.
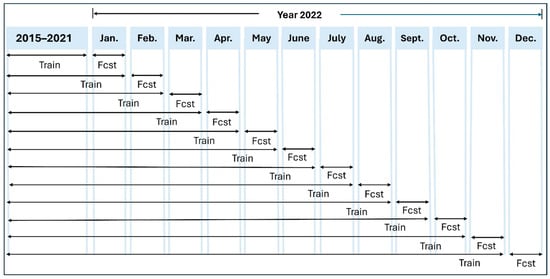
Figure 4.
Train and forecast (fcst) process of the ML models at one station in Mexico City.
3.1.1. Feedforward Neural Network (FNN)
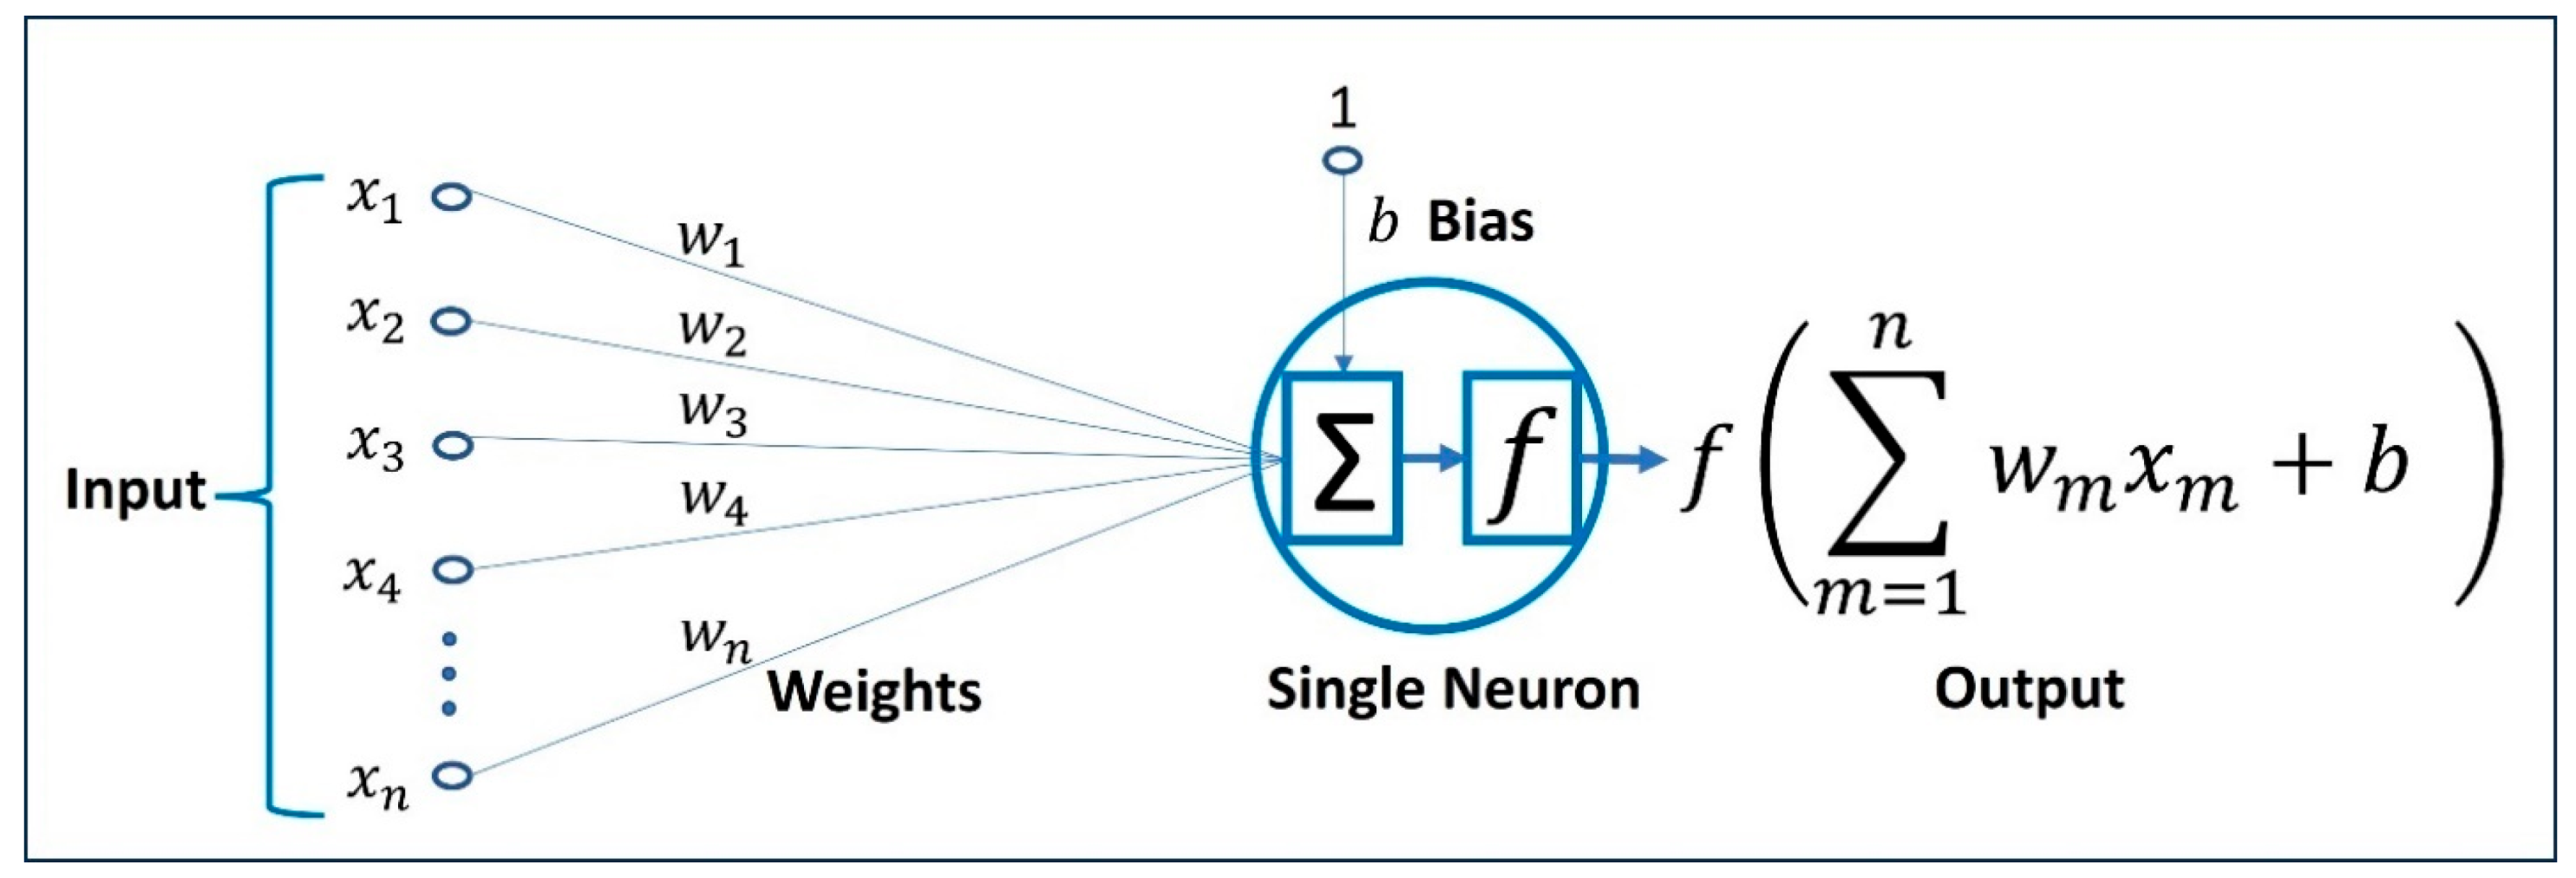
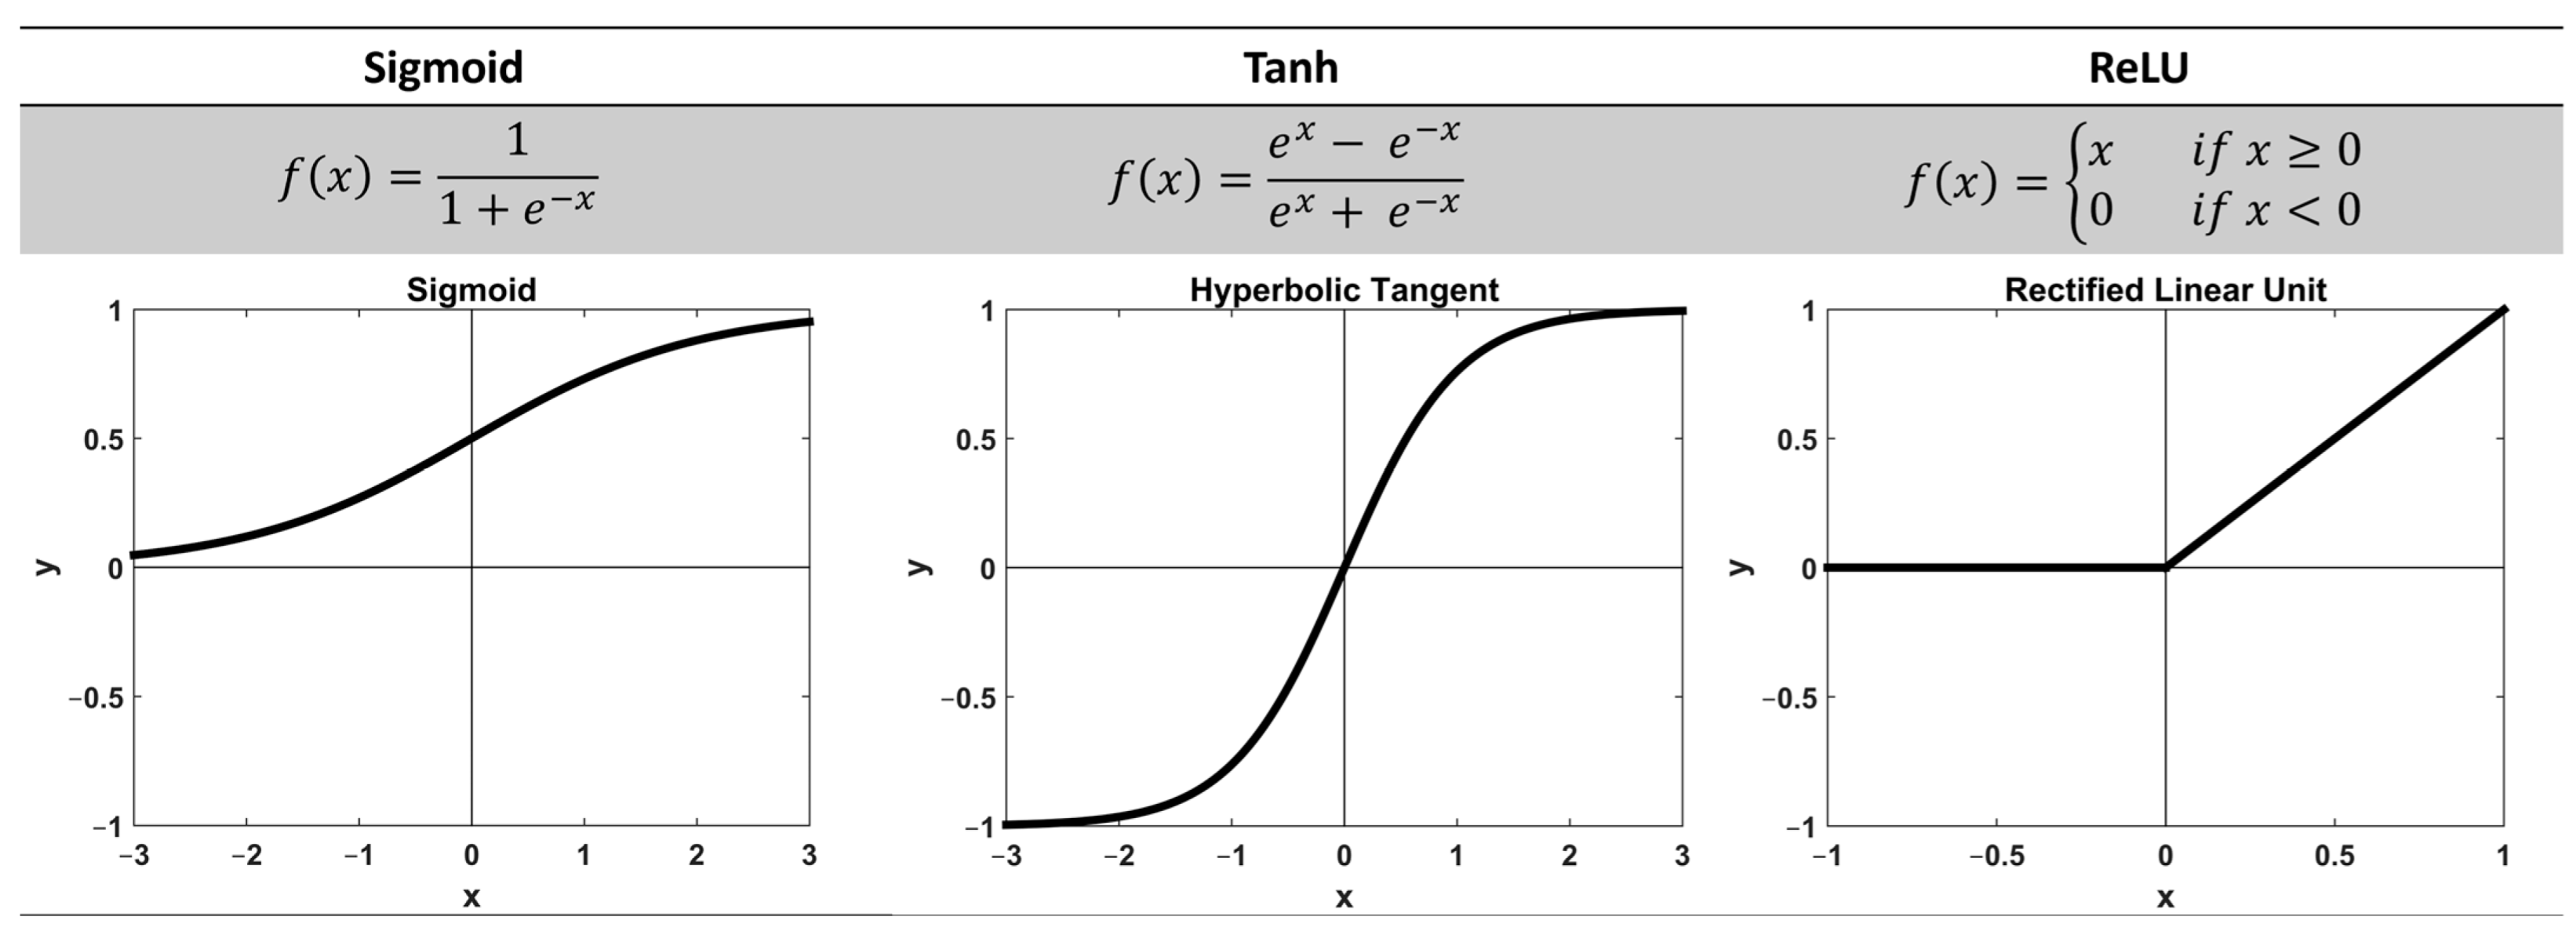
In a feedforward neural network—a type of artificial neural network—the data fed to the network via the input layer travels across the hidden layers and yields the output layer. A hidden layer consists of any number of neurons, simple processing units operating in parallel, where the task of each neuron is to calculate a weighted sum of all the inputs fed to it and then apply a nominated nonlinear activation function on the weighted sum for the final output from a neuron. A neuron’s architecture is depicted in Figure 5. The nonlinear activation functions, including sigmoid, Rectified Linear Unit (ReLU), and hyperbolic tangent (Figure 6), introduce nonlinearity into the neural network, which aids the learning of more complex patterns in the data.
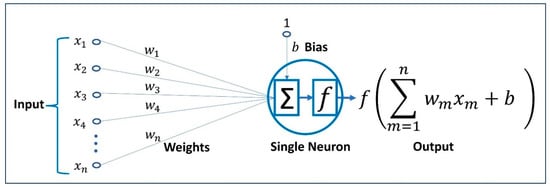
Figure 5.
Operation of a neuron on the inputs , , , …, , where , , , …, represent weights, (weight of an input value 1) is a bias, and is a nominated nonlinear activation function.
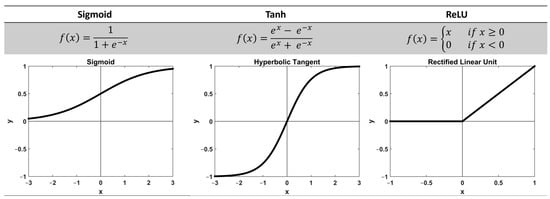
Figure 6.
Nonlinear activation functions with mathematical expressions and graphs.
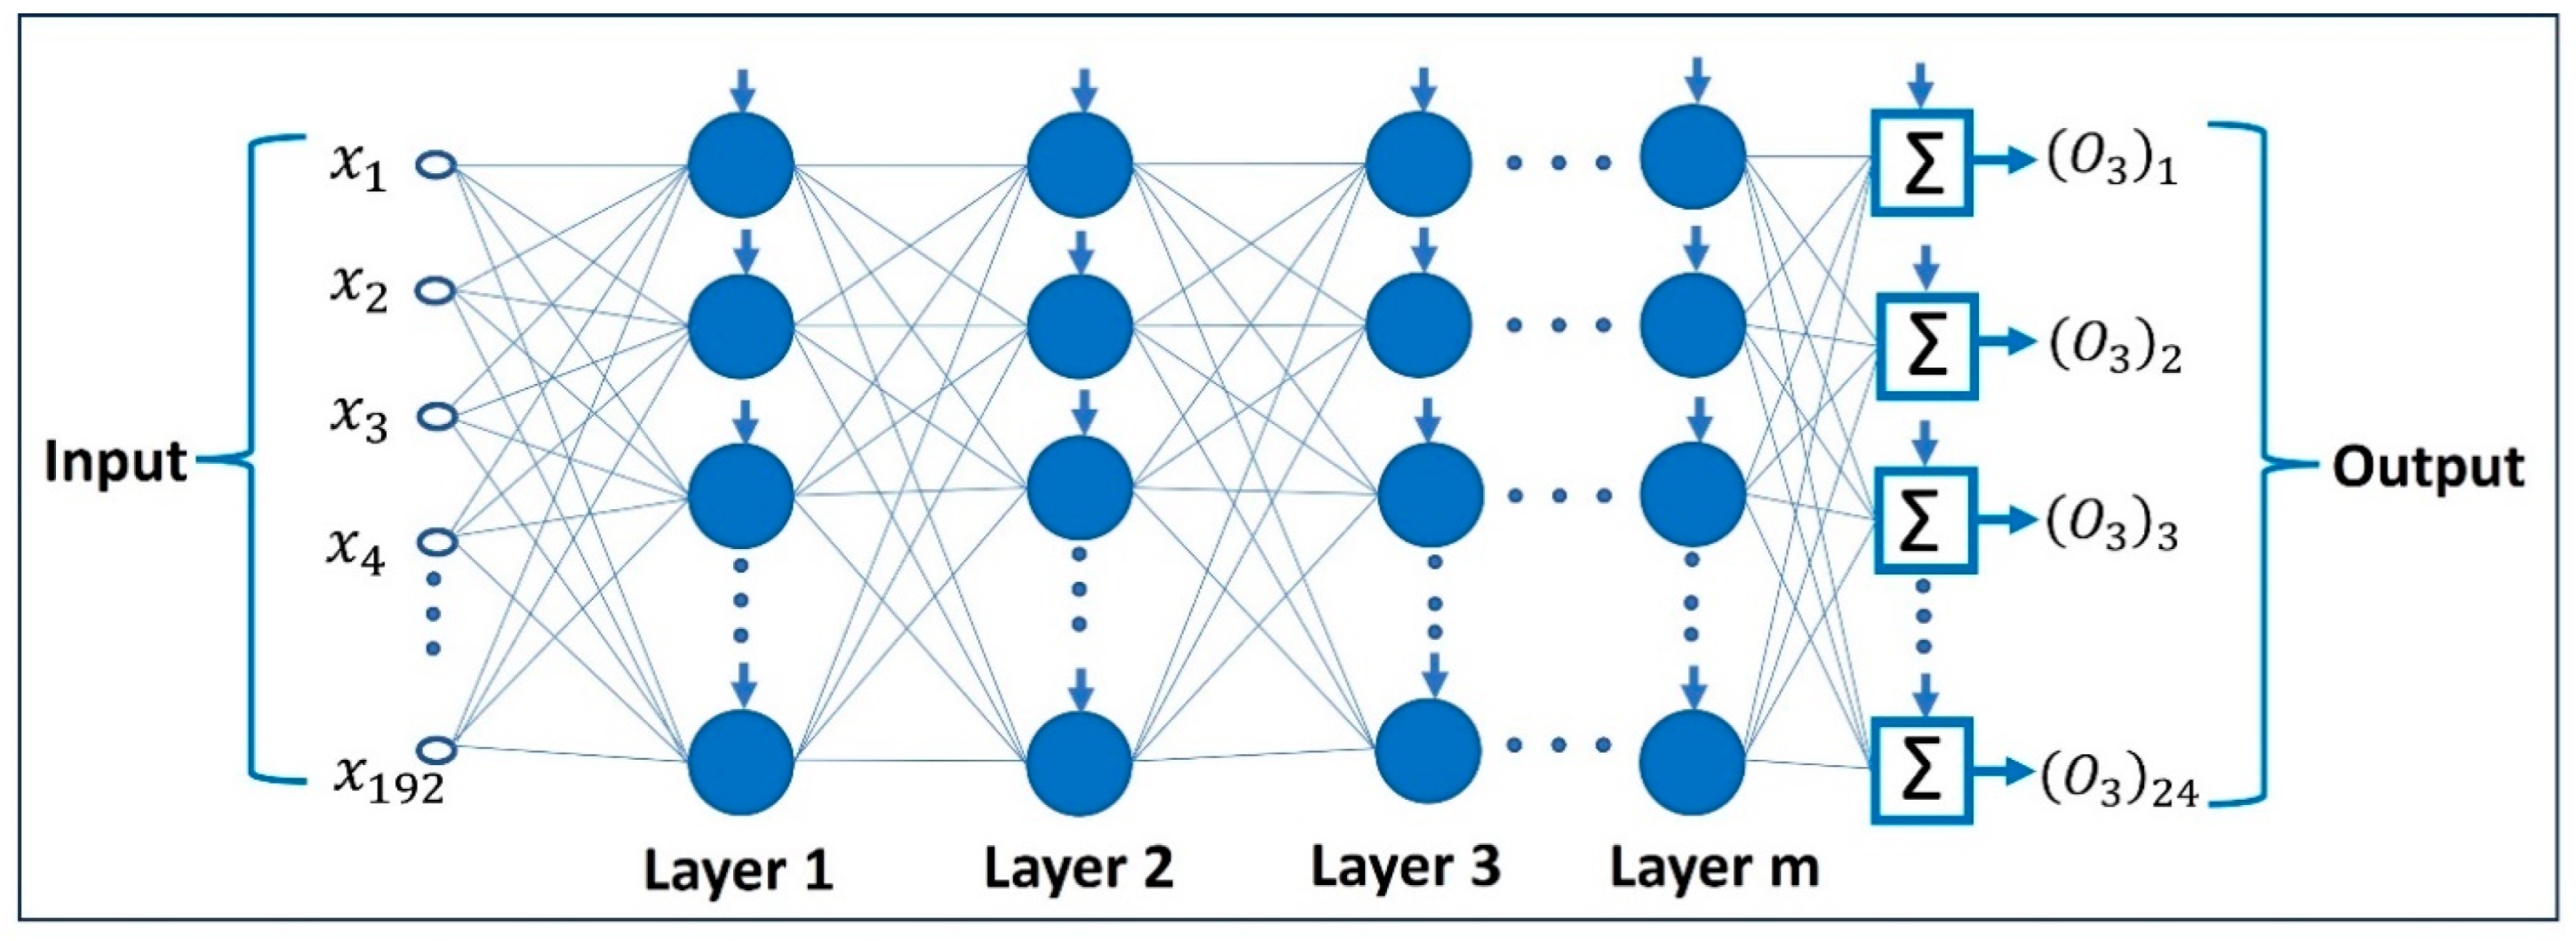
At the beginning of Section 3, we constructed and to train our ML models from the training dataset, where is a stack of 2D arrays (each 2D array with 24 rows and eight columns contains one-day data of the eight variables, and the number of such arrays is one less than the number of days in the training dataset) and is a 2D array (each column of with 24 rows containing one-day ozone concentrations, and the column contains ozone concentrations of the day, and the number of columns in is equal to the number of 2D arrays in ). A training set to train the FNN in regression mode is defined as , where is a 2D array containing the day data of the eight variables, and is a column matrix containing day of hourly ozone concentrations. The architectural graph of an FNN to be trained on the training set is depicted in Figure 7, where the input layer has 192 input slots to accommodate 192 values obtained by flattening any , and the output layer produces 24 values (the next day’s hourly ozone concentrations). Also, the 24 nodes in the output layer are without activation functions, such that FNN can freely output any value as ozone concentration. The task of the trained FNN is to learn an approximation of the function that maps onto . The training of the FNN consists of two phases, namely feedforward and backpropagation. In the feedforward phase, the flatten is fed to the FNN, and the output of the FNN is compared to the desired output to get an error. Before feeding the next training pair to the FNN, the weights are adjusted by applying the backpropagation algorithm to ensure that the loss function, Mean Squared Error (MSE), is at a minimum. The process is repeated until an optimal set of weights is realized. The FNN model was utilized with ReLU activation function, MSE loss function, Adam optimization algorithm, and optimal hyperparameters for three hidden layers with 180 neurons in the first hidden layer and 0.1 dropout, 128 neurons in the second hidden layer and 0.1 dropout, 130 neurons in the third hidden layer, and 24 neurons in the output layer. The batch size was set as 7, and the number of epochs was taken as 168.
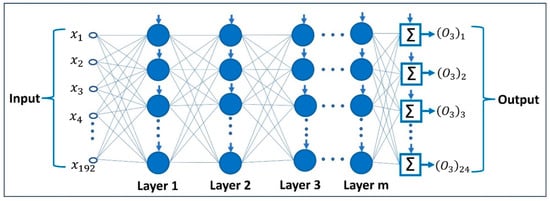
Figure 7.
Feedforward neural network to forecast the next day’s hourly ozone concentrations, where vertical arrows represent biases.
3.1.2. Convolutional Neural Network (CNN)
A Convolutional Neural Network (CNN), which is a type of deep neural network with an input layer, a convolutional layer, a pooling layer, a fully connected layer, and an output layer, is mainly used for image classification, object detection, and computer vision. The convolutional layer extracts features from the input image by applying a variety of filters, where each filter is slid over the input image to calculate a dot product between the filter and the portion of the image obscured by the filter, and the values of these dot products are stored in a table called a feature map. The pooling layer is then incorporated to reduce the dimensionality of the feature maps, retaining the most relevant information. Ultimately, the feature maps are flattened and fed to the fully connected layer to compute the final classification or regression task. Commonly, convolutional and pooling layers are adjacent to each other and come up together repeatedly in the network.
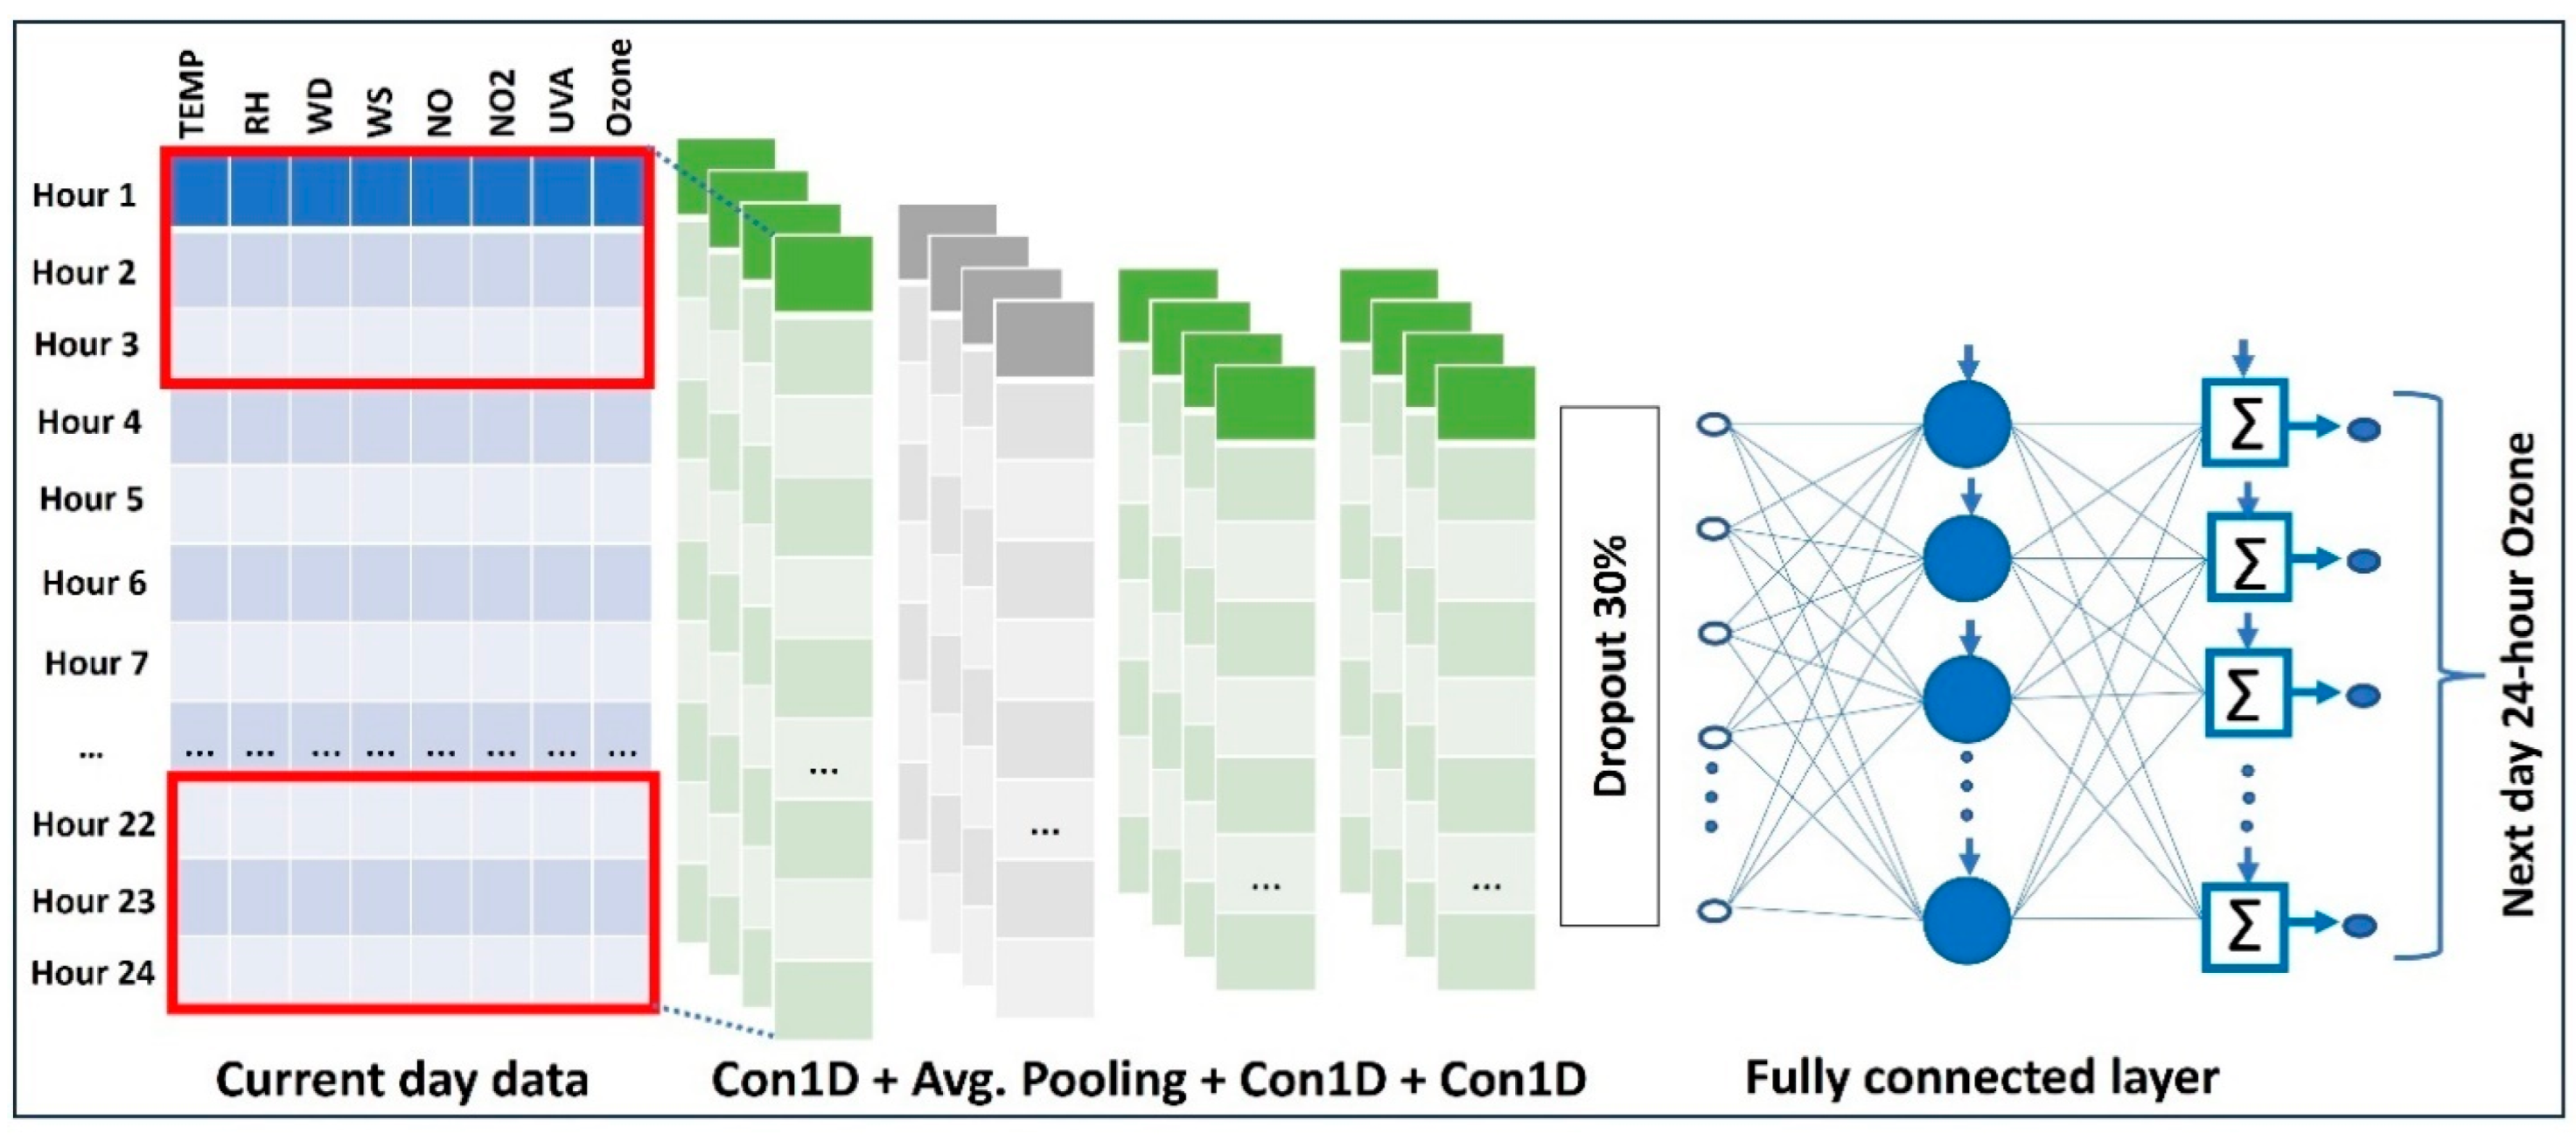
By CNN, we usually mean a two-dimensional CNN used for image processing. However, other types of Convolutional Neural Networks, such as one-dimensional (1D) CNN and three-dimensional (3D) CNN, also exist and are utilized for tasks other than image processing. The ability of 1D CNN, where the filters’ movement is restricted to one dimension only, to learn complicated relationships between multivariate input and output makes it better suited to process sequential data such as time series forecasting. The architecture of a 1D CNN trained on the training set , where the 2D array contains the day data of the predictors, and the column matrix contains day of hourly ozone concentrations; these are depicted in Figure 8. The input layer is loaded with a 2D array containing one day of data of eight predictors (which is just like a tabular form of an image), and the output layer produces 24 values (the next day’s hourly ozone concentrations). Also, all the 24 nodes in the output layer are devoid of activation functions, such that the output values are not restricted to any limit. The 1D CNN model was implemented with ReLU activation function, MSE loss function, Adam optimization algorithm, and optimal hyperparameters for six hidden layers with 64 kernels of size in the first hidden layer (1D convolutional layer), average pooling with a filter of size in the second hidden layer, 64 kernels of size in the third hidden layer (1D convolutional layer), 64 kernels of size in the fourth hidden layer (1D convolutional layer), flatten layer with 0.3 dropout as fifth hidden layer, fully connected layer with 128 neurons as sixth hidden layer, 24 neurons in the output layer. The batch size was set as 7, and the number of epochs was taken as 168.
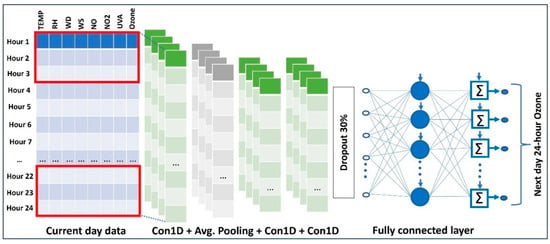
Figure 8.
Convolutional neural network to forecast the next day’s hourly ozone concentrations.
3.1.3. Long Short-Term Memory (LSTM)
Long Short-Term Memory (LSTM) is an improved version of the Recurrent Neural Network (RNN). It is used for processing sequential data, such as forecasting ozone concentrations from hourly ozone concentration data. RNN suffers from vanishing and exploding gradient problems, and it is not suitable for sequential data possessing long-term dependencies. In contrast, the LSTM model with its gating mechanism is capable of extracting and storing long-term dependencies from the sequential data, which makes it the most suitable choice for processing sequential data.
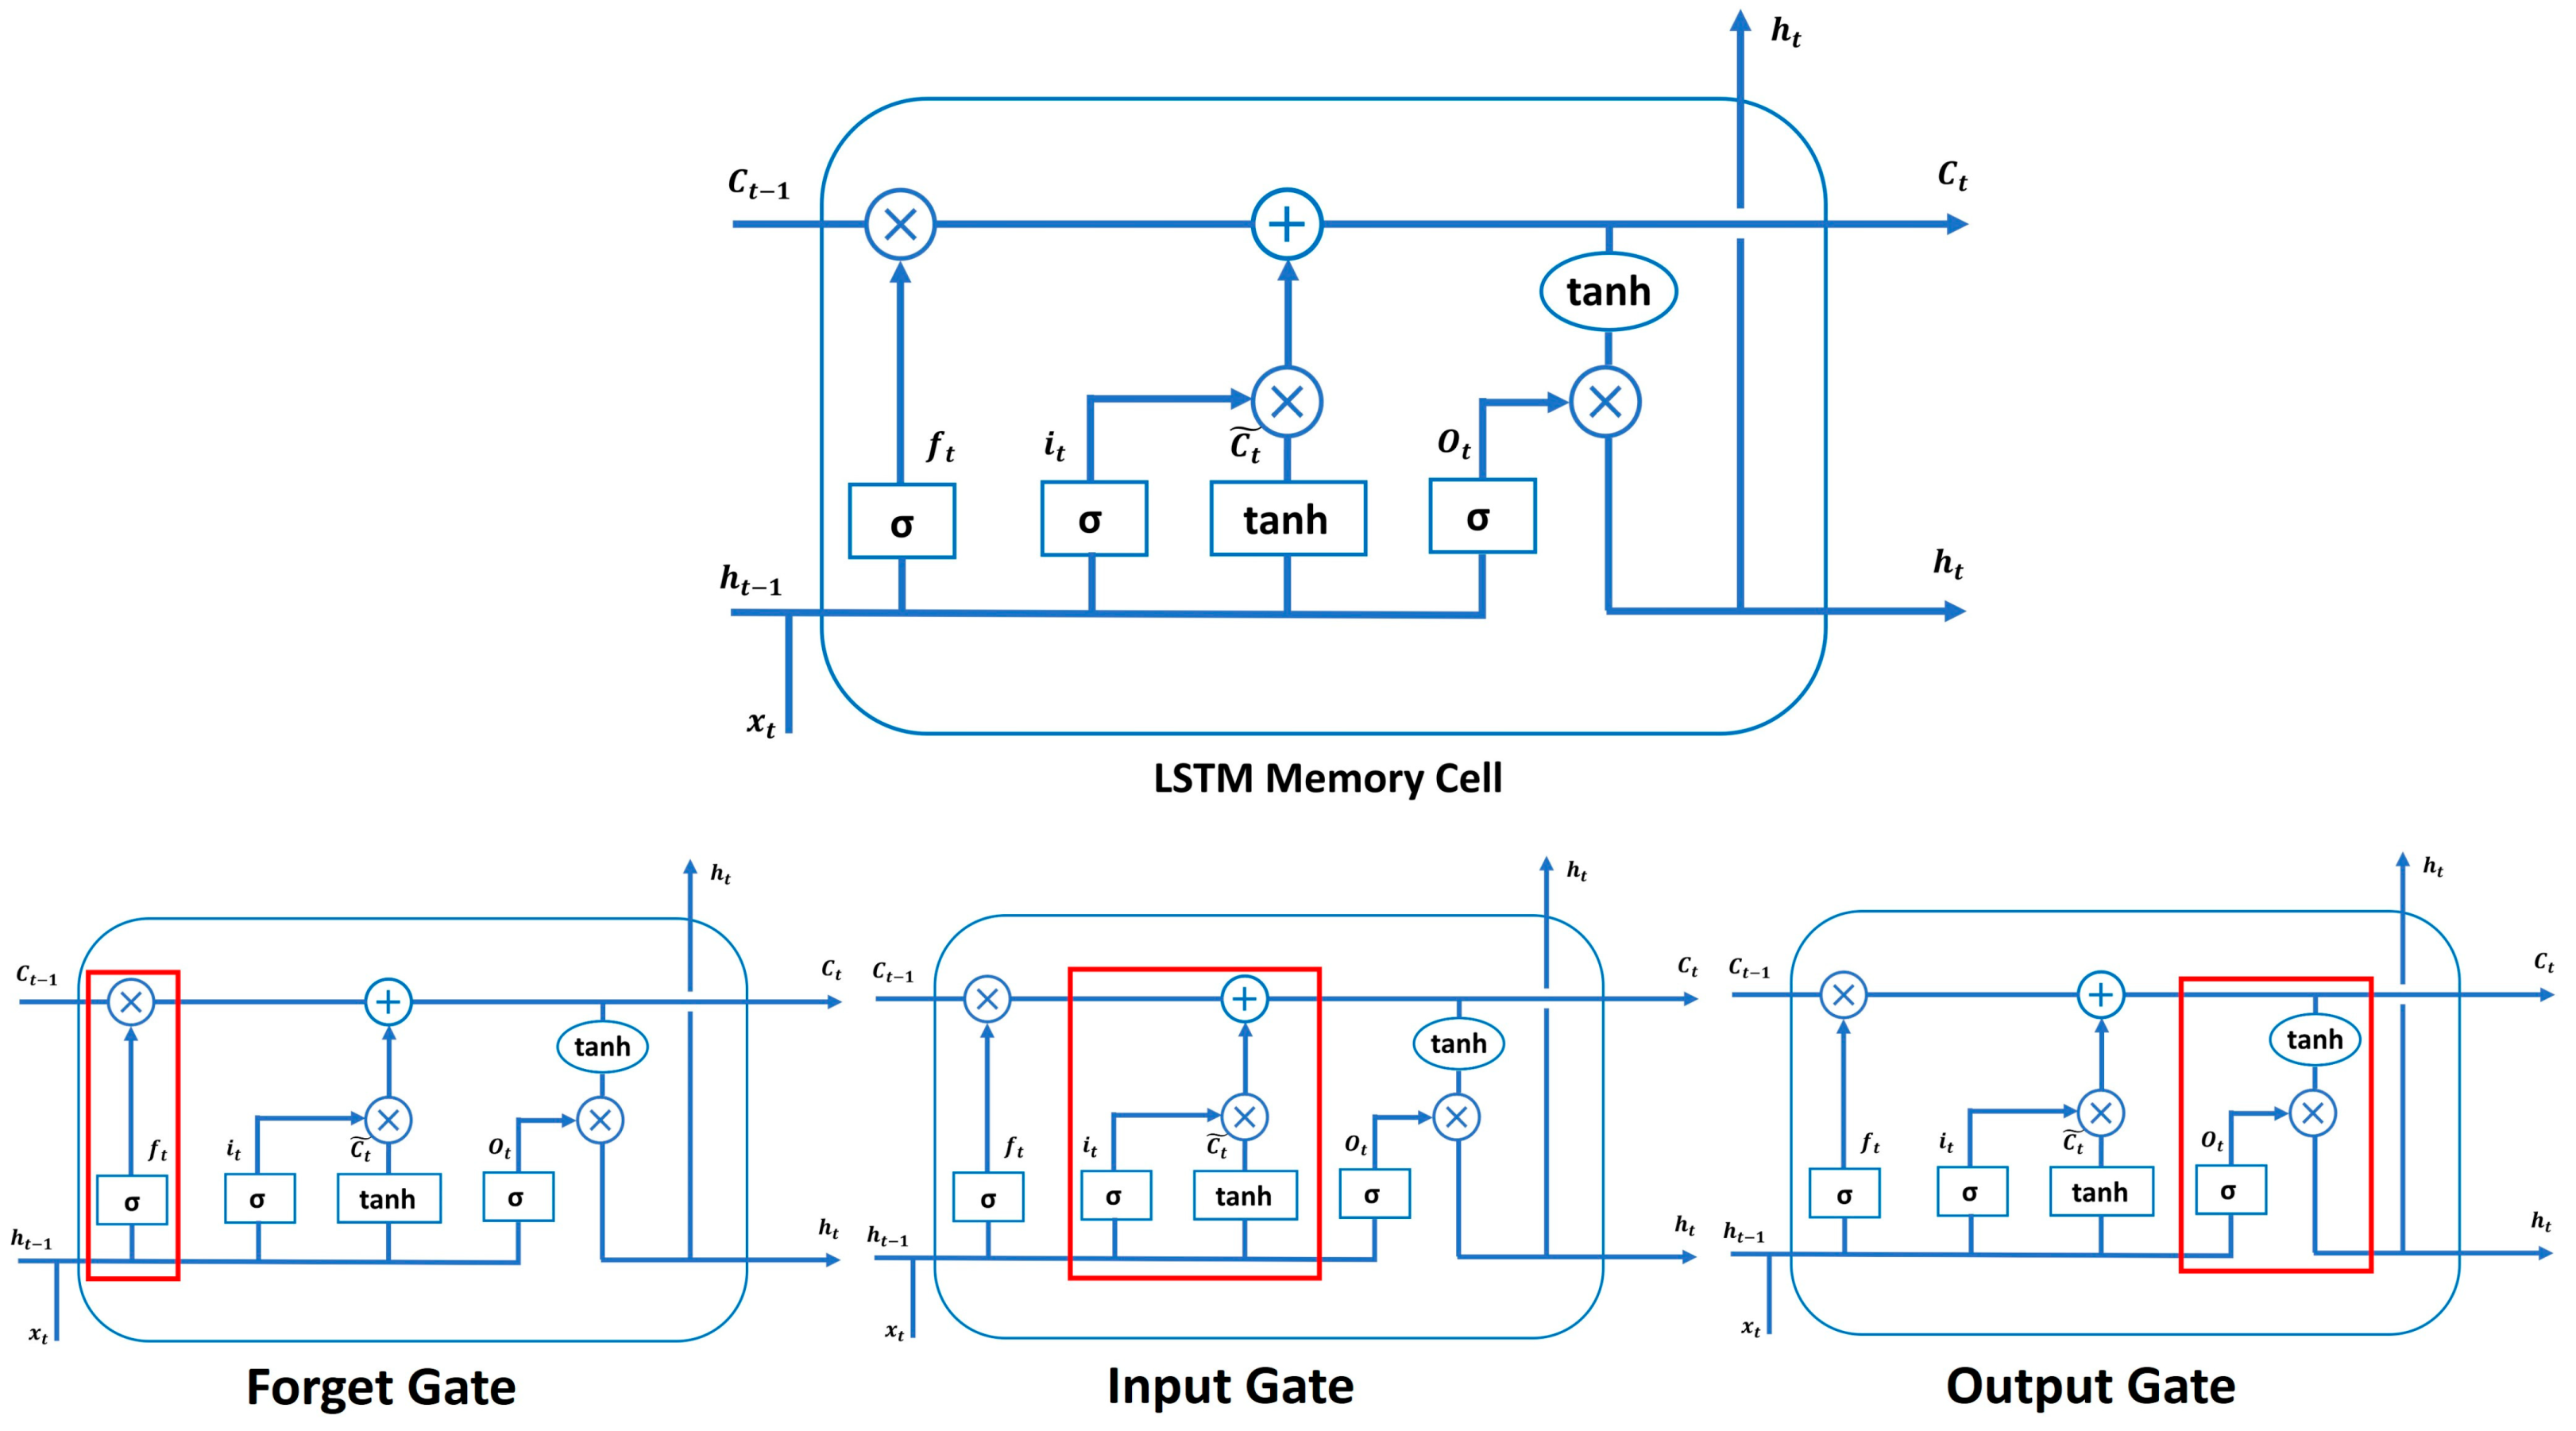
An LSTM model consists of a stack of memory cells containing cell state, hidden state, forget gate, input gate, and output gate. A memory cell of an LSTM model is shown in Figure 9. The cell state, running through the top of the memory cell, plays a vital role in maintaining information flow towards, within, and from the memory cell. It acts like a conveyor belt and facilitates information accumulation and removal using various gates. The memory cell with its cell state and three gating mechanisms, such as forget gate, input gate, and output gate, regulates incoming, stored, and outgoing information. The working of these gates is explained in Figure 9.
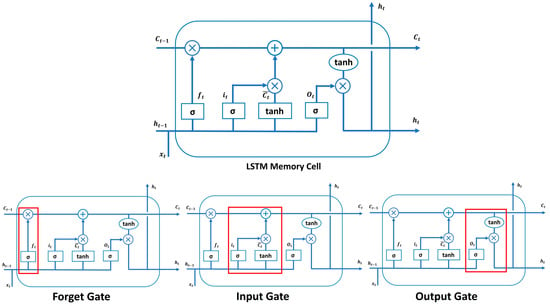
Figure 9.
LSTM model memory cell with forget, input, and output gates. Where is a sigmoid activation function, is a weight matrix, represents a hidden state at the previous time step t − 1, is the input vector at the current time set t, is a bias vector, and are the cell states at the time steps t − 1 and t, respectively, and tanh represents the hyperbolic tangent activation function.
The mathematical equations involved in the operations of forget, input, and output gates are given below:
The LSTM model was implemented with ReLU activation function, MSE loss function, Adam optimization algorithm, and optimal hyperparameters for four hidden layers with 24 output units in the first hidden layer (LSTM layer), 24 output units in the second hidden layer (LSTM layer), third hidden layer with 0.2 dropout, 24 output units in the fourth hidden layer (LSTM layer), and 24 neurons in the output layer. The batch size was set as 7, and the number of epochs was taken as 168.
3.2. Performance Metrics
The performance of the trained ML models on the test data is evaluated by three statistical indicators, including the index of agreement (IOA), correlation coefficient (R), and mean absolute error (MAE). IOA, ranging from 0 to 1, measures the agreement between observed and predicted values, where 1 indicates that high and low peaks of ozone concentrations were captured well by the model. R, ranging from −1 to 1, calculates the strength and direction of the linear relationship between the observed and predicted values, where −1 and 1 indicate perfect negative and positive linear relationships, respectively. MAE measures the average absolute difference between observed and predicted values, and lower MAE values indicate better accuracy. The mathematical formulas of the statistical indicators are given below:
where and represent observed and predicted values, respectively; and stand for mean observed and mean predicted values, respectively; and is the total number of data points.
4. Results and Discussion
We present results based on two main scenarios: (1) local, and (2) regional. The local scenario focuses on each individual station where ML models are trained and evaluated using train and test data from each station. On the other hand, the regional scenario considers all the stations simultaneously, and the collectively trained models can be deployed on any station to forecast near-surface ozone (O3) concentrations. In the regional scenario, training data from the stations is grouped together to train the ML models, and the trained ML models’ performance can be evaluated on any station using test data from that station. In this study, the three most representative ML models, including CNN, FNN, and LSTM, are considered to forecast O3. The models presented in this research are capable of forecasting the next day’s 24-h O3 concentrations for up to one month, and prior to forecasting the next month, the models are updated. In this way, our proposed models can forecast the next day’s O3 concentrations without any degradation in their accuracy. The model’s training and upgradation process is discussed in detail in Algorithm 1. Here, we are describing the training and upgradation process briefly for the sake of completeness. Eight years (2015 through 2022) of observed data were acquired from 14 automatic monitoring stations across Mexico City and split into three subsets: training, validation, and test sets. The models were trained and validated on seven years of data (2015 through 2021, setting aside 10% data for validation) and tested on the entire one-year (2022) data to evaluate the forecasting capabilities of the models. The testing and updating process is described in detail in Section 3.1, and Figure 4 depicts this process graphically. The models’ accuracy is measured through three statistical metrics described in Section 3.2. In the following sections, we evaluate the performance of the trained ML models considering local and regional scenarios discussed above.
4.1. Local Scenario
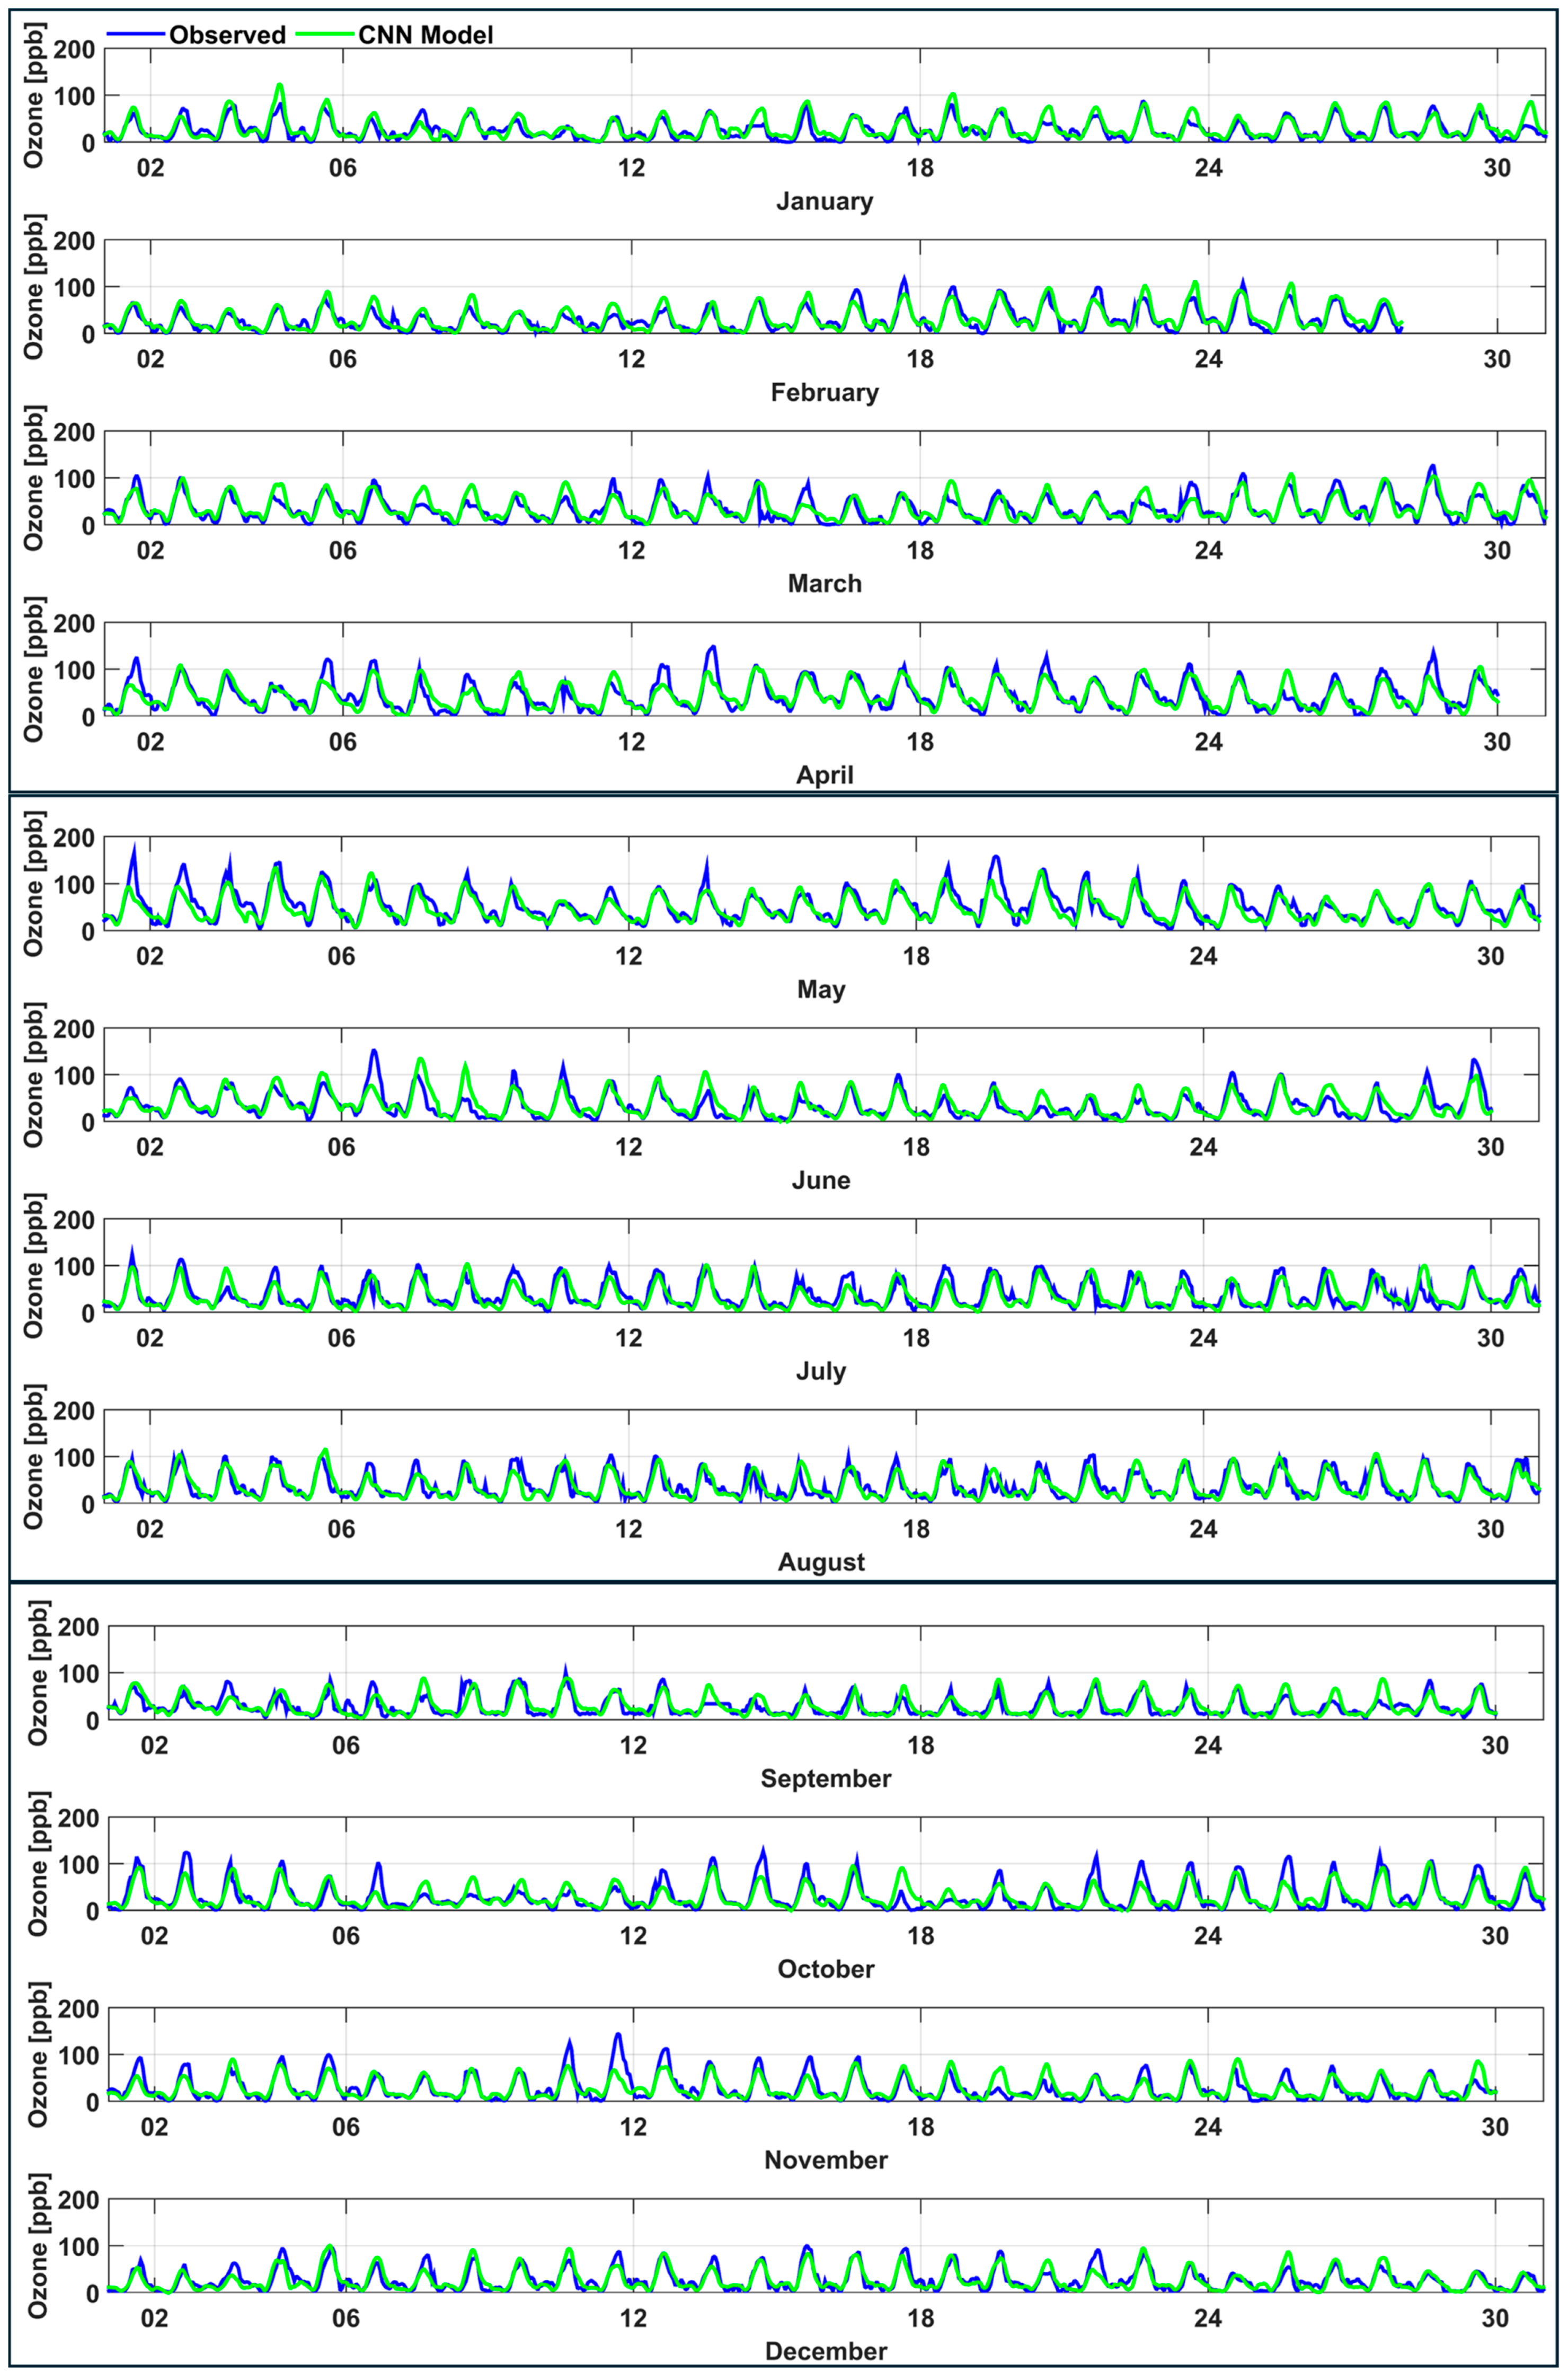
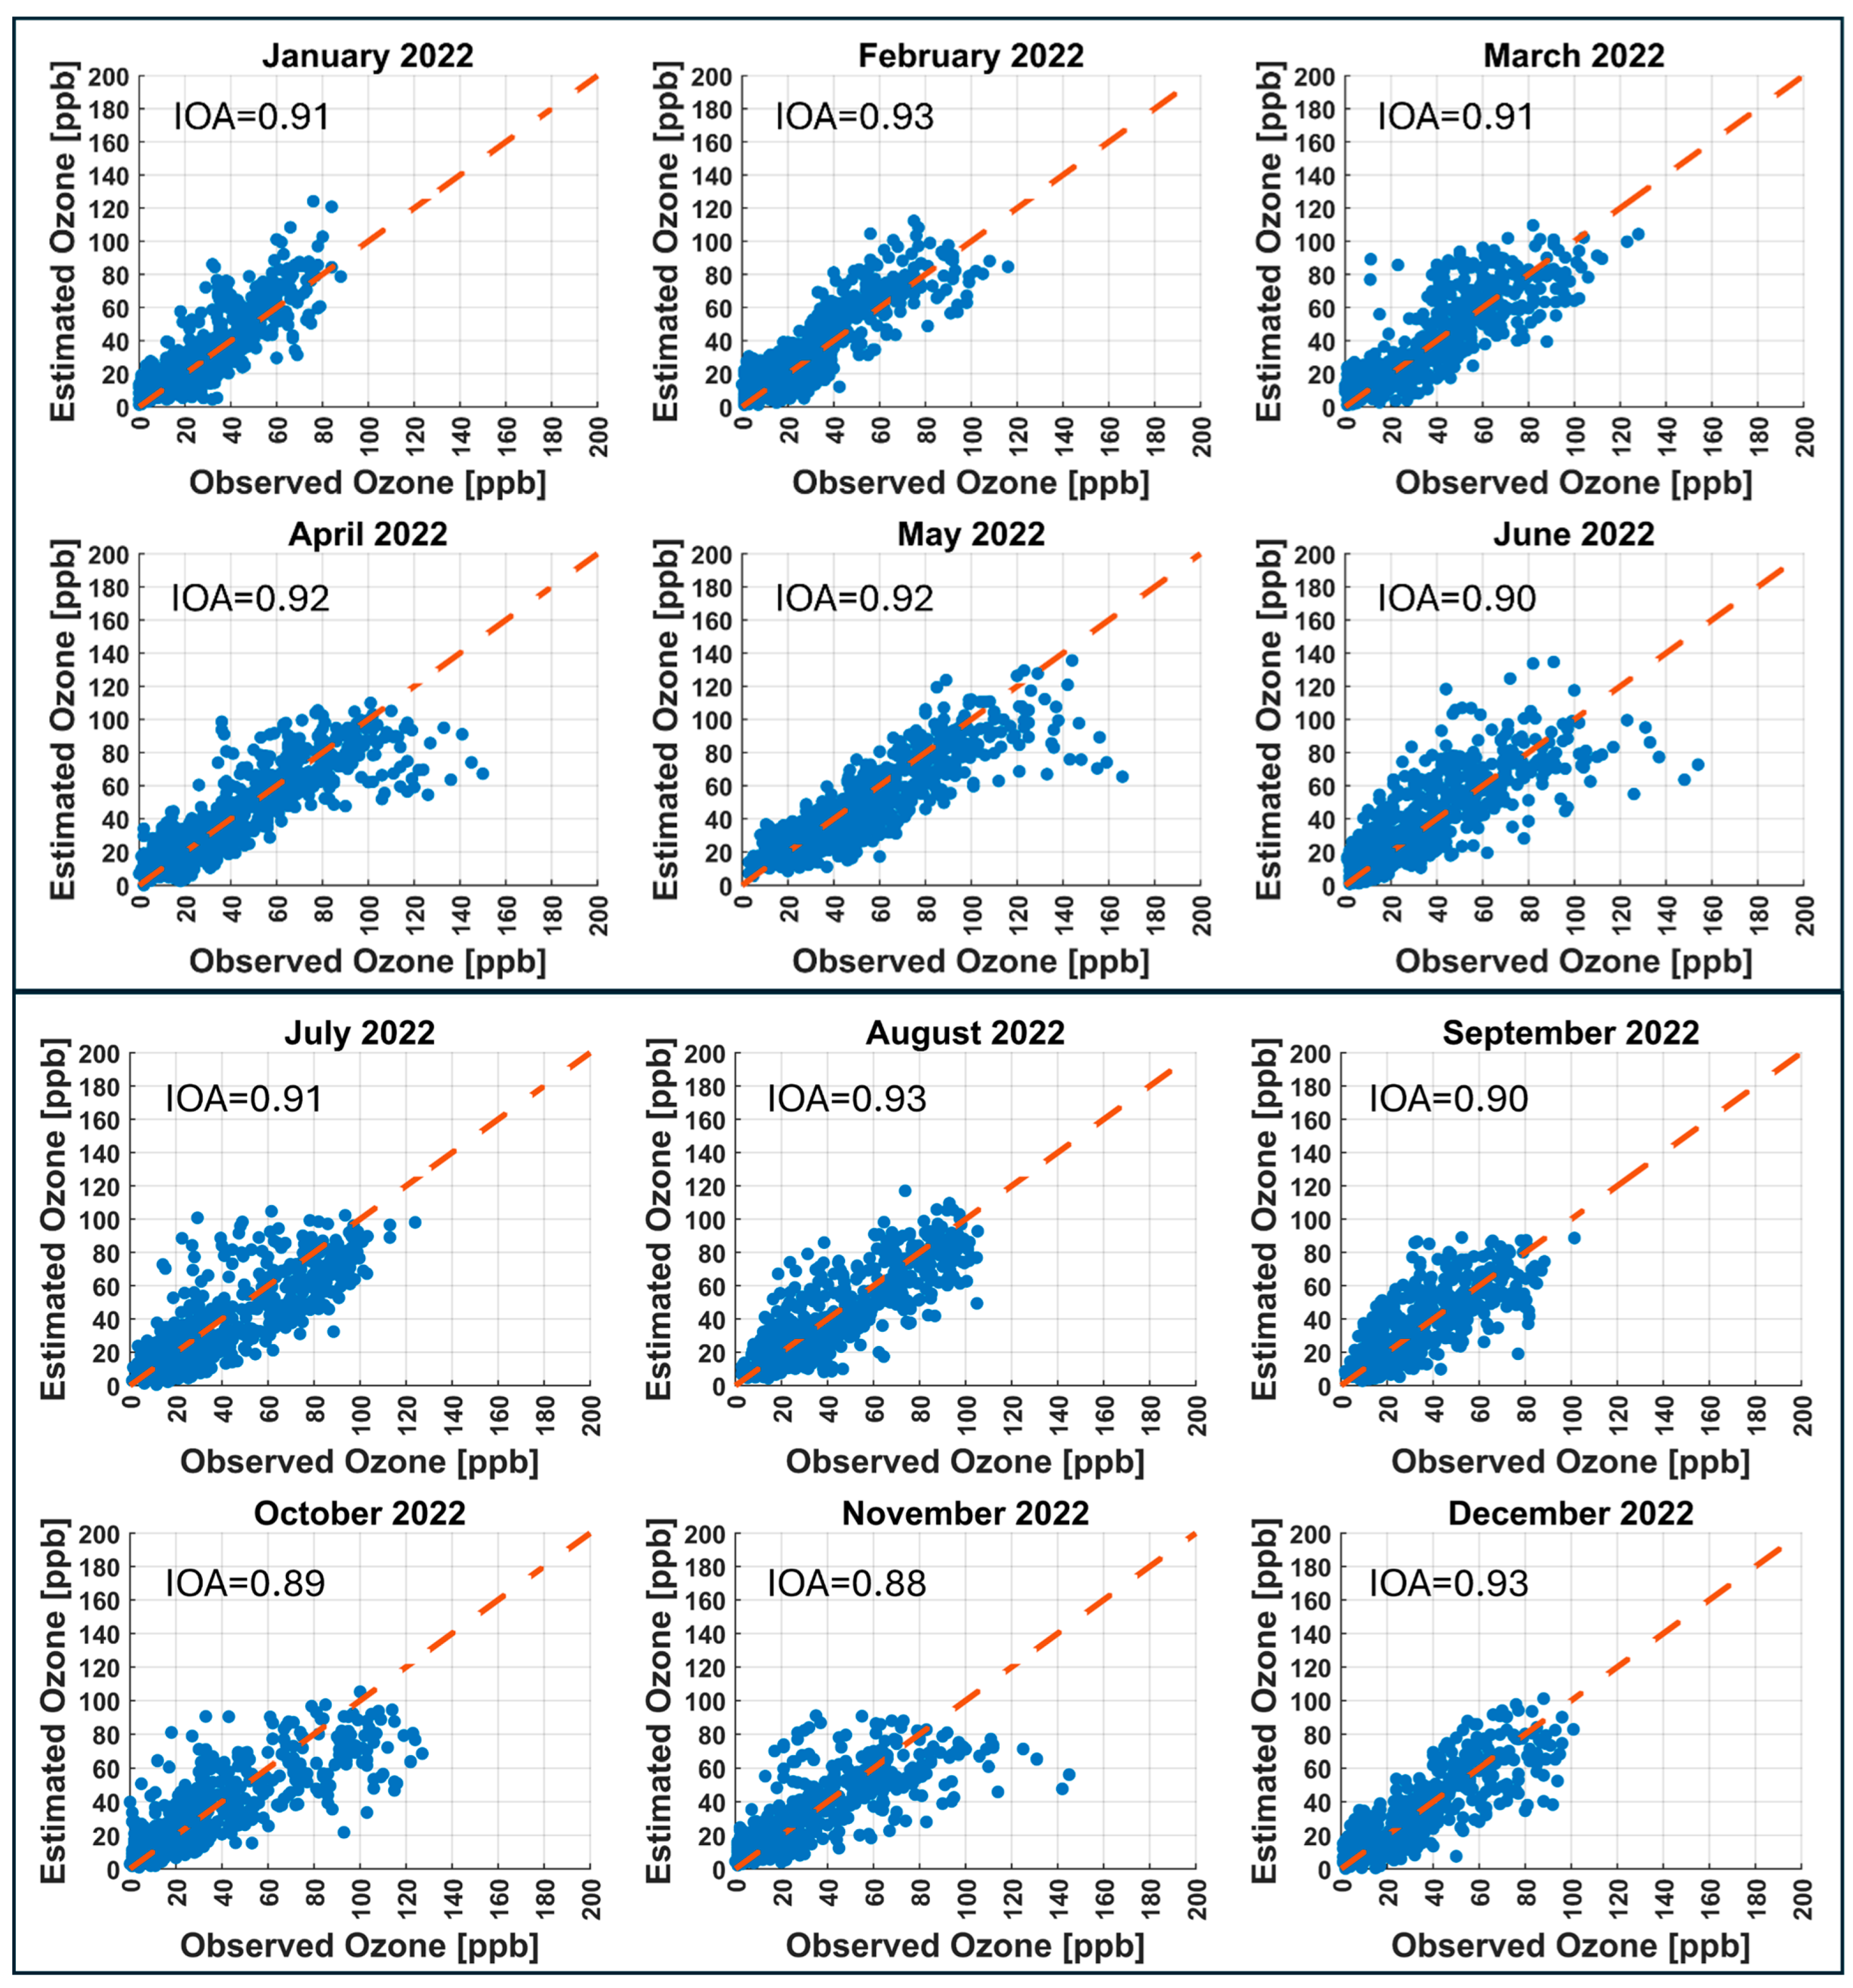
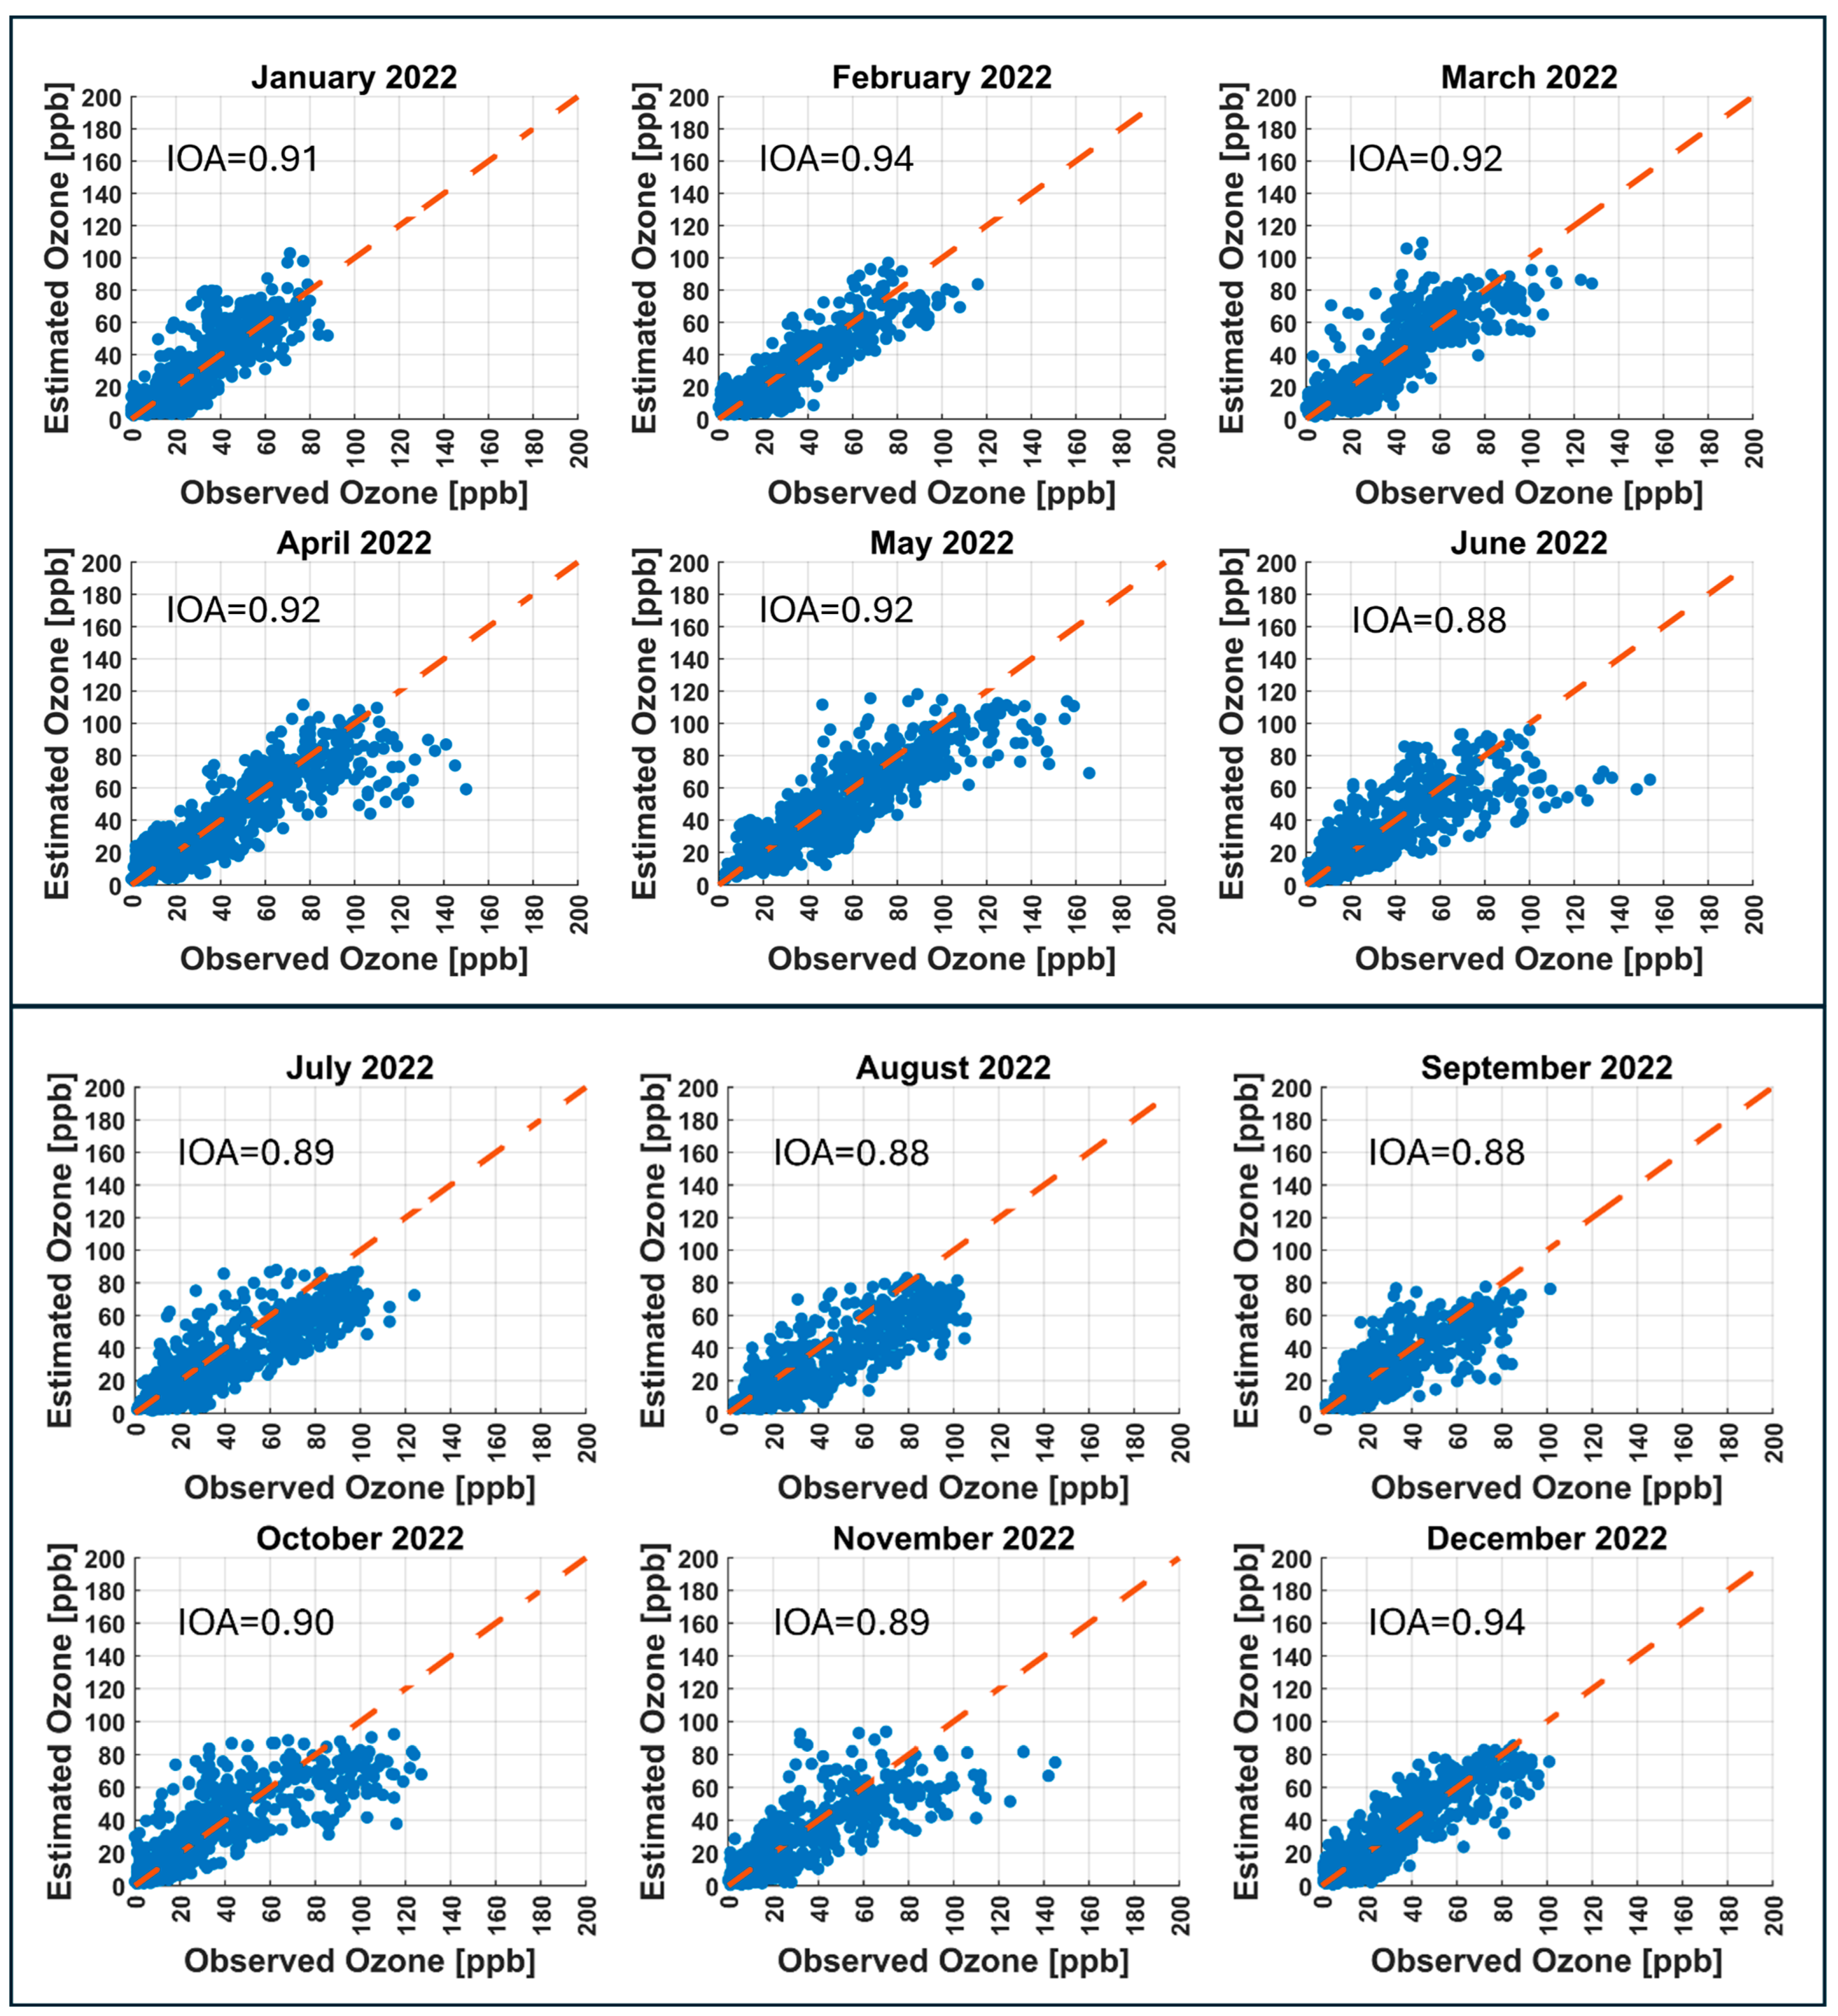
Here, we discuss the performance of ML models at individual stations. The time series of the observed (blue) and CNN model forecasted (green) hourly ozone concentrations over the year 2022 is exemplarily shown for the PED station located in the southwest sector of Mexico City (Figure 10), and the corresponding scatter plots are depicted in Figure 11. As the trained models map current day data of the predictors onto the next day ozone concentrations, that is first day of each month is utilized to forecast second day, second day to forecast the third day, and second last day to forecast the last day, the number of forecasted days in each month showing up in Figure 10 is one less than the actual number of days in the month. The variations in near-surface ozone concentrations during the day are consequential and are influenced by several factors, including temperature, sunlight intensity, emissions, atmospheric dynamics, and human activities. From Figure 10, it is evident that the CNN model accurately represents the variations in ozone during night when ozone concentrations decrease because there is no sunlight, and processes that remove ozone, in particular the titration process with nitric oxide, dominate. The model is also capturing the daily minimum ozone which takes place near early morning just before the sunrise when intensity of shortwave radiation is too weak to start ozone formation process and rush hour emissions efficiently titrate ozone, but to some extent the model is underestimating the peak ozone concentration during the afternoon when shortwave radiation intensity is still appreciable after its noontime maximum and photochemical reactions that produce ozone from ozone precursors NOx and VOCs reach their daytime maximum [54].
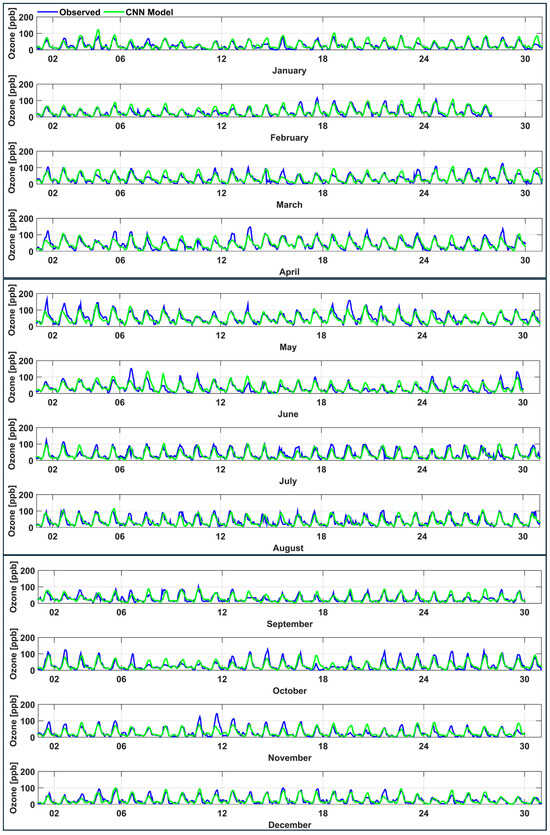
Figure 10.
The time series plots of the observed (blue) and CNN model forecasted (green) hourly ozone concentrations at the PED station for the year 2022.
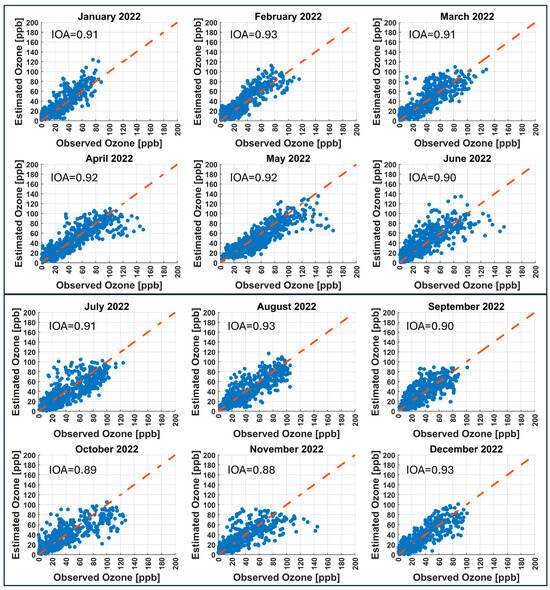
Figure 11.
The scatter plots of the observed and CNN model forecasted hourly ozone concentrations at the PED station for the year 2022.
The prevailing climate of Mexico City has three distinct seasons: (1) a cool–dry season (November to February), (2) a warm–dry season (March to May), and (3) a rainy season (June to October). Diurnal behavior of ozone on a typical day (9 January, 6 May, and 6 October 2022) during the three seasons is depicted in Figure 12. Ozone concentrations are typically low in the early morning, increase by midday due to stronger solar radiation and photochemical activity, and reach their highest levels in the afternoon, especially during the warm dry season. Evening concentrations decrease, with the sharpest decline usually occurring during the cool–dry and rainy seasons. The scatter plots depicted in Figure 11 provide an insight into the monthly performance of the CNN model to forecast ozone concentrations at the PED station. The scatter plots where data points are close to the 1:1 line (red line with equation ) represent good forecast, while the scatter plots where the data points have more spread about the 1:1 line indicate underprediction or overprediction. The CNN model forecasts January, February, March, April, May, June, July, August, September, and December of the year 2022 with good accuracy (IOA ≥ 0.90) while it forecasts October and November with slightly lower IOA (0.89 and 0.88, respectively). The reason for the lower IOA might be that these months are within the transitional period, where seasons change. This reduction may be attributed to the transitional nature of October and November in Mexico City, when the region experiences a shift from the wet season to the dry season. During this period, meteorological conditions such as temperature, solar radiation, humidity, and wind patterns fluctuate significantly. These changes can affect ozone formation in multiple ways. For instance, reduced solar radiation during cloudy or overcast days can limit photochemical reactions that produce ozone, while variable wind patterns can alter the transport and dispersion of ozone, but also its precursors NOx and VOCs. All these factors contribute to increased complexity in the atmospheric behavior of ozone, which can reduce the model’s ability to accurately forecast ozone levels, particularly seen in the under- or overprediction of daytime peak values, causing slightly lower IOA values. The scatterplots between the observed and other models’ forecasted hourly ozone concentrations over the year 2022 at TAH, TLA, UAX, and UIZ stations are included in Figures S1–S4 in the Supplementary Material.

Figure 12.
Diurnal behavior of ozone on a typical day (9 January, 6 May, and 6 October 2022) during the three seasons (cool–dry (November to February), warm–dry (March to May), and rainy (June to October)).
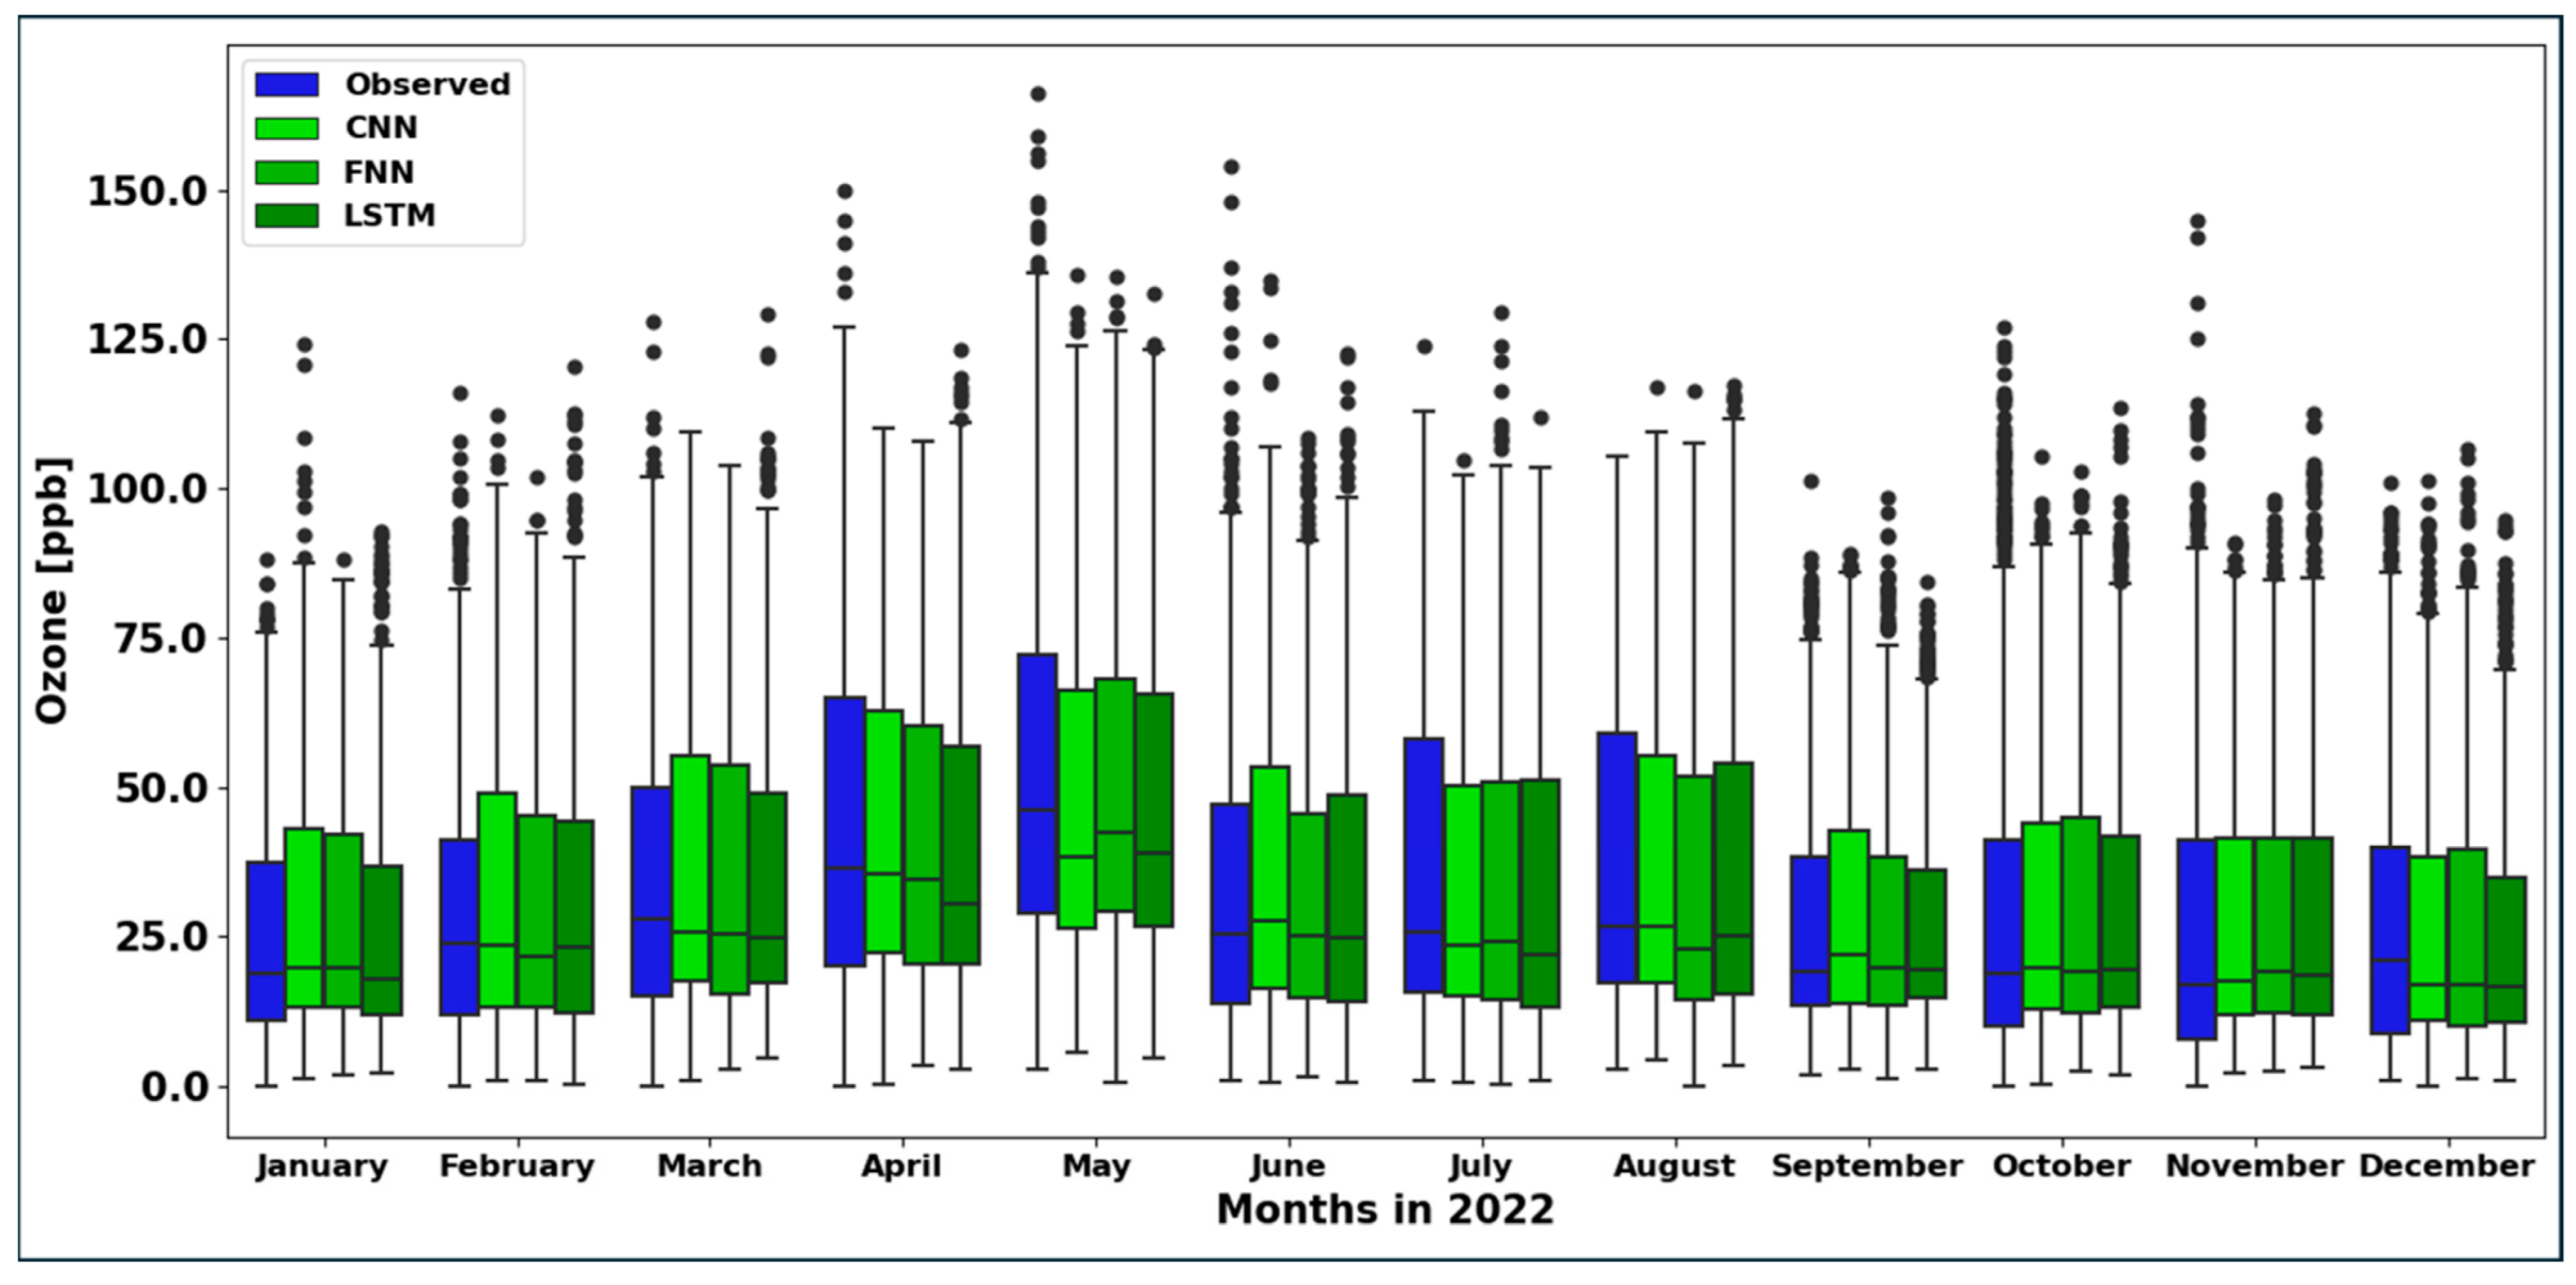
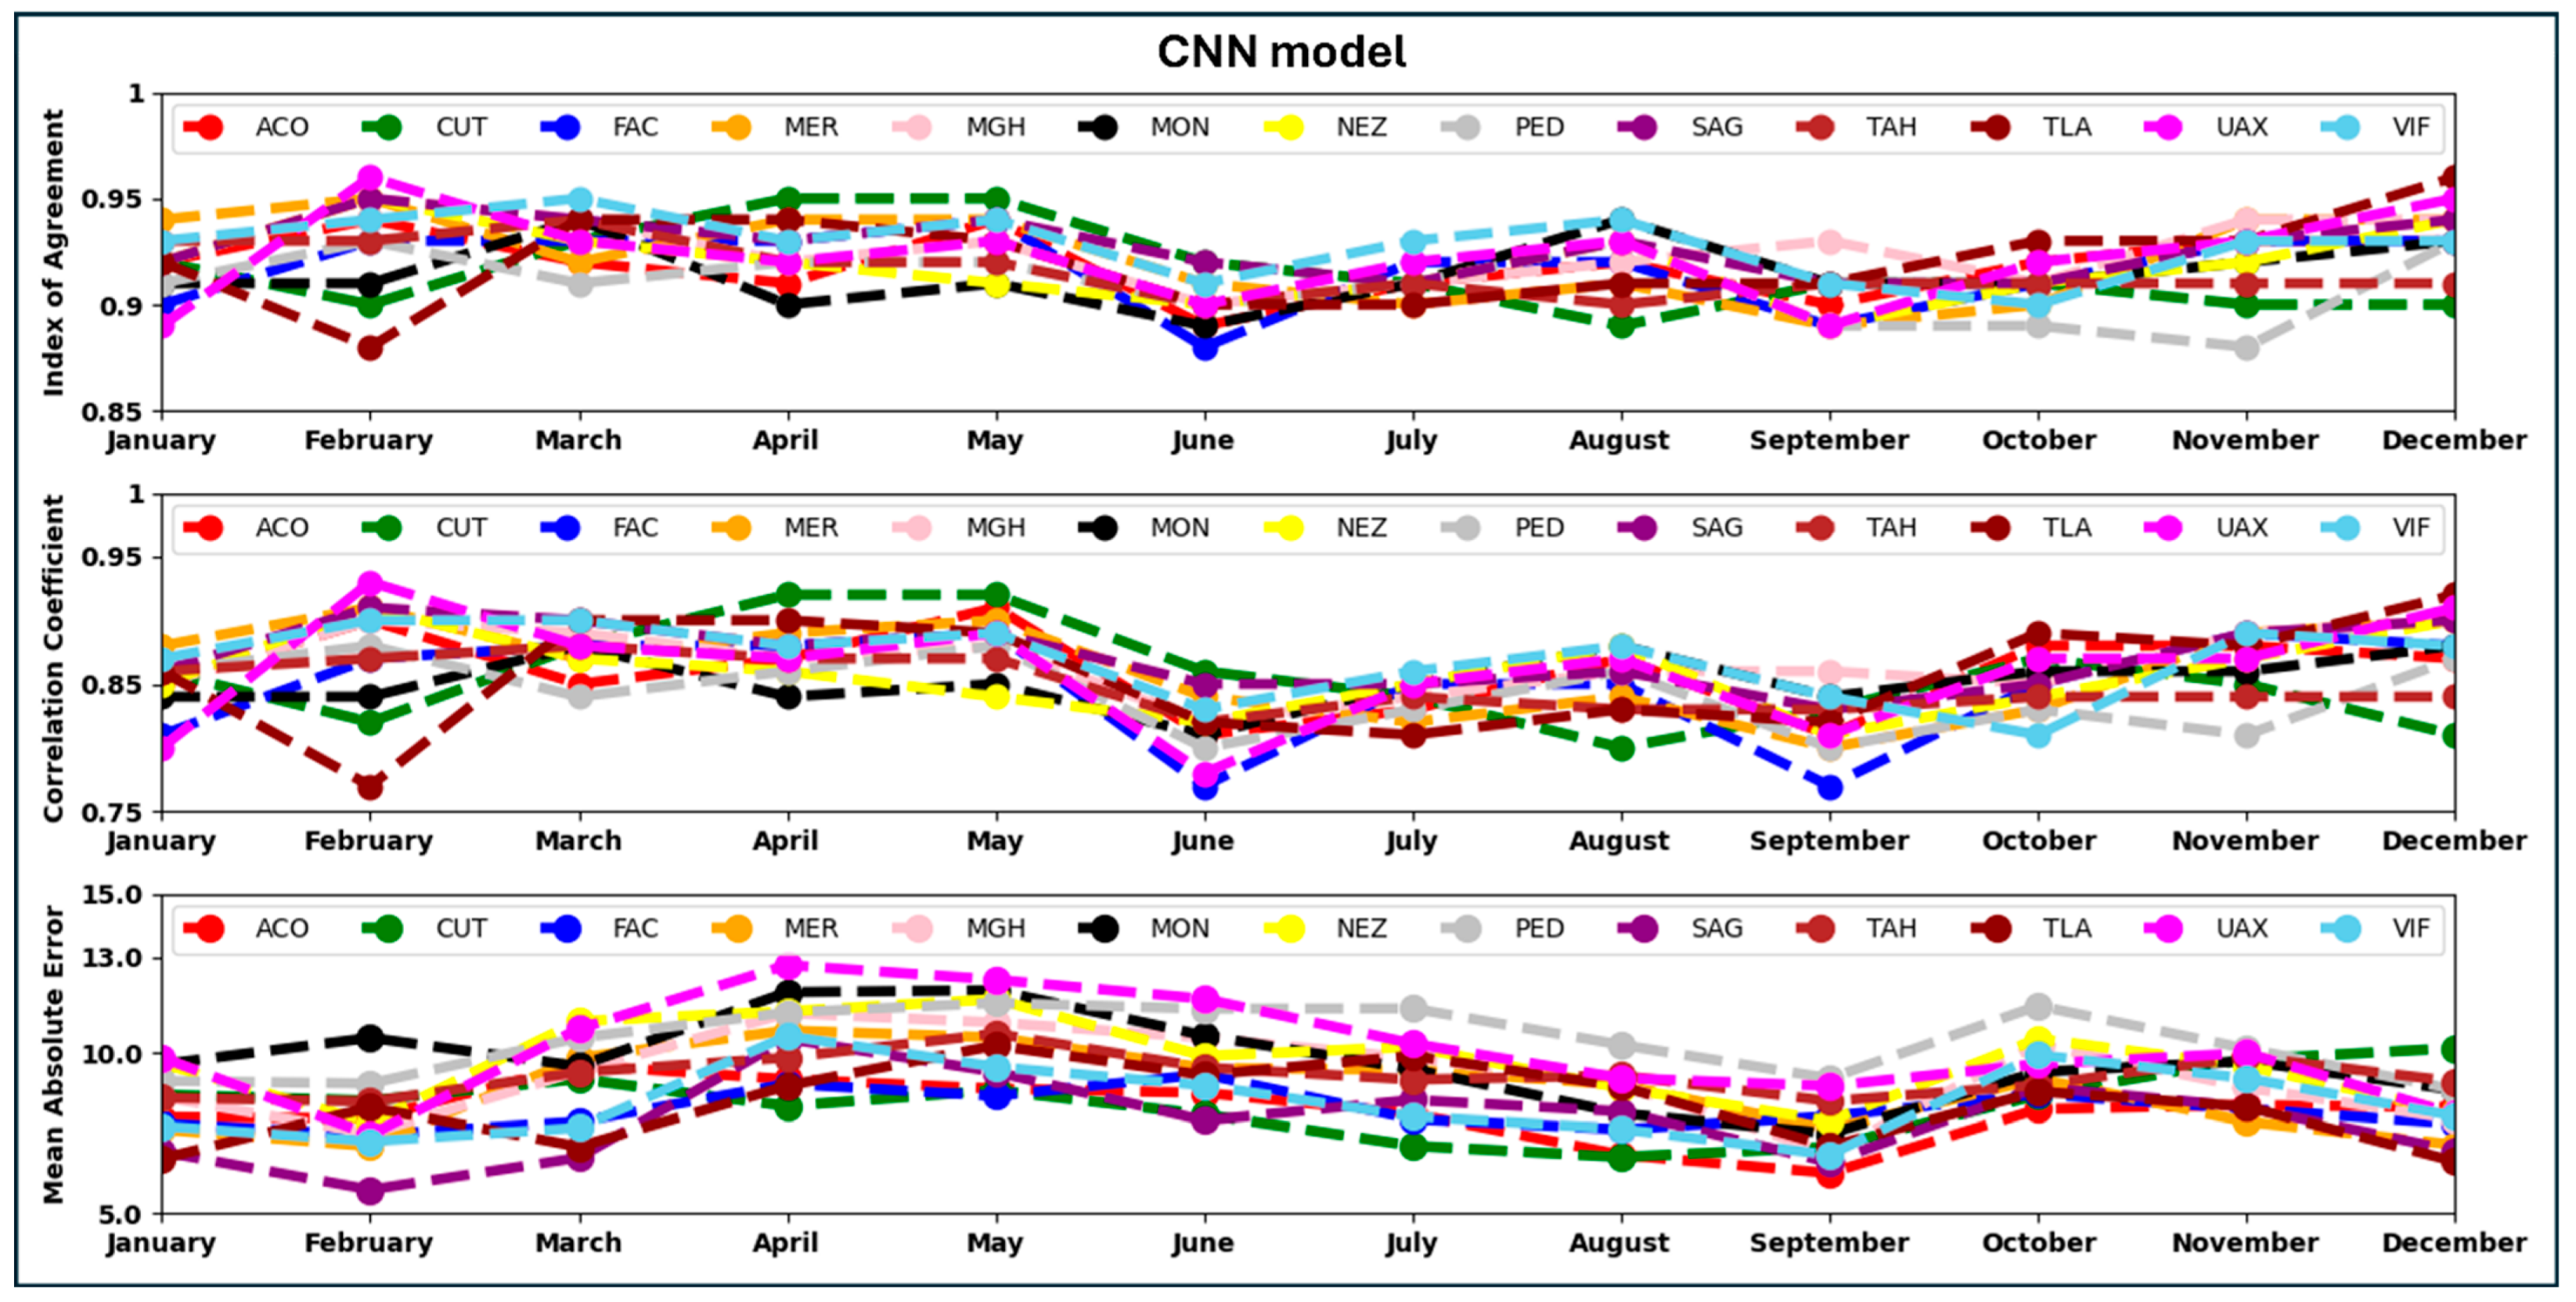
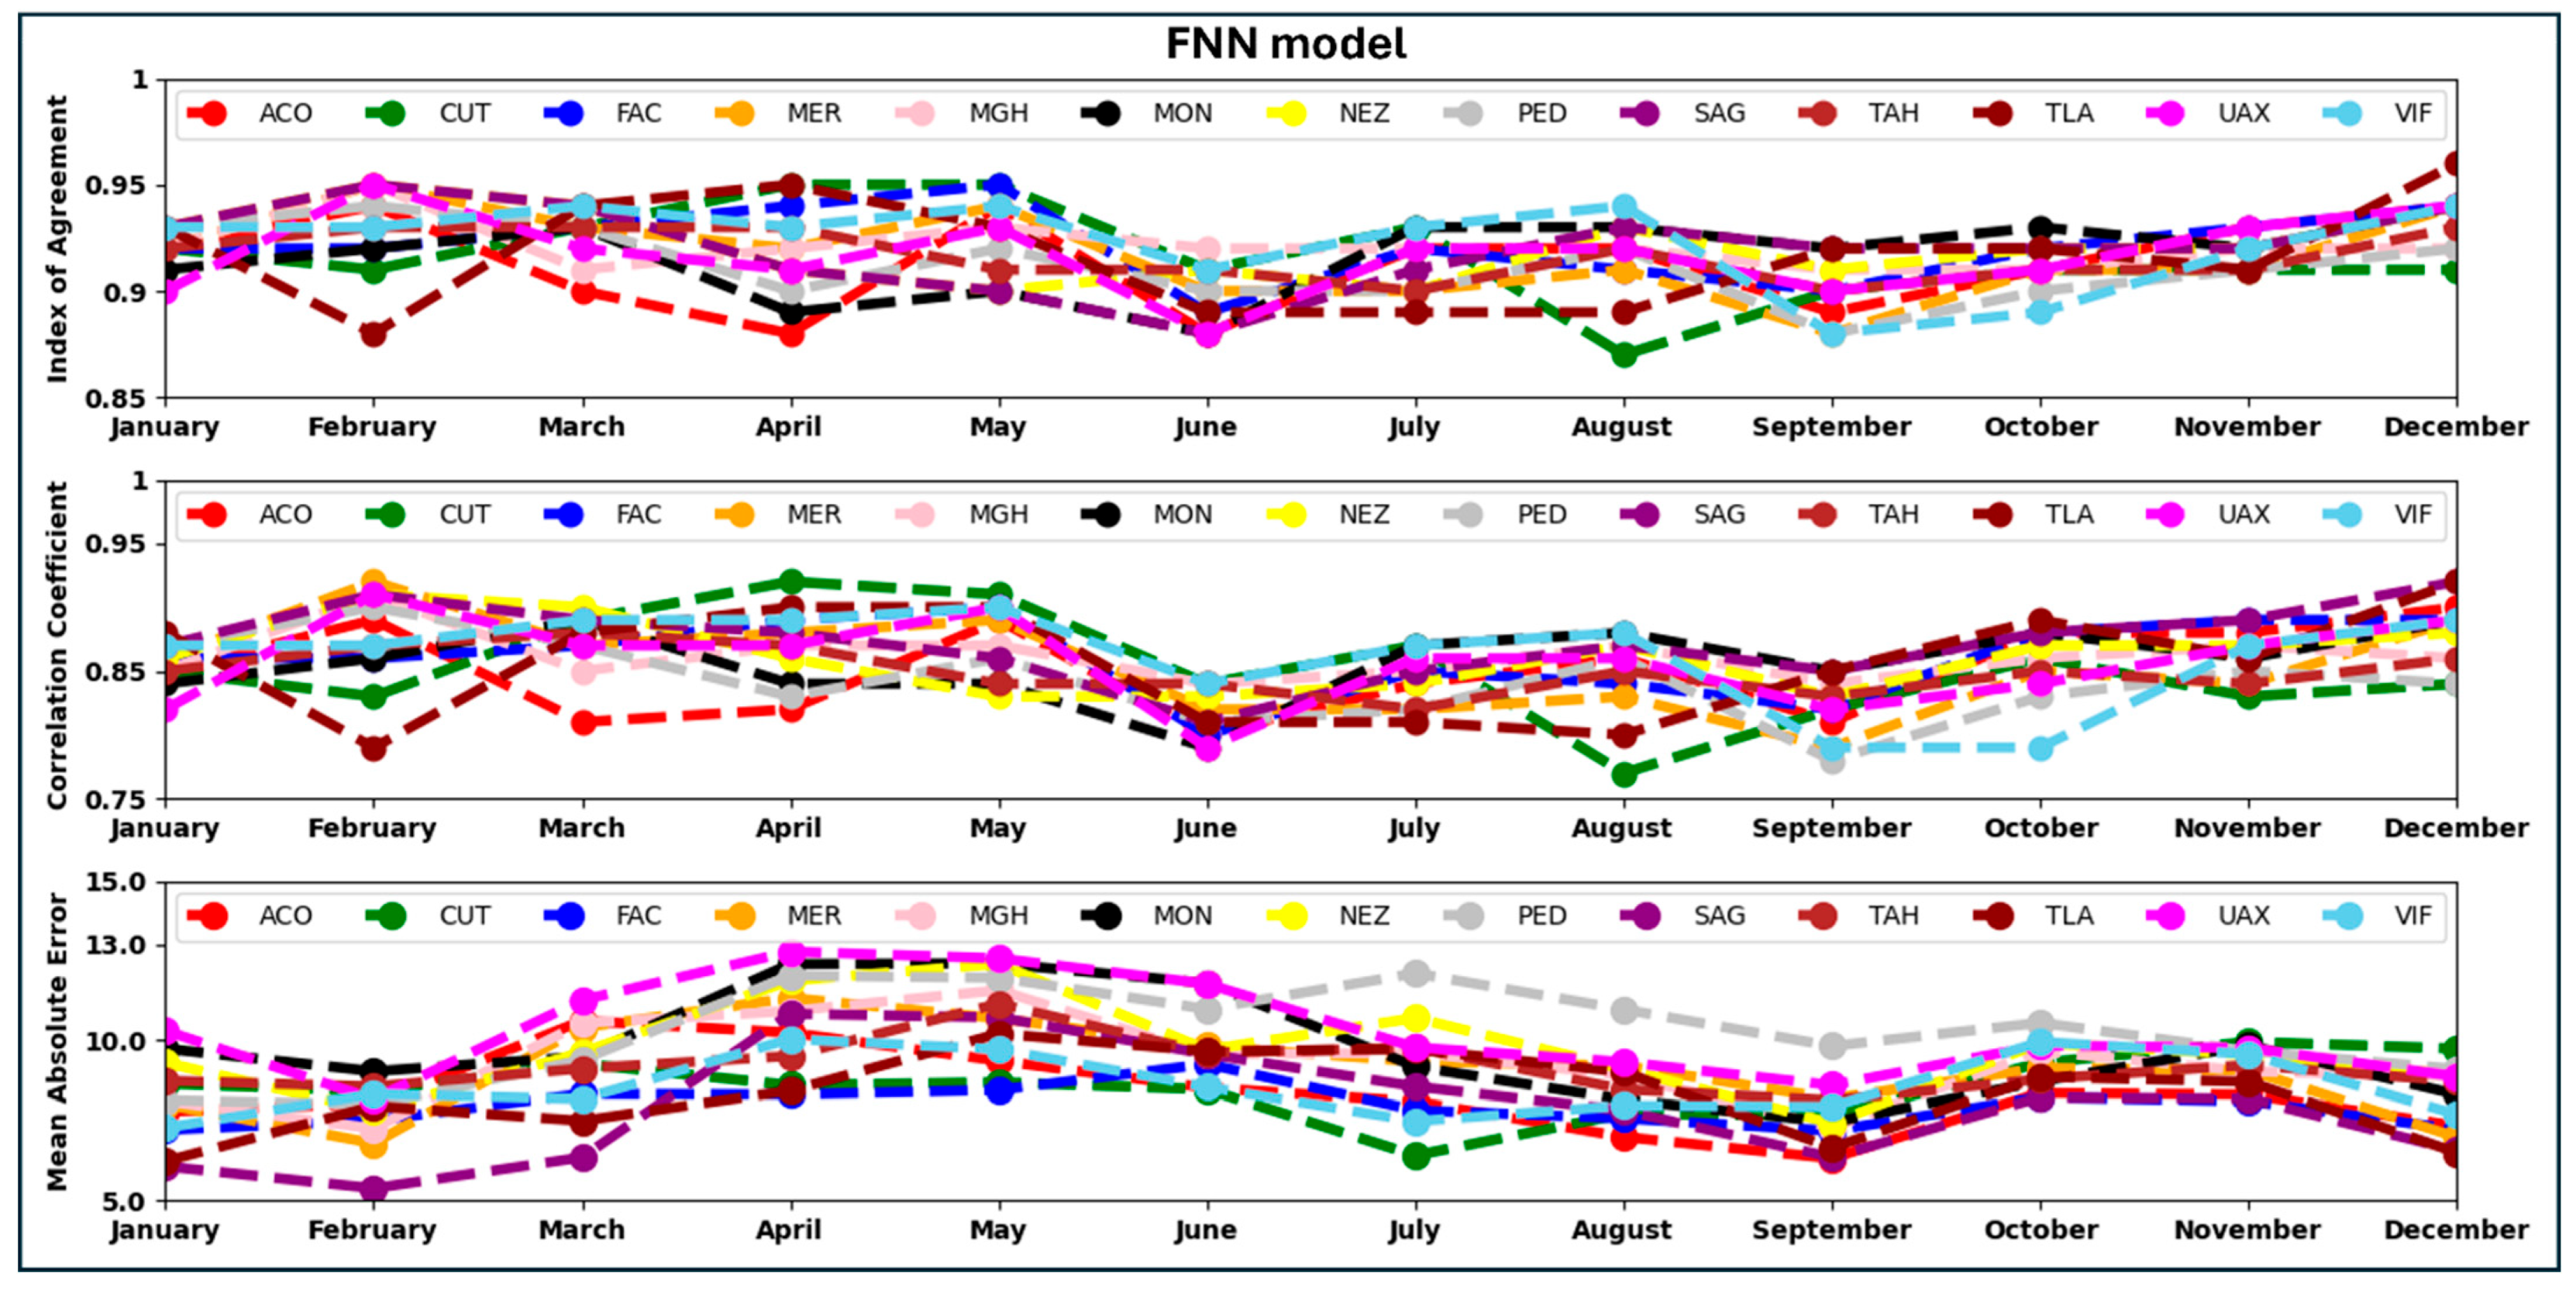
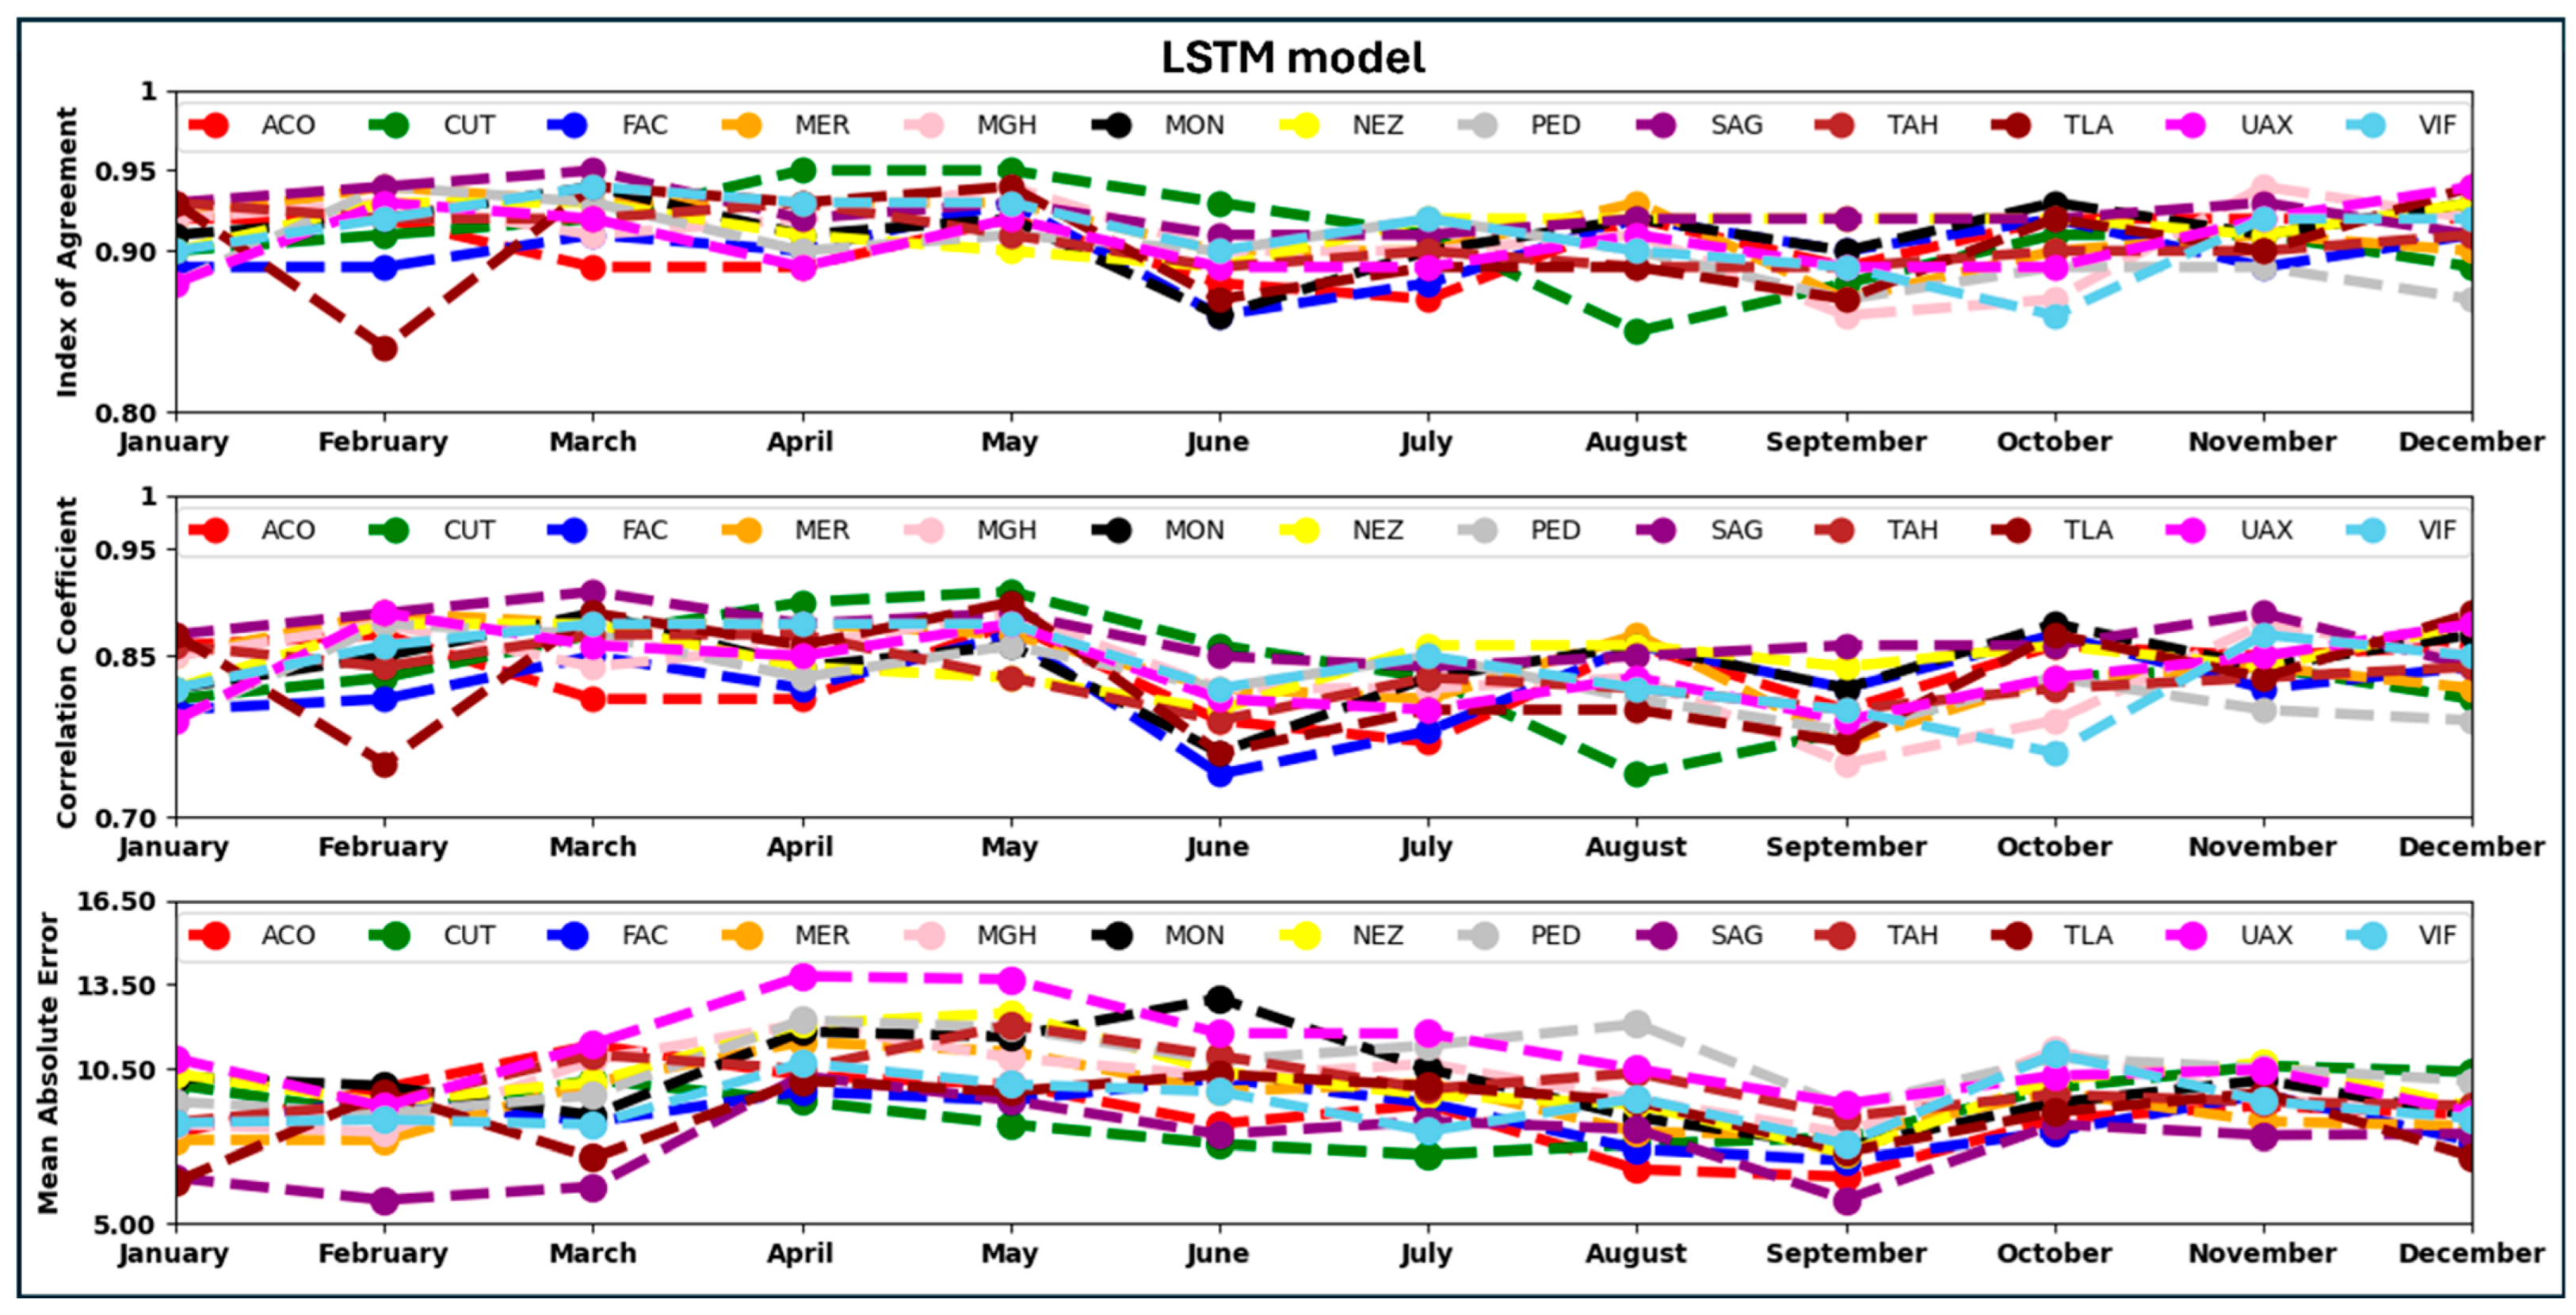
The box plots depicted in Figure 13 provide an insight into the monthly performance of the CNN, FNN, and LSTM models to forecast ozone concentrations at the PED station. From the box plots, it is evident that the performance of the CNN and FNN models is almost the same. The CNN model’s monthly performance on all stations for the year 2022 is shown in Figure 14. The performance of the CNN model ranges from IOA = 0.89 at the UAX station to IOA = 0.94 at the MER station in January (mean IOA for all stations in January 2022 is 0.92). During February 2022, the performance of the CNN model at the UAX station was maximum with an IOA of 0.96 and minimum at the TLA station with an IOA of 0.88. The average IOA of all stations from the CNN model in February 2022 is 0.93. The mean IOA in January and February 2022 is almost the same, but the IOA values in February 2022 have a greater spread about the mean value than the IOA values in January 2022. The least IOA value, 0.88, occurs in February and June 2022 at the TLA and FAC stations. And the highest IOA value, 0.96, is in December 2022 at the TLA station. Figure 15 presents the monthly performance of the FNN model across all stations in 2022. In January, the CNN model’s IOA ranged from 0.87 at the CUT station to 0.96 at the TLA station, with an average IOA of 0.92 across all stations. In February, the highest IOA value of 0.95 was observed at the UAX, SAG, NEZ, and MER stations, while the lowest was 0.88 at the TLA station. The mean IOA for February was 0.93. Although the average IOA values for January and February are nearly the same, the February values show a wider distribution around the mean. The lowest IOA recorded for the year was 0.87 at CUT in August, while the highest, 0.96, occurred at TLA in December. Figure 16 depicts the LSTM model’s monthly performance across all stations in 2022. The minimum IOA value of 0.84 was observed at the TLA station in February, whereas the maximum value of 0.95 was recorded at the SAG station in March. The IOA, R, and MAE values generated by FNN and LSTM models for all stations for the year 2022 are given in Tables S3 and S4 of the Supplementary Material.
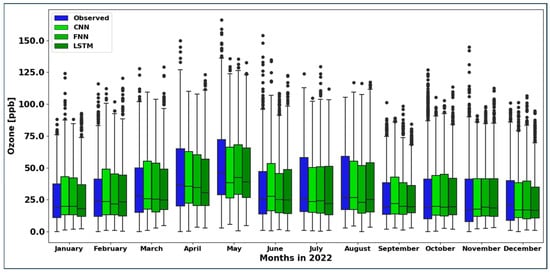
Figure 13.
The box plots of the observed (blue), CNN model forecasted (light green), FNN model (dark green), and LSTM model (darker green) hourly ozone concentrations at the PED station for the year 2022.
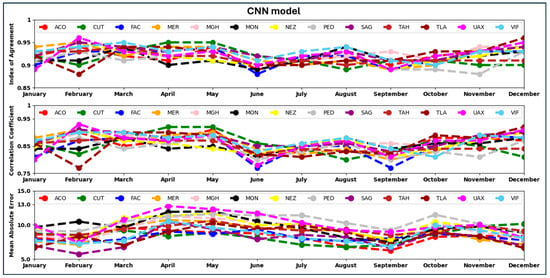
Figure 14.
CNN model’s monthly performance, month-wise, on all stations for the year 2022.
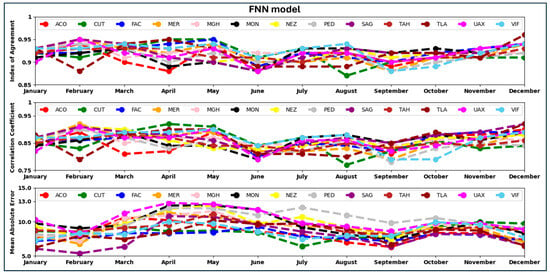
Figure 15.
FNN model’s monthly performance for all stations for the year 2022.
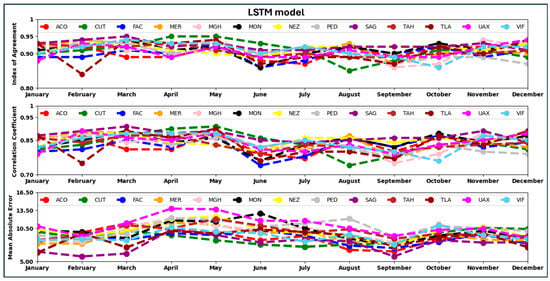
Figure 16.
LSTM model’s monthly performance for all stations for the year 2022.
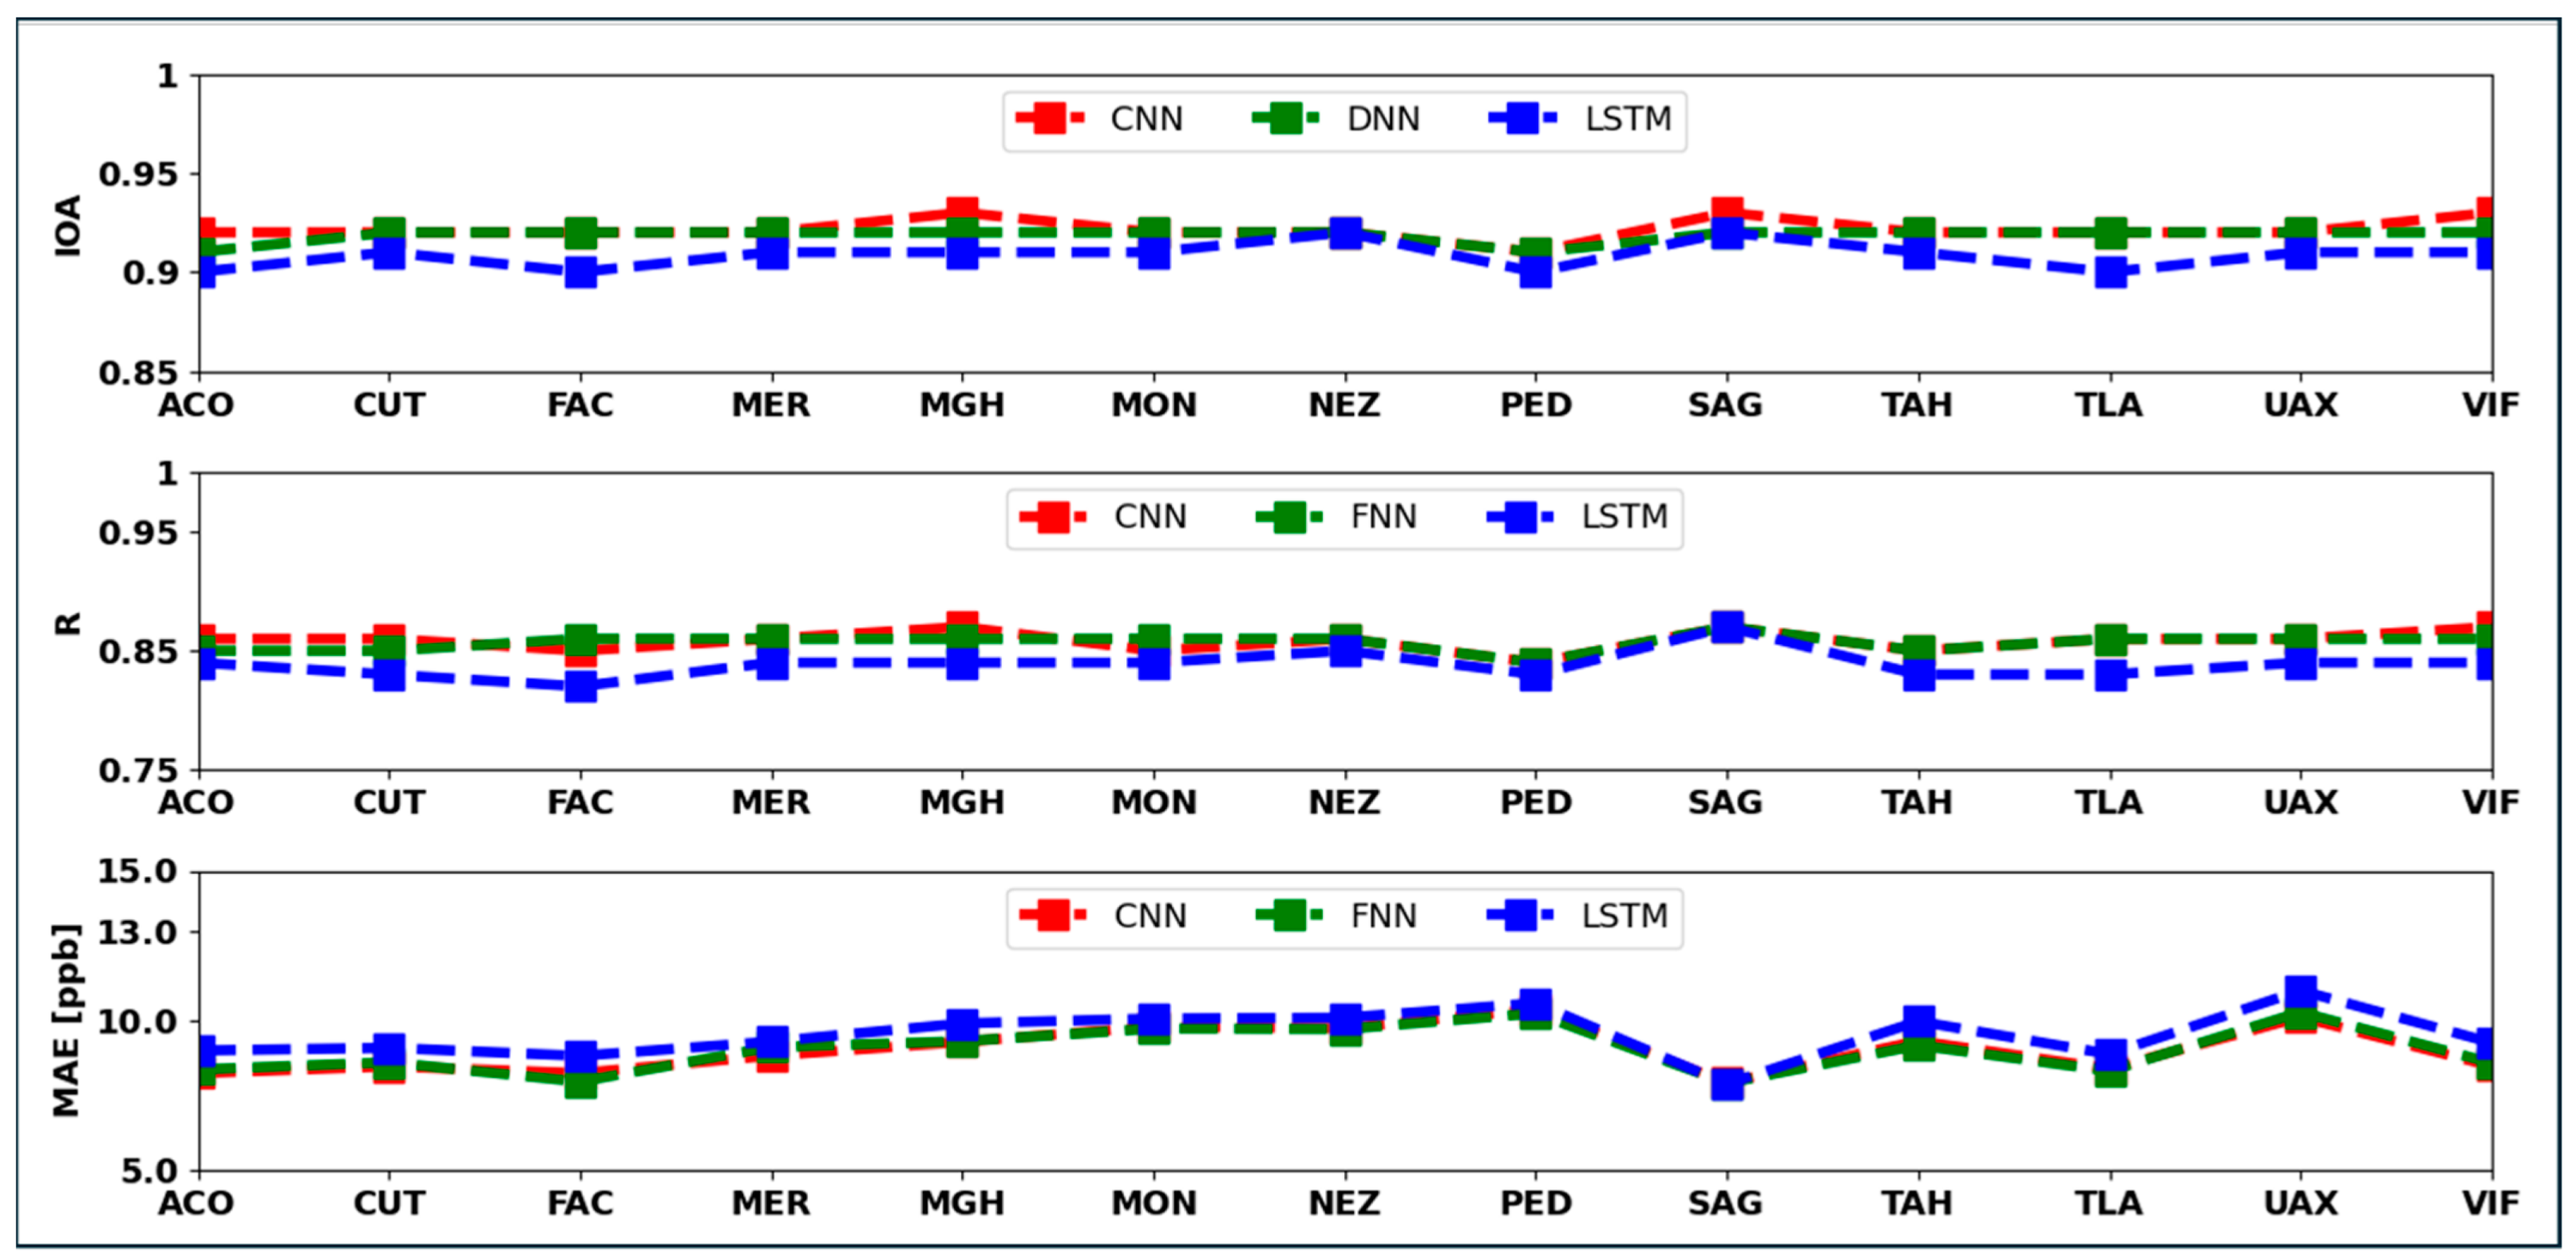
The yearly averaged IOA, R, and MAE over the year 2022 for all stations are shown in Figure 17. From Figure 17, it is evident that the performance of the CNN and FNN models is almost the same, and the performance of the LSTM model is a bit lower than the performance of the CNN and FNN models for all the stations.
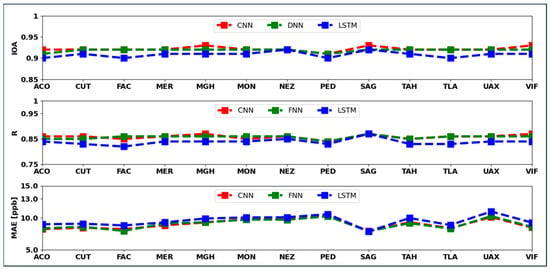
Figure 17.
Averaged IOA, R, and MAE for the year 2022 for each station.
4.2. Reginal Scenario
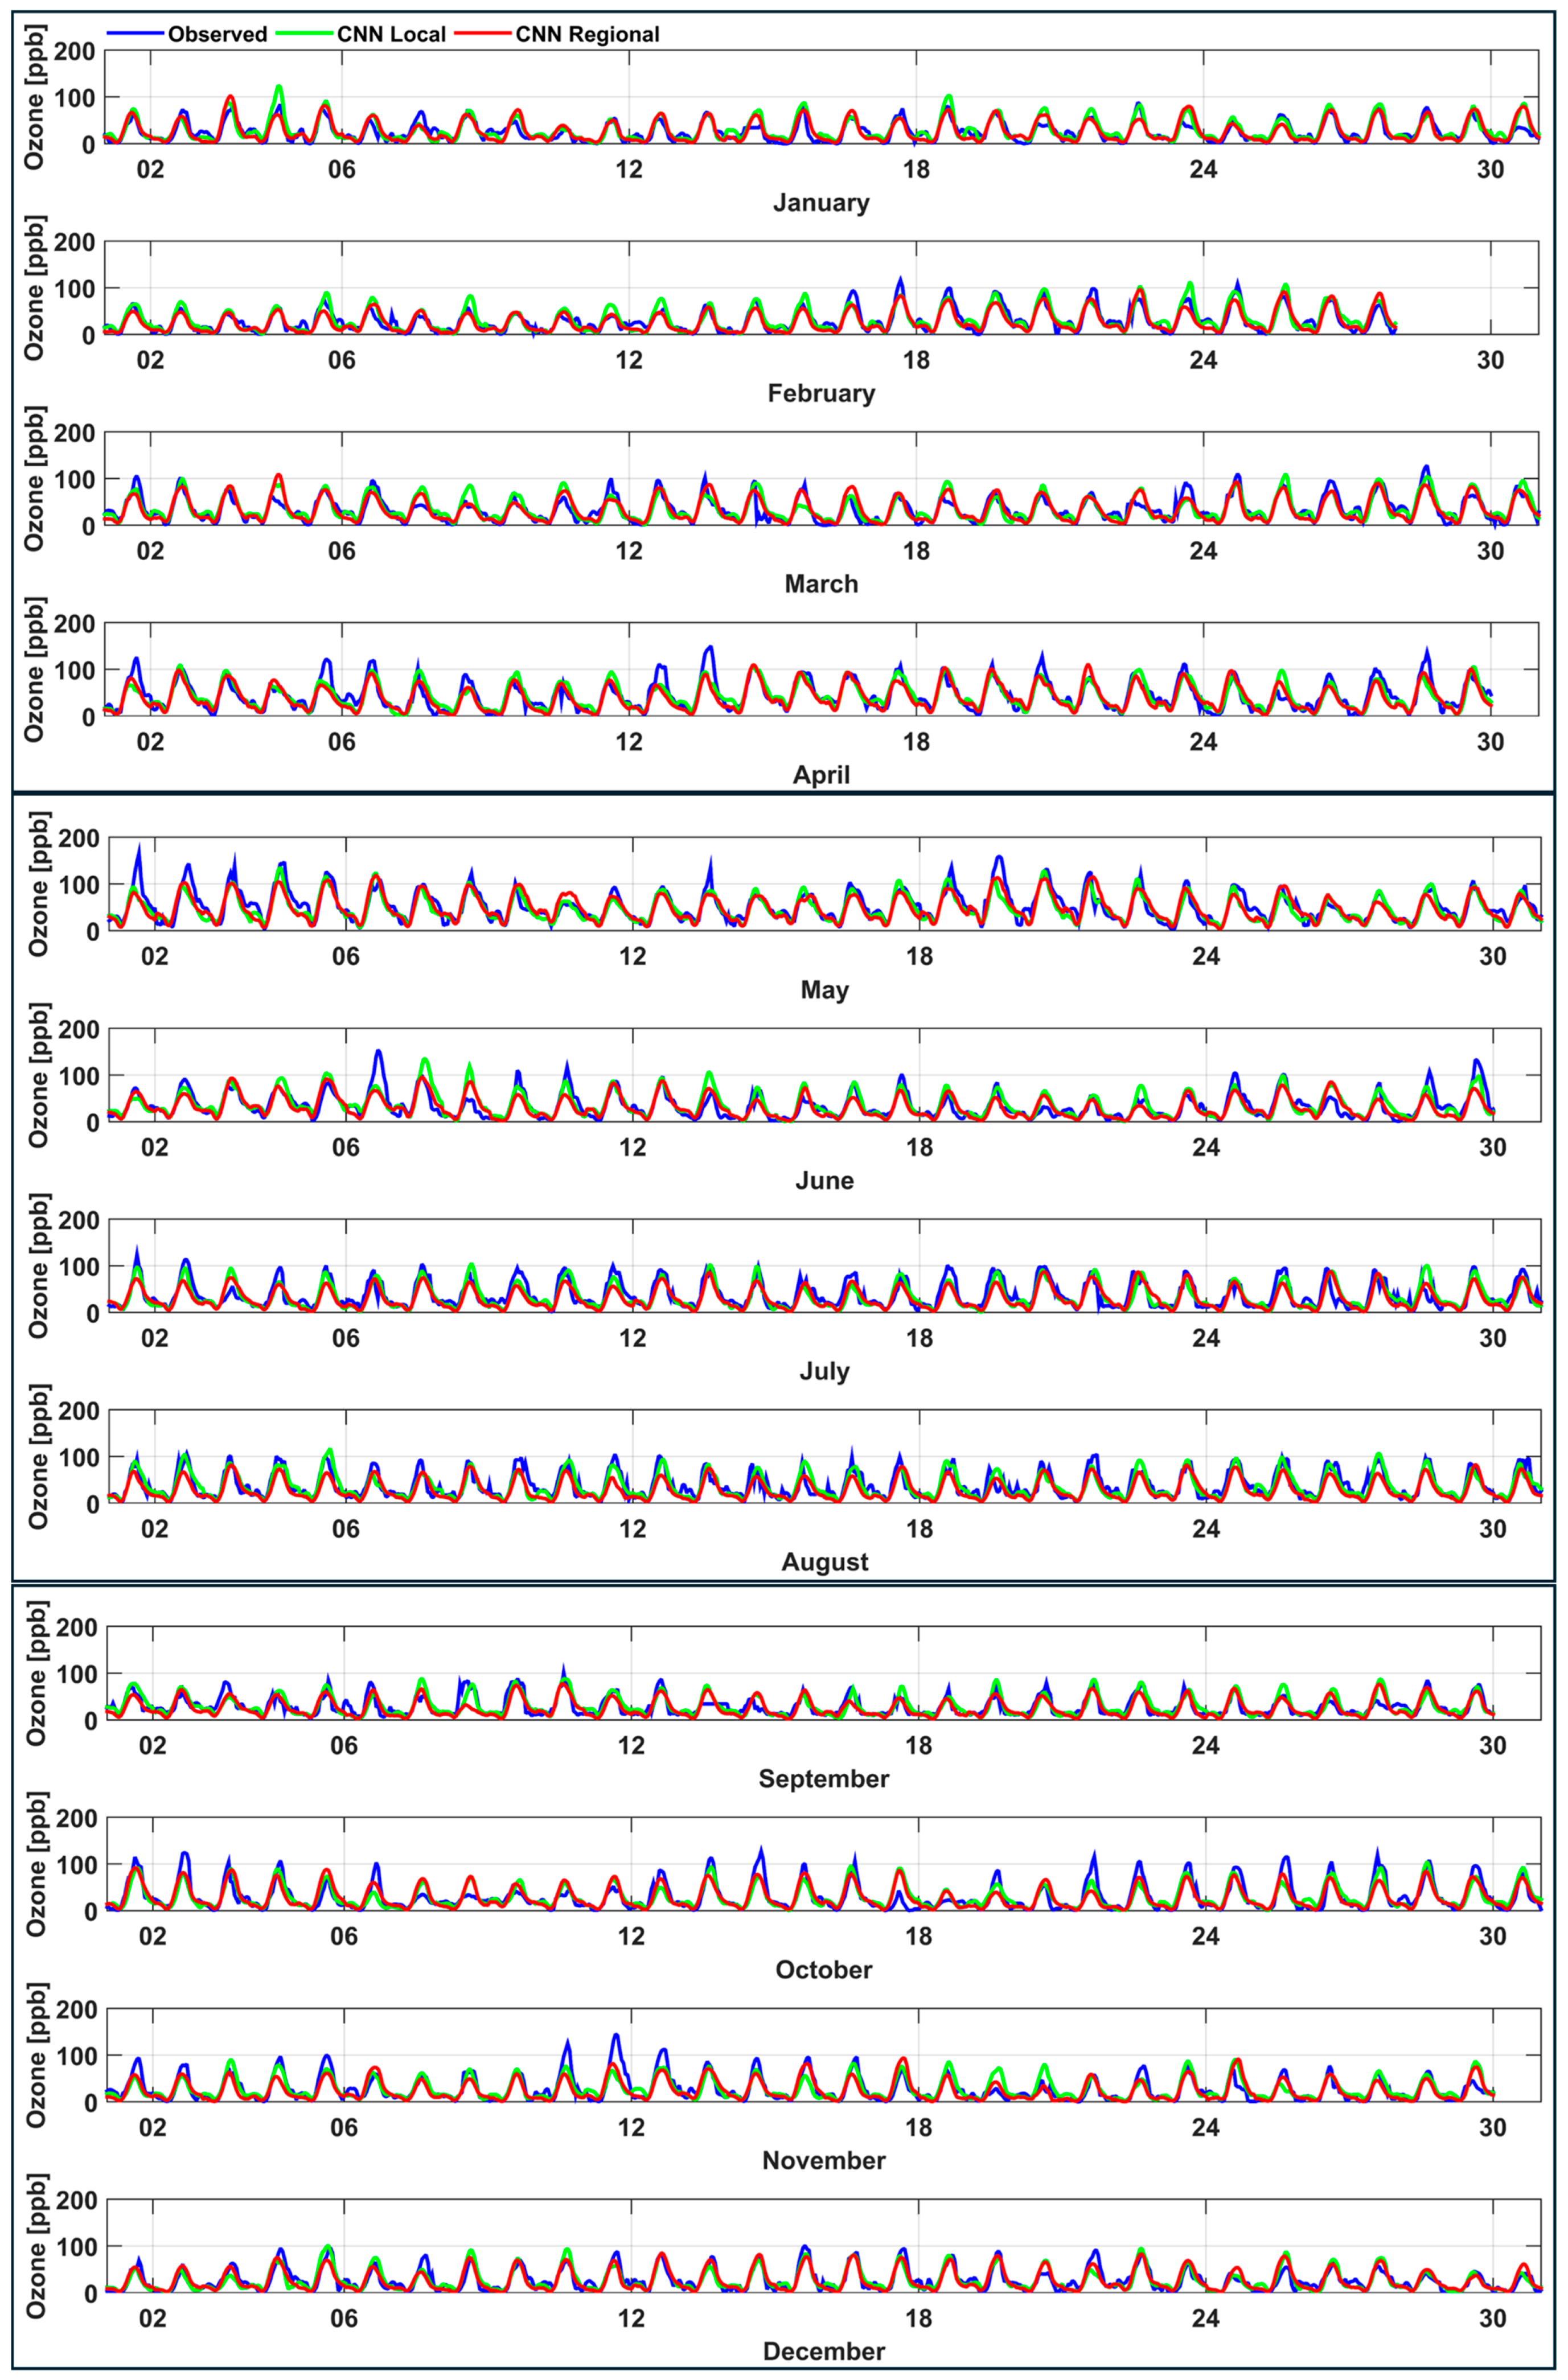
From the local scenario discussed above, it is evident that the CNN model is the best model among the studied models, and it outperforms the FNN and LSTM models in forecasting ozone concentrations over the year 2022. Therefore, we only consider the CNN model in the subsequent analysis of the reginal scenario. Seven years of data (2015 through 2021) from 12 stations were pooled to train the CNN model. Two stations (MER and PED) located in the center and the southern region of Mexico City were kept out of the training process and held for testing the performance of the trained CNN model under this scenario. Testing the CNN model at the two stations, MER and PED, was carried out in a monthly fashion, updating the training process after the forecast of each month. Firstly, we trained the CNN model on the 12 stations’ pooled data and forecasted the entire January 2022 at the MER station. After this, the entire January 2022 data from the MER station was put into the training dataset; the CNN model was trained again, and ozone concentrations for February 2022 at the MER station were forecasted. Before forecasting March 2022, the training dataset was extended to include February 2022 data (ingested from the MER station), and the CNN model was trained again. The process was repeated for the other months of 2022 till December 2022. Similar steps were applied to forecast the year 2022 for the PED station. The time series of the observed (blue), CNN model forecasted (green, considering local scenario), and CNN model forecasted (red, considering regional scenario) hourly ozone concentrations over the year 2022 for the PED station are shown in Figure 18, and the corresponding scatter plots considering the regional scenario are depicted in Figure 19. Diurnal behavior of ozone on a typical day (9 January, 6 May, and 6 October 2022) during the three seasons is depicted in Figure 20. The CNN model trained under the regional scenario accurately represents the variations in ozone on 9 January and 6 May 2022; the model slightly overestimates ozone on 6 October 2022. Figure 18 and Figure 19 clearly illustrate that the CNN model trained under the regional scenario shows performance very similar to the one trained under the local scenario (see Figure 11 and Figure 19). The IOA values for January, April, and May are identical in both cases. In February, March, October, November, and December, the regional model has slightly higher IOAs, whereas in June, July, August, and September, the IOAs are slightly lower compared to the local model. An added advantage of the CNN model trained in the regional scenario is that it can be used to forecast ozone concentrations at monitoring stations where training data are minimal or entirely absent. The time series and the corresponding scatter plots considering the regional scenario for the MER station are depicted in Figures S5 and S6 in the Supplementary Material.
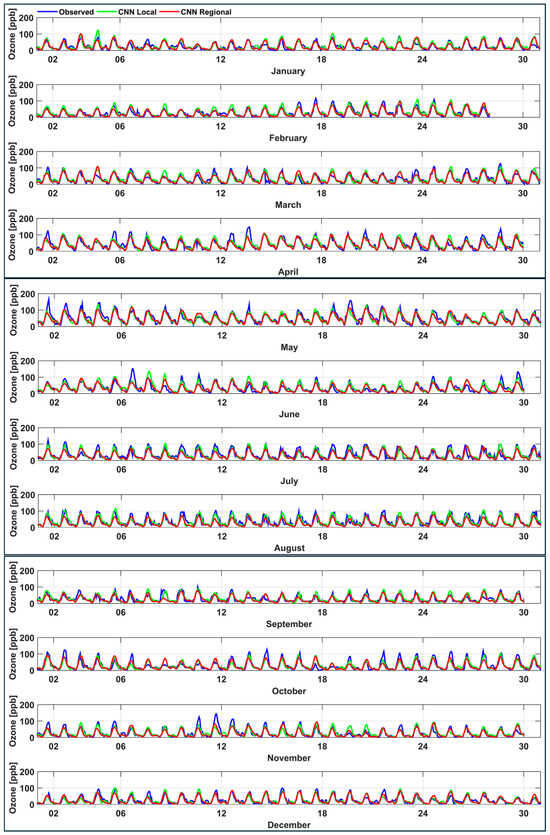
Figure 18.
The time series of the observed (blue), CNN model forecasted (green, considering local scenario), and CNN model forecasted (red, considering regional scenario) hourly ozone concentrations over the year 2022 for the PED station.
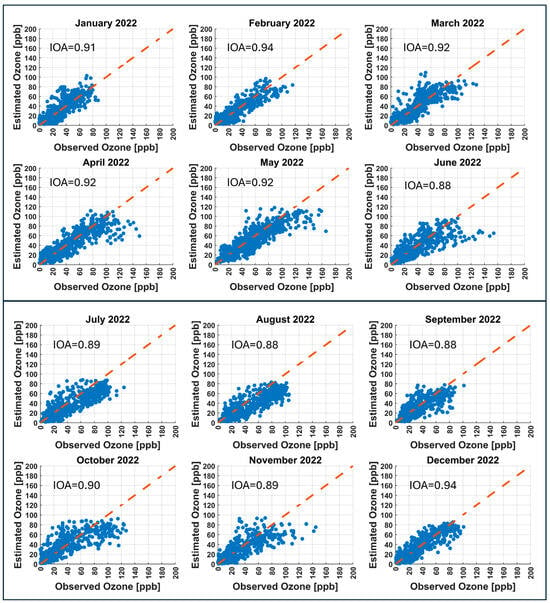
Figure 19.
The scatter plots of the observed and CNN model forecasted (considering regional scenario) hourly ozone concentrations at the PED station for the year 2022.

Figure 20.
Diurnal behavior of ozone on a typical day (9 January, 6 May, and 6 October 2022) during the three seasons (cool–dry (November to February), warm–dry (March to May), and rainy (June to October)).
5. Conclusions and Recommendations
This research deals with advanced prediction of ozone (O3) that can save considerable adverse effects caused by high-level ozone exposure and provide sufficient time to take preventive measures. We present a machine-learning (ML) approach to forecast the next day’s 24-h ozone concentrations, a robust upgradation mechanism to maintain the forecast accuracy of the machine-learning models for a long time, and a unique hyperparameter tuning for each ML model to train them at any individual station out of 14 monitoring stations across Mexico City. While this research focuses on Mexico City as a case study, its principles are applicable to any other city in the world. Three machine-learning models, including a convolutional neural network (CNN), and two other models, are considered to forecast the next day’s 24-h near-surface ozone concentrations. The models were trained and tested utilizing eight-year data acquired from monitoring stations in Mexico City. The trained models generalize well and forecast the next day’s 24-h ozone concentrations at all the selected stations with good accuracy. The CNN model with a yearly averaged index of agreement of 0.90 or more at each station outperforms the other two models at each station and has the potential to forecast the next day’s 24-h near-surface ozone concentrations in Mexico City in a real scenario. The testing of the models was carried out at each station utilizing a robust upgradation mechanism that maintains the forecast accuracy of the machine-learning models. The models were tested in a monthly fashion, updating the training process after the forecast for each month. The upgradation mechanism discussed in this research is equally applicable in real scenarios as well. The hyperparameter tuning of the three ML models narrated in this research is applicable to train the machine-learning models at any individual station out of 14 monitoring stations across Mexico City, and it obviates the need for models’ hyperparameter tuning again and again. The models forecast ozone concentrations with reasonable accuracy but tend to underestimate ozone peaks in certain months, such as October and November. This limitation can be addressed by incorporating additional training data and including more ozone precursors, such as VOCs, among the input variables. For further study, we intend to extend our research by incorporating more stations from the atmospheric monitoring system of Mexico City, more O3 precursors data, and further forecasts of O3 into the future (i.e., 2, 3, or 7 days in advance forecasting).
Supplementary Materials
The following supporting information can be downloaded at: https://www.mdpi.com/article/10.3390/atmos16080931/s1, Figure S1. The scatter plots of the observed and CNN model forecasted hourly ozone concentrations at TAH station for the year 2022; Figure S2. The scatter plots of the observed and CNN model forecasted hourly ozone concentrations at TLA station for the year 2022; Figure S3. The scatter plots of the observed and CNN model forecasted hourly ozone concentrations at UAX station for the year 2022; Figure S4. The scatter plots of the observed and CNN model forecasted hourly ozone concentrations at UIZ station for the year 2022; Figure S5. The time series of the observed (blue), CNN model forecasted (green, considering local scenario), and CNN model forecasted (red, considering regional scenario) hourly ozone concentrations over the year 2022 for MER station; Figure S6. The scatter plots of the observed and CNN model forecasted (considering regional scenario) hourly ozone concentrations at MER station for the year 2022; Table S1. List of abbreviations; Table S2. CNN model’s performance evaluation over the year 2022 based on three statistical metrics; Table S3. FNN model’s performance evaluation over the year 2022 based on three statistical metrics; Table S4. LSTM model’s performance evaluation over the year 2022 based on three statistical metrics.
Author Contributions
Conceptualization, B.R.; Methodology, M.A. and B.R.; Software, M.A.; Formal analysis, M.A. and B.R.; Data curation, O.O.O. and A.R.; Writing—original draft, M.A.; Writing—review & editing, B.R., O.O.O. and A.R. All authors have read and agreed to the published version of the manuscript.
Funding
This research received no external funding.
Institutional Review Board Statement
Not applicable.
Informed Consent Statement
Not applicable.
Data Availability Statement
The data supporting the findings of this study are publicly available at http://www.aire.cdmx.gob.mx/default.php?opc=%27aKBhnmI=%27&opcion=Zg (accessed on 26 July 2025).
Acknowledgments
The air quality measurements were carried out by personnel from the Atmospheric Monitoring Directorate of the Secretariat of the Environment of Mexico City; we acknowledge all of their effort and commitment. In particular, we thank O. Rivera-Hernández from the Mexico City Air Quality Monitoring Directorate. We gratefully acknowledge the use of the University of Houston Research Computing Center (RCC). Mateen Ahmad acknowledges the financial support provided by the Higher Education Commission (HEC), Pakistan, and the University of Engineering and Technology (UET), Lahore, Pakistan.
Conflicts of Interest
Olabosipo O. Osibanjo is an employee of FM Global Insurance, Boston, MA, USA. The paper reflects the views of the scientist and not the company.
References
- Kim, S.-Y.; Kim, E.; Kim, W.J. Health Effects of Ozone on Respiratory Diseases. Tuberc. Respir. Dis. 2020, 83 (Suppl. S1), S6–S11. [Google Scholar] [CrossRef]
- Mills, G.; Buse, A.; Gimeno, B.; Bermejo, V.; Holland, M.; Emberson, L.; Pleijel, H. A synthesis of AOT40-based response functions and critical levels of ozone for agricultural and horticultural crops. Atmos. Environ. 2007, 41, 2630–2643. [Google Scholar] [CrossRef]
- Bell, M.L.; Peng, R.D.; Dominici, F. The exposure–response curve for ozone and risk of mortality and the adequacy of current ozone regulations. Environ. Health Perspect. 2006, 114, 532–536. [Google Scholar] [CrossRef]
- Holm, S.M.; Balmes, J.R. Systematic Review of Ozone Effects on Human Lung Function, 2013 Through 2020. Chest 2022, 161, 190–201. [Google Scholar] [CrossRef]
- Guan, Y.; Xiao, Y.; Wang, F.; Qiu, X.; Zhang, N. Health impacts attributable to ambient PM2.5 and ozone pollution in major Chinese cities at seasonal-level. J. Clean. Prod. 2021, 311, 127510. [Google Scholar] [CrossRef]
- Nuvolone, D.; Petri, D.; Voller, F. The effects of ozone on human health. Environ. Sci. Pollut. Res. 2017, 25, 8074–8088. [Google Scholar] [CrossRef]
- Atkinson, R. Atmospheric chemistry of VOCs and NOx. Atmos. Environ. 2000, 34, 2063–2101. [Google Scholar] [CrossRef]
- Jenkin, M.E.; Clemitshaw, K.C. Ozone and other secondary photochemical pollutants: Chemical processes governing their formation in the planetary boundary layer. Atmos. Environ. 2000, 34, 2499–2527. [Google Scholar] [CrossRef]
- Comrie, A.C.; Yarnal, B. Relationships between synoptic-scale atmospheric circulation and ozone concentrations in metropolitan Pittsburgh, Pennsylvania. Atmos. Environ. Part B Urban Atmos. 1992, 26, 301–312. [Google Scholar] [CrossRef]
- Davies, T.D.; Kelly, P.M.; Low, P.S.; Pierce, C.E. Surface ozone concentrations in Europe: Links with the regional-scale atmospheric circulation. J. Geophys. Res. Atmos. 1992, 97, 9819–9832. [Google Scholar] [CrossRef]
- Rappenglück, B.; Kourtidis, K.; Fabian, P. Measurements of ozone and peroxyacetyl nitrate (PAN) in Munich. Atmos. Environ. Part B Urban Atmos. 1993, 27, 293–305. [Google Scholar] [CrossRef]
- Dueñas, C.; Fernández, M.C.; Cañete, S.; Carretero, J.; Liger, E. Assessment of ozone variations and meteorological effects in an urban area in the Mediterranean Coast. Sci. Total Environ. 2002, 299, 97–113. [Google Scholar] [CrossRef]
- Elminir, H.K. Dependence of urban air pollutants on meteorology. Sci. Total Environ. 2005, 350, 225–237. [Google Scholar] [CrossRef]
- Solomon, P.; Cowling, E.; Hidy, G.; Furiness, C. Comparison of scientific findings from major ozone field studies in North America and Europe. Atmos. Environ. 2000, 34, 1885–1920. [Google Scholar] [CrossRef]
- Zhang, J.; Rao, S.T.; Daggupaty, S.M. Meteorological processes and ozone exceedances in the northeastern United States during the 12–16 July 1995 episode. J. Appl. Meteorol. 1998, 37, 776–789. [Google Scholar] [CrossRef]
- Alam, M.J.; Rappenglueck, B.; Retama, A.; Rivera-Hernández, O. Investigating the Complexities of VOC Sources in Mexico City in the Years 2016–2022. Atmosphere 2024, 15, 179. [Google Scholar] [CrossRef]
- Osibanjo, O.O.; Rappenglück, B.; Retama, A. Anatomy of the March 2016 severe ozone smog episode in Mexico-City. Atmos. Environ. 2021, 244, 117945. [Google Scholar] [CrossRef]
- Ahmad, M.; Rappenglück, B.; Osibanjo, O.O.; Retama, A. A machine learning approach to investigate the build-up of surface ozone in Mexico-City. J. Clean. Prod. 2022, 379, 134638. [Google Scholar] [CrossRef]
- Akther, T.; Rappenglueck, B.; Osibanjo, O.; Retama, A.; Rivera-Hernández, O. Ozone precursors and boundary layer meteorology before and during a severe ozone episode in Mexico City. Chemosphere 2023, 318, 137978. [Google Scholar] [CrossRef]
- Zielesny, A. From Curve Fitting to Machine Learning. In Intelligent Systems Reference Library; Springer International: Cham, Switzerland, 2016. [Google Scholar] [CrossRef]
- Bekesiene, S.; Meidute-Kavaliauskiene, I.; Vasiliauskiene, V. Accurate prediction of concentration changes in ozone as an air pollutant by multiple linear regression and artificial neural networks. Mathematics 2021, 9, 356. [Google Scholar] [CrossRef]
- Maleki, H.; Sorooshian, A.; Goudarzi, G.; Baboli, Z.; Tahmasebi Birgani, Y.; Rahmati, M. Air pollution prediction by using an artificial neural network model. Clean Technol. Environ. Policy 2019, 21, 1341–1352. [Google Scholar] [CrossRef]
- Du, J.; Qiao, F.; Lu, P.; Yu, L. Forecasting ground-level ozone concentration levels using machine learning. Resour. Conserv. Recycl. 2022, 184, 106380. [Google Scholar] [CrossRef]
- Pan, Q.; Harrou, F.; Sun, Y. A comparison of machine learning methods for ozone pollution prediction. J. Big Data 2023, 10, 63. [Google Scholar] [CrossRef]
- Ghahremanloo, M.; Lops, Y.; Choi, Y.; Yeganeh, B. Deep Learning Estimation of Daily Ground-Level NO2 Concentrations From Remote Sensing Data. J. Geophys. Res. Atmos. 2021, 126, e2021JD034925. [Google Scholar] [CrossRef]
- Baghoolizadeh, M.; Rostamzadeh-Renani, M.; Dehkordi, S.A.H.H.; Rostamzadeh-Renani, R.; Toghraie, D. A prediction model for CO2 concentration and multi-objective optimization of CO2 concentration and annual electricity consumption cost in residential buildings using ANN and GA. J. Clean. Prod. 2022, 379, 134753. [Google Scholar] [CrossRef]
- Cheng, Y.; Zhu, Q.; Peng, Y.; Huang, X.-F.; He, L.-Y. Multiple strategies for a novel hybrid forecasting algorithm of ozone based on data-driven models. J. Clean. Prod. 2021, 326, 129451. [Google Scholar] [CrossRef]
- Gagliardi, R.V.; Andenna, C. A machine learning approach to investigate the surface ozone behavior. Atmosphere 2020, 11, 1173. [Google Scholar] [CrossRef]
- Eslami, E.; Choi, Y.; Lops, Y.; Sayeed, A. A real-time hourly ozone prediction system using deep convolutional neural network. Neural Comput. Appl. 2019, 32, 8783–8797. [Google Scholar] [CrossRef]
- Sayeed, A.; Choi, Y.; Eslami, E.; Lops, Y.; Roy, A.; Jung, J. Using a deep convolutional neural network to predict 2017 ozone concentrations, 24 hours in advance. Neural Netw. 2020, 121, 396–408. [Google Scholar] [CrossRef]
- Kleinert, F.; Leufen, L.H.; Schultz, M.G. IntelliO3-ts v1.0: A neural network approach to predict near-surface ozone concentrations in Germany. Geosci. Model Dev. 2021, 14, 1–25. [Google Scholar] [CrossRef]
- Yafouz, A.; Ahmed, A.N.; Zaini, N.A.; Sherif, M.; Sefelnasr, A.; El-Shafie, A. Hybrid deep learning model for ozone concentration prediction: Comprehensive evaluation and comparison with various machine and deep learning algorithms. Eng. Appl. Comput. Fluid Mech. 2021, 15, 902–933. [Google Scholar] [CrossRef]
- Aljanabi, M.; Shkoukani, M.; Hijjawi, M. Ground-level Ozone Prediction Using Machine Learning Techniques: A Case Study in Amman, Jordan. Int. J. Autom. Comput. 2020, 17, 667–677. [Google Scholar] [CrossRef]
- Liang, Y.C.; Maimury, Y.; Chen, A.H.L.; Juarez, J.R.C. Machine learning-based prediction of air quality. Appl. Sci. 2020, 10, 9151. [Google Scholar] [CrossRef]
- Wang, H.W.; Li, X.B.; Wang, D.; Zhao, J.; Peng, Z.R. Regional prediction of ground-level ozone using a hybrid sequence-to-sequence deep learning approach. J. Clean. Prod. 2020, 253, 119841. [Google Scholar] [CrossRef]
- Abirami, S.; Chitra, P. Regional air quality forecasting using spatiotemporal deep learning. J. Clean. Prod. 2021, 283, 125341. [Google Scholar] [CrossRef]
- Deng, T.; Manders, A.; Segers, A.; Bai, Y.; Lin, H. Temporal Transfer Learning for Ozone Prediction based on CNN-LSTM Model. In Proceedings of the 13th International Conference on Agents and Artificial Intelligence, Vienna, Austria, 4–6 February 2021. [Google Scholar] [CrossRef]
- Juarez, E.K.; Petersen, M.R. A comparison of machine learning methods to forecast tropospheric ozone levels in Delhi. Atmosphere 2021, 13, 46. [Google Scholar] [CrossRef]
- Makarova, A.; Evstaf’eva, E.; Lapchenco, V.; Varbanov, P.S. Modelling tropospheric ozone variations using artificial neural networks: A case study on the Black Sea coast (Russian Federation). Clean. Eng. Technol. 2021, 5, 100293. [Google Scholar] [CrossRef]
- Yan, R.; Liao, J.; Yang, J.; Sun, W.; Nong, M.; Li, F. Multi-hour and multi-site air quality index forecasting in Beijing using CNN, LSTM, CNN-LSTM, and spatiotemporal clustering. Expert Syst. Appl. 2021, 169, 114513. [Google Scholar] [CrossRef]
- Balamurugan, V.; Balamurugan, V.; Chen, J. Importance of ozone precursors information in modelling urban surface ozone variability using machine learning algorithm. Sci. Rep. 2022, 12, 5646. [Google Scholar] [CrossRef]
- Chen, B.; Wang, Y.; Huang, J.; Zhao, L.; Chen, R.; Song, Z.; Hu, J. Estimation of Near-Surface Ozone Concentration and Analysis of Main Weather Situation in China Based on Machine Learning Model and Himawari-8 Toar Data. SSRN Electron. J. 2022, 864, 160928. [Google Scholar] [CrossRef]
- Hafeez, A.; Taqvi, S.A.A.; Fazal, T.; Javed, F.; Khan, Z.; Amjad, U.S.; Rehman, F. Optimization on cleaner intensification of ozone production using Artificial Neural Network and Response Surface Methodology: Parametric and comparative study. J. Clean. Prod. 2020, 252, 119833. [Google Scholar] [CrossRef]
- Weng, X.; Forster, G.L.; Nowack, P. A machine learning approach to quantify meteorological drivers of ozone pollution in China from 2015 to 2019. Atmos. Chem. Phys. 2022, 22, 8385–8402. [Google Scholar] [CrossRef]
- Zhan, J.; Liu, Y.; Ma, W.; Zhang, X.; Wang, X.; Bi, F.; Li, H. Ozone formation sensitivity study using machine learning coupled with the reactivity of volatile organic compound species. Atmos. Meas. Tech. 2022, 15, 1511–1520. [Google Scholar] [CrossRef]
- Zhang, J.; Li, S. Air quality index forecast in Beijing based on CNN-LSTM multi-model. Chemosphere 2022, 308, 136180. [Google Scholar] [CrossRef]
- Leufen, L.H.; Kleinert, F.; Schultz, M.G. O3ResNet: A Deep Learning–Based Forecast System to Predict Local Ground-Level Daily Maximum 8-Hour Average Ozone in Rural and Suburban Environments. Artif. Intell. Earth Syst. 2023, 2, e220085. [Google Scholar] [CrossRef]
- Méndez, M.; Merayo, M.G.; Núñez, M. Machine learning algorithms to forecast air quality: A survey. Artif. Intell. Rev. 2023, 56, 10031–10066. [Google Scholar] [CrossRef]
- Hosseinpour, F.; Kumar, N.; Tran, T.; Knipping, E. Using machine learning to improve the estimate of, U.S. background ozone. Atmos. Environ. 2024, 316, 120145. [Google Scholar] [CrossRef]
- Luo, Z.; Lu, P.; Chen, Z.; Liu, R. Ozone Concentration Estimation and Meteorological Impact Quantification in the Beijing-Tianjin-Hebei Region Based on Machine Learning Models. Earth Space Sci. 2024, 11. [Google Scholar] [CrossRef]
- Yan, X.; Guo, Y.; Zhang, Y.; Chen, J.; Jiang, Y.; Zuo, C.; Zhao, W.; Shi, W. Combining physical mechanisms and deep learning models for hourly surface ozone retrieval in China. J. Environ. Manag. 2024, 351, 119942. [Google Scholar] [CrossRef] [PubMed]
- Emmanuel, T.; Maupong, T.; Mpoeleng, D.; Semong, T.; Banyatsang, M.; Tabona, O. A Survey On Missing Data in Machine Learning. J. Big Data 2021, 8, 140. [Google Scholar] [CrossRef]
- Pedregosa, F.; Varoquaux, G.; Gramfort, A.; Michel, V.; Thirion, B.; Grisel, O.; Blondel, M.; Prettenhofer, P.; Weiss, R.; Dubourg, V.; et al. Scikit-learn: Machine learning in Python. J. Mach. Learn. Res. 2011, 12, 2825–2830. [Google Scholar]
- Akther, T.; Rappenglueck, B.; Karim, I.; Nelson, B.; Mayhew, A.W.; Retama, A.; Rivera-Hernández, O. Box-Modelling of O3 and its sensitivity towards VOCs and NOx in Mexico City under altered emission conditions. Environ. Sci. Technol. 2024. submitted. [Google Scholar]
Disclaimer/Publisher’s Note: The statements, opinions and data contained in all publications are solely those of the individual author(s) and contributor(s) and not of MDPI and/or the editor(s). MDPI and/or the editor(s) disclaim responsibility for any injury to people or property resulting from any ideas, methods, instructions or products referred to in the content. |
© 2025 by the authors. Licensee MDPI, Basel, Switzerland. This article is an open access article distributed under the terms and conditions of the Creative Commons Attribution (CC BY) license (https://creativecommons.org/licenses/by/4.0/).

