Abstract
Typhoon Yagi (2024) was a rapidly moving storm that lasted for eight days and made landfall in three locations, producing heavy rainfall over Hainan and Vietnam. This study aims to investigate the dynamical processes contributing to the heavy rainfall, concentrating on enthalpy flux (EF) and moisture flux (MF). The results indicate that both EF and MF increased significantly during the typhoon’s intensification stage and were high at the time of landfall. Before landfalling at Hainan, latent heat flux (LHF) reached 600 W/m2, while sensible heat flux (SHF) was recorded as 80 W/m2. Landfall at Hainan resulted in a decrease in LHF and SHF. LHF and SHF subsequently increased to 700 W/m2 and 100 W/m2, respectively, as noted prior to the landfall in Vietnam. The increased LHF led to higher evaporation, which subsequently elevated moisture flux (MF) following the landfall in Vietnam, while the region’s topography further intensified the rainfall. The mean daily rainfall observed over Philippines is 75 mm on 2 September (landfall and passing through), 100 mm over Hainan (landfall and passing through) on 6 September, and 95 mm at over Vietnam on 7 September (landfall and after), respectively. Heavy rainfall was observed over the land while the typhoon was passing and during the landfall. This research reveals that Typhoon Yagi’s intensity was maintained by a well-organized and extensive circulation system, supported by favorable weather conditions, including high sea surface temperatures (SST) exceeding 30.5 °C, substantial low-level moisture convergence, and elevated EF during the landfall in Vietnam.
1. Introduction
Typhoons develop over warm tropical oceans, frequently causing significant disasters, and are fueled by a higher sea surface temperature (SST, >26.5 °C) and water vapor, resulting in powerful winds, heavy rainfall, and significant flooding [1]. Tropical cyclones characterized by low pressure in the north-west Pacific play a crucial role in air–sea interaction, which moves heat and moisture to land and maintains the regional heat balance. Over recent decades, there has been a rise in both the frequency and intensity of typhoons, alongside a decrease in their translation speed [2], which significantly affects the regional marine environment. As a typhoon approaches, wind speeds at the sea surface rise, leading to intensified mixing and a deeper mixing layer [3]. The cooling of the SST from the typhoon will return to pre-storm levels due to air–sea fluxes at the surface, but the subsurface will require more time to recover. Understanding typhoon intensity requires examining variations in upper-ocean conditions [4,5,6,7,8,9]. SST cooling is observed both temporally and spatially until typhoon landfall, after which normal temperatures are restored [10]. Based on observational and simulation studies, the most notable aspect of the spatial variations is the presence of a cool wake behind the typhoon, which is biased to the right or close to the typhoon’s path, where the maximum cooling is observed [11,12,13,14,15,16,17,18,19,20]. The SST plays a crucial role in determining the quantity of sensible and latent heat accessible to the typhoon from the ocean, thereby serving as an indicator of the typhoon’s intensity [21,22]. SST has a significant effect on storm intensity, and it is ideal for hurricane models to account for the feedback effects of SST. The SST feedback effects seem to rely on both the storm-induced vertical mixing in ocean models and the parameterization of surface fluxes in atmospheric models. Conversely, the cooling of the SST diminishes the sea surface heat fluxes, which in turn results in a decrease in typhoon intensity [23,24,25]. The cooling of temperature on the right side of the typhoon path is primarily due to a wind stress vector that has rotated clockwise [26]. Certain typhoons exhibit a coastal impact characterized by powerful winds and significant rainfall.
The latent heat of cumulus clouds drives cyclonic circulation, whereas cyclone-scale circulation supplies moisture necessary for the formation of cumulus clouds. The warm SST of tropical oceans and the release of latent heat drive typhoons. Chan et al. [27] indicate that reduced total heat flux leads to changes in typhoon strength. The energy driving a typhoon mainly originates from the warm tropical ocean SST and the release of latent heat. Typhoon formation and persistence depend on latent heat flux (LHF) and sensible heat flux (SHF), which are the primary factors influencing enthalpy flux (EF). The oceanic LHF refers to the heat energy exchanged by the ocean during the evaporation of water vapor. LHF and SHF dominate the enthalpy flux and are critical in the formation and maintenance of typhoons.
The significant rise in low-level wind speed enhances moisture convergence [28]. Moisture convergence and upward motion on the western side of the tropical cyclone (TC) center created conditions conducive to the heavy rainstorm [29]. TC rainfall’s connection to the western pacific subtropical high (WPSH) via water vapor transport and vertical wind shear suggests a high predictability for TC rainfall [30]. Typhoon strength is influenced by moisture flux (MF). Typhoons require ambient and ocean moisture to avoid frictional dissipation. MF studies could clarify typhoon intensification. The prior study examines MF and moisture flux convergence (MFC). The highest levels of vertically integrated MFC occur on the downshear side, independent of shear direction, with wind convergence contributing significantly more to the total MFC than moisture advection [30]. Yang et al. [31] used a high-resolution model to reproduce Typhoon Nari (2001), revealing that 30% of the water vapor came from evaporation and 70% from MFC within 150 km of the storm’s center. MF analysis improves our understanding of typhoon precipitation variability, highlighting key moisture sources and their pathways responsible for extreme rainfall events [32]. Feng and Shu [33] analyzed the water budget for the tropical storm Isidore, showing that variations in rainfall were due to significant moisture convergence and flux. Moisture convergence and ocean surface moisture flux primarily govern rainfall production [34]. Wind variation significantly influences moisture circulation. Moisture flux transport and its convergence or divergence significantly influence precipitation processes [35,36]. Observational studies indicate a rising trend in typhoon rainfall and intensity across different regions of East Asia [37,38,39,40], suggesting that global warming may lead to increased TC intensity and precipitation, while frequency might decline, with significant variability across different basins. Heavy rainfall linked to increased water vapor capacity led to a positive interaction between water vapor supply and typhoons [41,42], though this remains a topic of intense debate. Typhoon-induced rainfall magnitude and distribution are often multiscale and influenced by various factors, including storm size, track, and translation speed. Typhoon-related rainfall can exhibit asymmetry after landfall. Rainfall asymmetry is influenced by the speed of typhoon movement [43,44,45,46]. The areas most affected are primarily influenced by rainfall patterns during typhoons. The distribution of rainfall in a landfalling tropical cyclone is crucial for meteorologists due to its impact on rainfall predictions. Forecasting precipitation during typhoon landfall is influenced by coastal and inland topography, as well as land surface and boundary layer conditions [47,48]. The convection process intensifies with rising temperatures, while heavy rainfall affects sea surface temperature via rain sensible heat flux. Rain’s stabilizing effect may diminish the cold wake, yet the related sensible flux only has a minor impact on cooling caused by typhoons [49]. Typhoons exhibit more intense convective rain in the inner core and greater stratiform rain in the rain band compared to cloud clusters [50]. The heaviest precipitation typically occurs at the front of a typhoon, with precipitation asymmetry varying by typhoon intensity [46]. Typhoon translation significantly impacts the asymmetric distribution of typhoon rainfall [51]. Heavier precipitation primarily took place at a distance from the center, exhibiting the typical characteristic of a weak typhoon. Rainfall is greater on the left side of the typhoon track compared to the right side [52]. This study examines the dynamics involved in Typhoon Yagi 2024, highlighting the mechanisms that led to significant rainfall in Hainan and Vietnam, along with the role of EF in influencing intensity during the typhoon’s lifetime.
2. Materials and Methods
2.1. Data
The data used for this study are as follows:
The dataset from the Joint Typhoon Warning Center (JTWC) is used to estimate the position and intensity of Typhoon Yagi [53]. Website: https://agora.ex.nii.ac.jp/digital-typhoon/summary/wnp/s/202411.html.en (accessed on 22 April 2025).
The daily Optimum Interpolation Sea Surface Temperature (OISST) is the most commonly used product from NOAA [54]. This dataset integrates in-situ SST measurements with AVHRR infrared satellite data, providing a temporal resolution of one day and a spatial resolution of 0.25° grid [55,56,57]. Website: https://www.ncei.noaa.gov/products/optimum-interpolation-sst#:~:text=The%20NOAA%201%2F4%C2%B0%20Daily%20Optimum%20Interpolation%20Sea%20Surface,and%20Argo%20floats%29%20into%20a%20regular%20global%20grid (accessed on 22 April 2025).
The European Copernicus Data Centre’s ERA-5 hourly reanalysis data are used in this study. In order to calculate moisture flow and moisture flux convergence during the typhoon period, ERA-5, which is the ECMWF atmospheric reanalysis of the world climate [58], mainly includes meridional (v), zonal (u) winds, and specific humidity from 1000 hPa to 200 hPa levels. The data have a horizontal resolution of 0.25° by 0.25°. Data are provided on an hourly basis. This study obtained the latent heat flux (LHF) and sensible heat flux (SHF) daily data from ERA5 to analyze variations in enthalpy flux (EF) during the typhoon period. Website: https://cds.climate.copernicus.eu/datasets/reanalysis-era5-pressure-levels?tab=download (accessed on 22 April 2025).
Daily precipitation data were obtained from the merged precipitation of the Global Precipitation Climatology Project (GPCP). The World Climate Research Program (WCRP) launched GPCP to acquire a comprehensive understanding of global precipitation variations over time and space. Daily GPCP offers global precipitation data using satellite and gauge information at a 1° spatial resolution [59]. https://www.ncei.noaa.gov/data/global-precipitation-climatology-project-gpcp-daily/access/ (accessed on 22 April 2025)
2.2. Methods
2.2.1. Ekman Layer’s Horizontal Transport
Similar calculations are used to calculate wind stress; the wind’s horizontal and vertical components are denoted by and .
The Ekman horizontal transport effect of wind stress in the Ekman layer is assessed according to the following equations
The density of air is 1.25 kg·m−3, the drag coefficient CD = 2.6 × 10⁻³, and U10 is above sea level 10 m at the wind speed.
The vertical transport effect of wind stress in the Ekman layer is studied according to the following equation:
where is the Ekman pumping velocity (EPV) (up is positive) [60].
2.2.2. Moisture Flux and Its Convergence
MF and MFC quantify moisture transport and concentration to comprehend typhoon heavy precipitation [61]. MF and MFC are calculated with Equations (1) and (2)
where u and v represent the eastward and northward vector winds (m/s) of each layer of this unit gas column, respectively; q represents the specific humidity (kg kg−1); g is the acceleration of gravity (m/s2); PT is top pressure (Pa) for the upper bound; and PS is surface pressure (Pa). The source and sink of moisture transfer (kg m−2 s−1) are indicated by C. Water vapor convergence (kg m−1 s−1) occurs when C is larger than 0, and divergence occurs when C is less than 0.
- Typhoon Yagi:
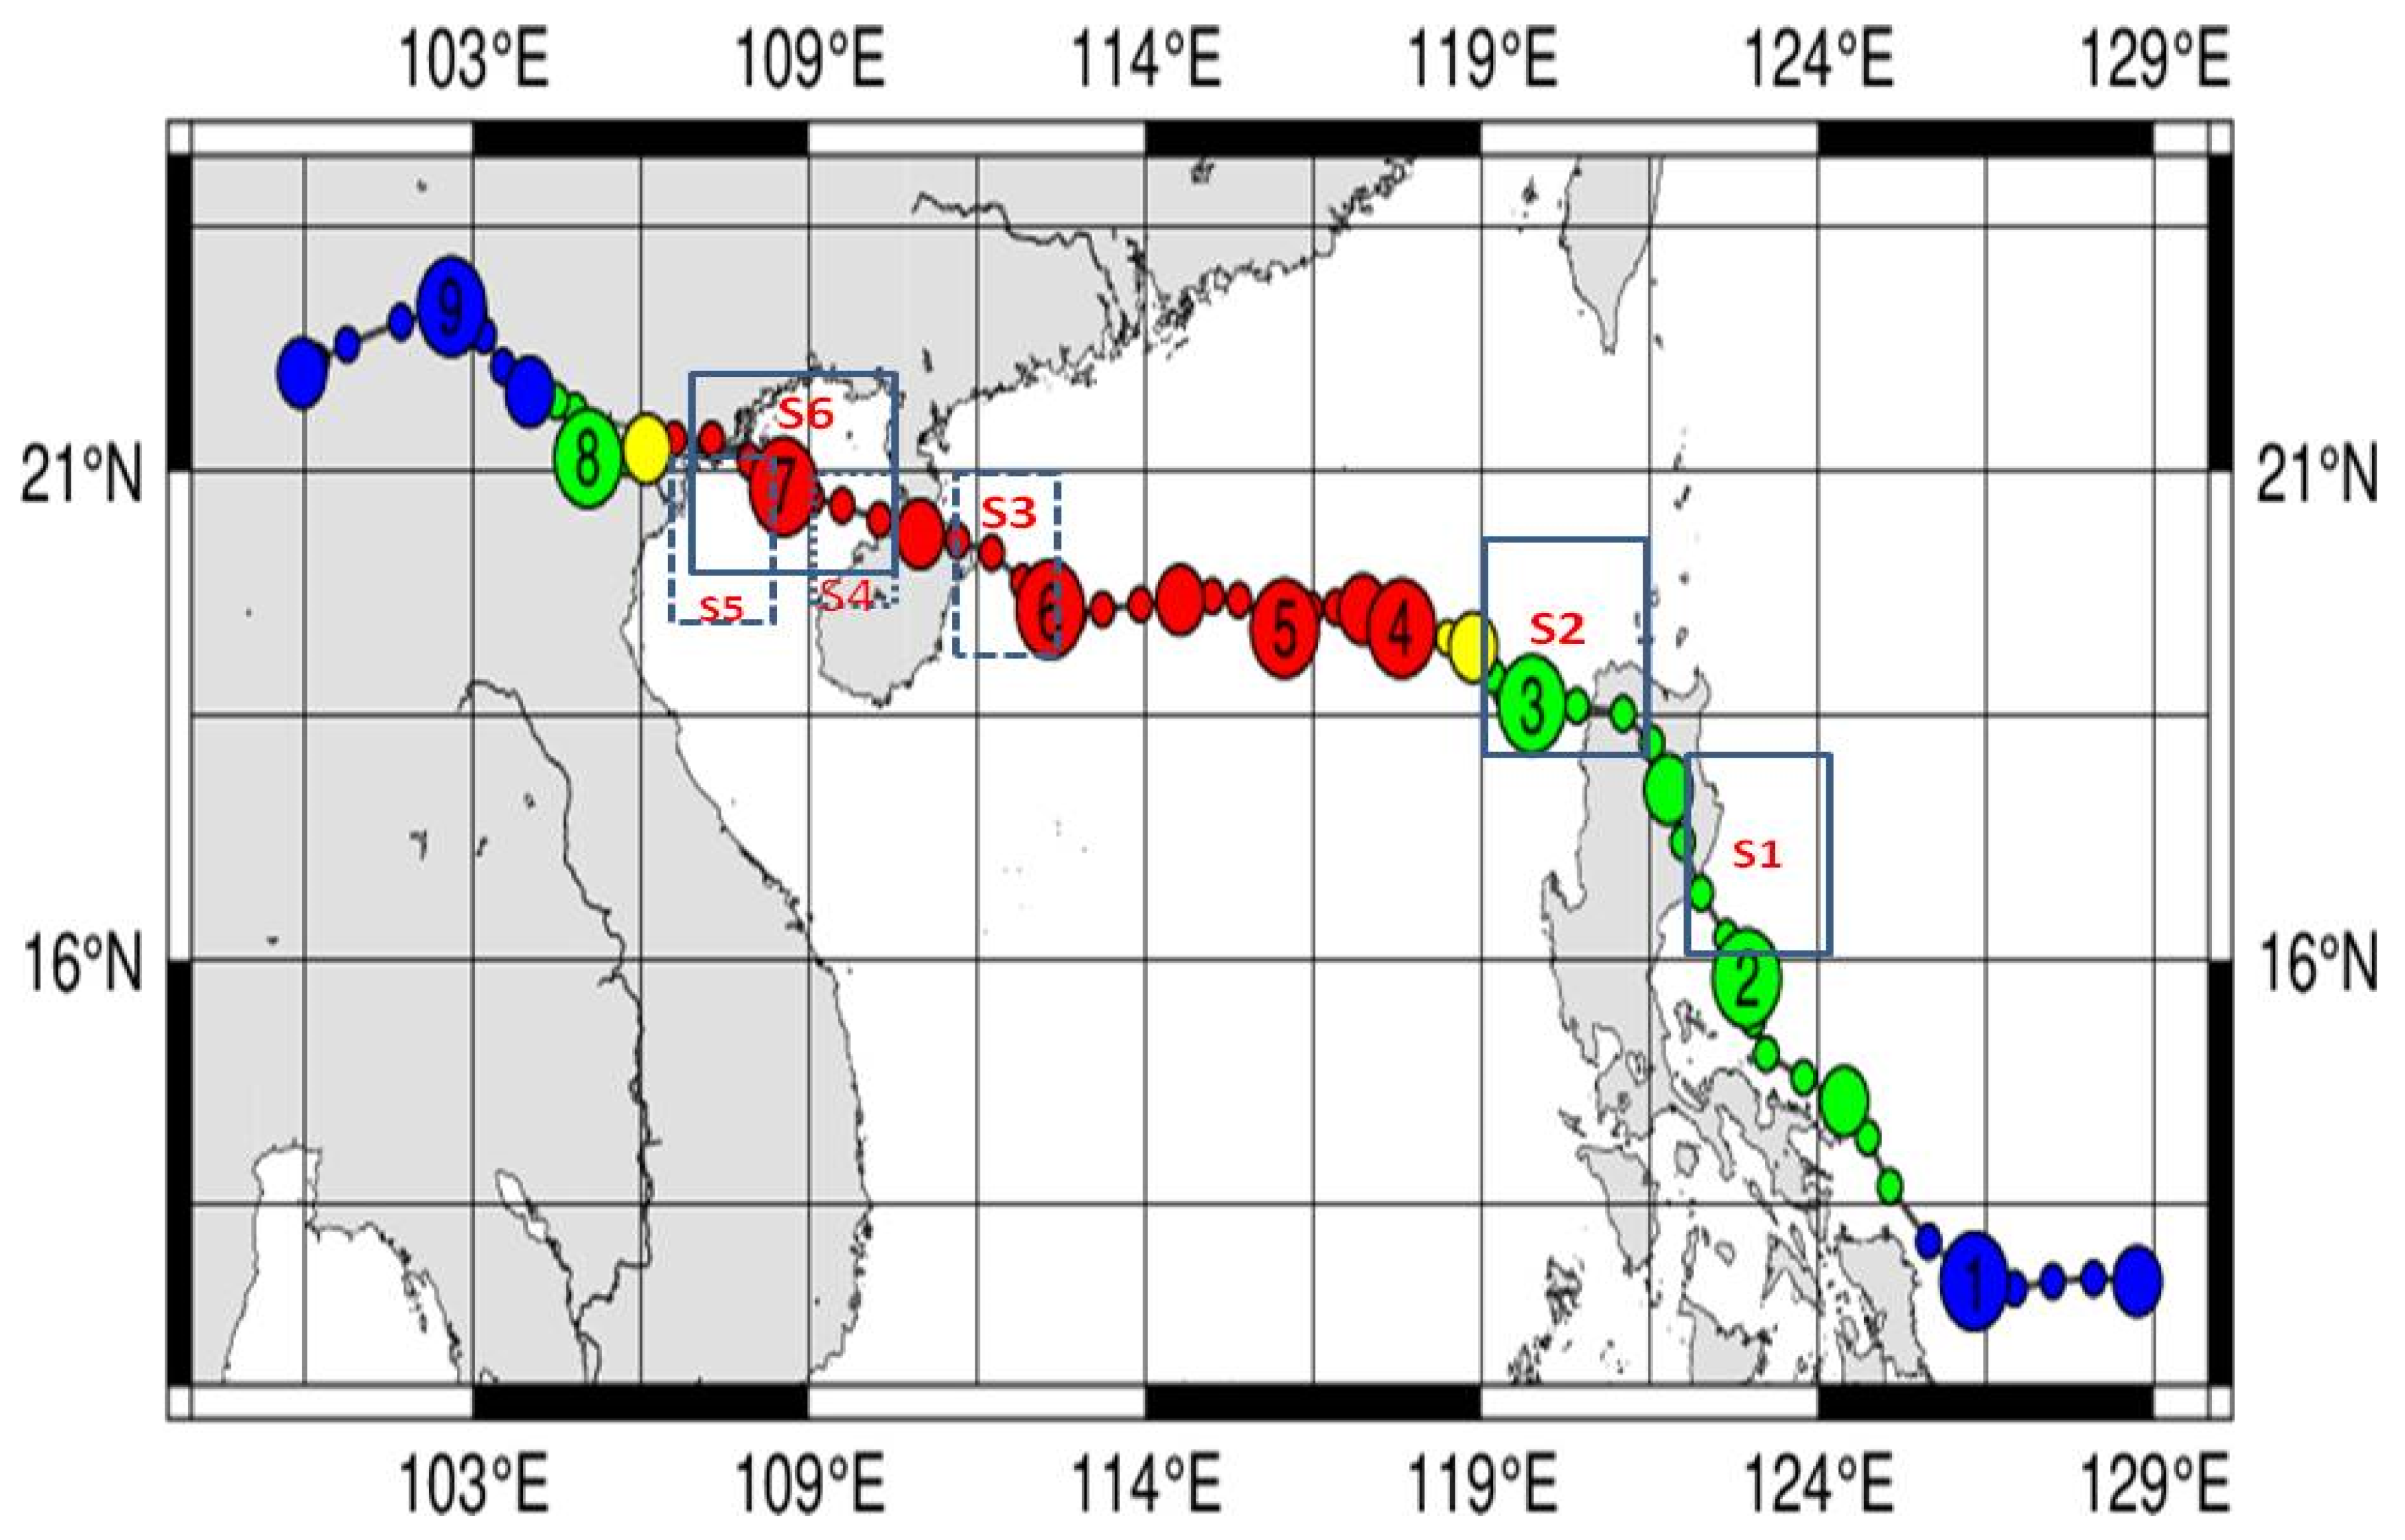
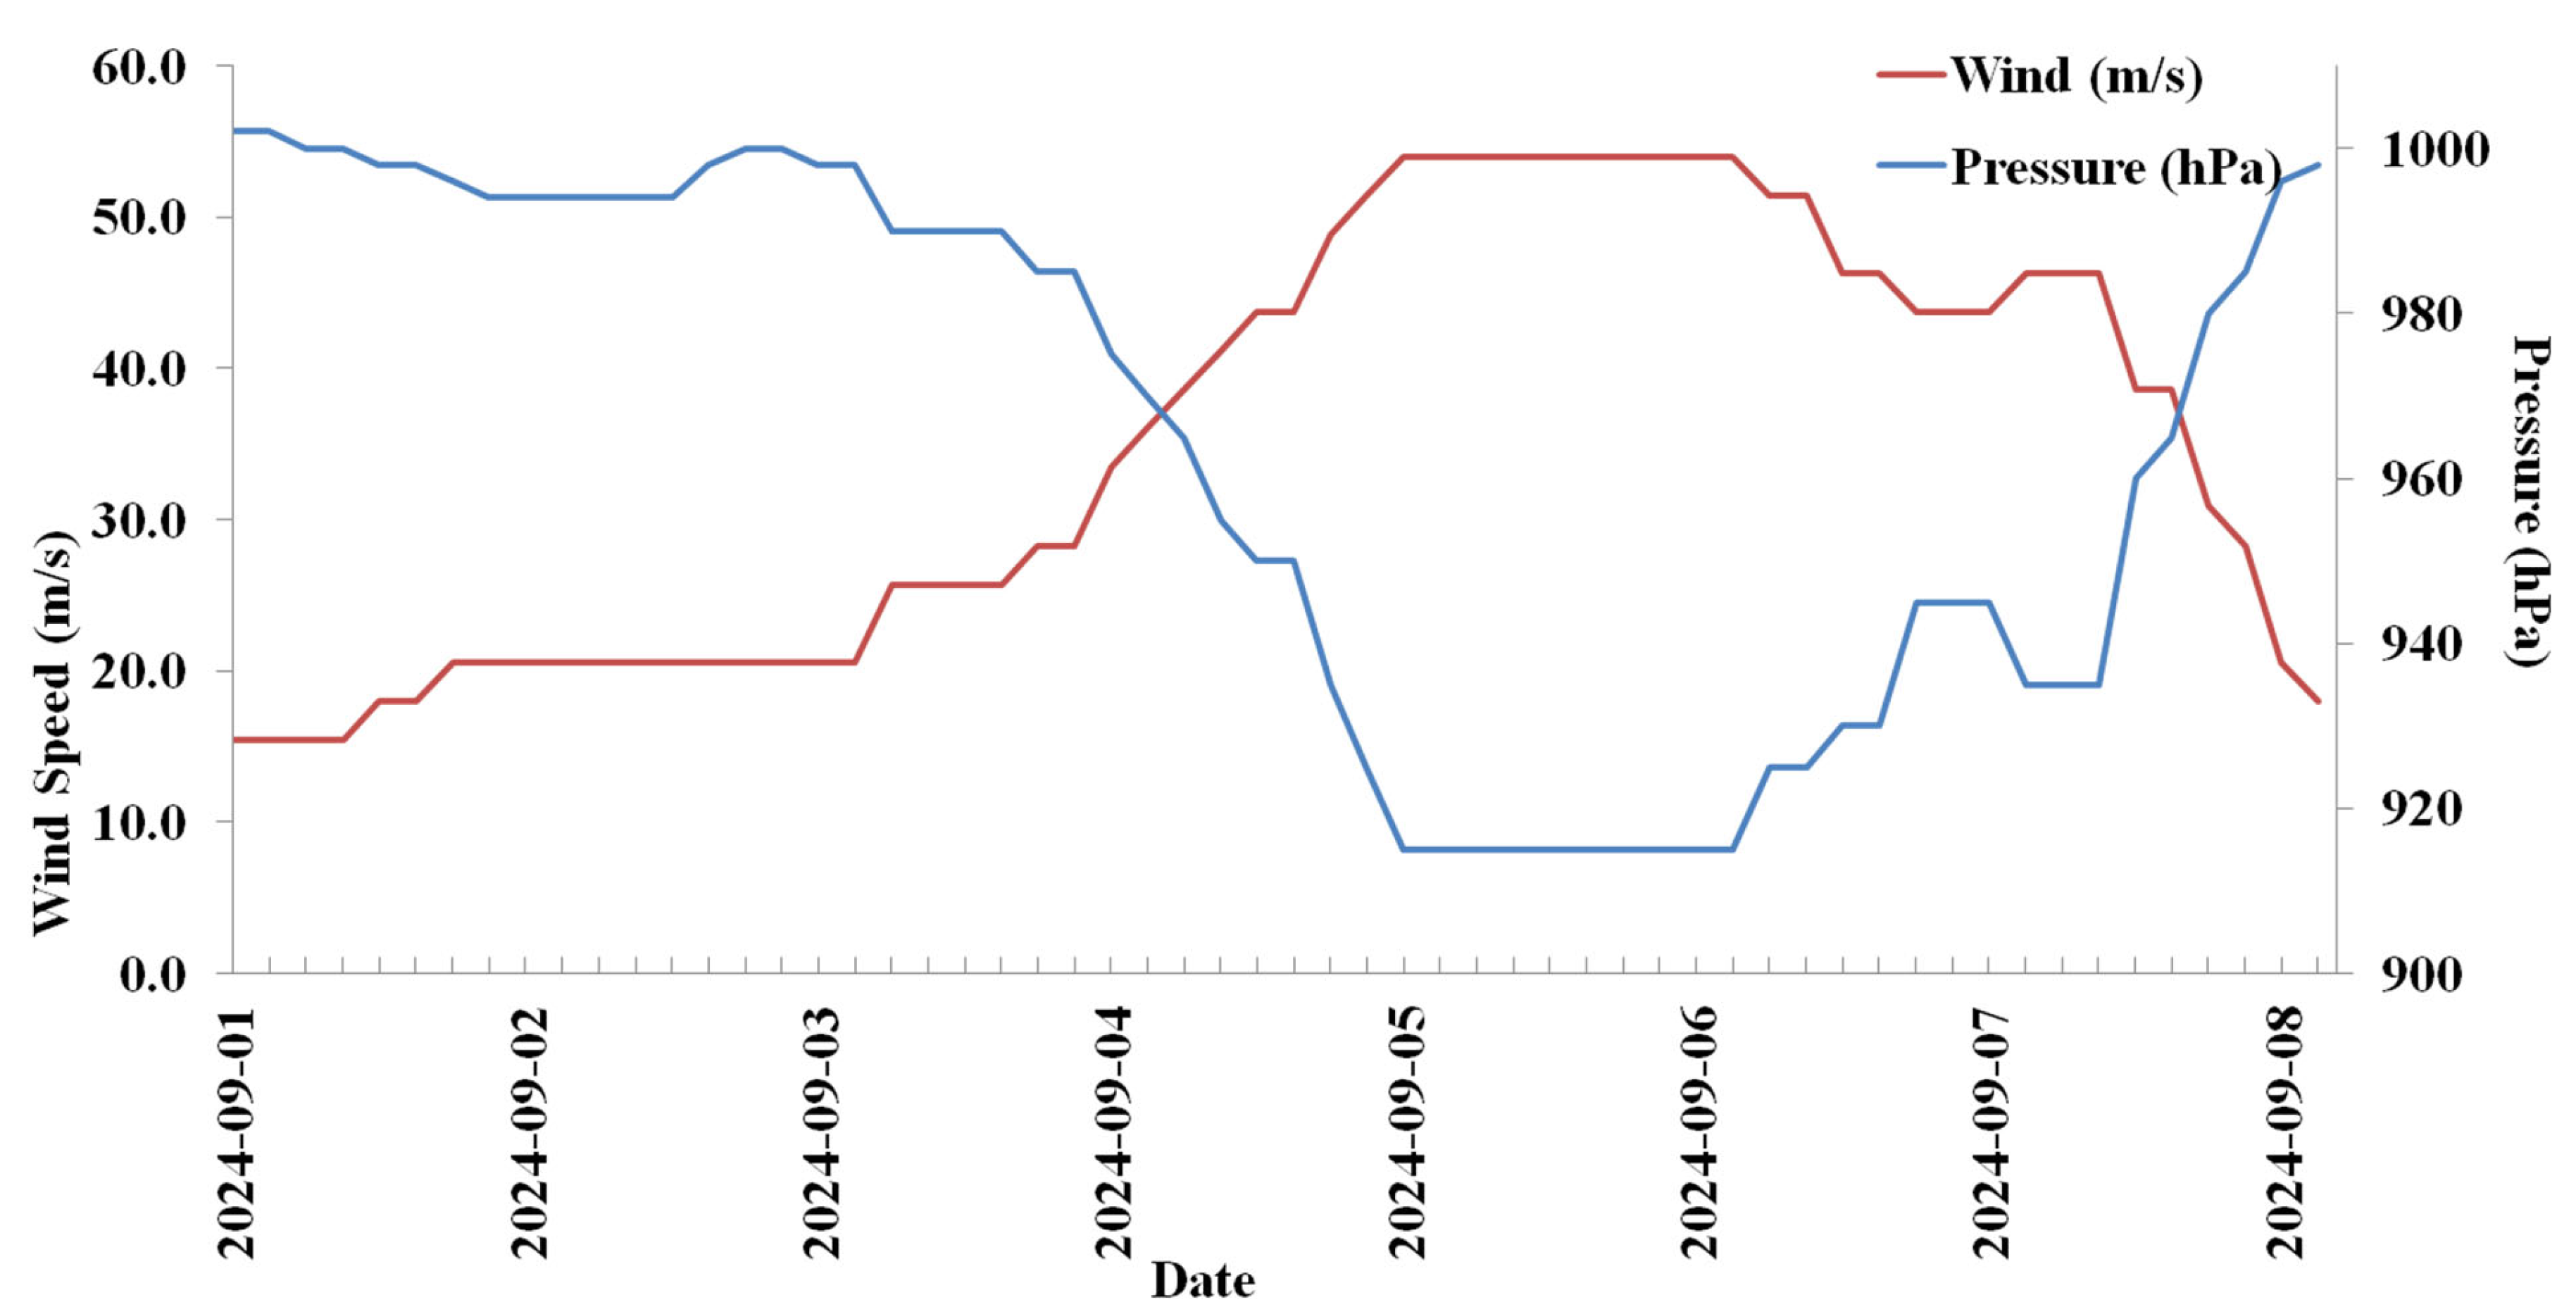
Typhoon Yagi (2024) was a rapidly moving storm that lasted eight days and made landfall in three locations. The typhoon track and the intensity variations are given in Figure 1 and Figure 2. Typhoon Yagi developed at 12.1° N, 128.9° E, then progressed to 13.1° N, 125.1° E, and became a typhoon on 1 September. Typhoon Yagi intensified as it moved northwest, passing along the eastern side of the Philippines before crossing over. It crossed on 2 September. Typhoon Yagi intensified into a severe typhoon on 4 September after crossing the Philippines, with a low pressure of 955 hPa and wind speeds reaching 41.2 m/s. On 5 September, it intensified into a severe typhoon with maximum winds of 54 m/s and a low pressure of 915 hPa. On 6 September, the same intensity persisted, but on 7 September, it decreased to 945 hPa and 43.7 m/s, marking the typhoon’s second landfall at Hainan Island, China. The typhoon intensified to 935 hPa and 46.3 m/s after passing Hainan Island. Subsequently, it crossed the sea at the Vietnam Coast on 8 September. The typhoon dissipated on 9 September. The typhoon’s intensity diminished upon landfall, while it intensified over the sea.
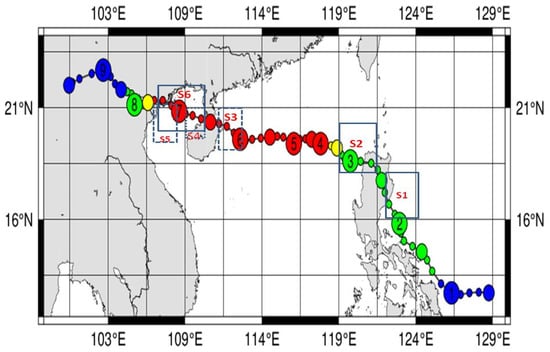
Figure 1.
Typhoon Yagi 2024 track details. The colors within the circles indicate the central pressure of the typhoon at each position, based on the JTWC (in the track, wind speed is indicated as follows: blue circle < 35 knots; green 35–45 knots; yellow 46–59 knots; red > 60 knots) and the boxes from S1–S6 represent the variation SST areas during the typhoon period.
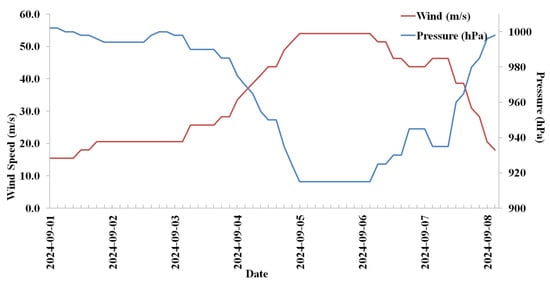
Figure 2.
Typhoon Yagi 2024 intensity during the life period. The red line is the wind (m/s) and the blue line is the pressure (hPa).
3. Results
3.1. SST and Wind Variations During Typhoon Yagi
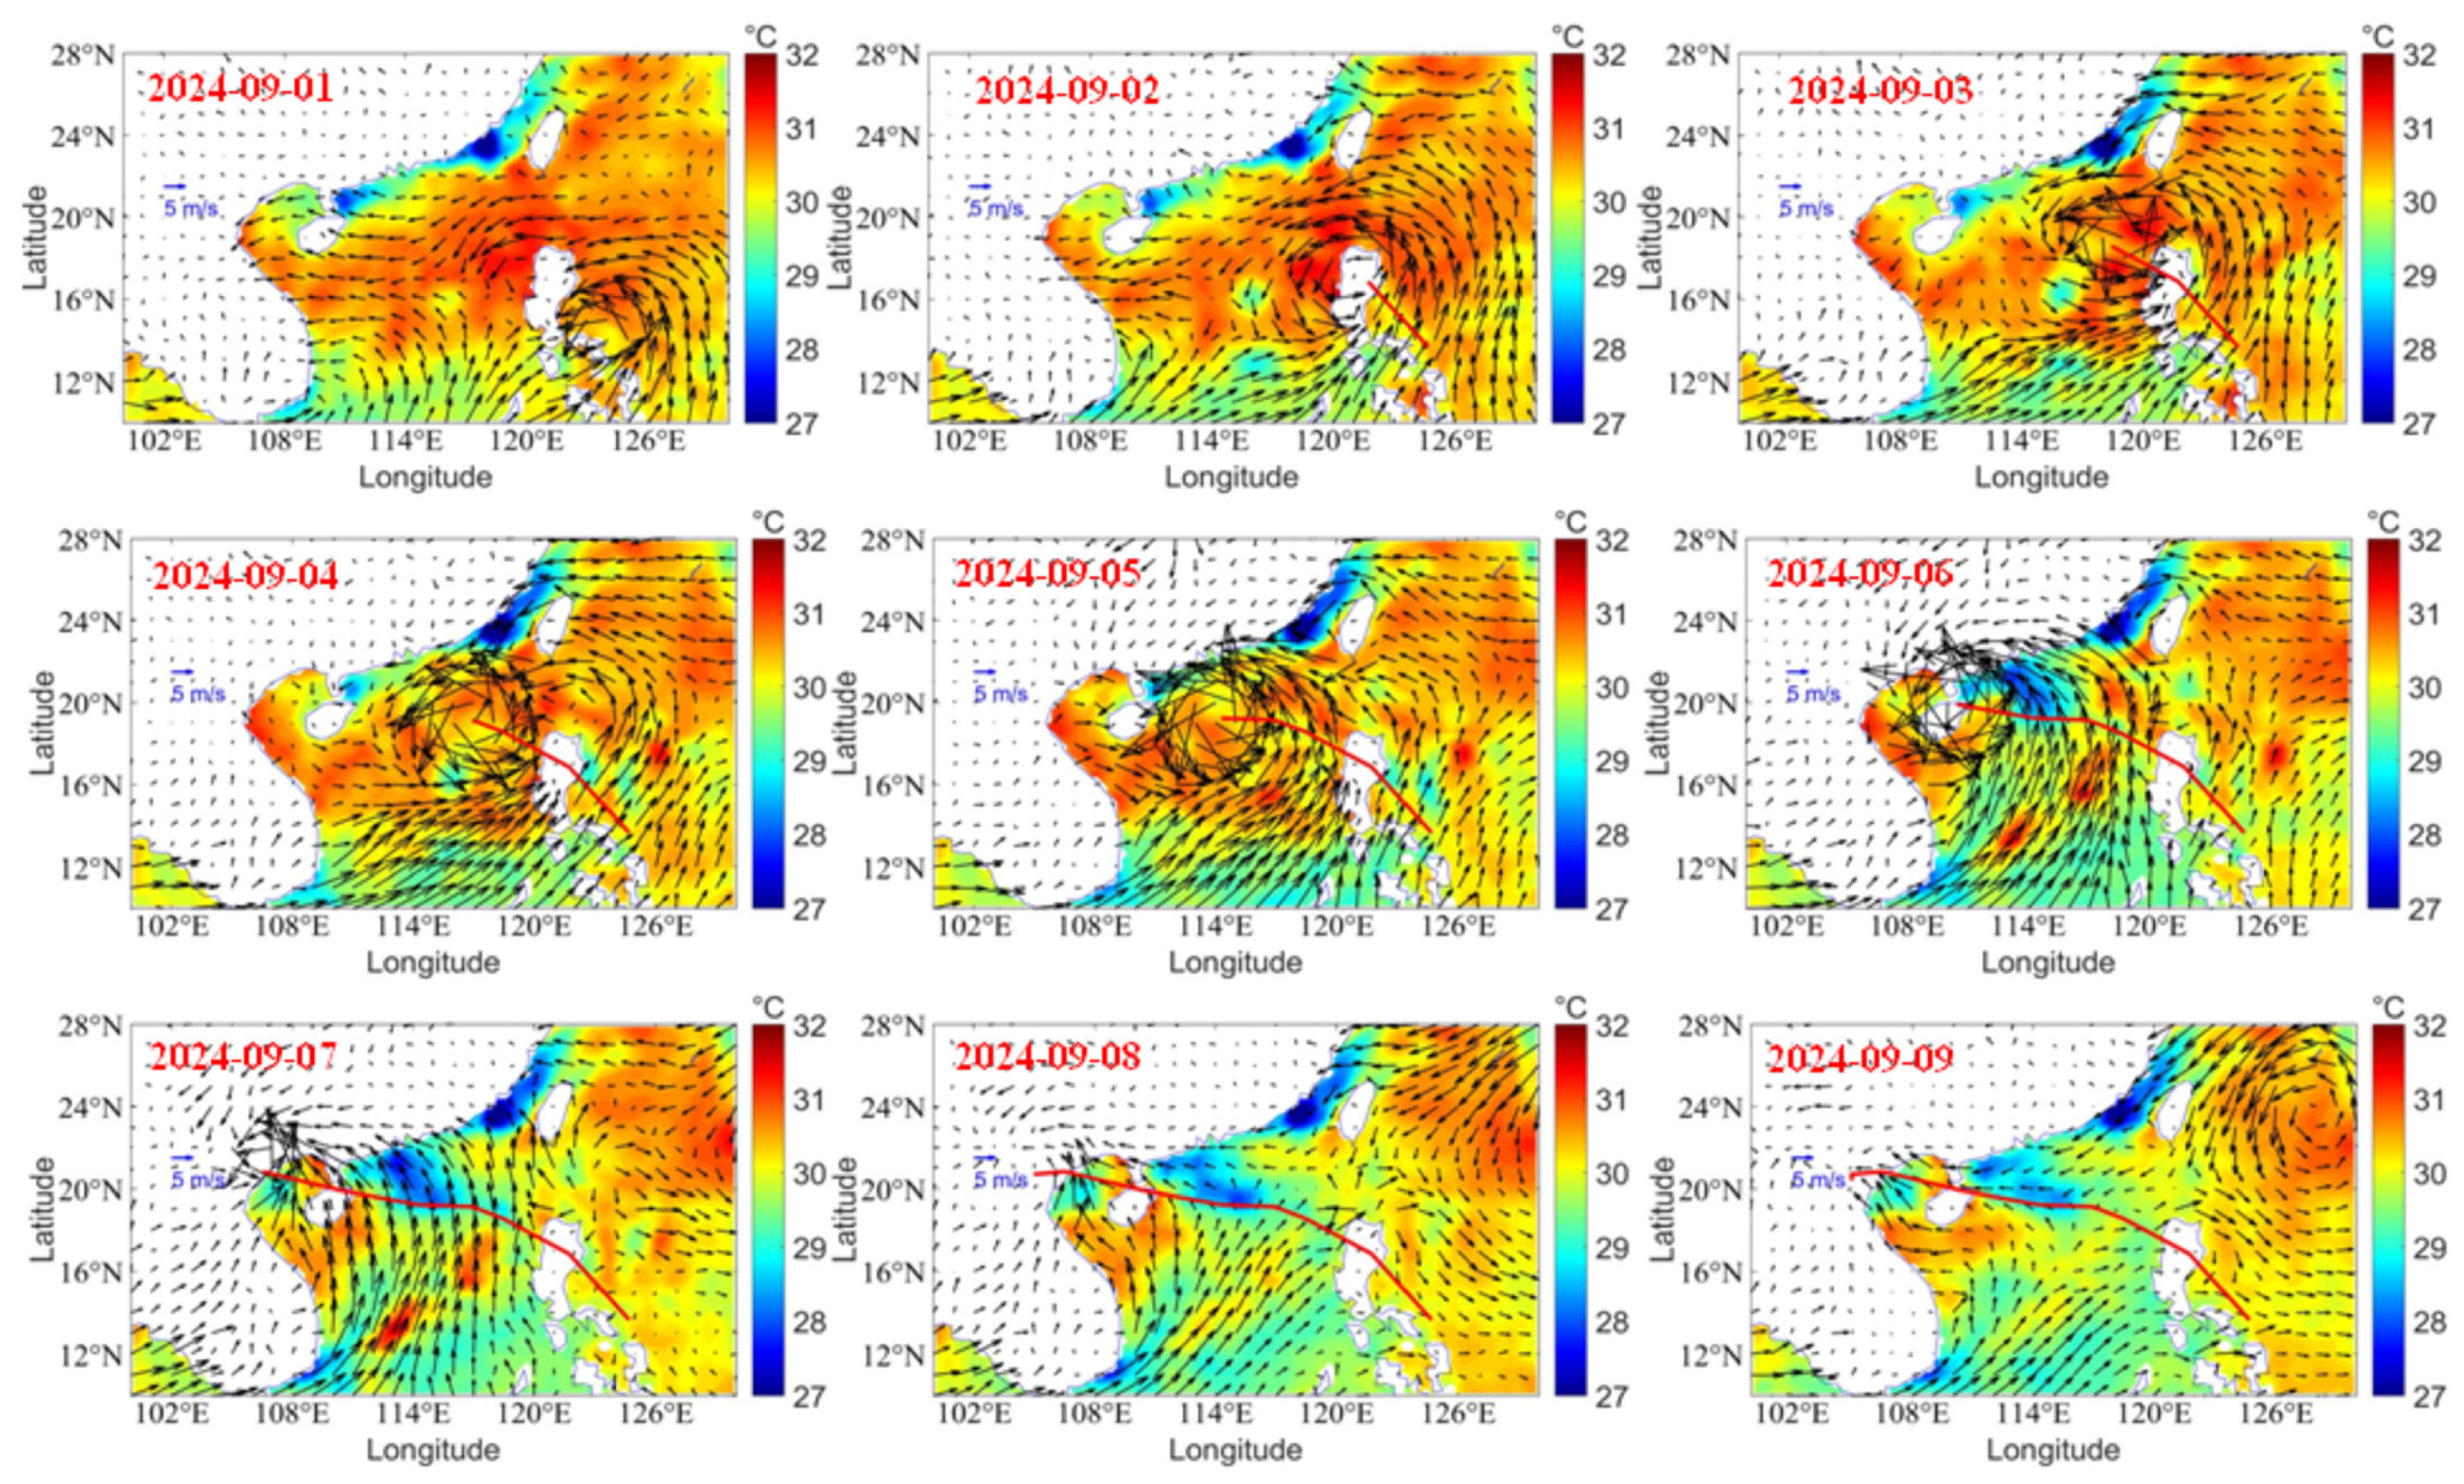
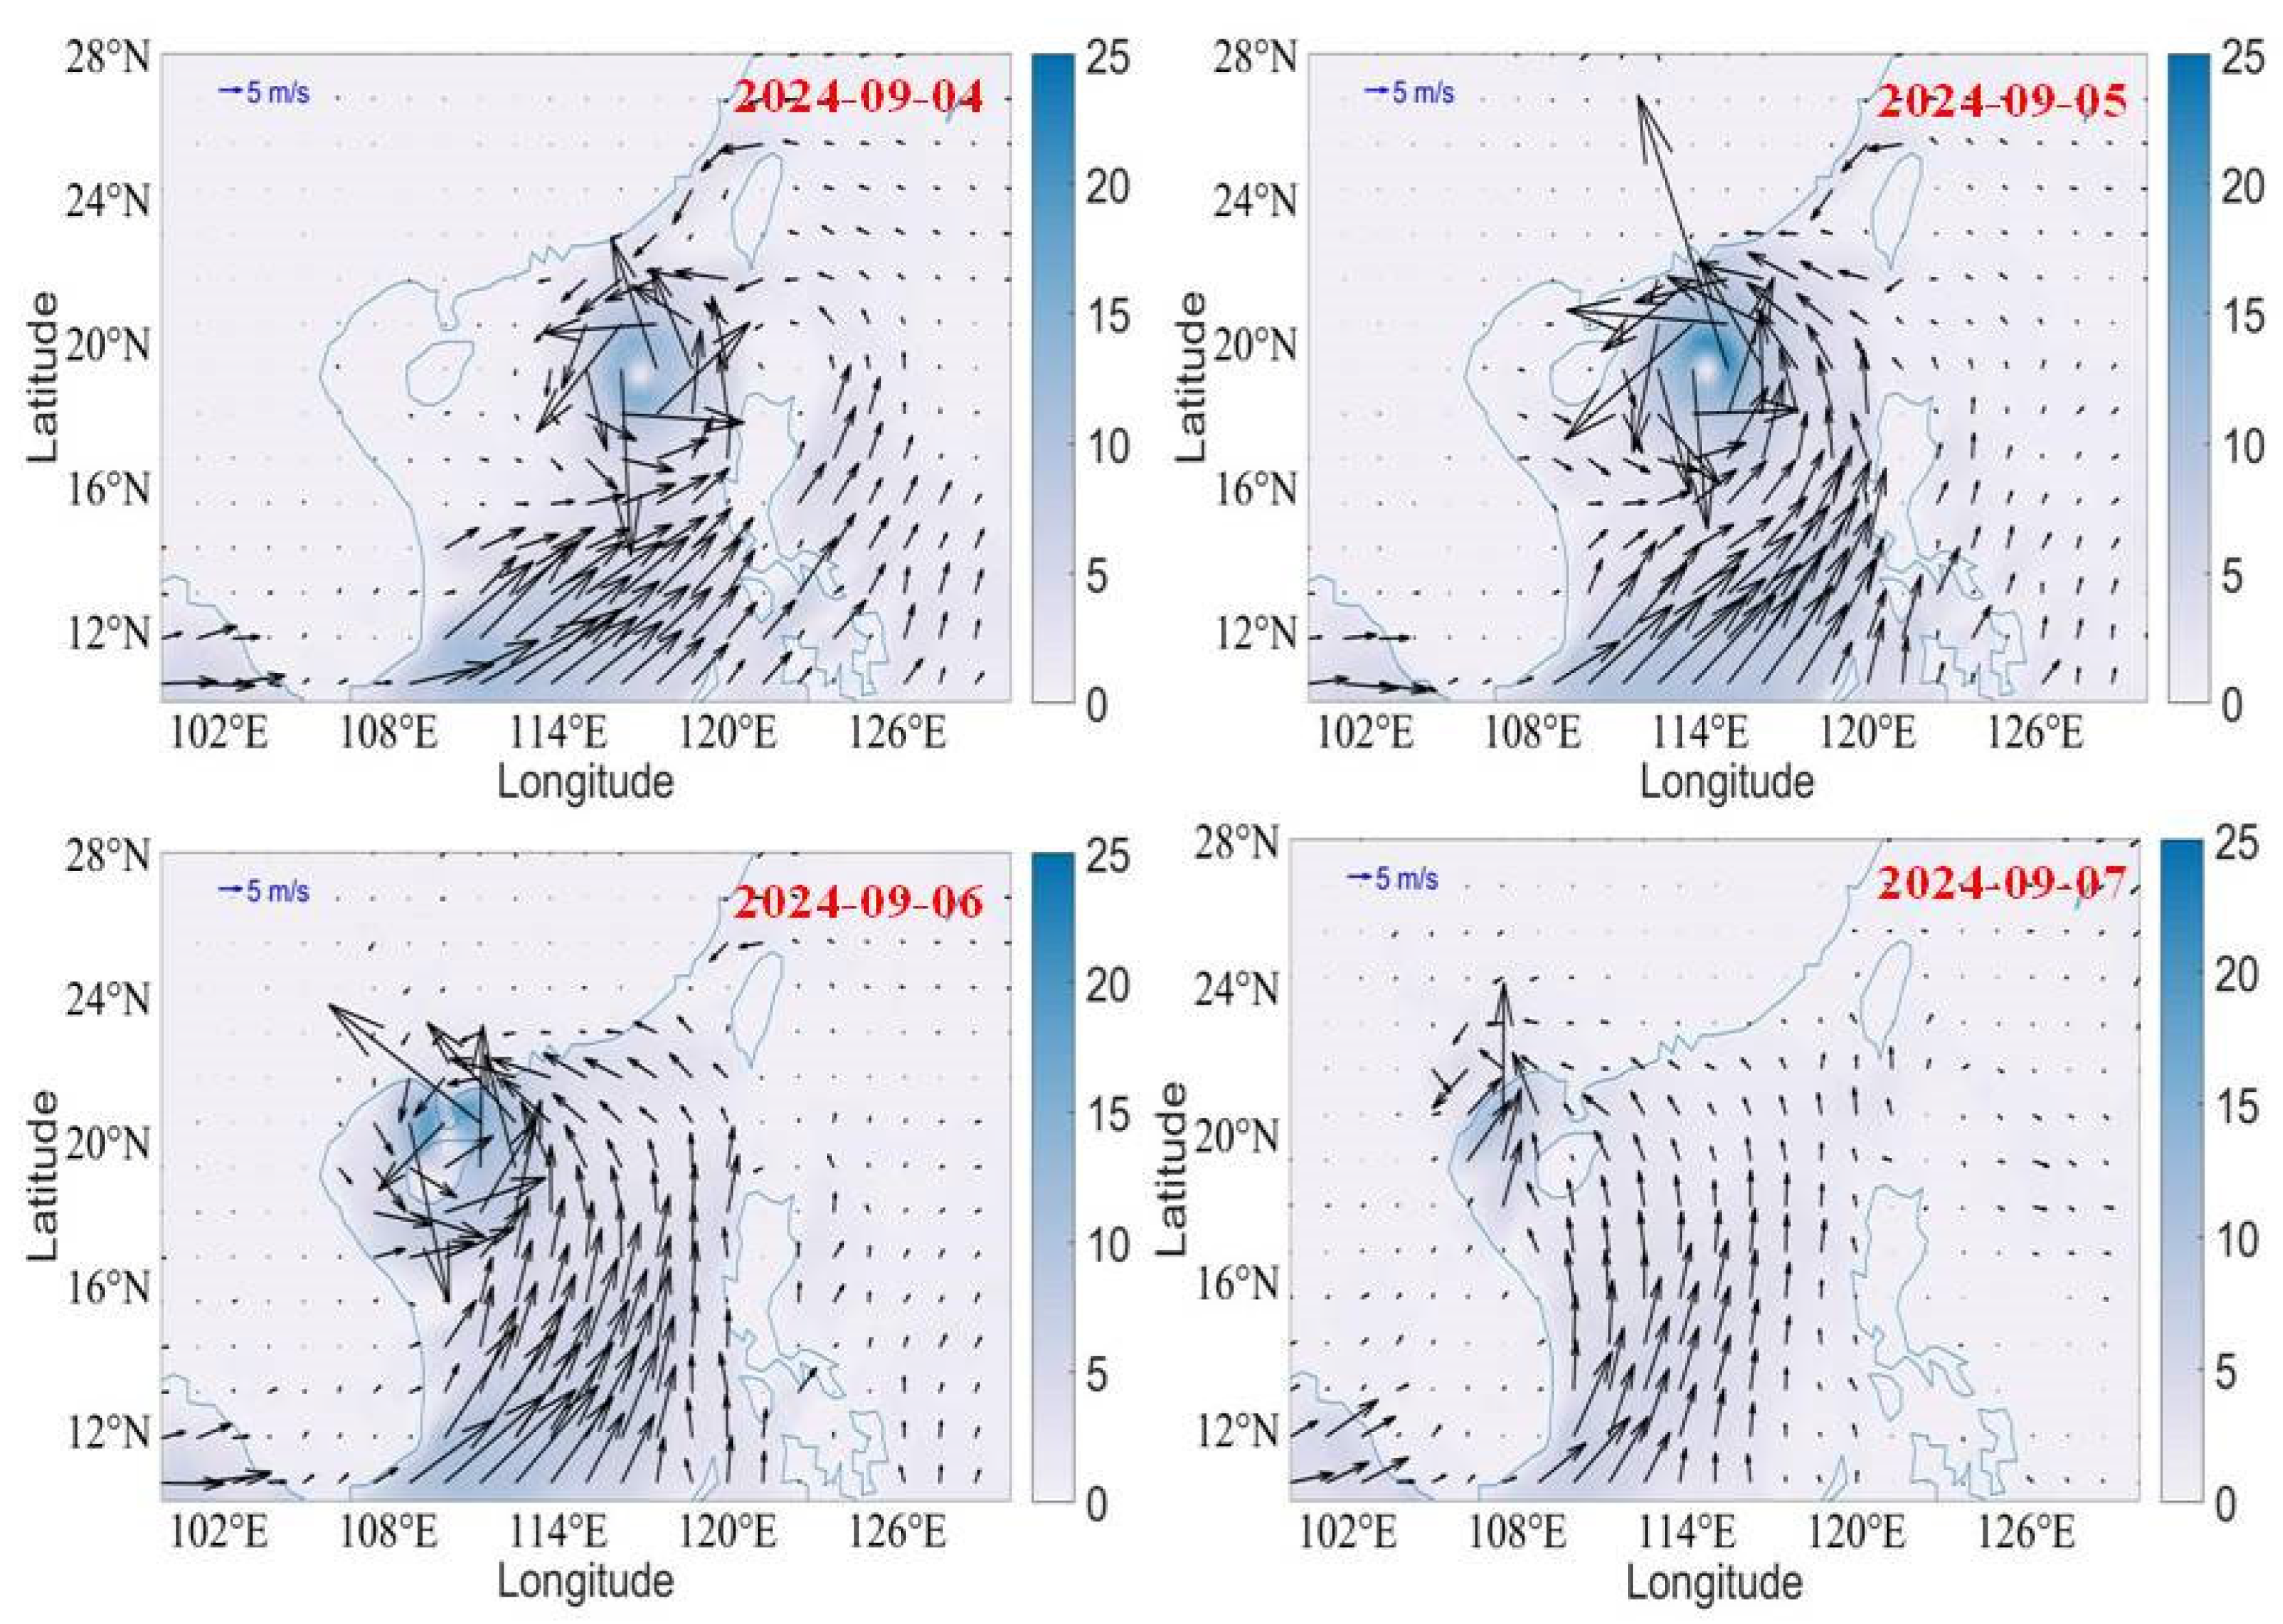
Typhoon Yagi (2024) was a fast-moving typhoon with a life period of eight days (1–8 September), which landed three times and produced heavy rainfall over the land. Its intensity varied over the land and sea. To attain energy from the ocean surface, the SST needs to be higher. Figure 3 reveals the variation of SST and wind vectors during Typhoon Yagi. When Typhoon Yagi formed with the SST of 30.3 °C, it then moved to the left side of the Philippines, where the SST is higher than 30 °C. The wind intensified, and the cyclonic wind can be observed on 1 September. Typhoon Yagi made landfall on the left side and moved over the Philippines without a change in intensity. On 1 September, cyclonic winds can be observed over a warm SST. On 2 September, the cyclonic winds were over the land; however, the cyclonic winds can be seen over the sea area. The area covered by the typhoon is large. On 3 September, the typhoon moved over the South China Sea (SCS), where the SST was higher (31 °C). On 4 September, the typhoon intensity increased, and the areal extent was higher than on the previous day. The typhoon is moving over a high SST area.
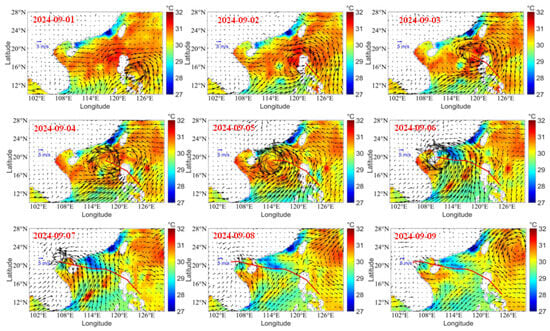
Figure 3.
Variation of SST (shaded) and wind (vectors) with typhoon track during Typhoon Yagi (1 September to 9 September).
On 5 September, the intensity is stronger, and one can find cooler water on the right side of the typhoon. When the typhoon intensified on 5 September, the instantaneous wind gust at 10 m was higher (S2), and the respective Ekman horizontal transport was also high. This led to higher SST cooling (more than 2 °C) on the right side of the typhoon track. The cooling of the SST can be explained based on the Ekman horizontal transport. Figure 4 depicts the variation of Ekman horizontal transport and Ekman pumping velocity during the period 4–7 September. The highest Ekman horizontal transport and Ekman pumping velocity was on 5 September, which led to higher SST cooling observed on the right side of the typhoon, where the typhoon intensity was higher. However, the translation speed of Typhoon Yagi is lower, which affected the sea surface, producing strong upwelling. On 6 September, a typhoon landed over Haikou, Hainan. While passing over Hainan Island, the typhoon’s intensity decreased, and the area extent of the wind decreased. On 7 September, the typhoon passed over the sea area (Gulf of Tonkin) check the name of this area) and made landfall on 8 September in Vietnam. While passing over the sea area, due to the higher SST (more than 30 °C), the typhoon intensified again and made landfall. After landing in Vietnam, the coastal water SST decreased with a cooling of 0.8 °C. This shows that South China Sea (SCS) is warmer, and the cooling was limited to 1–1.5 °C only. Normally, with a severe typhoon, the SST cooling will be higher. At the same time, if the translation speed is lower, the typhoon will affect the sea, and due to strong cyclonic winds, the water will transport on the right side of the typhoon track cooler water due to upwelling. An upwelling feature can be observed on 6 September; on the right side of the track, 1.5 °C cooling was experienced. However, the cool patch of 1° C can be found on 7 September; on 8 September, the typhoon slowly dissipated over Vietnam. However, there a strong wind persisted over the Vietnam coast. On 9 September, the wind speed reduced and became normal.
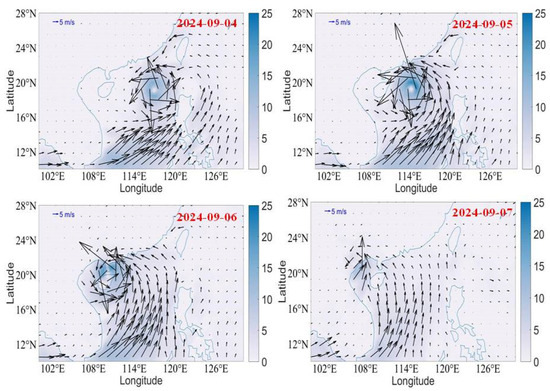
Figure 4.
Variation of Ekman horizontal transport and Ekman pumping velocity of Typhoon Yagi from 4 to 7 September 2024.
3.2. SST Variation over the Selected Areas
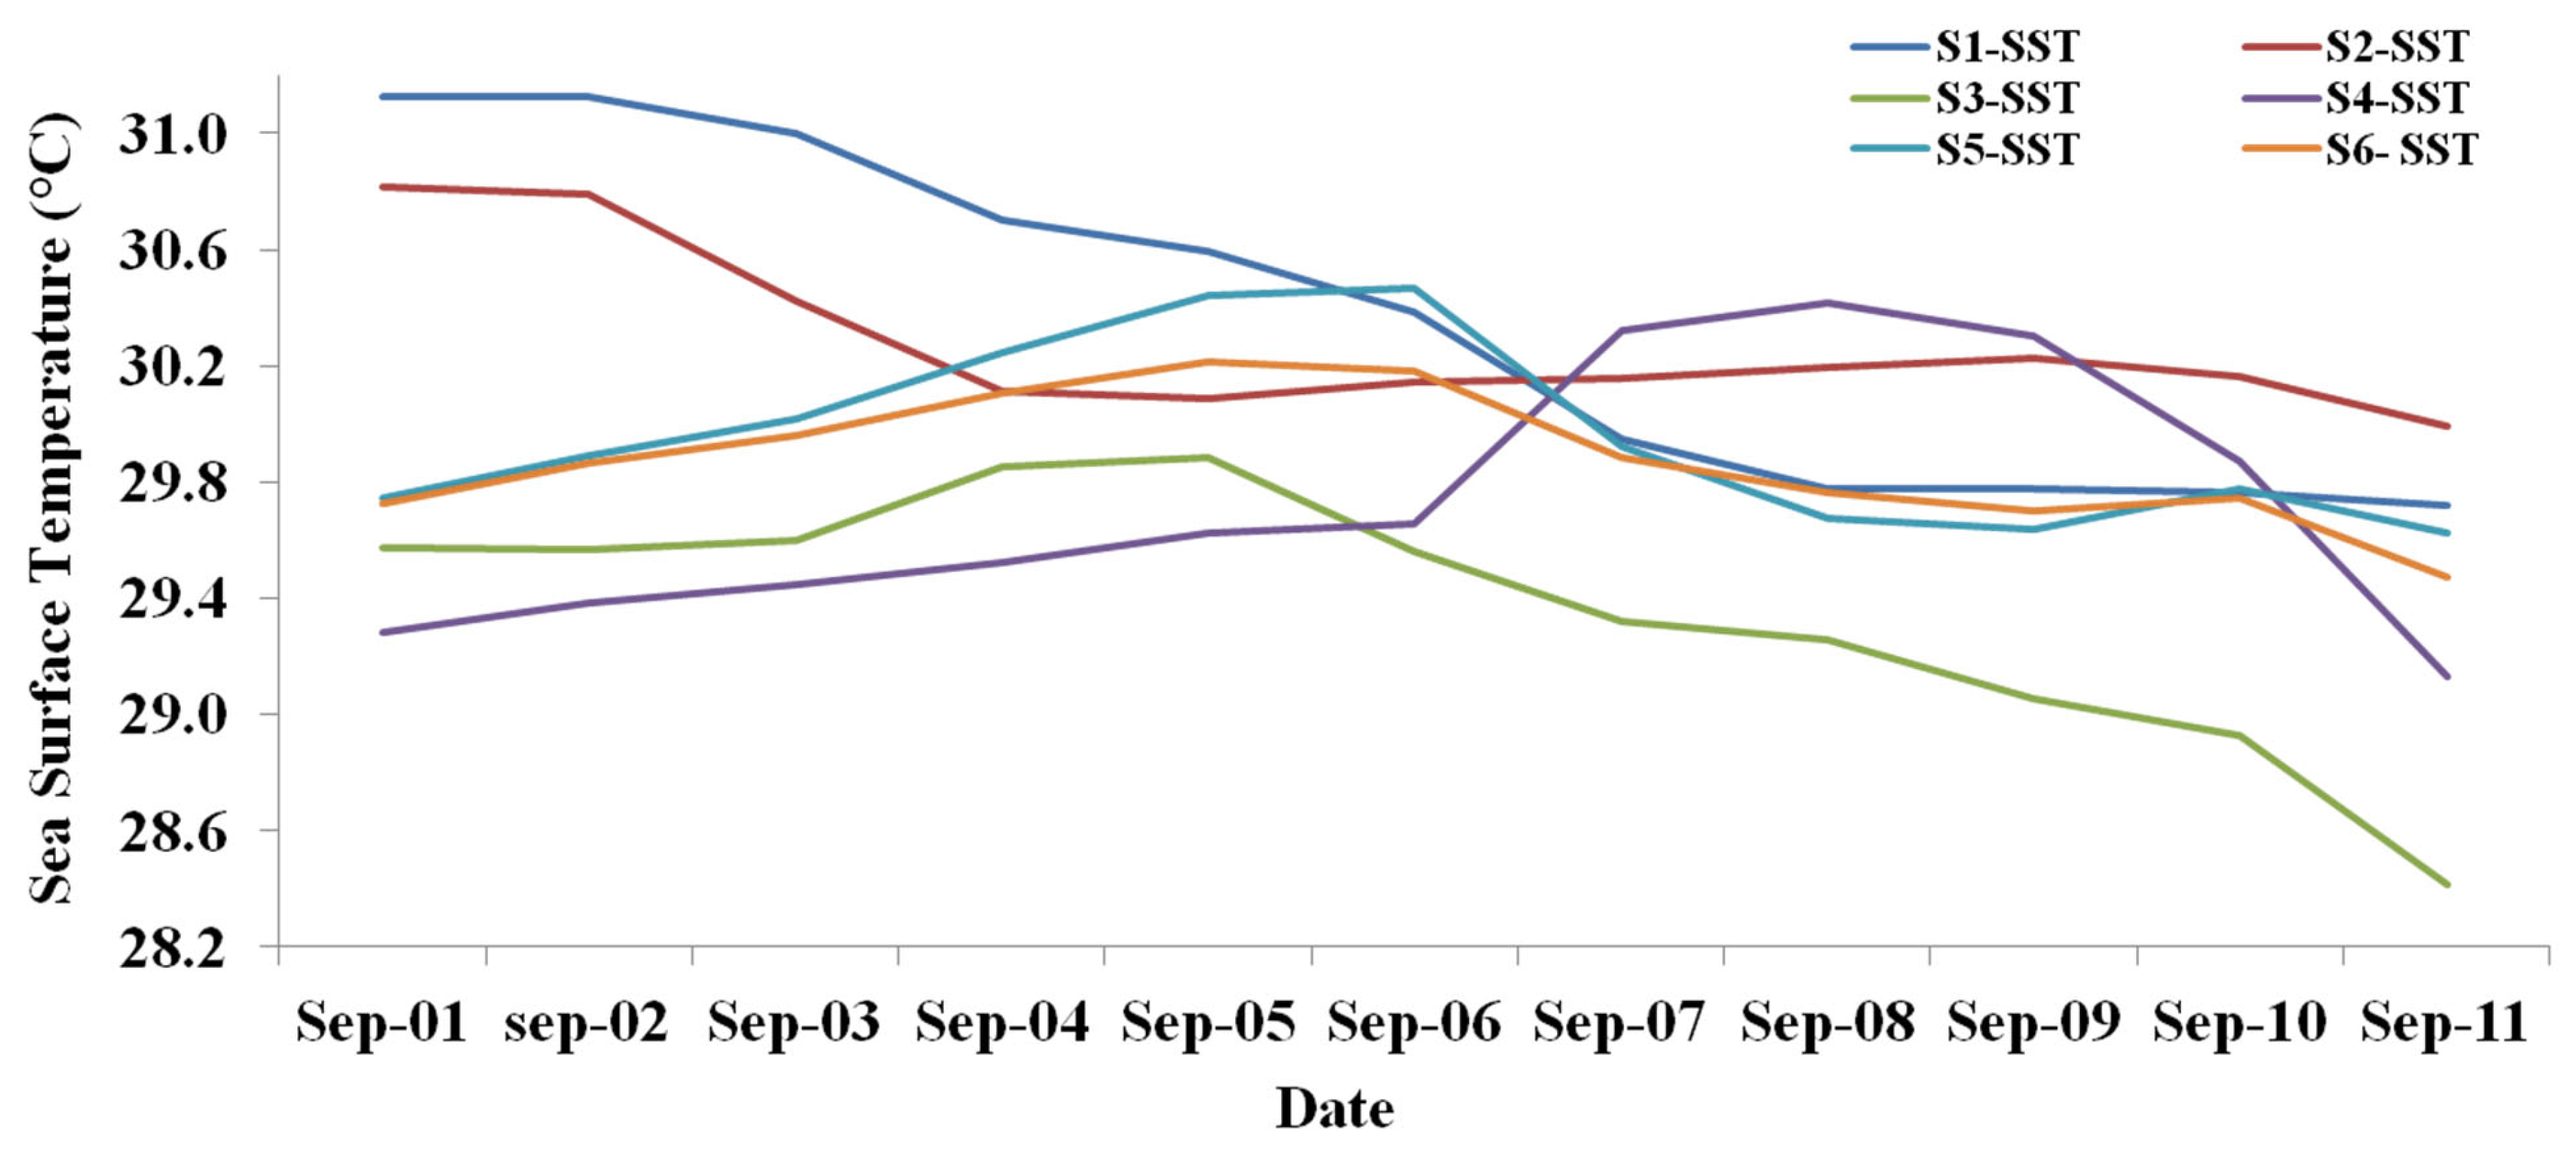
To identify the variations in the daily SST at different locations, as shown in Figure 1, we chose S1 (18–20° N; 119–120.5° E), which is on the east coast of Philippines, S2 (16–19° N; 121–124° E) on the west coast of Philippines, S3 (19–21° N; 111–113° E) on the east coast of Hainan, S4 (19.21° N; 109–111° E) on the west coast of Hainan Island, S5 on the east coast of Vietnam (20–22° N; 107.5–111° E), and S6, which is the sea area between Hainan and Vietnam (19–22° N; 106–111° E). The variations are given Figure 5.
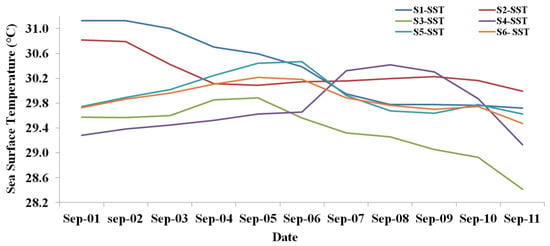
Figure 5.
Variation of SST over the different locations, from S1 to S6.
For the S1 area on the east coast of the Philippines, the mean SST clearly indicates that the typhoon induced cooling of SST. The SST was 30.8 °C on 1 September, before the typhoon started. After the typhoon passed, the SST began to decrease to 30.1 °C on 4 September. There was an SST cooling of 0.7 °C due to the typhoon passage. Then SST then slowly increases to 30.2 °C until 10 September.
For the S2 area on the west coast of the Philippines, the mean SST on 1 September shows 31.1 °C. Due to the rainfall on 2 September, the SST started declining. On 3 September, while the typhoon passes, the SST decreased to 31 °C and continued to decline until 11 September, down to 29.7 °C. For the S2 area, situated in the South China Sea, the effect of the typhoon continued and the SST decreased; however, the cooling is limited 1.3 °C.
The mean SST on the east coast of Hainan (S3) on 1 September shows 29.6 °C, which then increased until 5 September to 29.8 °C. The typhoon passed on 6 September; the SST then decreased, until 11 September, to 28.4 °C. On 6 September, the typhoon passed over the SCS and through the right side of Hainan; the SST decreased due to Ekman horizontal transport and heavy rainfall, resulting in SST cooling of 1.4 °C.
For the mean SST west coastal area of Hainan (S4), on 1 September the mean SST was 29.3 °C, which then increased to 29.6 °C on 6 September. On 7 September, the SST further increased to 30.3 °C, before increasing to 30.4 °C on 8 September. After the typhoon had passed, the SST slowly decreased to 29.1 °C on 11 September. The higher SST on the left side of Hainan provided sufficient energy for the typhoon to increase its intensity.
The sea area between Hainan and Vietnam (Gulf of Tonkin) shows a mean SST (S5) of 29.7 °C on 1 September, which increased to 30.2 °C on 5 September. When the typhoon passed over Hainan on 6 September, the SST started decreasing until 9 September (29.7 °C), before then increasing by 0.1 °C on 10 September and then decreasing by 0.3 °C on 11 September. The typhoon effect on the sea area is not significant, and due to higher temperatures, the typhoon intensity increased, landing over Vietnam with greater intensity.
On the Vietnam coast (S6), the mean SST of 29.7 °C is found on 1 September, which continuously increased to 30.5 °C on 6 September. In the period 6–7 September, the typhoon passed over the sea area and landfall occurred in east coast of Vietnam on 7 September; the SST decline started from 7 September and continued to decline until 11 September, to 29.6 °C. Due to the typhoon intensity and heavy rainfall over coastal area of Vietnam, SST cooling of 0.8 °C occurred over the coast of Vietnam.
3.3. Rainfall Variations During Typhoon Yagi
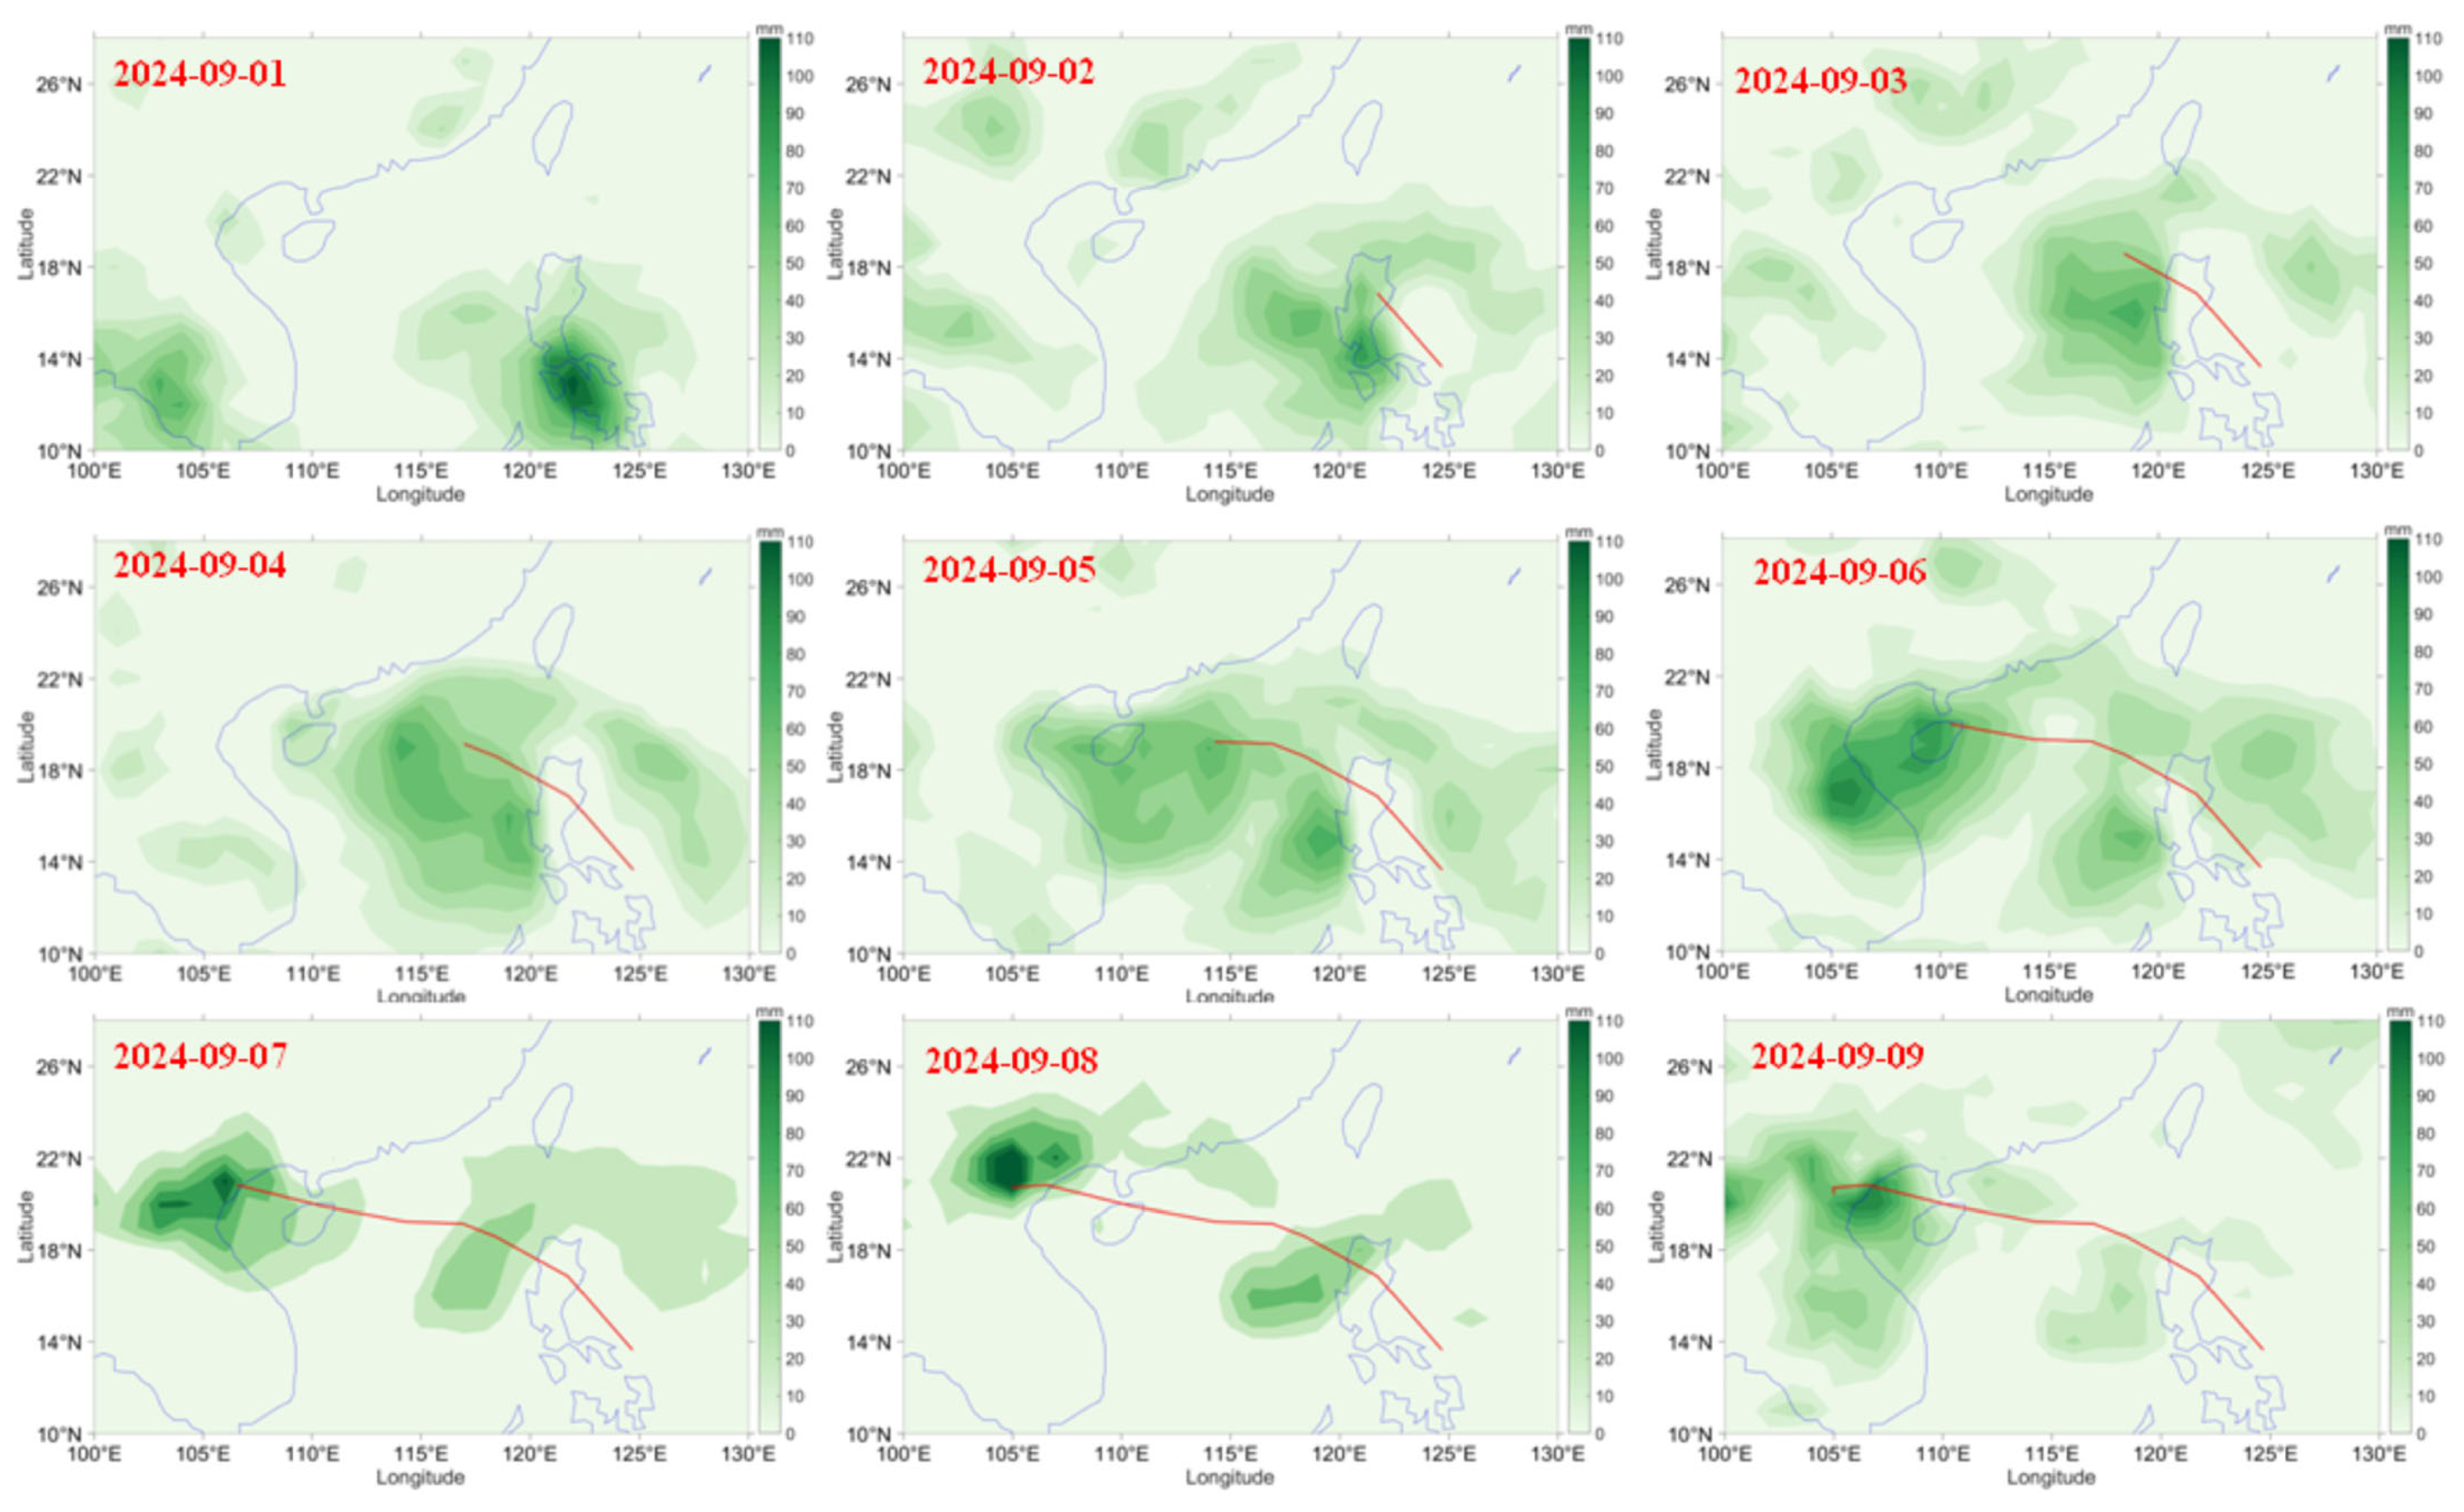
The Typhoon Yagi rainfall variations are given in Figure 6. On 1 September, Typhoon Yagi produced rainfall of 70 mm over the Philippines, which is on the left side of the typhoon track. When the typhoon moved near the land on 2 September, the rainfall was distributed over the land as well as in the sea. However, the rainfall decreased compared to the previous day. On 3 September, the typhoon passed the Philippines and was situated in the sea. Rainfall can be observed on the left side of the typhoon track. On 4 September, the intensity of the typhoon increased, the rainfall distribution over the sea increased. The rainfall on the left side is higher than on the right side. Rainfall distribution can be observed on the left side, right side, and in front of the typhoon on 5 September. The rainfall can be observed near the left coast of the Philippines, and at the same time, Hainan Island also experienced rainfall. On 6 September, the typhoon landfall at Hikou, Hainan, the rainfall was distributed over Hainan as well as over the coastal area of Vietnam. The rainfall over Hainan was 100 mm. Rainfall over Hainan Island was higher than on the previous day. Heavy rainfall can be seen over the coast of Vietnam coast. However, the rainfall over the Philippines had reduced. On 7 September, typhoon landfall in Vietnam produced heavy rainfall of 95 mm. The rainfall over Hainan Island reduced. Heavy rainfall of 100 mm can be observed on 8 September over the coast of Vietnam, which continued till 9 September. However, on 9 September, the rainfall reduced. Vietnam experienced lower rainfall on 10 September. From the night of 6 September until the early morning of 8 September, the northern region experienced rainfall of 70–200 mm, with some areas receiving over 300 mm. According to the National Centre for Hydro-Meteorological Forecasting, Vietnam, the following places received heavy rainfall: Phu Duc (Thai Binh) 441 mm, Van Mai (Hoa Binh) 440 mm, Vang Danh (Quang Ninh) 380 mm, Xuan Thuy (Nam Dinh) 357 mm, Ngoc Chien (Son La) 406 mm, Lang Nhi (Yen Bai) 324 mm.
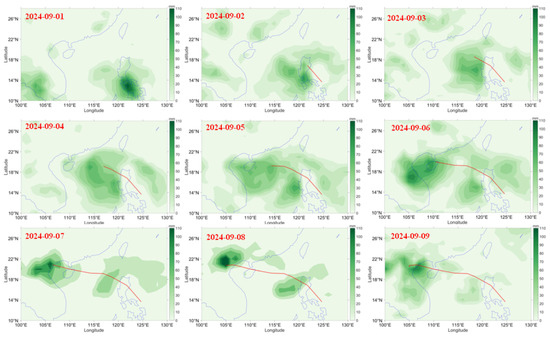
Figure 6.
Variation of GPCP rainfall (shaded) with typhoon track during Typhoon Yagi (1–9 September).
3.4. Rainfall Variations over the Selected Areas
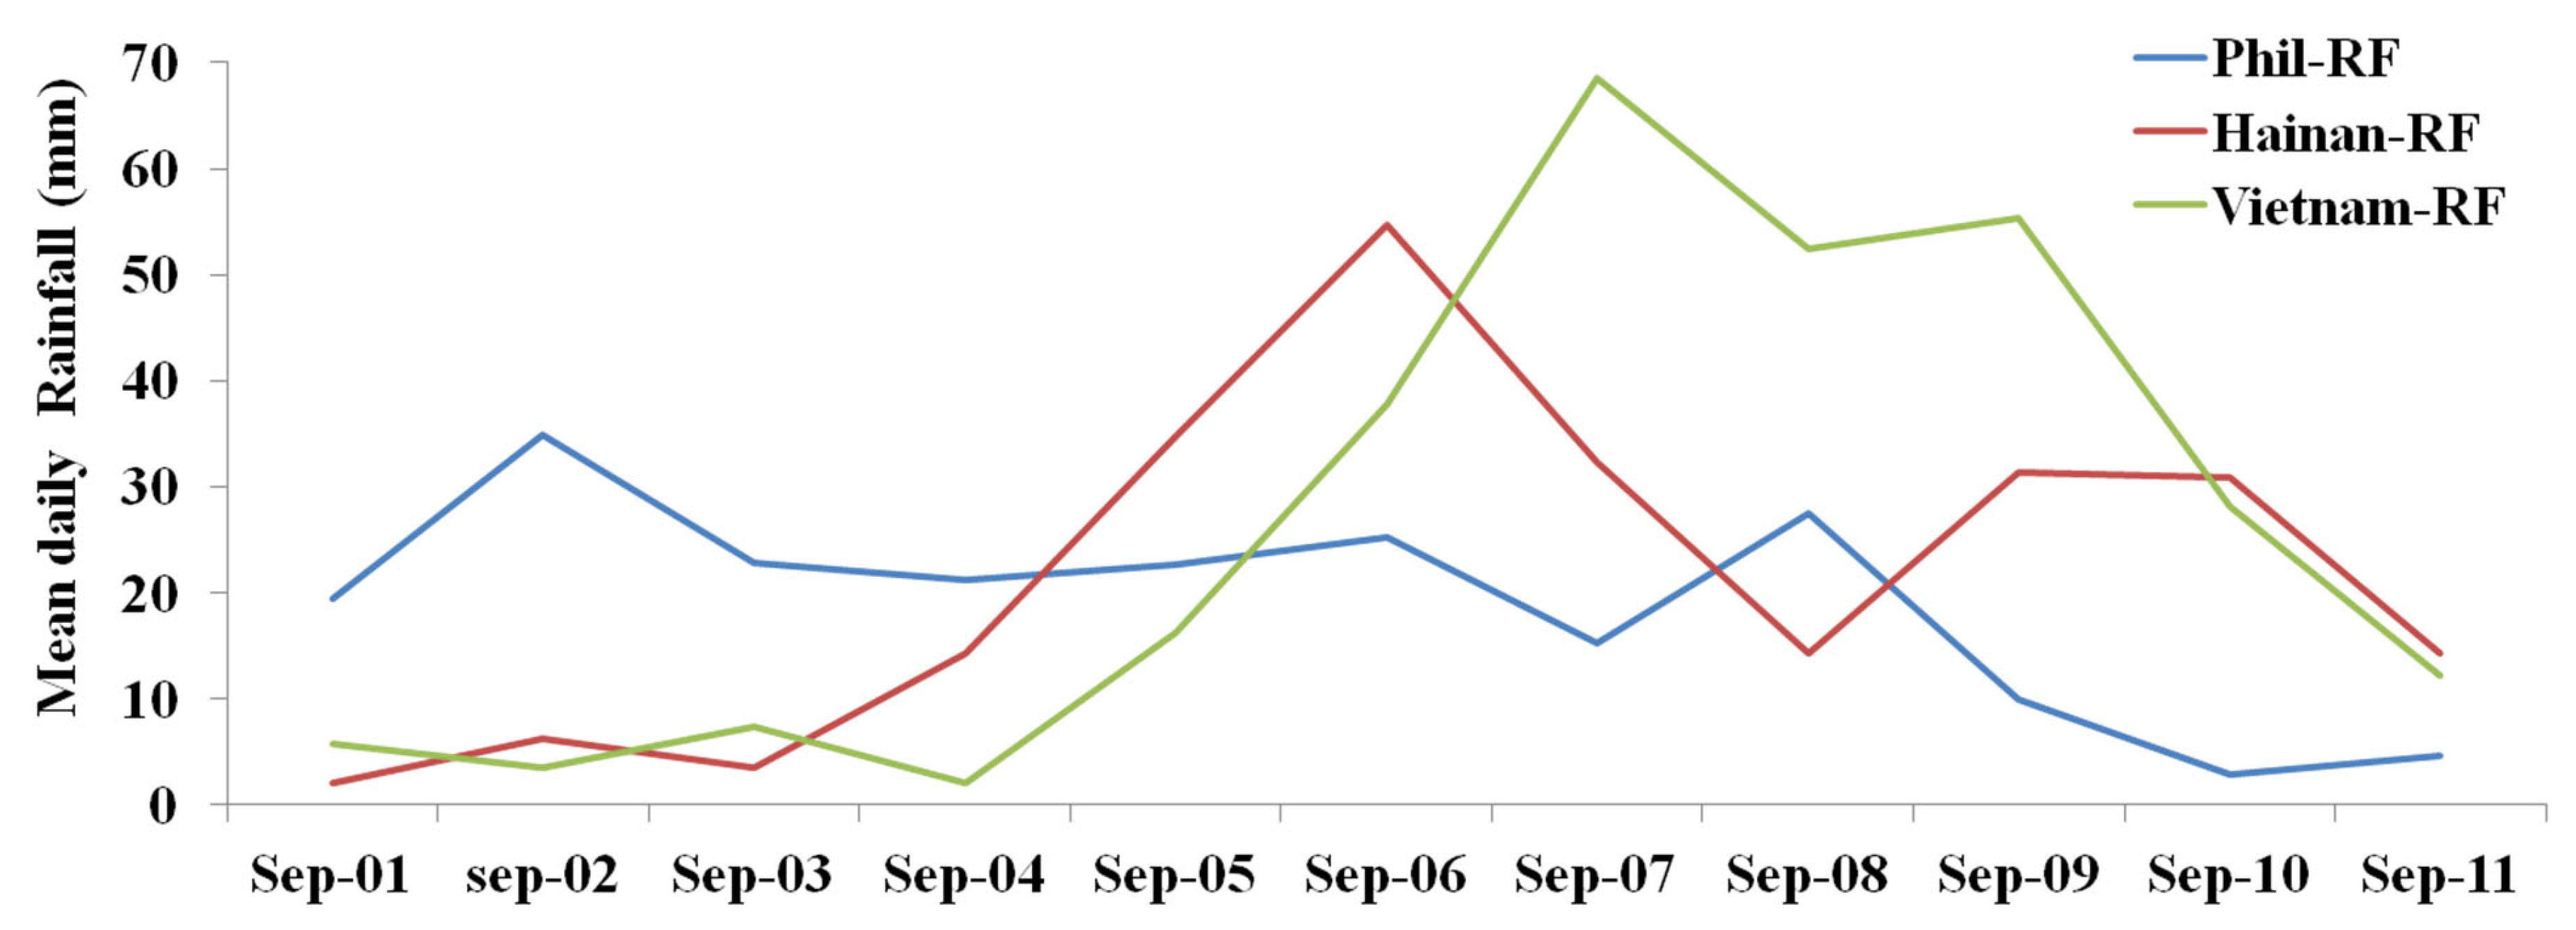
Figure 7 represents the variation in the mean daily rainfall over the Philippines, Hainan, and Vietnam. From the figure, it can be seen that on 2 September, the Philippines received higher daily mean rainfall (34.8 mm) during the study period. However, some of the rainfall may be due to convective rain. The daily mean rainfall reduced to 2.8 mm on 10 September. The daily mean rainfall over Hainan increased from 3 September to 6 September (from 3.5 to 54.7 mm). When the typhoon was in the SCS, the typhoon intensified and produced heavy rainfall over Hainan. Hainan experienced heavy mean rainfall of 54.7 mm on 6 September, on the same day as the typhoon made landfall over Haikou. When the typhoon passed, the daily mean rainfall decreased to 32.3 mm over Hainan (on 7 September). The rainfall then continued to decrease until 8 September (14.3 mm), after which it increased to 31.2 mm on 9–10 September, before decreasing again. When we examine the rainfall over Vietnam, we can see that the rainfall increased from 4 to 7 September (2.0 mm to 68.5 mm), then decreased slowly until 9 September. Later, the rainfall reduced drastically.
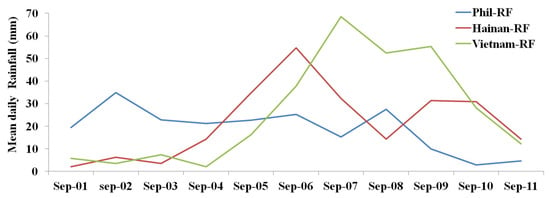
Figure 7.
Variation of mean daily rainfall over Philippines, Hainan, and Vietnam land areas.
3.5. Enthalpy Flux Variations
Figure 8 reveals the variation of LHF and SHF during Typhoon Yagi during the period 3–8 September, which shows that the typhoon intensity is higher. Enthalpy flux is higher during the period 3–7 September, when the typhoon is over the sea. The typhoon derives its energy from the sea surface to maintain its intensity. On 3 September, after the typhoon crossed the Philippines, its intensity increased, and SHF shows 60 W/m2 on the left side of the typhoon. LHF is also on the higher side. However, at the center of the typhoon, the LHF and SHF show lower values. On 4 September, the left side of the typhoon shows higher values, and the center exhibits low values. The distribution of LHF and SHF is symmetrical around the typhoon center. On 5 September, the distribution is the same as on the previous day; the right side of the typhoon center indicates a higher LHF of more than 600 W/m2 and with an SHF of more than 80 W/m2. However, at the center, the SHF is 40 W/m2 and LHF is 200 W/m2. On 6 September, when the typhoon made landfall in Hainan, both LHF and SHF decreased. SHF shows 0 W/m2 near the typhoon track and −150 W/m2 at Hainan Island. This indicates that the energy is transferring from the atmosphere to the land. However, the coastal areas of Guangxi and the sea areas show a higher LHF of 700 w/m2 and more than 100 w/m2 of SHF. The higher EF value over the sea provides sufficient energy to the typhoon to intensify over the sea and typhoon landfall in Vietnam on 7 September. From the figure relating to 7 September, it is clear that the LHF is around 350 W/m2. However, the SHF decreased to −100 W/m2. This clearly indicates that after the typhoon landfall, the heat transfer occurs from the atmosphere to land, and due to the typhoon’s strong wind speeds, the conditions remain favourable for LHF to be on the higher side. On 8 September, over the sea area, LHF decreased. It then further decreased on consecutive days over the sea as well as on land. From the EF variability, we can see that the symmetric structure of LHF and SHF provided sufficient energy to intensify Typhoon Yagi.
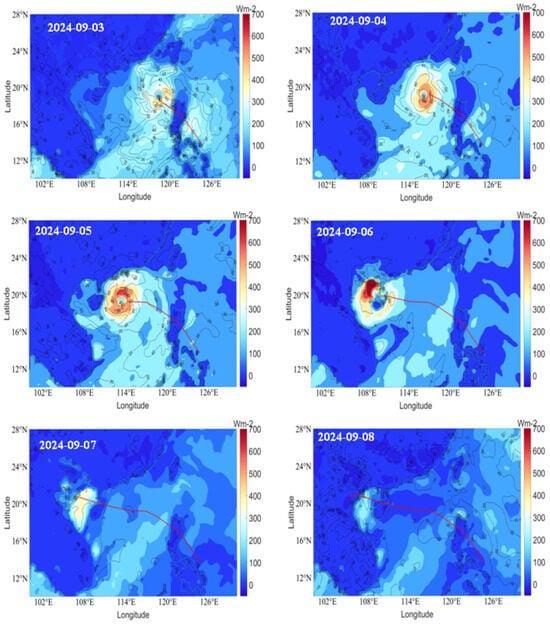
Figure 8.
Variation of latent heat flux (LHF) and sensible heat flux (SHF) during Typhoon Yagi (3 September to 8 September).
3.6. MF and MFC Variations
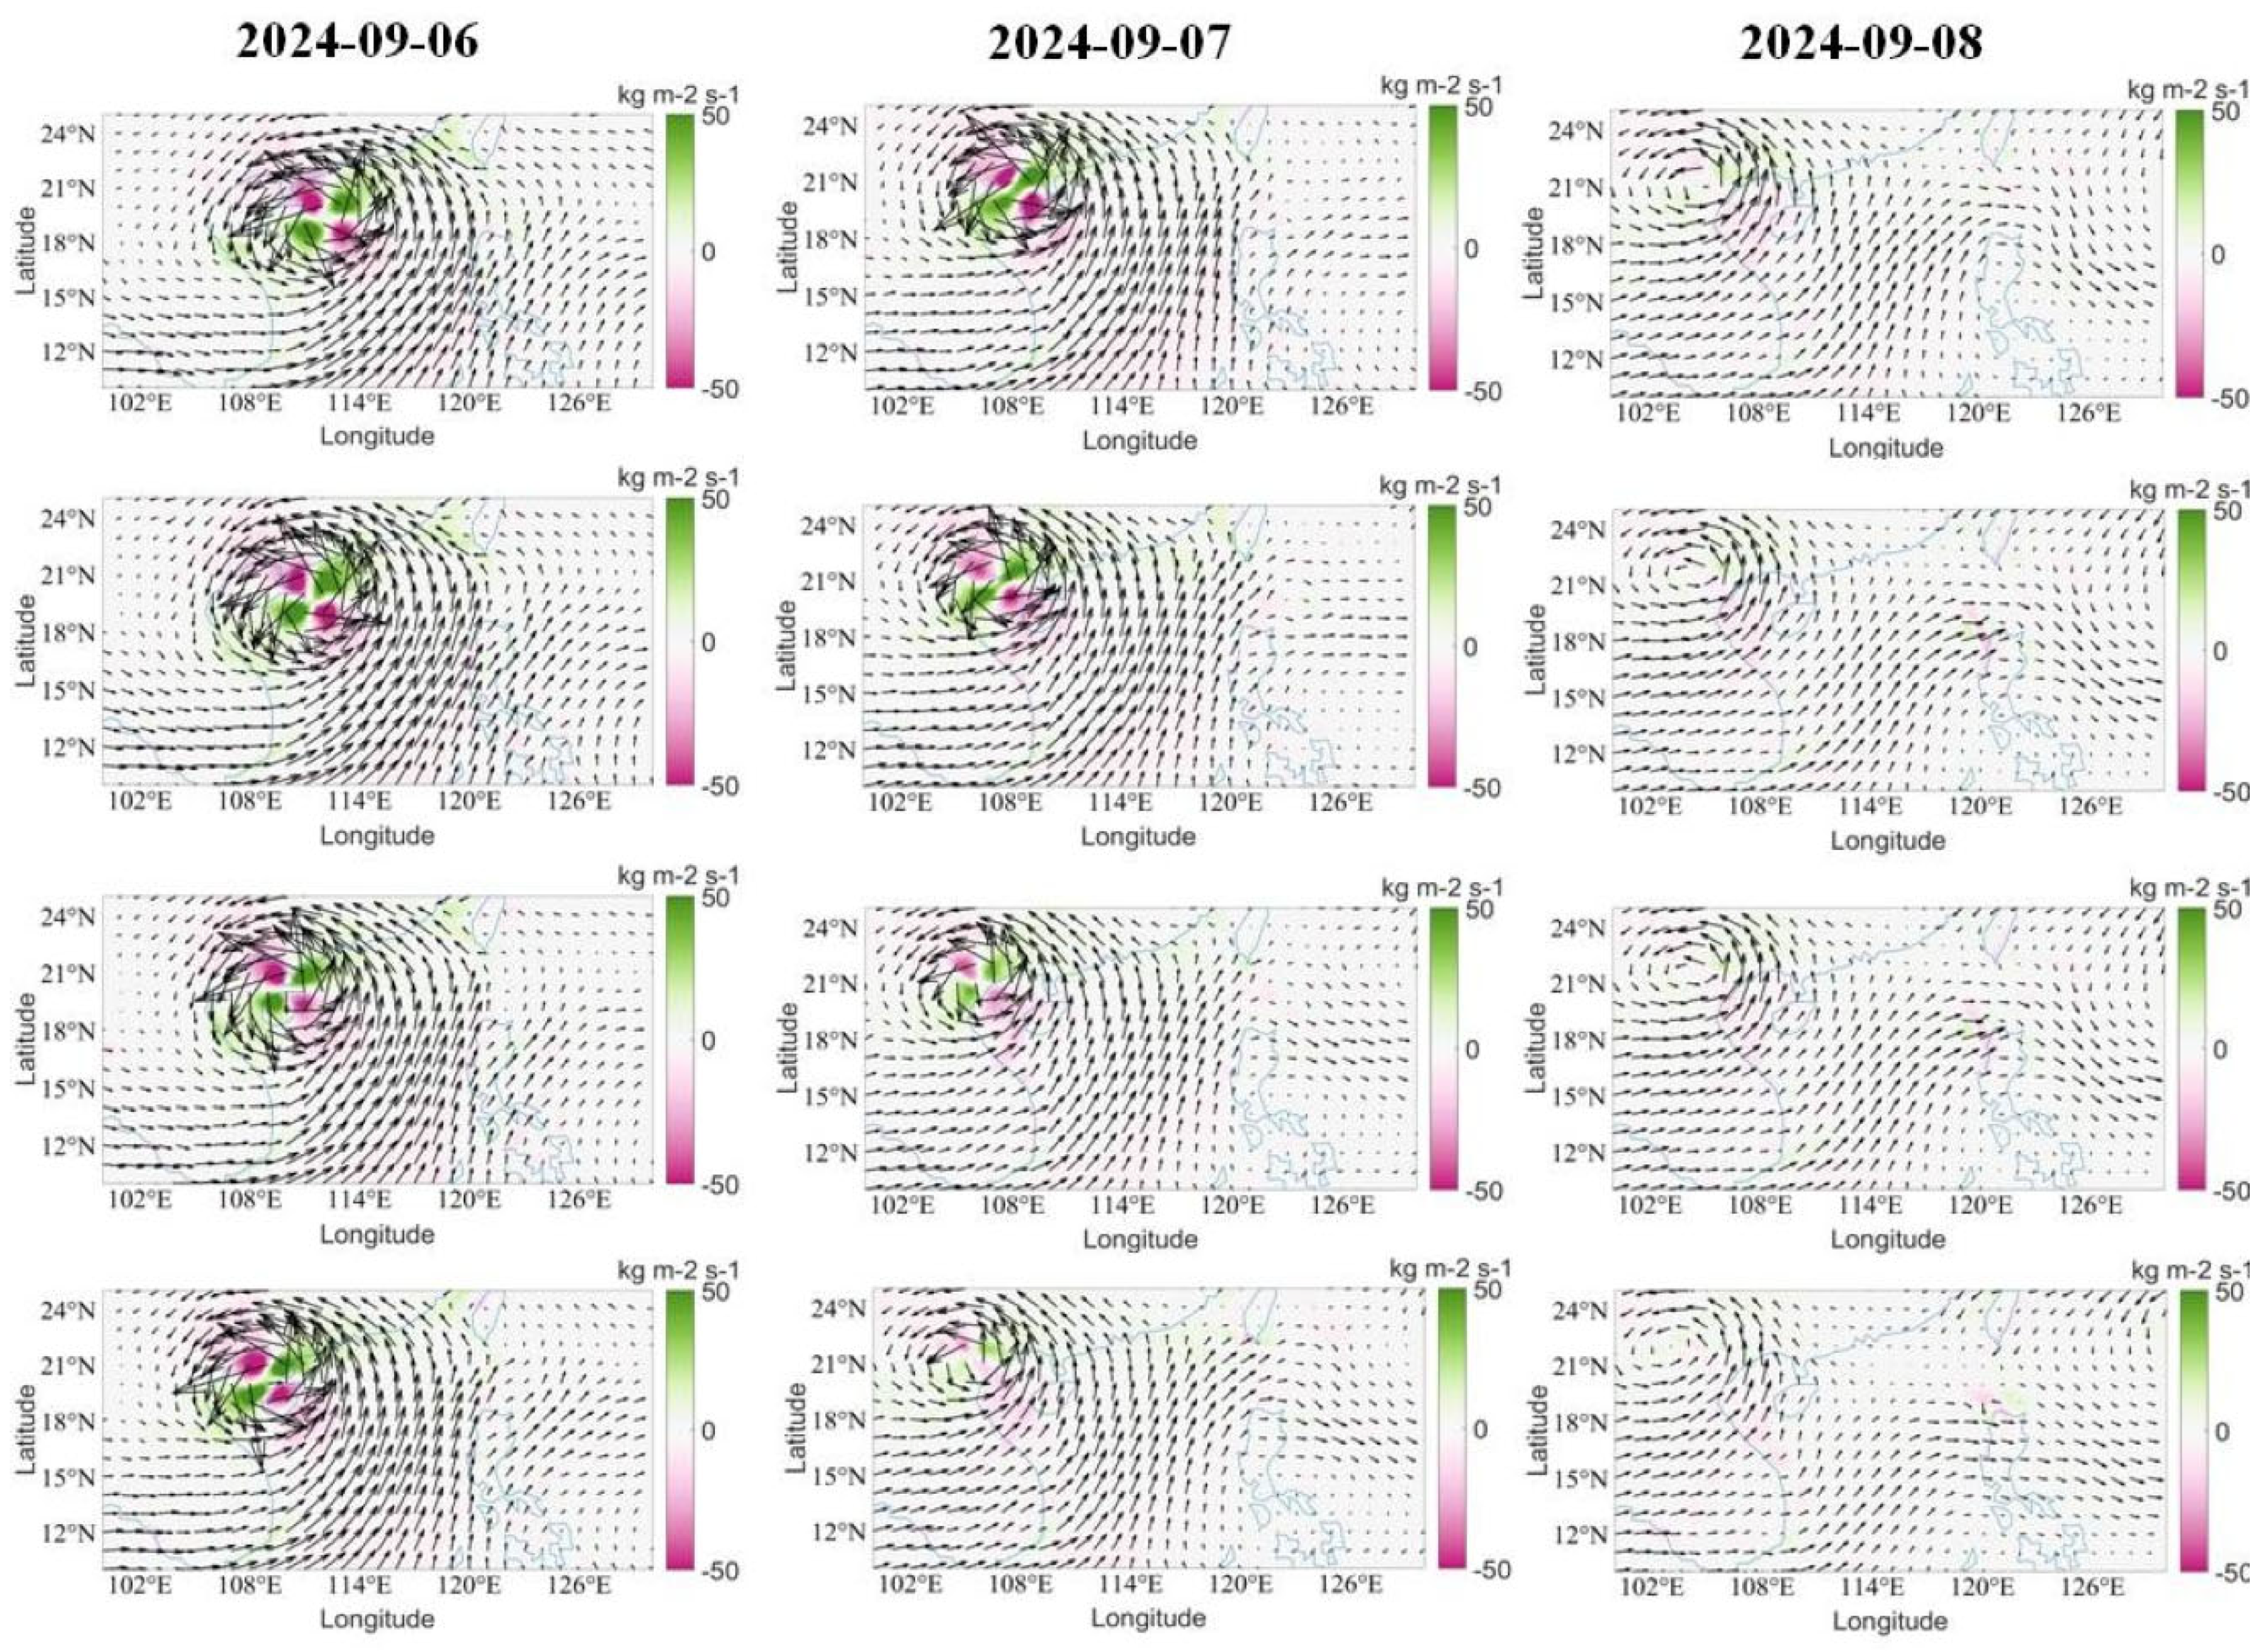
To find the process for heavy rainfall over Vietnam, we chose the dates 6–8 September, during which the typhoon was passing over Hainan and Vietnam, to explain the moisture flux (MF) and moisture flux convergence (MFC) for every 6 h (00, 06, 12, 18 h). A clear picture of the vertically integrated moisture flux convergence (VIMC) variations during Typhoon Yagi is provided in the Supplementary File (Figure S1). From Figure 9, it can be seen that on 6 September, the typhoon is in the South China Sea and landfall occurred at Hainan. On 6 September, one can see clearly that the MF is higher, and it is symmetrical and well-organized. We can observe the MF convergence in green color patches and the MF divergence (MFD) in pink color patches. The MFC and MFD are within the MF circulation. It can also be seen that the MF is being transported from the SCS, as indicated by the vectors. The same pattern is continued in the 6–18 h figures. On 7 September, the typhoon moved to the sea and made landfall in Vietnam. At 00 h, when the typhoon crossed Hainan and was situated in the sea, the MFC patches are connected, and the MFD is reduced. When the typhoon landed in Vietnam, MFC was still active for 6, 12 h. However, the divergence reduced further. At 18 h, divergence has disappeared, but the convergence remains at a lower intensity. On 8 September, the typhoon moved over Vietnam and slowly dissipated. At 00 h, both the convergence and divergence dissipated, but the MF circulation remained, with a lower intensity. This indicates that the MF continues with the typhoon. Moisture from the sea persists. At 18 h, the typhoon has dissipated, and the intensity of the MF has also reduced.
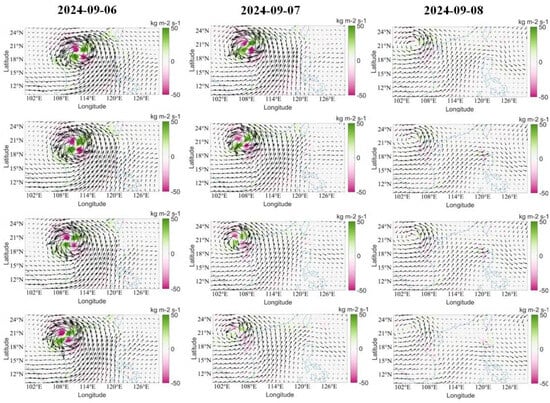
Figure 9.
Variation of moisture flux (MF) and moisture flux convergence (green shade)/divergence (pink shade) during the high intensity dates and during the landfall over Hainan and Vietnam.
4. Discussion
4.1. SST Cooling Due to Typhoon Yagi
During the Yagi Typhoon period, the South China Sea area reveals warmer temperatures. SST had an immediate impact on the severity of the typhoon [27]. The typhoon-induced SST cooling zones were on the right track. The cooling of SST depends on the translation speed. Typhoon Yagi was a fast-moving typhoon with a mean translation speed of 4.2 m/s; as such, the effect of cyclonic wind on the sea surface was not robust. However, On 5 September, the translation speed was 2.1 m/s, and the effect of cyclonic wind was higher on the sea surface. The reduced translation speed serves as a crucial mechanism for enhanced SST cooling [13,27]. When the typhoon intensified on 5 September, the instantaneous wind gust at 10 m was higher (refer to Supplementary File, Figure S2), and the respective Ekman horizontal transport was also high, which led to higher SST cooling (more than 2 °C) on the right side of the typhoon track. On 6 September, the translation speed increased to 4.1 m/s, and the effect of wind dust and horizontal transport on the surface therefore reduced. The SST cooling was lower than on 5 September, as can be observed in Figure 3 and Figure 4. Even though the wind gust and Ekman horizontal transport were higher, due to a higher translation speed, the effect on the sea surface is minimal and was accompanied by lower cooling of SST (less than 1 °C).
4.2. Dynamical Process for Heavy Rainfall over Vietnam
A higher LHF is suggested as it serves as a primary energy source for typhoon development. Heavy rain requires water vapor [27] and air currents and typhoons affect rain. The precipitation of a typhoon varies throughout its development. In the sea, the intensity of typhoon precipitation is positively correlated with the intensity of the typhoon [34,46,62,63]. The intensity of a typhoon decreases due to the terrain and other factors after it makes landfall [64,65], and the typhoon precipitation also decreases. Figure 6 illustrates a higher rainfall variation over the Philippines on 2 September, followed by a decrease on 3 September. Typhoon Yagi first made landfall in the Philippines, and when the typhoon moved over the terrain, the EF reduced over land, leading to lower evaporation; consequently, rainfall reduced. On 3 September, Typhoon Yagi was at SCS; the intensity increased, and at the same time, EF increased. Due to the increase in EF, the typhoon intensity also increased. To maintain the intensity of the typhoon, the moist EF of the sea provided power to the typhoon [66].
EF increased significantly as compared to fluxes during the storming stage. Higher LHF and SHF are crucial for the rapid intensification of typhoons, mainly because of the increased air–sea humidity difference affected by SST [67]. Subrahmanyam [52] described the greater precipitation on the left side of typhoons when they are in the sea. As the typhoon approached the land and further intensified, the moisture flux convergence became more symmetrical, and precipitation increased on the right side after landing. Heavy rain may result from the MF convergence zone shifting right off the typhoon track. MFC is caused by wind convergence and moisture advection [68]. Wind convergence drives moisture flux convergence during typhoons; however, moisture advection also contributes within the eyewalls. The cyclonic displacement of the maximum rainfall relative to the maximum MFC is possibly due to advection of hydrometeors by middle- and lower-level cyclonic circulation of TCs [30], whereas eyewalls affect moisture. From 3 to 5 September, the intensity of the typhoon increased, and the EF and MF increased with the typhoon. We can see more symmetric patterns and higher LHF as the typhoon rapidly intensifies. LHF is primarily responsible for the intensification of Yagi, consistent with earlier findings [7,69]. Vertical integrated moisture flux convergence (VIMC) daily variations of Typhoon Yagi are given in the Supplementary File (Figure S1). On 5 September, the typhoon reached its maximum intensity. Figure 7 and Figure S1 clearly demonstrate a symmetrical EF and an increased VIMC. Rapidly intensified storms have a more symmetric pattern and higher LHF [67].
The impact of typhoon precipitation on land is mainly concentrated within 24 h before landfall and 24 h after landfall [33], which we can observe when Yagi made landfall over Vietnam. However, there is a lack of detailed research on precipitation changes during the development and dissipation processes of TCs. This paper aimed to establish the relationship between heavy rainfall and the dynamical processes that produce it, specifically in relation to Typhoon Yagi. We analyzed the variations in EF, MF, and MFC concerning rainfall.
When Typhoon Yagi was in the SCS, from Figure 7, it can be seen that the EF was higher and the MF and MFC increased during the typhoon’s peak intensity. On 6 September, Typhoon Yagi made landfall at Hainan. The precipitation at Hainan increased from 5 September and attained its maximum on 6 September, before subsequently reducing on 7 September. Figure 7 clearly shows a higher and symmetrical EF. The MF and MFC are also higher. SST cooling from typhoons influences their structure, resulting in greater asymmetry and an uneven distribution of enthalpy flux around the typhoon center [70]. However, the sea area between Hainan and Vietnam indicates a higher SST, which leads to a symmetrical structure of EF. From Figure 8 on 6 September, it can be seen that the MF is higher, and MFC is symmetrical, with a clear indication of convergence and divergence of MF leading to heavy rainfall over Hainan.
After the typhoon passed over Hainan, the typhoon passed over the sea area and made landfall over Vietnam on 7 September. On 6 September, while the typhoon was in the sea area, Figure 7 and Figure 8 show a higher LHF along with a strong MF and MFC. When we check the SST over the same area, it is higher, at around 30.5 °C. Warm and deep structures had maximum heat fluxes when the sea surface cooling was low. LHF and SHF increase significantly during the landfall of a typhoon compared to their values before and after, indicating that the typhoon requires a higher EF for support during this phase. SHF will have a negative value, indicating heat transfer from the atmosphere to the ocean. The TC intensity primarily controlled the symmetry of moisture flux convergence. Hill and Lackmann [71] argue that humidity impacts typhoon size. The eyewall and spiral bands around the eye receive uneven latent heat from the typhoon structure, creating an asymmetrical MFC. At the center, MFC and divergence revolve around the typhoon. The moisture advection was northeast, and the wind convergence was west of the typhoon. Due to higher wind gusts and strong cyclonic winds, the evaporation increased, leading to higher LHF. The moist EF is high, resulting in elevated MF and MFC values. When the moisture in the atmosphere was higher, rainfall from the typhoon increased over Vietnam, from 6 September to 7 September (Figure 6). However, after landfall in Vietnam, due to higher MF and MFC situated over the land, rainfall in Vietnam continued until 9 September. Topography has a significant impact on intensifying TC and local climate precipitation and the intensity of precipitation events [72,73]. A higher MF can be seen in Figure 8 (from the S1, VIMC is also higher over the land, which led to higher rainfall over the Vietnam land area), After landfall, the LHF decreased and the SHF became negative. This study reveals that Typhoon Yagi’s intensity was sustained by a well-organized and extensive circulation system, which was supported by favorable weather conditions with high sea surface temperatures of above 30.5 °C, significant low-level moisture convergence, and higher EF. Typhoon-induced precipitation is mainly controlled by the EF, MFC, and rapid intensification of the typhoon. MF information enhances typhoon intensity and precipitation prediction.
5. Conclusions
On September 5, the translation speed was recorded at 2.1 m/s, with cyclonic wind exerting a greater influence on the sea surface. The typhoon intensified and the instantaneous wind gust at 10 m increased, leading to increased Ekman horizontal transport extents. This resulted in increased SST cooling, exceeding 2 °C on the right side of the typhoon track.
Typhoon Yagi first made landfall in the Philippines, and when the typhoon moved over the terrain, the EF reduced over land, leading to lower evaporation; consequently, rainfall reduced on 2 September. The same feature can be observed during the typhoon’s landfall in Hainan on 6 September and then in Vietnam.
Symmetric patterns and increased LHF are primarily responsible for the rapid intensification of Typhoon Yagi. LHF and SHF increase significantly during the landfall of a typhoon compared to their values before and after, indicating that the typhoon requires a higher enthalpy flux for support during this phase.
The increased EF prompted higher evaporation, which in turn resulted in increased MF and MFC values. Increased atmospheric moisture contributed to higher rainfall from the typhoon over Vietnam between 6 September and 7 September (Figure 6). Higher MF and MFC over land, along with topographic effects, resulted in continued rainfall over Vietnam until 9 September.
Supplementary Materials
The following supporting information can be downloaded at: https://www.mdpi.com/article/10.3390/atmos16080930/s1, Figure S1: Mousture flux variation during Typhoon Yagi period; Figure S2: Variation of Instantaneous wind gust of the typhoon Yagi during 3 to 7 September 2024.
Author Contributions
Conceptualization, V.S.M. and G.S.; Methodology, G.S.; Validation, C.W. and G.S.; Formal analysis, V.S.M., B.C. and G.S.; Investigation, B.C.; Resources, G.S.; Data curation, V.S.M. and G.S.; Writing—original draft, V.S.M., C.W. and G.S.; Writing—review & editing, V.S.M. and G.S.; Visualization, V.S.M. and B.C.; Supervision, V.S.M.; Funding acquisition, G.S. All authors have read and agreed to the published version of the manuscript.
Funding
National Key R&D Program of China (2024YFC3013200).
Institutional Review Board Statement
Not applicable.
Informed Consent Statement
Not applicable.
Data Availability Statement
Data are contained within the article.
Acknowledgments
We would like to acknowledge the JTWC, OISST, ERA5 and GPCP data for providing the data online.
Conflicts of Interest
The authors declare no conflicts of interest.
References
- Ahrens, C.D.; Henson, R. Meteorology Today: An Introduction to Weather, Climate, and the Environment; Cengage Learning: Toronto, ON, Canada, 2015; pp. 439–446. [Google Scholar]
- Hun, K.S.; Ju, M.I.; Shin, C.P. An increase in global trends of tropical cyclone translation speed since 1982 and its physical causes. Environ. Res. Lett. 2020, 15, 094084. [Google Scholar] [CrossRef]
- Guan, S.; Zhao, W.; Sun, L.; Zhou, C.; Liu, Z.; Hong, X.; Zhang, Y.; Tian, J.; Hou, Y. Tropical cyclone-induced sea surface cooling over the Yellow Sea and Bohai Sea in the 2019 Pacific typhoon season. J. Mar. Syst. 2021, 217, 103509. [Google Scholar] [CrossRef]
- Shay, L.K.; Goni, G.J.; Black, P.G. Role of a warm ocean feature on Hurricane Opal. Mon. Weather Rev. 2000, 128, 1366–1383. [Google Scholar] [CrossRef]
- Wu, C.-C.; Lee, C.-Y.; Lin, I.-I. The effect of the ocean eddy on tropical cyclone intensity. J. Atmos. Sci. 2007, 64, 3562–3578. [Google Scholar] [CrossRef]
- Lin, I.I.; Wu, C.C.; Pun, I.F.; Ko, D.S. Upper-ocean thermal structure and the western North Pacific category-5 typhoons. Part I: Ocean features and category-5 typhoon’s intensification. Mon. Weather Rev. 2008, 136, 3288–3306. [Google Scholar] [CrossRef]
- Lin, I.-I.; Pun, I.-F.; Wu, C.-C. Upper-ocean thermal structure and the western North Pacific category 5 typhoons. Part II: Dependence on translation speed. Mon. Weather. Rev. 2009, 137, 3744–3757. [Google Scholar] [CrossRef]
- Vincent, E.M.; Emanuel, K.A.; Lengaigne, M.; Vialard, J.; Madec, G. Influence of upper ocean stratification interannual variability on tropical cyclone. J. Adv. Model. Earth Syst. 2014, 6, 680–699. [Google Scholar] [CrossRef]
- Mei, W.; Lien, C.-C.; Lin, I.-I.; Xie, S.-P. Tropical cyclone–induced ocean response: A comparative study of the south China sea and Tropical Northwest Pacific. J. Clim. 2015, 28, 5952–5968. [Google Scholar] [CrossRef]
- Price, J.F.; Morzel, J.; Niiler, P.P. Warming of SST in the cool wake of a moving hurricane. J. Geophys. Res. Oceans 2008, 113, C07010. [Google Scholar] [CrossRef]
- Fisher, E.L. Hurricanes and the sea-surface temperature field. J. Atmos. Sci. 1958, 15, 328–333. [Google Scholar] [CrossRef]
- Leipper, D. Observed ocean conditions and Hurricane Hilda, 1964. J. Atmos. Sci. 1967, 24, 182–196. [Google Scholar] [CrossRef]
- Price, J.F. Upper ocean response to a hurricane. J. Phys. Oceanogr. 1981, 11, 153–175. [Google Scholar] [CrossRef]
- Greatbatch, R.J. On the role played by upwelling of water in lowering sea surface temperatures during the passage of a storm. J. Geophys. Res. Oceans 1985, 90, 11751–11755. [Google Scholar] [CrossRef]
- Stramma, L.; Cornillon, P.; Weller, R.A.; Price, J.F.; Briscoe, M.G. Large diurnal sea surface temperature variability: Satellite and in situ measurements. J. Phys. Oceanogr. 1986, 16, 827–837. [Google Scholar] [CrossRef]
- Shay, L.K.; Black, P.G.; Mariano, A.J.; Hawkins, J.D.; Elsberry, R.L. Upper ocean response to Hurricane Gilbert. J. Geophys. Res. Oceans 1992, 97, 20227–20248. [Google Scholar] [CrossRef]
- Suetsugu, M.; Kawamura, H.; Nishihama, S. Sea surface cooling caused by typhoons in the western North Pacific Ocean. PORSEC Proc. Goa 2000, 1, 258–262. [Google Scholar]
- Bender, M.A.; Ginis, I. Real-case simulations of hurricane-ocean interaction using a high-resolution coupled model: Effects on hurricane intensity. Mon. Weather Rev. 2000, 128, 917–946. [Google Scholar] [CrossRef]
- Sadhuram, Y. Record decrease of sea surface temperature following the passage of a super cyclone over the Bay of Bengal. Curr. Sci. 2004, 86, 383–384. [Google Scholar]
- Ren, X.; Perrie, W.; Long, Z.; Gyakum, J. Atmosphere-ocean coupled dynamics of cyclones in the midlatitudes. Mon. Weather Rev. 2004, 132, 2432–2451. [Google Scholar] [CrossRef]
- Miller, B.I. On the maximum intensity of hurricanes. J. Meteorol. 1958, 15, 184–195. [Google Scholar] [CrossRef]
- Malkus, J.S.; Riehl, H. On the dynamics and energy transformation in steady-state hurricanes. Tellus 1960, 12, 1–20. [Google Scholar] [CrossRef]
- Sutyrin, G.G.; Khain, A.P. Effect of the ocean-atmosphere interaction on the intensity of a moving tropical cyclone. Atmos. Ocean Phys. 1984, 20, 787–794. [Google Scholar]
- Khain, A.P.; Ginis, I.D. The mutual response of a moving tropical cyclone and the ocean. Beitr. Phys. Atmos. 1991, 64, 125–142. [Google Scholar]
- Falkovich, A.I.; Khain, A.P.; Ginis, I. The influence of air-sea interaction on the development and motion of a tropical cyclone: Numerical experiments with a triply nested model. Meteorol. Atmos. Phys. 1995, 55, 167–184. [Google Scholar] [CrossRef]
- Cione, J.J.; Uhlhorn, E.W. Sea surface temperature variability in hurricanes: Implications with respect to intensity change. Mon. Weather. Rev. 2003, 131, 1783–1796. [Google Scholar] [CrossRef]
- Chan, J.C.L.; Duan, Y.; Shay, L.K. Tropical cyclone intensity change from a simple ocean–atmosphere coupled model. J. Atmos. Sci. 2001, 58, 154–172. [Google Scholar] [CrossRef]
- Deng, Z.; Villarini, G.; Wang, Z. Climate change dominates over urbanization in tropical cyclone rainfall patterns. Commun. Earth Environ. 2025, 6, 54. [Google Scholar] [CrossRef]
- Feng, Z.; Liao, C.; Zeng, J. Comparative analysis of heavy rainfall area between landfalling typhoon lupit (2109) and Typhoon lisa (9610). Trop. Cyclone Res. Rev. 2024, 13, 175–186. [Google Scholar] [CrossRef]
- Gao, S.; Zhai, S.; Li, T.; Chen, Z. On the asymmetric distribution of shear-relative typhoon rainfall. Meteorol. Atmos. Phys. 2018, 130, 11–22. [Google Scholar] [CrossRef]
- Yang, M.-J.; Braun, S.A.; Chen, D.-S. Water budget of Typhoon Nari (2001). Mon. Weather Rev. 2010, 139, 3809–3828. [Google Scholar] [CrossRef]
- Suthinkumar, P.; Varikoden, H.; Babu, C. Changes in extreme rainfall events in the recent decades and their linkage with atmospheric moisture transport. Glob. Planet. Change 2023, 221, 104047. [Google Scholar] [CrossRef]
- Feng, X.; Shu, S. How do weak tropical cyclones produce heavy rainfall when making landfall over China. J. Geophys. Res. Atmos. 2018, 123, 11830–11848. [Google Scholar] [CrossRef]
- Jiang, H.; Halverson, J.B.; Zipser, E.J. Influence of environmental moisture on TRMM-derived tropical cyclone precipitation over land and ocean. Geophys. Res. Lett. 2008, 35, L17806. [Google Scholar] [CrossRef]
- Li, W.-P. Moisture flux and water balance over the South China Sea during Late Boreal spring and summer. Theor. Appl. Clim. 1999, 64, 179–187. [Google Scholar] [CrossRef]
- Sun, B.; Wang, H.; Zhou, B. Interdecadal Variation of the Relationship between East Asian Water Vapor Transport and Tropical Pacific Sea Surface Temperatures during January and Associated Mechanisms. J. Clim. 2019, 32, 7575–7594. [Google Scholar] [CrossRef]
- Kim, J.; Ho, C.; Lee, M.; Jeong, J.; Chen, D. Large Increase in Heavy Rainfall Associated with Tropical Cyclone Landfalls in Korea After the Late 1970s. Geophys. Res. Lett. 2006, 33, L18706. [Google Scholar] [CrossRef]
- Lau, K.; Wu, H. Have Tropical Cyclones Been Feeding More Extreme Rainfall? J. Geophys. Res. Atmos. 2008, 113, D23113. [Google Scholar] [CrossRef]
- Lau, W.K.M.; Zhou, Y.P. Observed Recent Trends in Tropical Cyclone Rainfall over the North Atlantic and the North Pacific. J. Geophys. Res. Atmos. 2012, 117, D03104. [Google Scholar] [CrossRef]
- Knutson, T.R.; McBride, J.L.; Chan, J.; Emanuel, K.; Holland, G.; Landsea, C.; Held, I.; Kossin, J.P.; Srivastava, A.K.; Sugi, M. Tropical Cyclones and Climate Change. Nat. Geosci. 2010, 3, 157–163. [Google Scholar] [CrossRef]
- Hsu, H.-H.; Chou, C.; Wu, Y.C.; Lu, M.M.; Chen, T.; Chen, Y.M. Science Report of Climate Change in Taiwan 2011; National Science Council: Taipei, Taiwan, 2011; 362p. (In Chinese) [Google Scholar]
- Chang, C.; Lei, Y.; Sui, C.; Lin, X.; Ren, F. Tropical Cyclone and Extreme Rainfall Trends in East Asian Summer Monsoon Since Mid-20th Century. Geophys. Res. Lett. 2012, 39, L18702. [Google Scholar] [CrossRef]
- Shapiro, L.J. Asymmetric Boundary Layer Flow Under a Translating Hurricane. J. Atmos. Sci. 1983, 40, 1984–1998. [Google Scholar] [CrossRef]
- Bender, M.A. The Effect of Relative Flow on the Asymmetric Structure in the Interior of Hurricanes. J. Atmos. Sci. 1997, 54, 703–724. [Google Scholar] [CrossRef]
- Frank, W.M.; Ritchie, E.A. Effects of Environmental Flow upon Tropical Cyclone Structure. Mon. Weather. Rev. 1999, 127, 2044–2061. [Google Scholar] [CrossRef]
- Lonfat, M.; Marks, F.D., Jr.; Chen, S.S. Precipitation Distribution in Tropical Cyclones Using the Tropical Rainfall Measuring Mission (TRMM) Microwave Imager: A Global Perspective. Mon. Weather. Rev. 2004, 132, 1645–1660. [Google Scholar] [CrossRef]
- Lin, Y.Y.; Liu, Y.Q.; Zhang, L.Q. An Analysis on the Impact of Severe Tropical Storm “Maria” on the Torrential Heavy Rain in Shaoguan. Guangdong Meteorol. 2001, 3, 5–7. [Google Scholar]
- Li, J.N.; Wang, A.Y.; Yang, Z.L.; Li, G.L.; He, X.J.; Peng, T.Y.; Gu, Z.M. Advancement in the Study of Typhoon Rainstorm. J. Trop. Meteorol. 2003, 19, 152–159. (In Chinese) [Google Scholar]
- Jacob, S.D.; Koblinsky, C.J. Effects of Precipitation on the Upper-Ocean Response to a Hurricane. Mon. Weather Rev. 2007, 135, 2207–2225. [Google Scholar] [CrossRef]
- Yokoyama, C.; Takayabu, Y.N. A Statistical Study on Rain Characteristics of Tropical Cyclones Using TRMM Satellite Data. Mon. Weather Rev. 2008, 136, 3848–3862. [Google Scholar] [CrossRef]
- Chen, S.S.; Knaff, J.A.; Marks, F.D., Jr. Effects of Vertical Wind Shear and Storm Motion on Tropical Cyclone Rainfall Asymmetries Deduced from TRMM. Mon. Weather. Rev. 2006, 134, 3190–3208. [Google Scholar] [CrossRef]
- Subrahmanyam, M.V. Impact of Typhoon on the North-West Pacific Sea Surface Temperature: A Case Study of Typhoon Kaemi (2006). Nat. Hazards 2015, 78, 569–582. [Google Scholar] [CrossRef]
- Chu, J.H.; Sampson, C.R.; Levine, A.S.; Fukada, E. The Joint Typhoon Warning Center Tropical Cyclone Best-Tracks, 1945–2000. Rep. NRL/MR/7540-02-16, Joint Typhoon Warning Center, Hawaii. 2002. Available online: https://www.usno.navy.mil/NOOC/nmfc-ph/RSS/jtwc/best_tracks/TC_bt_report.html (accessed on 22 April 2025).
- Kilpatrick, K.A.; Podestá, G.P.; Evans, R. Overview of the NOAA/NASA Advanced Very High Resolution Radiometer Pathfinder algorithm for sea surface temperature and associated matchup database. J. Geophys. Res. Space Phys. 2001, 106, 9179–9197. [Google Scholar] [CrossRef]
- Huang, B.; Liu, C.; Banzon, V.; Freeman, E.; Graham, G.; Hankins, B.; Smith, T.; Zhang, H.-M. Improvements of the Daily Optimum Interpolation Sea Surface Temperature (DOISST) Version 2.1. J. Clim. 2021, 34, 2923–2939. [Google Scholar] [CrossRef]
- Banzon, V.; Smith, T.M.; Chin, T.M.; Liu, C.; Hankins, W. A long-term record of blended satellite and in situ sea-surface temperature for climate monitoring, modeling and environmental studies. Earth Syst. Sci. Data 2016, 8, 165–176. [Google Scholar] [CrossRef]
- Reynolds, R.W.; Smith, T.M.; Liu, C.; Chelton, D.B.; Casey, K.S.; Schlax, M.G. Daily high-resolution-blended analyses for sea surface temperature. J. Clim. 2007, 20, 5473–5496. [Google Scholar] [CrossRef]
- Hersbach, H.; Bell, B.; Berrisford, P.; Hirahara, S.; Horányi, A.; Muñoz-Sabater, J.; Nicolas, J.; Peubey, C.; Radu, R.; Schepers, D. The ERA5 global reanalysis. Q. J. R. Meteorol. Soc. 2020, 146, 1999–2049. [Google Scholar] [CrossRef]
- Huffman, G.J.; Adler, R.F.; Morrissey, M.M.; Bolvin, D.T.; Curtis, S.; Joyce, R.; McGavock, B.; Susskind, J. Global Precipitation at One-Degree Daily Resolution from Multi-Satellite Observations. J. Hydrometeorol. 2001, 2, 36–50. [Google Scholar] [CrossRef]
- Talley, L.D.; Pickard, G.L.; Emert, W.J.; Swift, J.H. Descriptive Physical Oceanography: An Introduction, 6th ed.; Elsevier: London, UK, 2011; pp. 69–145; 194–200. [Google Scholar]
- Wen, B. Physical quantity calculation and its application in rainstorm analysis and forecast—Water vapor flux and water vapor flux divergence. Meteorol. Mon. 1980, 6, 36–38. (In Chinese) [Google Scholar]
- Alvey, G.R., III; Zawislak, J.; Zipser, E. Precipitation properties observed during tropical cyclone intensity change. Mon. Weather Rev. 2015, 143, 4476–4492. [Google Scholar] [CrossRef]
- Zagrodnik, J.P.; Jiang, H. Rainfall, convection, and latent heating distributions in rapidly intensifying tropical cyclones. J. Atmos. Sci. 2014, 71, 2789–2809. [Google Scholar] [CrossRef]
- Wadler, J.B.; Rudzin, J.E.; de la Cruz, B.J.; Chen, J.; Fischer, M.; Chen, G.; Qin, N.; Tang, B.; Li, Q. A review of recent research progress on the effect of external influences on tropical cyclone intensity change. Trop. Cyclone Res. Rev. 2023, 12, 200–215. [Google Scholar] [CrossRef]
- Li, L.; Chakraborty, P. Slower decay of landfalling hurricanes in a warming world. Nature 2020, 587, 230–234. [Google Scholar] [CrossRef] [PubMed]
- Emanuel, K.A. An air-sea interaction theory for tropical cyclones. Part I: Steady-state maintenance. J. Atmos. Sci. 1986, 43, 585–605. [Google Scholar] [CrossRef]
- Gao, S.; Zhai, S.; Chiu, L.S.; Xia, D. Satellite air–sea enthalpy flux and intensity change of tropical cyclones over the western north pacific. J. Appl. Meteorol. Clim. 2015, 55, 425–444. [Google Scholar] [CrossRef]
- Chen, J.; Huang, R. The comparison of climatological characteristics among Asian and Australian monsoon subsystems. Part II: Water vapor transport by summer monsoon. Chin. J. Atmos. Sci. 2007, 31, 766–778. (In Chinese) [Google Scholar]
- Jaimes, B.; Shay, L.K.; Uhlhorn, E.W. Enthalpy and Momentum Fluxes during Hurricane Earl Relative to Underlying Ocean Features. Mon. Weather Rev. 2015, 143, 111–131. [Google Scholar] [CrossRef]
- Guo, T.; Sun, Y.; Liu, L.; Zhong, Z. The impact of storm-induced SST cooling on storm size and destructiveness: Results from atmosphere-ocean coupled simulations. J. Meteorol. Res. 2020, 34, 1068–1081. [Google Scholar] [CrossRef]
- Hill, K.A.; Lackmann, G.M. Influence of Environmental Humidity on Tropical Cyclone Size. Mon. Weather Rev. 2009, 137, 3294–3315. [Google Scholar] [CrossRef]
- Li Li, Y.; Chen, L.S.; Qian, C.H.; Yang, J.K. A study of the formation and development of a mesoscale convergence line within Typhoon Rananim (0414). Acta Meteorol. Sin. 2010, 68, 640–651. (In Chinese) [Google Scholar] [CrossRef]
- Jin, Z.; Yu, J.; Dai, K. Topographic Elevation’s Impact on Local Climate and Extreme Rainfall: A Case Study of Zhengzhou, Henan. Atmosphere 2024, 15, 234. [Google Scholar] [CrossRef]

Disclaimer/Publisher’s Note: The statements, opinions and data contained in all publications are solely those of the individual author(s) and contributor(s) and not of MDPI and/or the editor(s). MDPI and/or the editor(s) disclaim responsibility for any injury to people or property resulting from any ideas, methods, instructions or products referred to in the content. |
© 2025 by the authors. Licensee MDPI, Basel, Switzerland. This article is an open access article distributed under the terms and conditions of the Creative Commons Attribution (CC BY) license (https://creativecommons.org/licenses/by/4.0/).