Article

Exploring the Role of Energy Consumption Structure and Digital Transformation in Urban Logistics Carbon Emission Efficiency

Business School, Nanjing Xiaozhuang University, No. 3601 Hongjing Avenue, Jiangning District, Nanjing 211171, China
*
Author to whom correspondence should be addressed.
Atmosphere 2025, 16(8), 929; https://doi.org/10.3390/atmos16080929 (registering DOI)
Submission received: 7 May 2025 / Revised: 25 July 2025 / Accepted: 28 July 2025 / Published: 31 July 2025
(This article belongs to the Special Issue Urban Carbon Emissions (2nd Edition))

Abstract

As the climate problem is getting more and more serious and the “low-carbon revolution” of globalization is emerging, the logistics industry, as a high-end service industry, must also take the road of low-carbon development. Improving logistics carbon emission efficiency (LCEE) is gradually becoming an inevitable choice to maintain sustainable social development. The study uses the Super-SBM (Super-Slack-Based Measure) model to evaluate the urban LCEE from 2013 to 2022, explores the contribution of efficiency changes and technological progress to LCEE through the decomposition of the GML (Global Malmquist–Luenberger) index, and reveals the influence of digital transformation and energy consumption structure on LCEE by using the Spatial Durbin Model, concluding as follows: (1) LCEE declines from east to west, with large regional differences. (2) LCEE has steadily increased over the past decade, with slower growth from east to west. It fell in 2020 due to COVID-19 but has since recovered. (3) LCEE shows a catching-up effect among the three major regions, with technological progress being a key driver of improvement. (4) LCEE has significant spatial dependence. Energy consumption structure has a short-term negative spillover effect, while digital transformation has a positive spillover effect.

1. Introduction

With the development of the logistics industry, the fundamental, strategic, and pioneering role of LCEE in the national economy has become increasingly prominent. However, the high input and consumption of the logistics industry, as well as the unbalanced development among regions, have not only constrained the construction of a modernized economic system, but also had a significant impact on the environment. Carbon emission reduction in the logistics industry has attracted much attention [1]. Since 2006, when the logistics industry was first included in the five-year plan, its industrial status has been formally established [2]. In 2021, China proposed accelerating the development of green logistics, integrating transportation resources, and further promoting low-carbon transformation [3]; it has become a key task to improve LCEE for achieving low-carbon development [4]. Because of economic development, resource endowment and the policy environment of each region in China differ greatly, and how to effectively improve LCEE and promote regional balanced development has become an urgent problem [5].
Under the background of the global “low-carbon revolution”, the logistics industry, as a service industry with high energy consumption and high emissions, has become an important indicator for measuring the effectiveness of green transformation in terms of its LCEE [6]. This paper selects digital transformation and energy structure as the two core explanatory variables of LCEE, mainly based on the following considerations: on the one hand, digital transformation has become an important driving force to improve LCEE by promoting the online, data, and intelligence of logistics elements, optimizing transportation paths, improving scheduling efficiency, and promoting resource sharing and coordination, thus effectively reducing the carbon emission intensity of the unit logistics activities. On the other hand, the energy structure, as a direct source of carbon emissions from logistics activities, and its degree of cleanliness directly affect the level of carbon emissions, optimizing the energy structure and increasing the proportion of clean energy use are the key paths to achieve low-carbon logistics. Both act on LCEE from technology and energy dimensions, respectively, with significant mechanism differences and synergy potential. Therefore, systematically exploring the influence mechanism of digital transformation and energy structure on LCEE and its spatial spillover effect not only helps to reveal the internal logic of logistics carbon emission efficiency improvement, but also provides theoretical support and policy basis for realizing the regional synergistic emission reduction and “double carbon” goal.
Digital transformation in the application of modern information technology has significantly improved the efficiency of logistics resource allocation by bringing logistics elements online and data, thus positively affecting LCEE [7]. Intensive logistics modes such as co-built fleets, shared warehousing and common distribution reduce energy consumption and carbon emissions through intelligent scheduling and optimized transportation paths [8]. In addition, the construction and application of intelligent logistics platform not only realizes real-time sharing and collaboration of logistics information, but also optimizes transportation efficiency through data analysis, further reducing carbon emission intensity [9,10]. Digital transformation has become an important driving force on green logistics industry. Exploring the relationship between digital transformation and LCEE not only helps to reveal the underlying mechanism, but also provides a theoretical basis for policymaking and technological innovation, helping to realize the “double carbon” goal [11,12,13].
Energy structure has a significant impact on LCEE by optimizing the type and proportion of energy use. Replacing traditional fossil fuels with clean energy (e.g., electricity, hydrogen) can reduce logistics transportation carbon emission [14,15,16]. In addition, the optimization of energy structure also promotes the energy-saving renovation of logistics equipment, thus further enhancing the overall energy efficiency. Differences in regional energy structure lead to significant changes in LCEE, and the higher the proportion of clean energy, the greater the improvement in carbon emission efficiency. The study of the relationship between energy structure and LCEE not only helps to enhance the endogenous momentum of low-carbon logistics development but also provides scientific support for the development of energy transition policies and promotes LCEE [17,18].
This study focuses on how digital transformation and energy structure affect logistics carbon emission efficiency (LCEE) in a non-linear spatial spillover and regionally heterogeneous way through green technology innovation, supply chain synergy and other intermediary mechanisms, and makes use of the “micro-middle-macro” integrated data and Spatial Durbin Model to make up for the lack of existing studies in terms of the mechanism of action, data precision and policy relevance. With the help of “micro-middle-macro” integrated data and Spatial Durbin Modeling, we will make up for the shortcomings of the existing studies in terms of mechanism, data precision, and policy relevance. The study explores how digital transformation and energy structure affect the LCEE. First, the Super-SBM model is used to measure region LCEE and the GML index decomposition is used to explore the degree of contribution and dynamic changes in technological progress and efficiency changes to LCEE; then the SDM (spatial Durbin model) is used to reveal the impact of digital transformation and energy structure on LCEE in different regions. Therefore, the study of LCEE has important practical significance and far-reaching strategic value.

2. Literature Review

2.1. Connotation and Measurement of LCEE

LCEE is a key indicator to measure the carbon emission intensity of the logistics industry in the process of realizing economic output, and its core lies in the assessment of the economic benefits realized under the unit of carbon emission, reflecting the effectiveness of resource utilization and environmental friendliness. Its connotation not only includes the control of total carbon emissions, but also emphasizes the ability to achieve low-carbon development by means of optimizing resource allocation and technological innovation in logistics activities [19]. In terms of measurement standards, commonly used methods include the SBM model and Super-SBM model, which consider multi-dimensional factors such as energy consumption, capital stock, labor input, and carbon emissions, and can more comprehensively and accurately measure LCEE. Akram et al. [20] suggest that the logistics industry not only contributes significantly to the Asian economy, but also contributes to ecological and social development. Overall, the measurement standard of LCEE is gradually developing in the direction of multi-dimensionality and comprehensiveness [21], which provides a scientific basis for the green transformation of the logistics industry.

2.2. Research on the Spatial and Temporal Evolution of LCEE

The spatial and temporal evolution of LCEE reveals the dynamic change characteristics of the efficiency and its spatial distribution law among regions [22]. Research shows that China’s LCEE as a whole presents a significant spatial pattern of “east high, west low” [23]. There was the development of inter-regional imbalance, with the efficiency of the eastern region improving faster, while the southwestern and northeastern regions improved relatively slow [24]. Yao et al. [24] pointed out that the application of GIS (Geographic Information System) technology and exploratory spatio-temporal data analysis methods further indicate that the spatial agglomeration effect of LCEE gradually weakened, but its spatial and temporal migrations have a path dependence, and the changes in local spatial structure are significant. In addition, the technological progress of logistics carbon emission contributes more to the efficiency improvement, especially in the eastern and central regions, which pushes the dynamic growth of efficiency [25,26,27,28]. Overall, many studies have provided an important basis for inter-regional synergistic development and policy formulation, but none of them have exceeded the traditional scope of measurement and connotation of the study, and new studies should focus on exploring the spatial and temporal differences.

2.3. Research on the Influencing Factors of LCEE

The research on the influencing factors of LCEE reveals the complex mechanism of multiple driving factors on efficiency. Economic development is the core factor driving the improvement of LCEE, playing a particularly significant role [29]. In addition, energy efficiency plays an important role in curbing carbon emissions. The study also found that technological progress and logistics agglomeration level can affect LCEE, but the degree of impact varies significantly between different regions [30].
Currently, how digital transformation affects LCEE has become a research hotspot. Digital transformation improves LCEE through the paths of technological empowerment, management optimization and industrial synergy [31]. Digital technologies have optimized logistics resource allocation and operational processes, reducing energy consumption and carbon emissions [32]. At the management level, digitalization has promoted logistics enterprises to achieve refined management, reducing unnecessary energy consumption [33]. And at the industrial level, digitalization has facilitated the integration of the logistics industry with other industries, formed a green logistics ecosystem, and improved the overall carbon emission efficiency [34].
The impact of energy structure on LCEE has become an important direction in the study of green transformation of logistics industry. The wide application of traditional high-carbon energy in logistics transportation has led to a high carbon emission factor in the logistics industry and a large contribution to carbon emissions [35]. With the gradual optimization of the energy structure, the carbon emission intensity and energy intensity of the logistics industry have decreased, and the adjustment of the energy structure has gradually played a positive role in improving LCEE [36,37]. Li et al. [26] also found that the differences in energy structure in different regions also lead to significant regional heterogeneity in LCEE, with the relatively optimized energy structure in the eastern region, which has a higher LCEE, while the central and western regions are relatively lagging behind [37]. Therefore, optimizing the energy structure and increasing the application proportion of clean energy in the logistics industry is an effective way to enhance the LCEE and realize the green and low-carbon development of the logistics industry.
Through literature combing, it can be found that domestic research on LCEE is still in the exploratory stage, and the direction of the conclusion is not clear. The current research mainly focuses on qualitative analysis, and lacks in-depth exploration of the intrinsic mechanism and influence relationship between digital transformation, energy structure and LCEE. For this reason, this paper will creatively and systematically verify the spatial interaction effect of digital transformation and energy structure. It is of great significance to study the connotation of LCEE, its measurement standard and its influencing factors, to realize the green transformation.

2.4. Research Questions, Ideas, and Implications
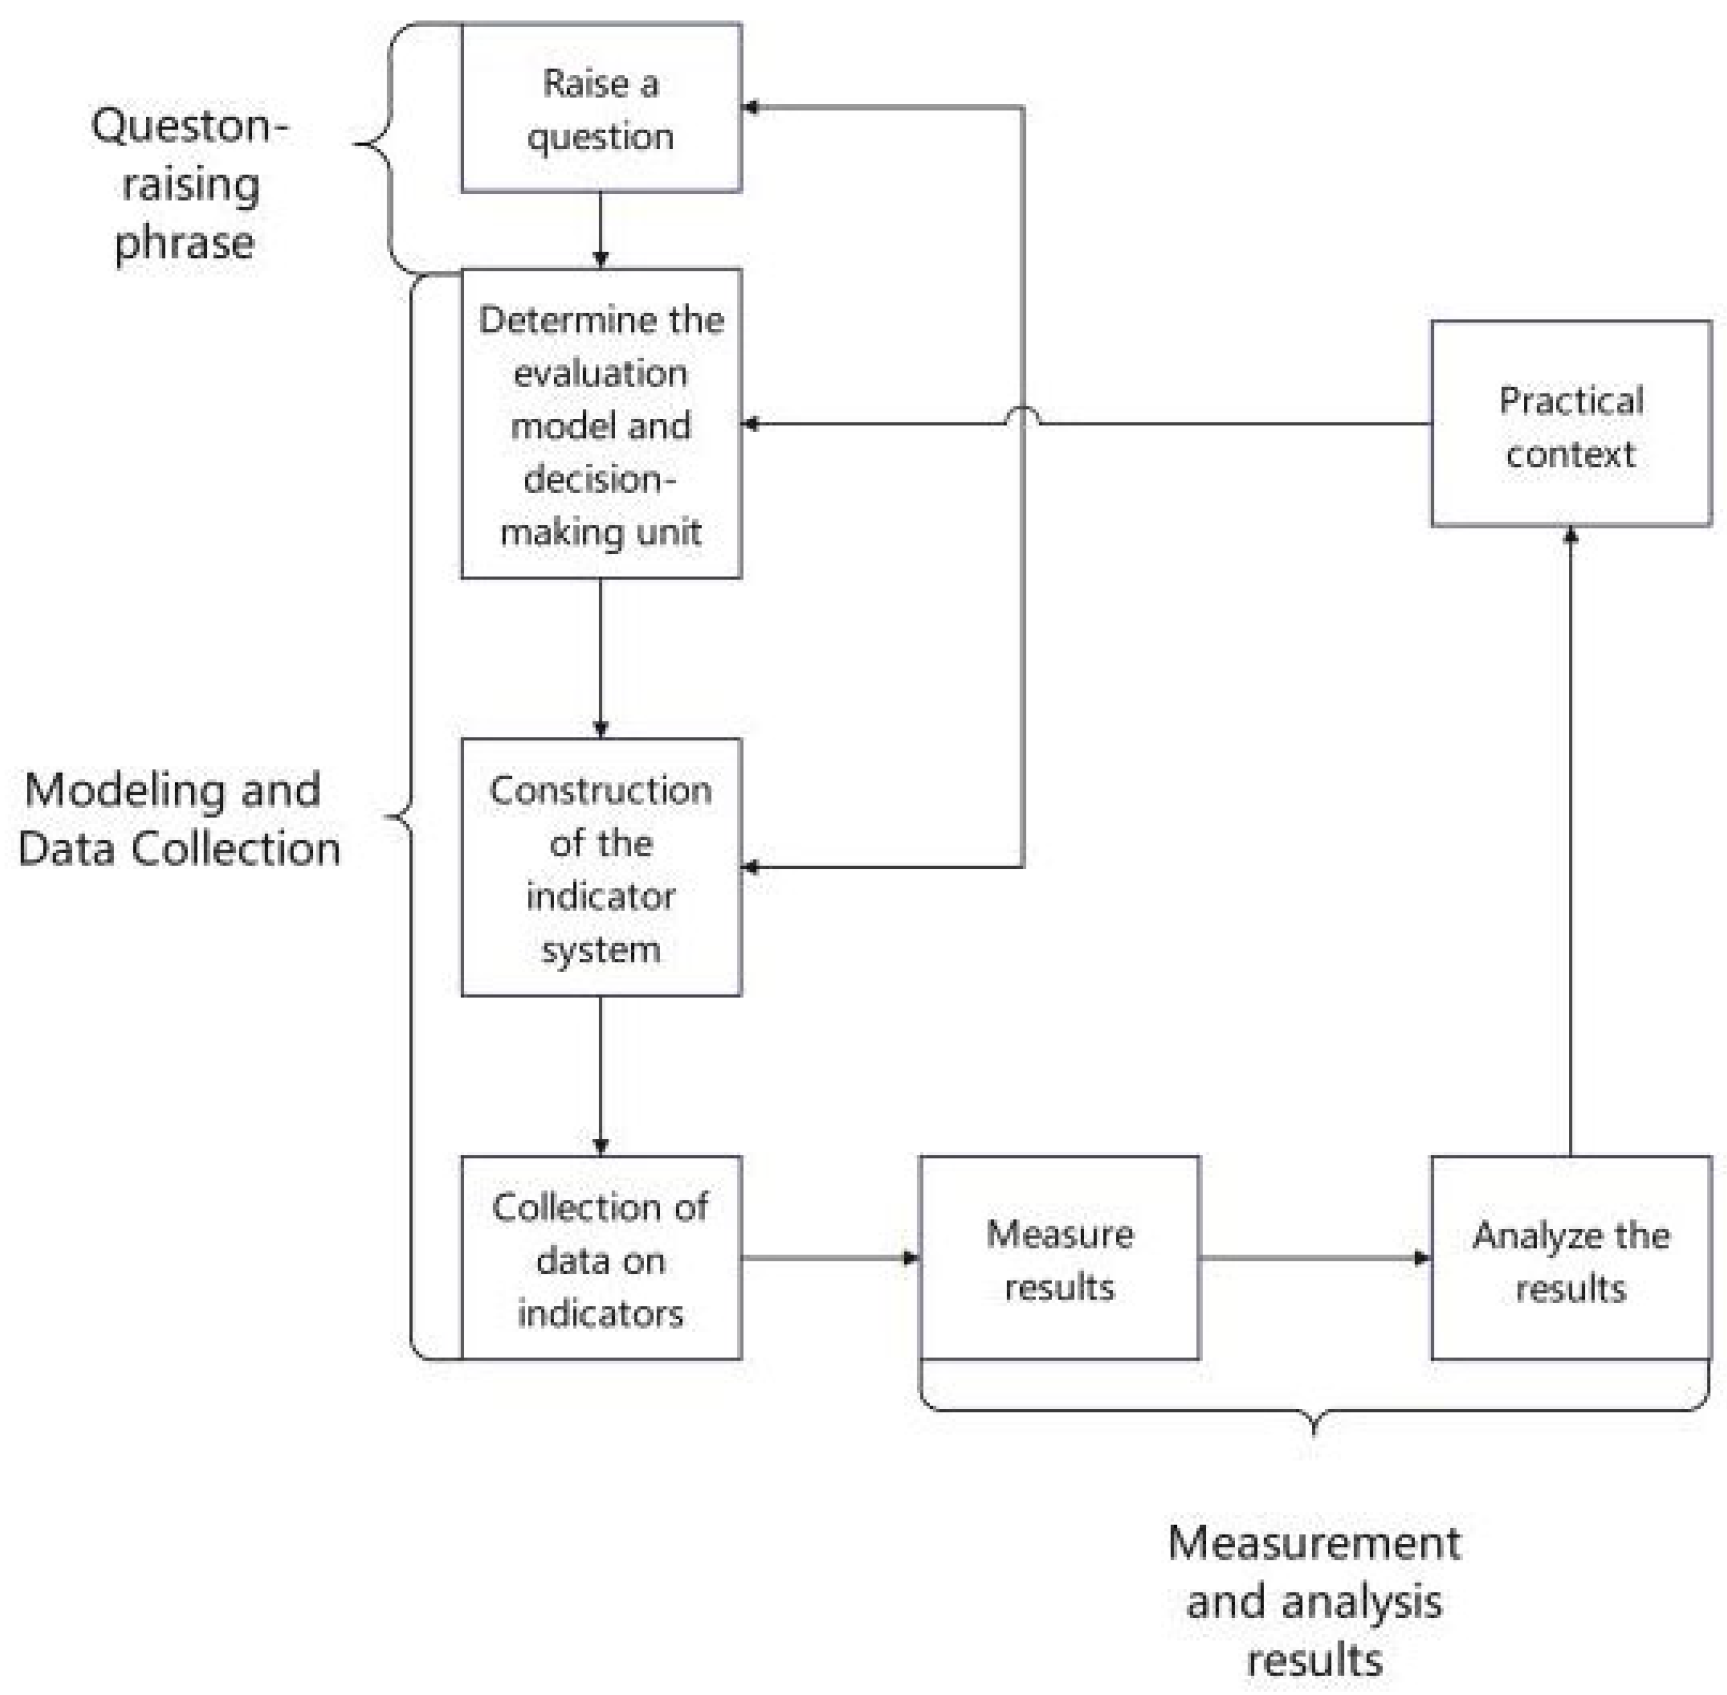
The purpose of this study is to investigate the mechanism and extent of the effect of digital transformation and energy structure on LCEE. In this paper, firstly, the Super-SBM model is utilized to measure the regional LCEE. It employs the GML index decomposition to explore the extent and dynamics of the contribution of technological progress and efficiency changes to LCEE. Then, the SDM is used to reveal the impact of digital transformation and energy structure on LCEE in different regions. Finally, the study concludes and provides empirical recommendations for the government and society based on this. Current research results indicate that digitalization has a positive “ripple effect” on carbon emission reduction in upstream and downstream enterprises through green technology innovation, supply chain synergy, and knowledge spillover [38]. Replacing traditional fossil energy sources with clean energy sources such as electricity and hydrogen can significantly reduce the carbon emission factor and energy intensity of the logistics industry, and thus improve LCEE, while the mainstream research methodology adopts DEA and its extended model to measure LCEE, and combines with spatial econometrics or system dynamics model to explore the influencing factors. Existing studies have multiple shortcomings in exploring the impact of digital transformation and energy structure on LCEE. Most of the studies focus on the macro-provincial or single enterprise level and lack multi-level linkage analysis. They pay insufficient attention to the interaction effects and non-linear relationship between the two. Mechanism studies are not in-depth enough and lack systematic justification of intermediary channels such as green technology innovation and supply chain synergy. There are deficiencies in data and measurement methods, with scarce data on corporate carbon emissions and a single energy structure indicator, making it difficult to accurately reflect clean energy development. In addition, the insufficient discussion of policy and regional heterogeneity also leads to the lack of precision of policy recommendations. In order to make up for the shortcomings, this paper improves the accuracy of carbon emission measurement by constructing an integrated data system of “micro-medium-macro” and integrating data from multiple sources. Secondly, this paper introduces regression analysis and Spatial Durbin Model to identify non-linear effects and spatial spillover boundaries, and systematically deconstructs the synergistic mechanism. Finally, it analyzes the heterogeneity of subregional studies to improve the scientific and practicality of policy recommendations.

3. Methodology

This paper collects data of relevant variables in the index system to measure the national green logistics efficiency from 2013 to 2022 through the Super-SBM model and analyzes its spatio-temporal evolution law, uses GML index decomposition to explore the degree of contribution of technological progress and efficiency change to LCEE and derives its kernel density analysis. The GML index decomposition is used to explore the degree of contribution of technological progress and efficiency changes to LCEE and derive its spatial and temporal evolution patterns through kernel density analysis. Through various tests, the SDM is used to reveal the impact of energy structure and digital transformation on LCEE in different regions. Based on the above conclusions, countermeasures and suggestions to improve LCEE with respect to the two major elements of energy structure and digital transformation are finally proposed. The research idea is shown in Figure 1.

3.1. Measurement Methods of LCEE

3.1.1. Super-SBM Model

Among the commonly used evaluation methods of LCEE, the DEA (Difference Exponential Average) model is widely used [39]. DEA can deal with multiple inputs and outputs at the same time in the total factor efficiency analysis, does not need to set the function or parameter weights in advance, and avoids the defects of subjectivity and information compression [40,41,42]. Meanwhile, DEA has a set of mature measurement process, the specific content is shown in Figure 2.
To avoid the problem of multiple decision-making units with efficiency values of 1, which is not conducive to comparative analysis, this paper chooses the Super-SBM model that considers non-desired outputs, and extends the SBM model to estimate efficiency in a non-linear way by considering the changes in production technology in each year of the study period [40,41,42].
The Super-SBM model is frequently employed to assess the efficiency of a DMU (Decision-making Unit) ( x 0 , y 0 , b 0 ) with m inputs, n 1 desired outputs, and n 2 undesired outputs:
min ρ = 1 + i = 1 m s i m x i 0 1 1 n 1 + n 2 r = 1 n 1 s r + y r 0 + t = 1 n 1 s r b b t 0
s . t . j = 1 n x j λ j s x 0 i = 1 , 2 , , m r = 1 n x r λ r s + y 0 r = 1 , 2 , , n 1 t = 1 n x t λ t s b x 0 t = 1 , 2 , , n 2 1 1 n 1 + n 2 r = 1 n 1 s r + y r 0 + t = 1 n 1 s r b b t 0 > 0   λ j , s i , s r + , s t b 0 j = 1 , 2 , , q ,   j j 0
In Equations (1) and (2), ρ is the efficiency value, λ is the weight vector, j is each DMU, q is the number of DMUs, and m , n 1 , and n 2 represent the inputs, desired outputs and non-desired outputs. s i , s r + , and s r b denote the relaxation variables of inputs, desired outputs, and non-desired outputs.
Input Indicators: This study incorporates capital, labor, and energy inputs into the indicator system. Capital input is measured by fixed asset investment in the logistics industry; labor input is represented by the number of employees in the logistics sector; and energy input is quantified by the total energy consumed in the logistics industry. In calculating the energy inputs, this study adopts the methodology of Chen et al. [43], where the nine most commonly used energy consumptions in the logistics industry are measured by converting the main energy consumed by the logistics industry in the transportation process to standard coal based on reference calorific value and discounted standard coal factor criteria, which comes from the database of the Ministry of Ecology and Environment of the People’s Republic of China, and summing up the standard coal values of the various energy consumptions to arrive at the final energy input index volume.
Desired output: Expressed in terms of value added of the logistics industry and social goods turnover.
Non-desired output: With reference to the data in the Guidelines for National Greenhouse Gas Emission Inventories, the total CO2 emissions from the logistics industry are converted according to the CO2 emission factors provided by Chen et al. and Cui et al. [43,44], which involve nine energy sources, namely coal, crude oil, gasoline, kerosene, diesel oil, fuel oil, liquefied petroleum gas supply, natural gas, and electricity, and the total amount of CO2 emitted from the logistics industry is converted to the total CO2 emissions. It is worth noting that although electricity is a secondary energy source that does not directly release carbon dioxide, given that there is a certain demand for electricity in the logistics industry, this leads to the indirect consumption of more non-renewable energy sources and thus damages the ecological environment. In order to ensure the accuracy of carbon emission assessment, this study calculates the corresponding carbon dioxide emissions based on the electricity consumption and electricity emission factors of each region. In the calculation process, we use the indicator of electricity emission factor released by the Ministry of Ecology and Environment of the People’s Republic of China in 2022, and multiply the electricity consumption of each region with the corresponding electricity emission factor to obtain the corresponding CO2 emission.
In this study, the primary indicators include capital input, labor input, energy input, desired output, and non-desired output, which are characterized by six secondary indicators to build a complete input–output system. For input indicators, the investment in fixed assets of the logistics industry as a representative of capital input quantifies the intensity of capital expenditure in the logistics industry; the number of employees in the logistics industry reflects the scale of labor resources in the industry, which corresponds to the labor input; the energy consumption of the logistics industry measures the energy input required for the operation of the industry, which constitutes the energy input. Rather than compressing them into a single metric, the Super-SBM model incorporates each input indicator separately; conceptually, however, their combination represents the overall input “budget” for producing logistics services. The model’s efficiency optimization assigns implicit weights to each input, effectively aggregating their contributions (analogous to a convolution of factors) in determining performance. For output indicators, the value-added of the logistics industry and the turnover of social freight transport together constitute the desired output, with the former reflecting the output of the industry’s economic value and the latter reflecting the output of physical transport services. Finally, the undesired outputs category is represented by Carbon Emissions of the Logistics Industry, the chief negative externality of logistics processes. Carbon emissions serve as a proxy for environmental burden (e.g., pollution and resource inefficiency) that should be minimized; including this indicator allows the Super-SBM to penalize units that achieve high outputs at the cost of greater emissions. Grouping our indicators in this way is grounded in production theory and sustainability logic: inputs (capital, labor, energy) are expended to generate desired outputs (economic value and freight service), unavoidably accompanied by some undesired outputs (emissions). The above secondary indicators are directly mapped to the primary indicators in terms of quantity or value, which are representative and comparable, and can effectively support the construction of the efficiency measurement model. This structured indicator system ensures that when the Super-SBM aggregates these factors in its computations, it captures the trade-offs between resource use, productive outcomes, and environmental impacts in a logically consistent manner.
The data for the six secondary indicators come from databases with official authority or mature calculation methods. The data used are publicly available and strictly limited to the field of logistics to ensure the accuracy and independence of the statistical data. Among them, the investment in fixed assets and value added of the logistics industry come from the transportation, warehousing, and postal sector in the China Statistical Yearbook or local statistical yearbooks, which have been naturally separated from the macroeconomy; the number of people employed is also based on the classification of the industry, so there is no need to separate them; energy consumption is measured by the standard coal equivalent, which is based on the data of the transportation industry in the China Energy Statistical Yearbook and the calorific value of different energy sources; the social freight turnover is calculated directly; the social freight turnover is calculated by the standard coal equivalent. Social freight turnover is directly derived from the Transportation Statistics Yearbook, covering all modes of transportation such as highway, railroad, water transport, aviation, and pipeline, including only freight data and explicitly excluding passenger transport; carbon emissions are measured based on the above energy consumption, combined with the carbon emission factors for various types of energy released by the Ministry of Ecology and Environment, to ensure that they cover the main sources of emissions in the logistics industry. Therefore, the indicators used in this study can logically and accurately represent the first-level dimension, and the data sources are clear and the sub-industries are clear, which meets the requirements for efficiency evaluation.
The indicator system is presented in Table 1.

3.1.2. GML Index Decomposition

The GML index model can be used to make comparisons of regional green logistics efficiencies across time and analyze the dynamic changes in regional logistics carbon emission efficiencies, and the basic form as follows [45]:
G M L t 1 , t = E g x t , y t E g x t 1 , y t 1
E C t 1 , t = E t x t , y t E t 1 x t 1 , y t 1
In Equations (3)–(5), G M L t 1 , t represents the GML index in period t . E g x t , y t and E t x t , y t are the efficiency values obtained in period t under the super-efficient SBM model that incorporates undesired outputs, using the global optimal point and the period t optimal point as references, respectively. E C t 1 , t and T C t 1 , t , respectively, represent the change in technical efficiency from period t 1 to period t and the technical change.

3.2. Analysis of Spatial and Temporal Evolution

In this study, time series analysis is typically used to model and predict the behavior of variables over time, identifying trends, cycles, and seasonal effects. However, time series analysis is primarily suited for understanding univariate data and may struggle with capturing the complexities of non-linear relationships or spatial heterogeneity in the case of multi-dimensional data.
Kernel density estimation, on the other hand, is a non-parametric statistical method that estimates the probability density function of a random variable, providing a smooth and continuous representation of the data distribution. Kernel density estimation is advantageous over time series analysis when dealing with complex, multi-dimensional datasets, as it allows for the analysis of spatial and temporal patterns without assuming a specific functional form for the underlying distribution. Additionally, Kernel density estimation can capture the variations in the density of data points across regions and time, making it ideal for spatial–temporal analysis.
The application of kernel density estimation to the analysis of the spatial–temporal evolution of LCEE is well-suited to this study due to its ability to address the challenges of non-linear relationships and regional disparities. The provinces in China exhibit different economic structures, energy consumption patterns, and carbon emission profiles, all of which influence their LCEE. By using Kernel density estimation, we can better capture the dynamic shifts in emission efficiency across both time and space, enabling a more nuanced understanding of the evolving trends and regional differences.
Kernel density maps provide a three-dimensional representation of the distribution of weight scores for a given sample during the examination period [46,47]. This allows for a more objective reflection of the dynamic evolution of LCEE, offering valuable insights into the development trends of key elements. To this end, this paper utilizes the Gaussian kernel function [46,47], in which the random variable X follows a Gaussian distribution with mean μ and variance σ, commonly known as the normal distribution. When μ = 0 and σ = 1, this represents the standard normal distribution, characterized by the Gaussian distribution probability density function of a normal random variable:
f x = 1 2 π σ e x p x μ 2 2 σ 2

3.3. Impact of Digital Transformation and Energy Mix on Logistics Carbon Efficiency Based on Spatial Measurement

3.3.1. Spatial Correlation Analysis

The spatial correlation of LCEE is evaluated through Moran index, which measures both the spatial correlation of LCEE and its temporal evolution across city clusters. In Equation (7), n is the total number of spatial units, x i and x j are the attribute values of the i-th and j-th spatial units, x is the average LCEE value across all provinces, and w i j is the spatial weight value. The Moran’s I ranges from −1 to 1. If Moran’s I greater than 0, it will indicate a positive spatial correlation of LCEE within the city cluster. If Moran’s I less than 0, it will signify a negative spatial correlation. When Moran’s I approaches 0, it suggests no spatial correlation [48].
Global spatial autocorrelation measures spatial dependence within an overall spatial context, and Moran’s I is a common measure of this autocorrelation. Using Moran’s scatterplot, we can classify regions into four categories: the first category is “high high”, i.e., both the region and its neighboring areas have high attribute levels with little spatial variation; the second category is “high low”, i.e., the region has high attribute levels but its neighboring areas have low attribute levels with high spatial variation; the third category is “low-low”, and the fourth category is “low-high”. By observing whether the “high-high” and “low-low” types are dominant, it can be judged whether a region has obvious spatial autocorrelation, i.e., whether there is a spatial aggregation phenomenon [48].
Local spatial autocorrelation, on the other hand, focuses on the similarity between individual spatial units and their neighbors, which reflects the consistency of the local unit with the overall trend, including the direction and strength of the trend, and reveals spatial heterogeneity, i.e., how spatial dependence varies according to location. Local Moran’s I [49] classifies patterns of spatial correlation into four types: positive spatial correlation includes “high-high correlation” (regions with above-average attribute values are surrounded by neighboring regions that are also above-average) and “low-low correlation”; negative spatial correlation includes negative spatial correlations include “high low correlations” and “low high correlations”.
I = n i = 1 n j = 1 n w i j x i x ¯ x j x ¯ i = 1 n j = 1 n w i j i = 1 n x i x ¯ 2
In this study, the spatial weight matrix is constructed based on the neighbor weight matrix. In Equation (8), the distance between region i and region j is denoted as d i j , and d represents the pre-determined distance threshold value. The spatial weights can be defined as follows:
w i j = 1     i f     d i j < d 0     i f     d i j d

3.3.2. Spatial Metrology Analysis Methods

When spatial dependence exists between variables, traditional statistical models may not be able to adequately address the problems posed by such dependence, which could result in biased research outcomes. In order to avoid this situation, researchers need to consider using spatial econometric models [50]. The aim of this study is to explore the “local neighborhood” effect of LCEE, where spatial dependence between variables is an important consideration in the analysis. Hence, this section aims to develop a suitable spatial econometric model.
Currently, spatial econometric models are the Spatial Lag Model (SLM), the Spatial Error Model (SEM), and the Spatial Durbin Model (SDM) [50]. The Spatial Lag Model (SLM) is typically preferred when the dependent variable exhibits spatial correlation [51,52].
The specific form of the Spatial Lag Model is
ln L C E E i t = ρ j = 1 N w i j L C E E i t + β i X i t + γ i + μ t + ε i t
In the model, ρ denotes the spatial lag coefficient; N refers to the number of spatial units; X i t represents the vector of explanatory variables, which constitute the explanatory variable matrix; β i is the estimated parameter for the explanatory variables; and γ i and μ t capture the spatial and temporal fixed effects, respectively.
When spatial dependence is present in the residuals, the Spatial Error Model (SEM) is used to account for this spatial correlation [51,52]. The mathematical formulation of this model is as follows:
ln L C E E i t = τ j = 1 N w i j φ i j + β i X i t + γ i + μ t + ε i t
In the spatial econometric model, φ i j represents the spatial autocorrelation error term, and τ indicates the spatial autocorrelation coefficient of the error term. The other variables maintain the same definitions as in Equation (9).
The Spatial Durbin Model (SDM) is suitable when spatial dependence is present in both the dependent and independent variables [51,52]. The SDM is
ln L C E E i t = ρ j = 1 N w i j L C E E i t + j = 1 N w i j x j t + β i X i t + γ i + μ t + ε i t
In this paper, to identify the most appropriate model to analyze the correlation and interaction of spatial data, a specific spatial econometric model will be selected based on tests such as the LM (Lagrange multiplier) test [53], Wald test [54], Hausman test [55], and LR (likelihood ratio) test [56].

3.3.3. Variable Selection and Model Construction

(1)
Explained Variables
Logistics carbon emission efficiency (LCEE): The results of LCEE are measured by the Super-SBM model.
(2)
Core Explanatory Variables
Energy structure (ES): The carbon emission of logistics activities mainly comes from the consumption of energy, especially the type and proportion of energy used in transportation and storage. The carbon emissions of different energy sources are differences. By adjusting the energy mix and promoting the use of clean energy, the carbon footprint of the logistics industry can be effectively reduced. This paper utilizes the coal share formula to measure the energy structure [57].
Digital transformation (DT): Digital transformation optimizes logistics transportation routes, vehicle scheduling, and cargo distribution through technologies reduces carbon emissions. At the same time, it promotes collaborative optimization of the logistics supply chain, realizes information interoperability and optimal allocation of resources through industry-level industrial Internet platforms, and reduces resource waste and lowers carbon emissions. In addition, digital transformation promotes green technological innovation in logistics enterprises, mining data and information to drive innovative activities, developing environmentally friendly products, enhancing competitiveness, and reducing customers’ carbon emissions. Overall, digital transformation significantly improves LCEE from the dimensions of technology optimization, synergy, and innovation drive.
This paper applies the entropy weight–TOPSIS method to determine the weights of the above indicators, and then comprehensively measures the digital transformation level of each province. In the specific calculation process, the indicators are firstly dimensionless to eliminate the influence of the difference in the scale on the results; subsequently, through the information entropy analysis, the discrete degree of each indicator among the samples is assessed, and the objective weights are determined accordingly: the indicators with a larger degree of discretization and smaller information entropy provide a richer amount of information, and their weights are correspondingly higher. After completing the weighting, a positive ideal solution consisting of the optimal value of each indicator and a negative ideal solution consisting of the worst value are constructed, representing the ideal state and the lowest level of digital transformation, respectively. Then, the distance between each province and these two ideal solutions is calculated and the relative closeness is obtained accordingly, with the higher closeness indicating that the digital transformation level of the province is closer to the ideal state. Finally, the above proximity is used as a comprehensive score to rank and evaluate the digital transformation level of each province. The result as Table 2.
(3)
Control variables
Economic development level (EDL): It affects LCEE. Economically developed regions have large-scale logistics demand, complex activities, and high total carbon emissions, but their advanced logistics technology and management concepts can promote the intensive and intelligent development of logistics and reduce the carbon emission intensity per unit of logistics activities. In addition, developed regions have strong policy guidance ability, which can prompt logistics enterprises to improve LCEE. Therefore, it needs to explore their relationship which is significant for the formulation of rational policies.
Urbanization level (UL): Accelerated urbanization leads to growth in logistics demand and dense infrastructure, but problems such as traffic congestion and rising empty load rate lead to increased carbon emissions. Meanwhile, the centralized layout of urban logistics facilities and resource integration can achieve large-scale and specialized operation and promote LCEE. The perfect transportation network and information technology in cities also help optimize the logistics and distribution paths, improve the utilization rate of vehicles, and enhance LCEE.
Advanced industrial structure (AIS): As the industrial structure develops towards advanced development, the proportion of high value-added and low-energy-consumption industries rises, and the structure of logistics demand changes accordingly, prompting logistics enterprises to adopt advanced technologies and management modes, improve the efficiency of logistics operations, and reduce carbon emissions. Meanwhile, the advanced industrial structure promotes the upgrading of the logistics industry and reduces energy waste and carbon emissions.
Population density (PD): Population density is an important factor affecting LCEE. High-population-density areas have high logistics demand density, frequent activities, and large carbon emissions, but the economy of scale effect can enable logistics enterprises to realize centralized allocation and efficient utilization of resources, and promote LCEE. In addition, high population density areas have perfect infrastructure and abundant labor resources, which provide conditions for the efficient operation of logistics enterprises and prompt the government and society to increase the investment in green logistics facilities, which further improves LCEE.
The descriptive statistics of each variable are shown in Table 3.

4. Results

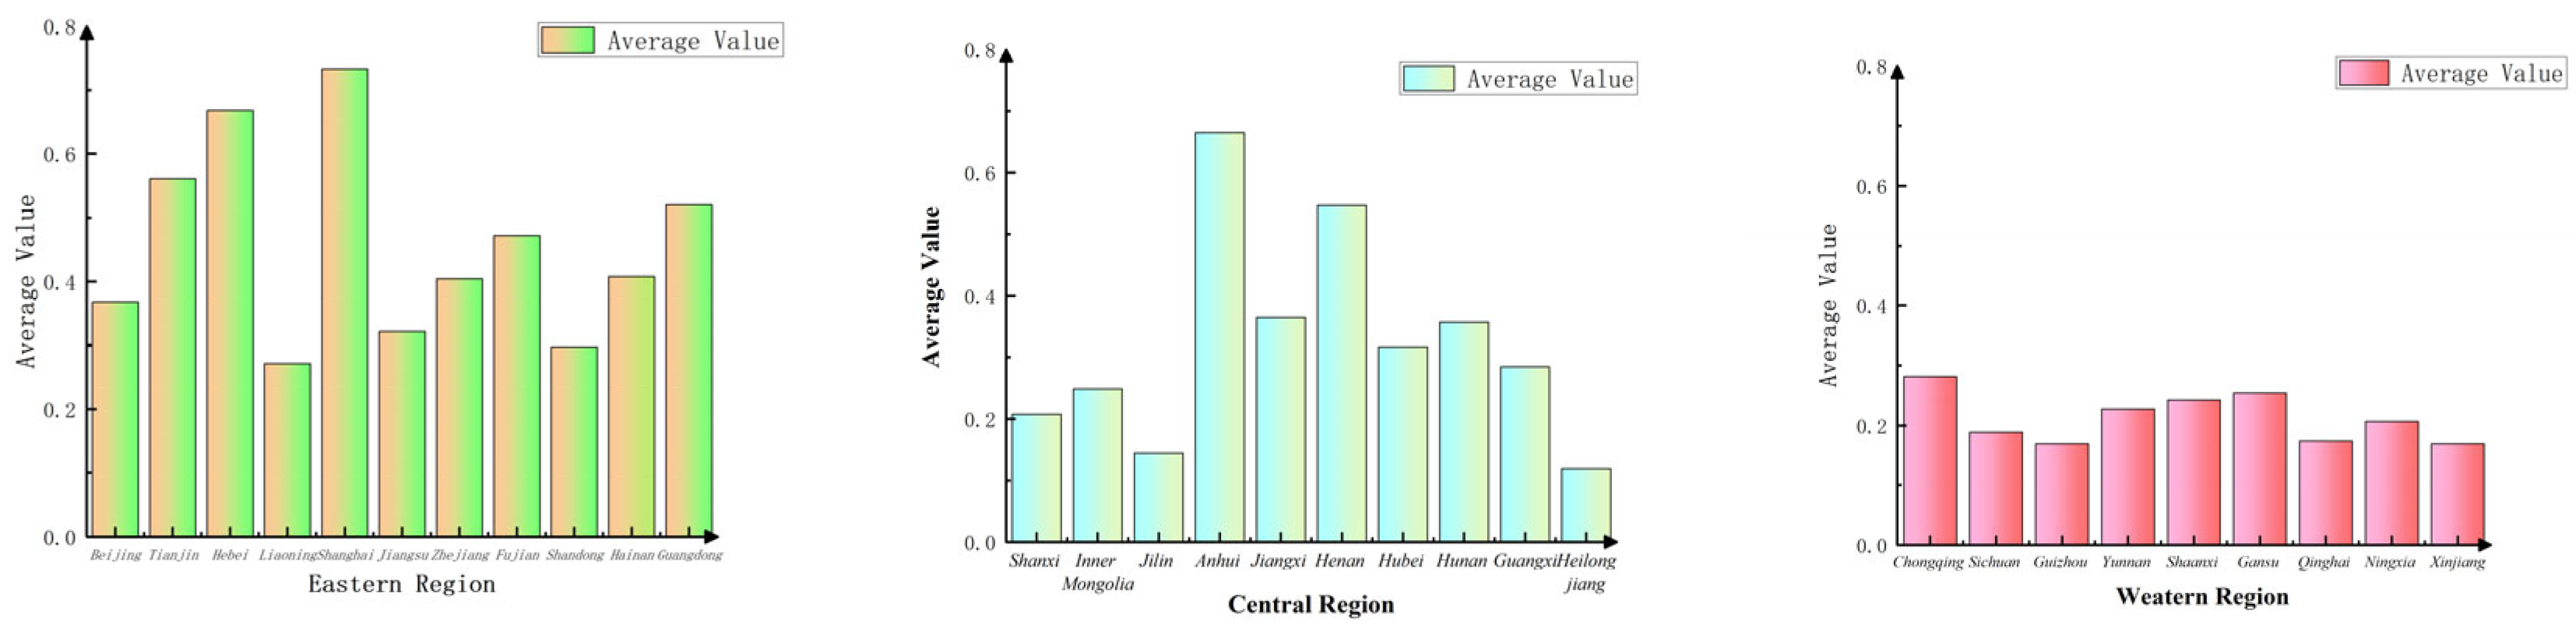
4.1. Measurement Results of LCEE

In this study, the Super-SBM model was used to calculate the LCEE of 30 regions from 2013 to 2022, and the results are shown in Table 4, trend as Figure 3.
From 2013 to 2022, China’s LCEE level is on an upward trend, with the growth rate accelerating after 2019. This is related to the initiatives related to building a high-quality logistics industry in the Outline of the Fourteenth Five-Year Plan. LCEE is significantly higher in the eastern region and weakest in the western region. At the provincial level, it shows a spatial development pattern of “decreasing from the southeast coast to the northwest inland”. LCEE shows obvious regional differences, among which Shanghai is in the leading position by virtue of its strong economic foundation and technological innovation environment; Hebei and Tianjin are also in the forefront of the country by virtue of the inner-circulation role of the Bohai Economic Circle and the integration of the Beijing–Tianjin–Hebei Economic Coordination in concentrating their advantageous resources on green logistics; and the efficiency value of Guangdong, Zhejiang, and Fujian is only second to the above provinces. This may be due to the eastern seaboard, where it is easy to carry out foreign exchanges and technological exchanges and trade in goods, and people can move to and from the more convenient location due to, in particular, the Guangdong Province, effectively placed adjacent to Hong Kong and Macao, connecting the mainland. The three major advantages of the policy tend to attract a large number of research personnel and technology enterprises to effectively optimize LCEE. Hainan Province, relying on its own unique advantages of the free trade zone, has made great progress, especially since the establishment of the free trade zone in 2018. The growth rate is especially obvious; at the same time, Shaanxi, Gansu, Ningxia, Qinghai, Xinjiang, and other northwestern inland provinces are at the bottom of the country in terms of LCEE, which may be related to its geographic limitations and unsound infrastructure construction and other factors. This is shown in Table 4.
As shown in Figure 3, from the point of view of different regional averages, the LCEE differences between regions are obvious; the highest average level is in the eastern region, followed by the national average, and the central region and the western region is lower. Nationwide regions and the overall situation are showing a “rising—down—up” fluctuation upward trend; due to the COVID-19 pandemic, during the economic development of the impact of the blockade in 2020, the valley reached the lowest point of the efficiency value. Thus, the level of economic development is closely related to LCEE; the higher the level of economic development, the more complete the supporting infrastructure, and the higher LCEE. With the recovery of the economy after the epidemic and the restoration of the normal operation of the global supply chain system, the efficiency value rose sharply from 2020 onwards to reach the peak in 2022. Overall, the growth rate was faster in the eastern and central regions, while the increase was least pronounced in the western region.
In Figure 4, LCEE in the eastern region is significantly higher than the national average, with Beijing and Shanghai performing the best. This can be attributed to economic development, better infrastructure, and policy support. With the exception of Shandong and Liaoning, which are traditionally large agricultural provinces with low efficiency, the rest of the provinces are in the leading position. The carbon efficiency of logistics in the central region falls between the east and west, with Henan and Anhui relatively high and Shanxi and Jilin low. Despite the policy impetus for green logistics, the lack of implementation and speed of technology diffusion in the central region has resulted in limited efficiency gains. Jilin’s efficiency value alone reflects a skewed industrial structure and inadequate logistics infrastructure. LCEE in the western region is significantly lower than the national average, with Qinghai and Xinjiang performing the worst. Complex geographical conditions, high transportation costs, and insufficient policy implementation are the main reasons. Overall, there are large differences in development within different regions.

4.2. Decomposition of GML Index for LCEE

The study adopts the GML index to comprehensively assess the LCEE, and at the same time considers the changes in desired output and non-desired output, measures the distance between the desired output of decision-making units and the efficiency maximization frontier, and improves the problem of unsolvability and non-transferability of linear programming that cannot be avoided by the traditional ML (Malmquist–Luenberger) index. Among them, EC (Efficiency Change) stands for technical efficiency change, reflecting the change in production efficiency of decision-making units (e.g., enterprises, regions, etc.) under the current technology level. TC (Technological Change) stands for technical progress change, reflecting the movement of the technological frontier surface, i.e., the contribution of technological progress to production efficiency. Meanwhile, the GML index can analyze the technical progress, technical efficiency change and technical bias through decomposition, revealing the specific contribution of technical progress and efficiency change to LCEE, and helping to identify potential ways to improve LCEE. The GML index and decomposition of the three regions as Table 5 below.
LCEE shows significant differences in different regions. The mean value of the GML index in the eastern region is 1.0786, indicating that logistics activities can control carbon emissions, probably due to a higher level of economic development, better infrastructure, and stronger policy support. The value in the central region is 1.1113, but the mean value of its TC index indicates that technological progress for efficiency improvement is limited. The GML index in the western region is 1.1748, but the mean value of the EC index shows the positive effect of management optimization on efficiency improvement. The regional differences in the GML index reflect the far-reaching effects of economic development, the strength of policy implementation, and the speed of technological promotion on LCEE.
From the time dimension, LCEE shows a certain fluctuating trend during 2013–2022. In the eastern region, the GML index rises significantly in 2020–2021, indicating that green logistics policies and technological progress have played a positive role in efficiency improvement in recent years; the increase in the technological progress index (TC) in the central and western regions is the main factor pulling the rise in their LCEE. Overall, the nationwide technological progress factor makes a major contribution to the improvement of LCEE.

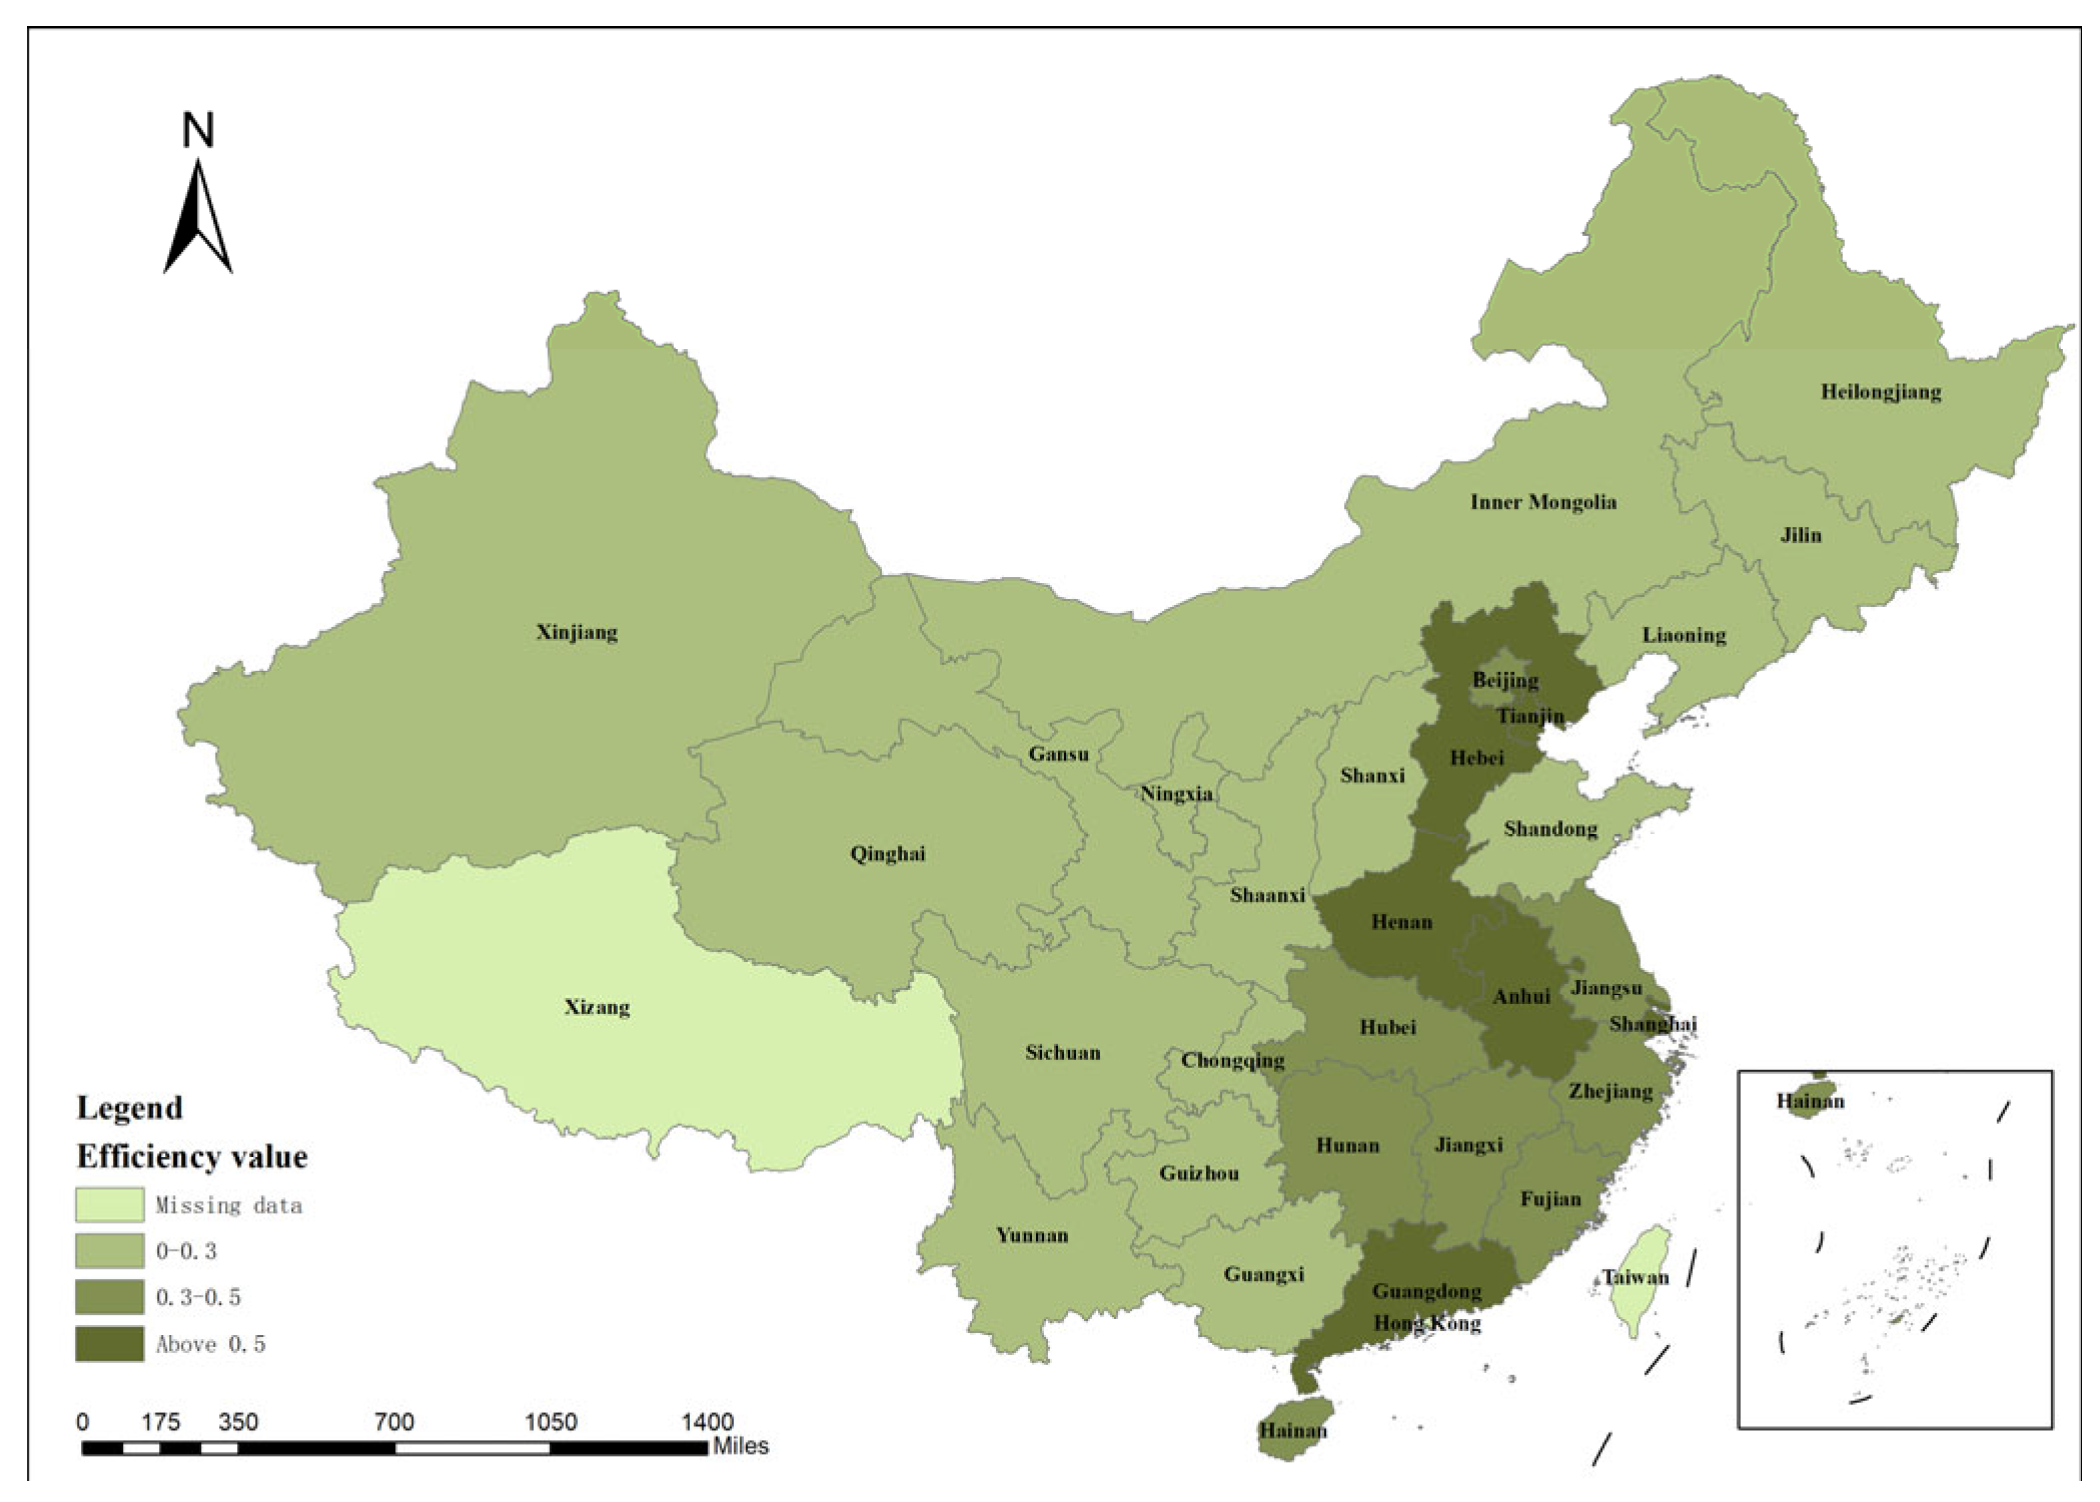
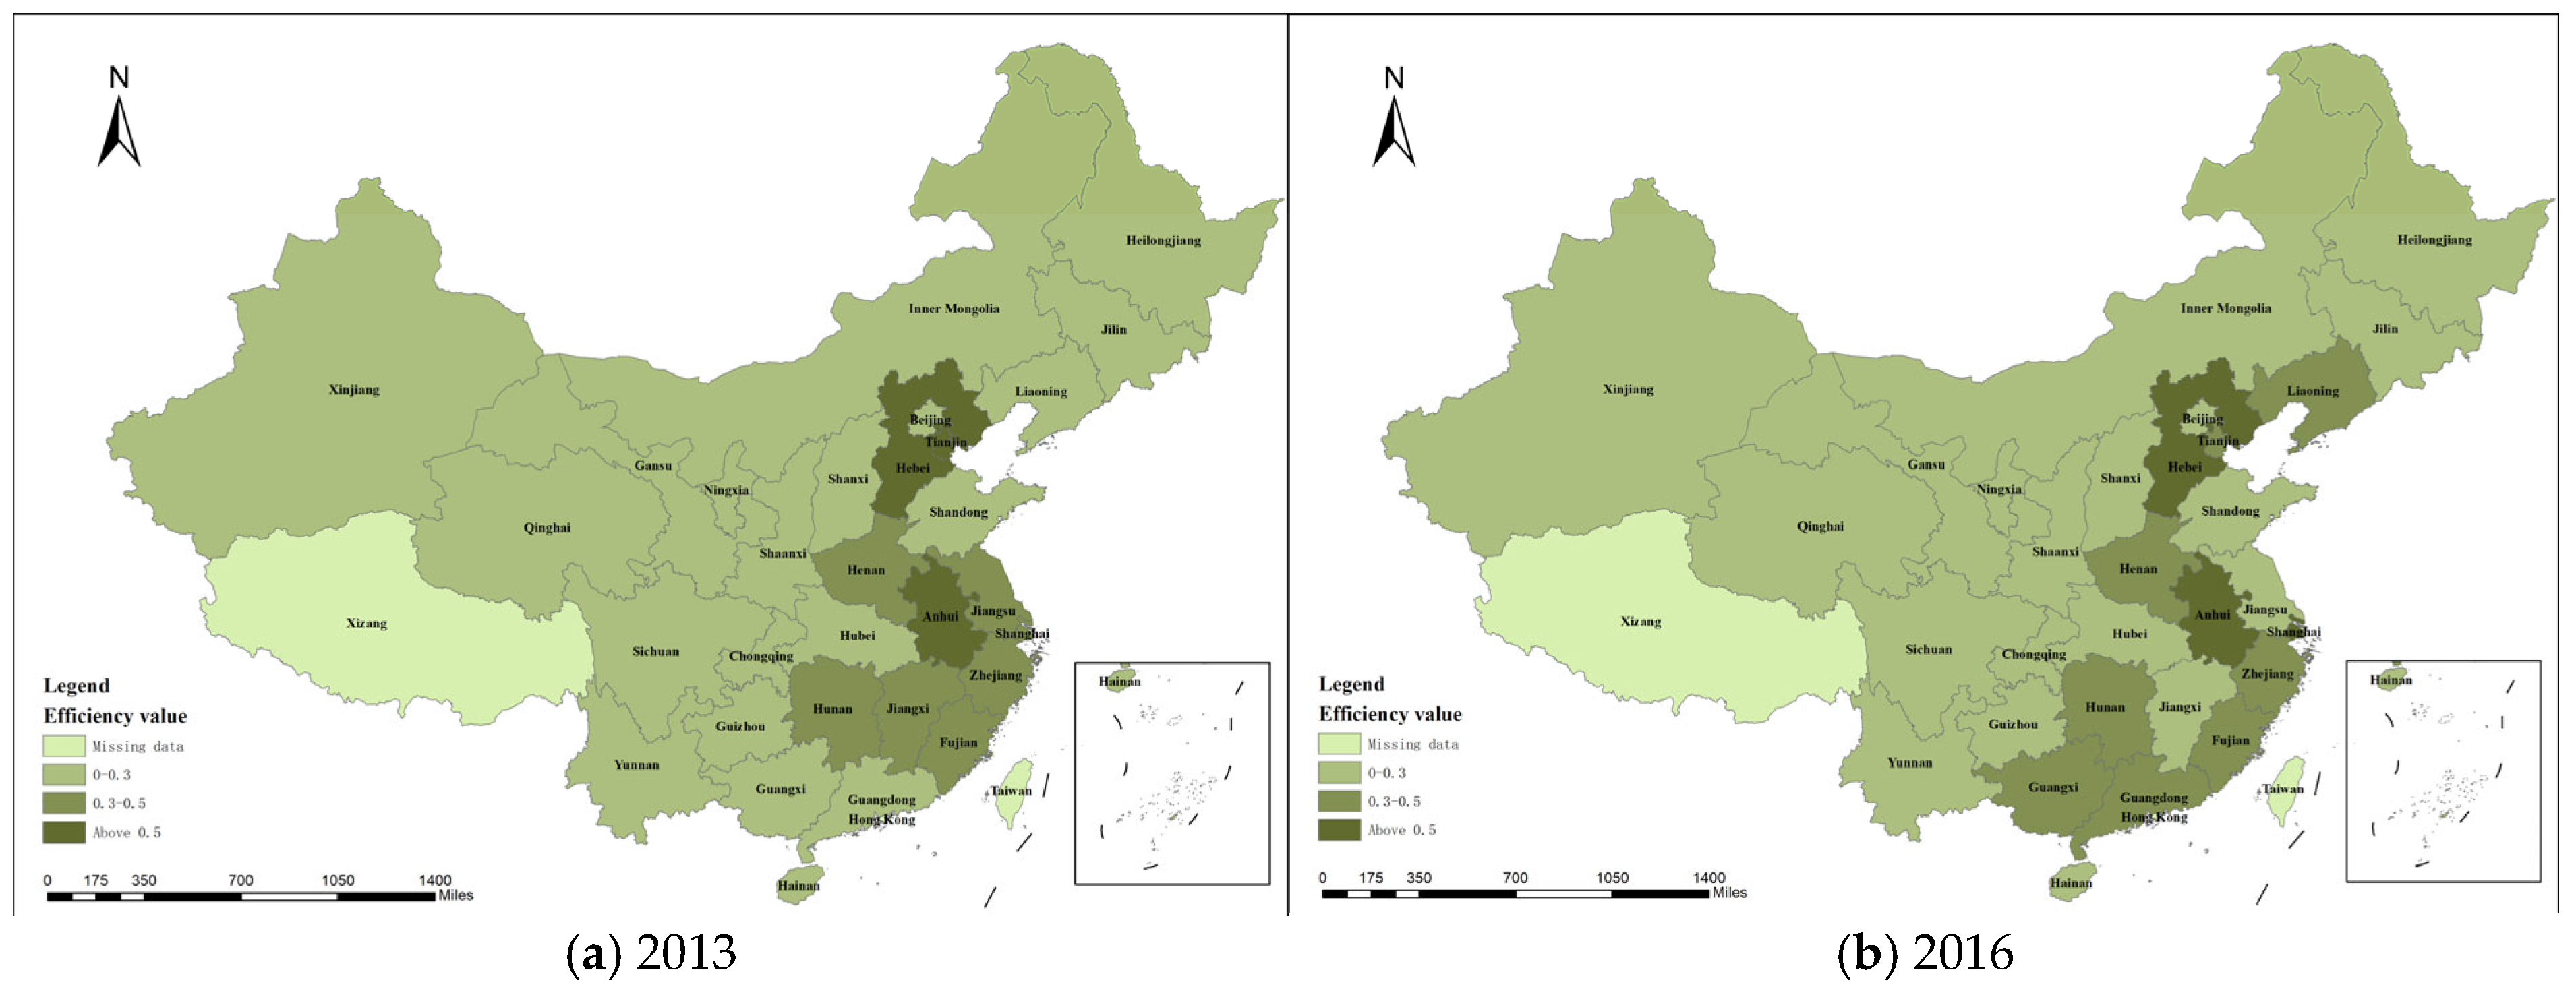
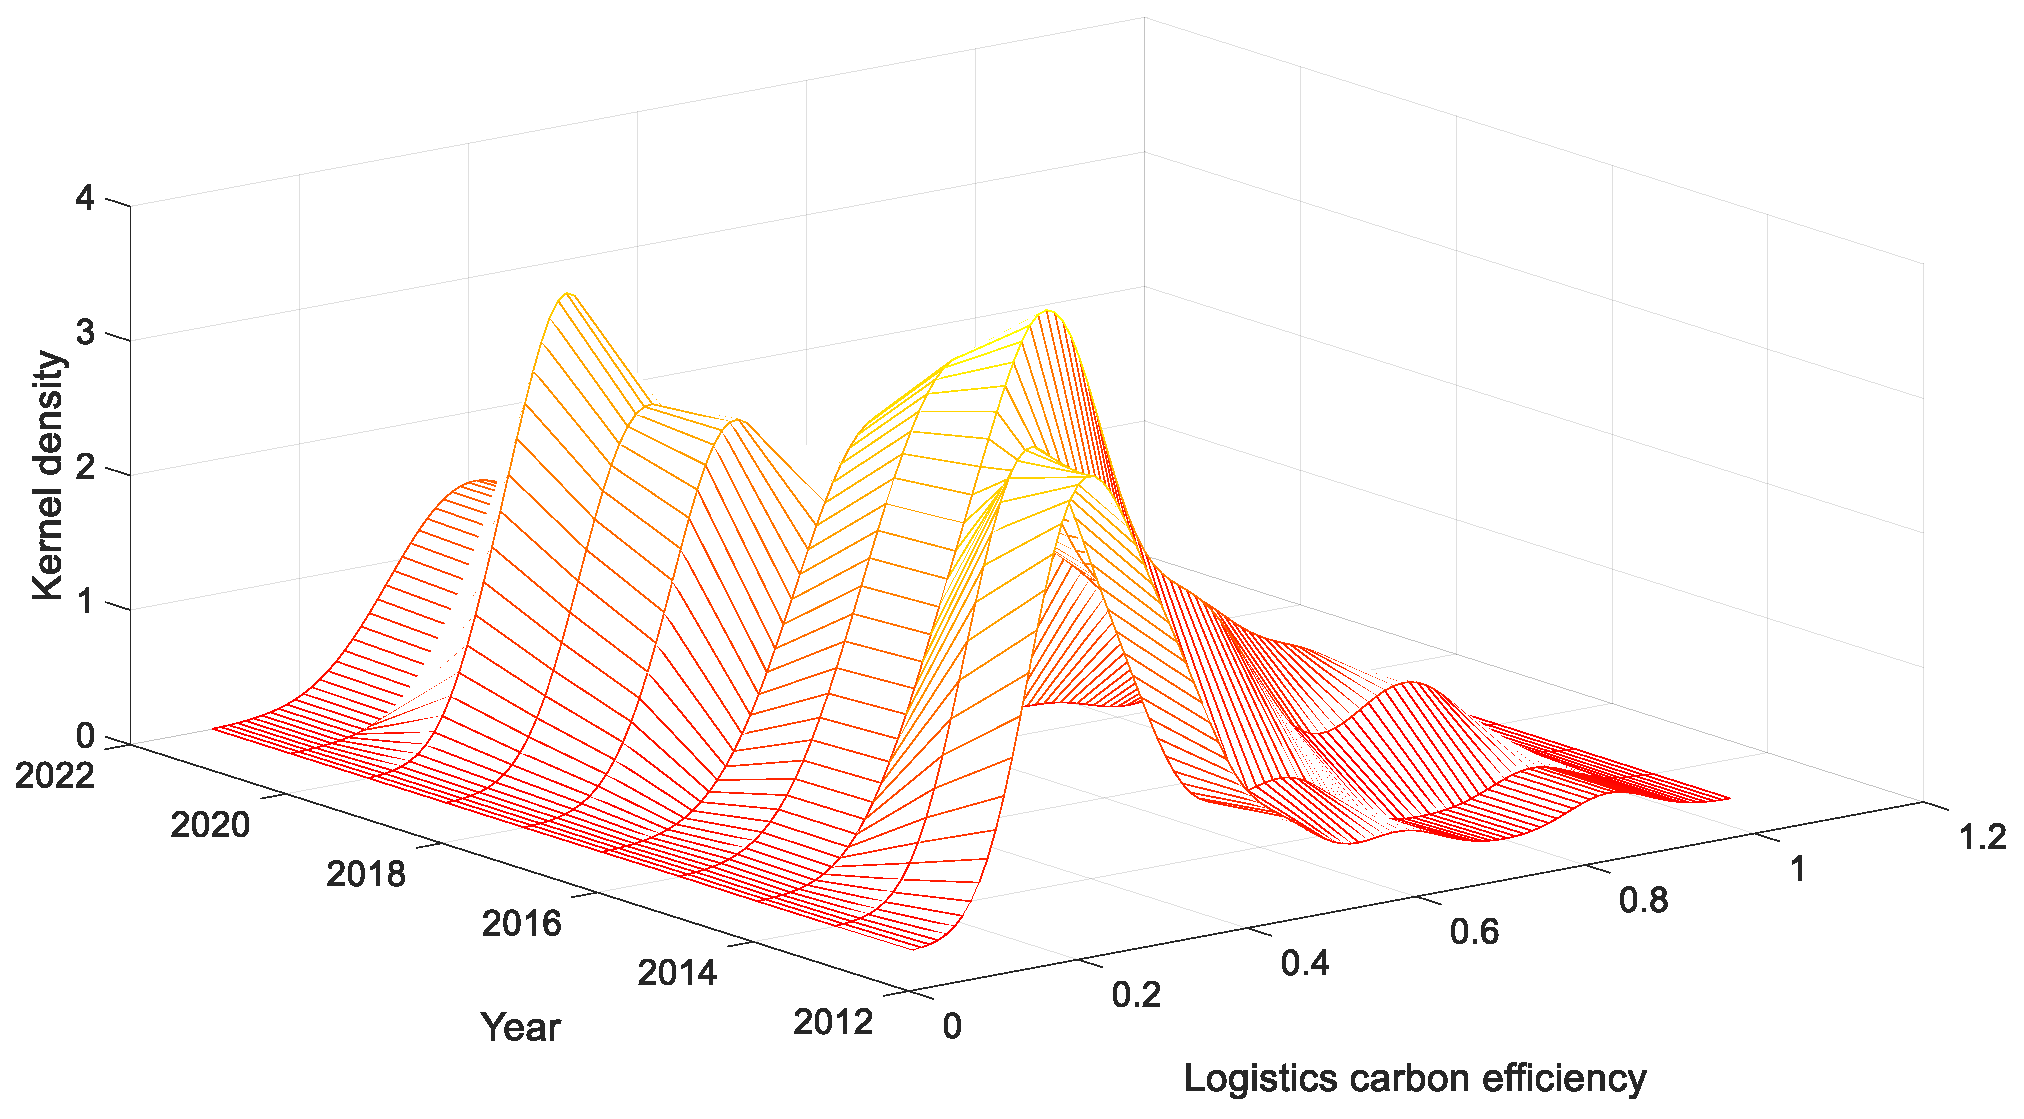
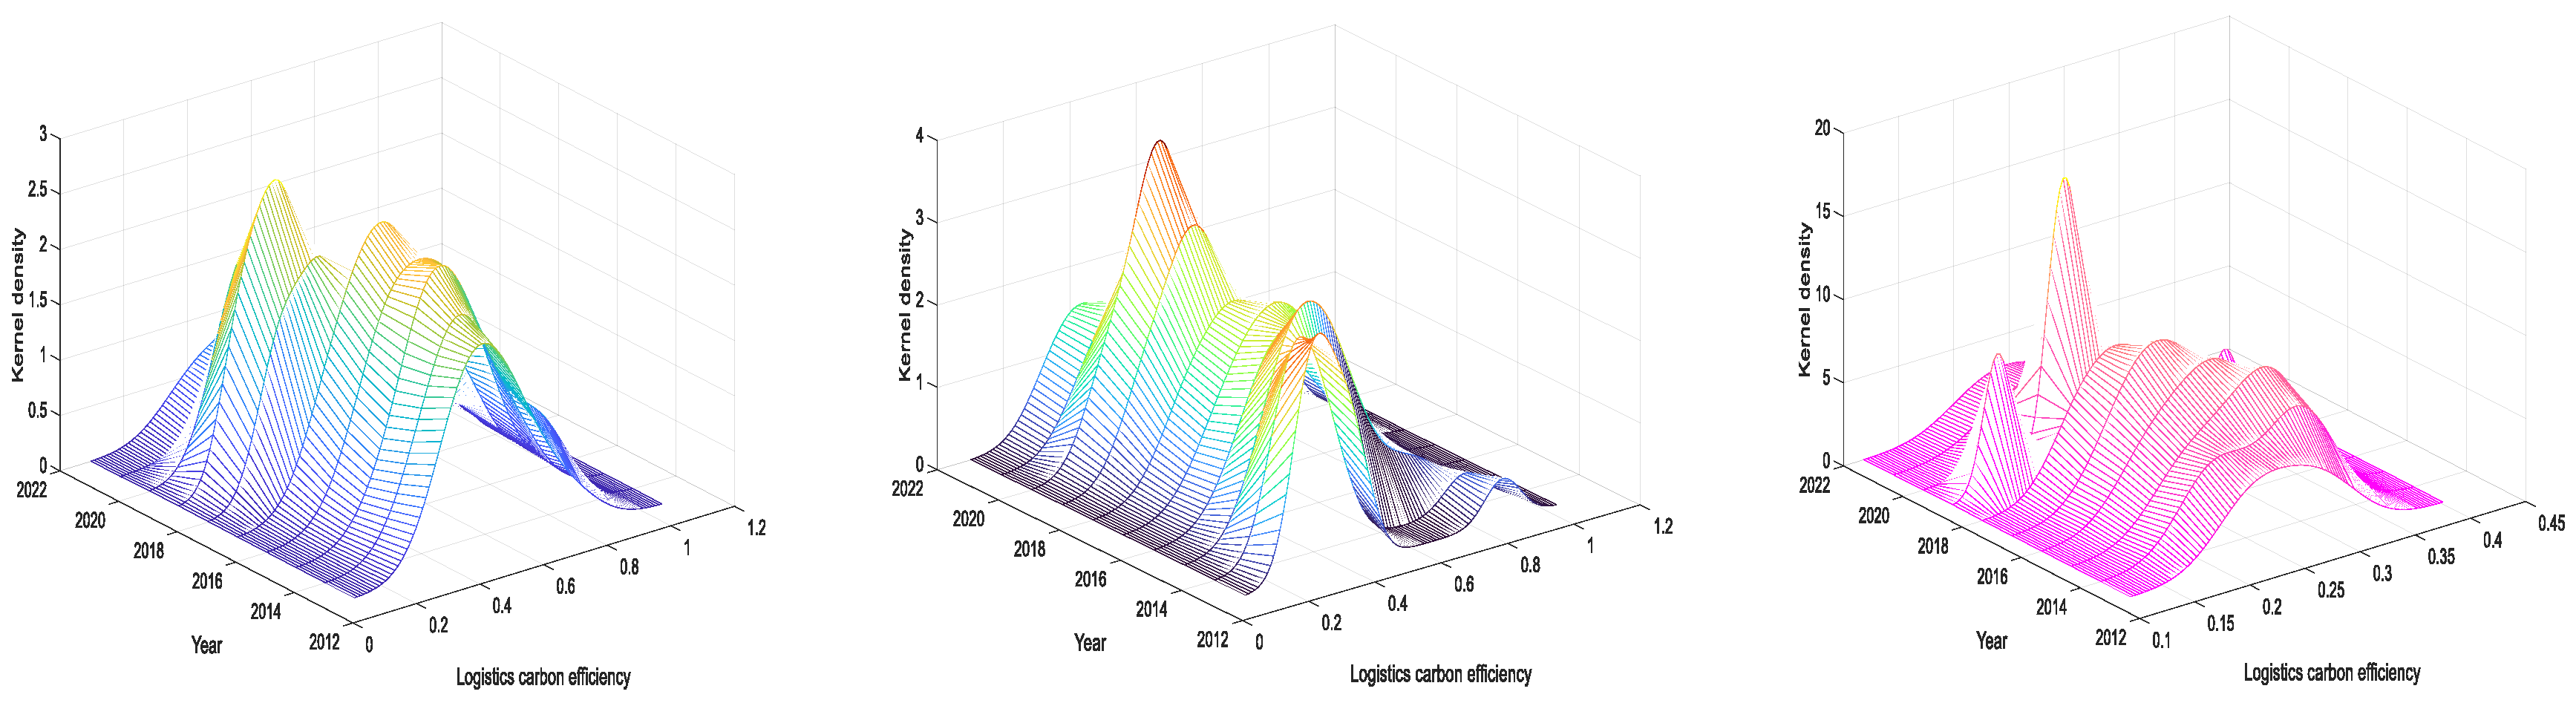
4.3. Spatio-Temporal Distribution

This paper took 3 years in a development stage to be able to clearly see the spatio-temporal evolution characteristics of LCEE, and Figure 5 and Figure 6 below present the spatio-temporal distribution of LCEE.
As shown in the Figure 6, from 2013 to 2022, the LCEE presents obvious spatial and temporal evolution characteristics. Specifically, in 2013, there were large differences in the LCEE of various regions, and the Beijing–Tianjin–Hebei region and the Yangtze River Delta region had higher values of LCEE; by 2016, the high-efficiency region had expanded to almost all coastal provinces and had a tendency to spread to the central region; in 2019, Henan Province entered the high-efficiency zone for the first time, and Chongqing became the region with the highest efficiency value in the western region; and then by 2022, the entire southeast coastal region and the Yangtze River Delta region will have the highest efficiency value in the western region. In 2022, the entire southeast coastal region and the regions near the coastal provinces will all enter the high efficiency zone, and Shaanxi, Hunan, Hubei, Chongqing, Guangxi, and Yunnan Provinces will enter the medium efficiency zone with obvious efficiency improvement, and the spatial stratification is obvious, and LCEE will decrease from east to west.
Overall, the LCEE of the coastal provinces is higher than inland provinces. Comprehensive charts and graphs show that the efficiency values of the Beijing–Tianjin–Hebei region, Henan, Anhui, and Hainan are the most stable, and have been at high efficiency for a long time; Guangdong Province has made the greatest progress, and in ten years has jumped to the high efficiency zone; the efficiency values of the western region with lower level long time, especially the northwest region has long been below the national average, with a low efficiency value and slow development. The spatial distribution is characterized by obvious regional differences, serious polarization and uneven development.
Figure 7 briefly introduce the modules in the kernel density diagram: X-axis is the year, Y-axis is the score, and Z-axis is the kernel density (which represents the weight of this sample, and is also an important factor to measure the influence of energy structure on LCEE).
The shift in the kernel curve of the national overall LCEE is small, and the LCEE fluctuates and improves; the peak value is concentrated at 0.3, and the data density is good. From the distribution pattern, the right tail of the curve appears elongation phenomenon, the distribution extensibility shows a certain degree of broadening trend, and the spatial gap of total factor energy efficiency has been expanded. The single-peak pattern is remarkable, and there is no obvious polarization. The peak of the kernel density curve has an undulating improvement, and the width has slightly contracted, indicating that the degree of difference in LCEE in various regions has become smaller. There is a more obvious dynamic convergence characteristic.
In Figure 8, the peak value of the kernel density curve in the eastern region gradually increases, and the kernel curve shifts to the right: LCEE improves continuously, the single-peak pattern is remarkable, the polarization phenomenon is weakened, the curve gradually changes to a thin and high pattern, the peak value increases, the width shrinks, and the difference between provinces in the eastern region shrinks, showing the waveform shifts to the right, showing a left skewed distribution, the vertical height of the wave peak rises, the horizontal width decreases, and the kernel density tends to move in the direction of decreasing value. Density tends to move in the direction of the decreasing value, and the regional gap of carbon emission in agricultural logistics is narrowing and characterized by dynamic convergence. In the central region, the peak of kernel density curve gradually rises, the kernel curve moves to the right, LCEE gradually improves, the right tail of the curve lengthens, and the difference between provinces in the central region gradually narrows, and the overall distribution shows a left skewed state. The western region shows a trend from single peak to multiple peaks, with significant polarization, and the shape of the curve changes from flat and wide to high and sharp, indicating that the efficiency differences among the provinces in the western region are narrowing year by year, and the image shows a right-skewed distribution with dynamic convergence.

4.4. Analysis of Spatial Effects

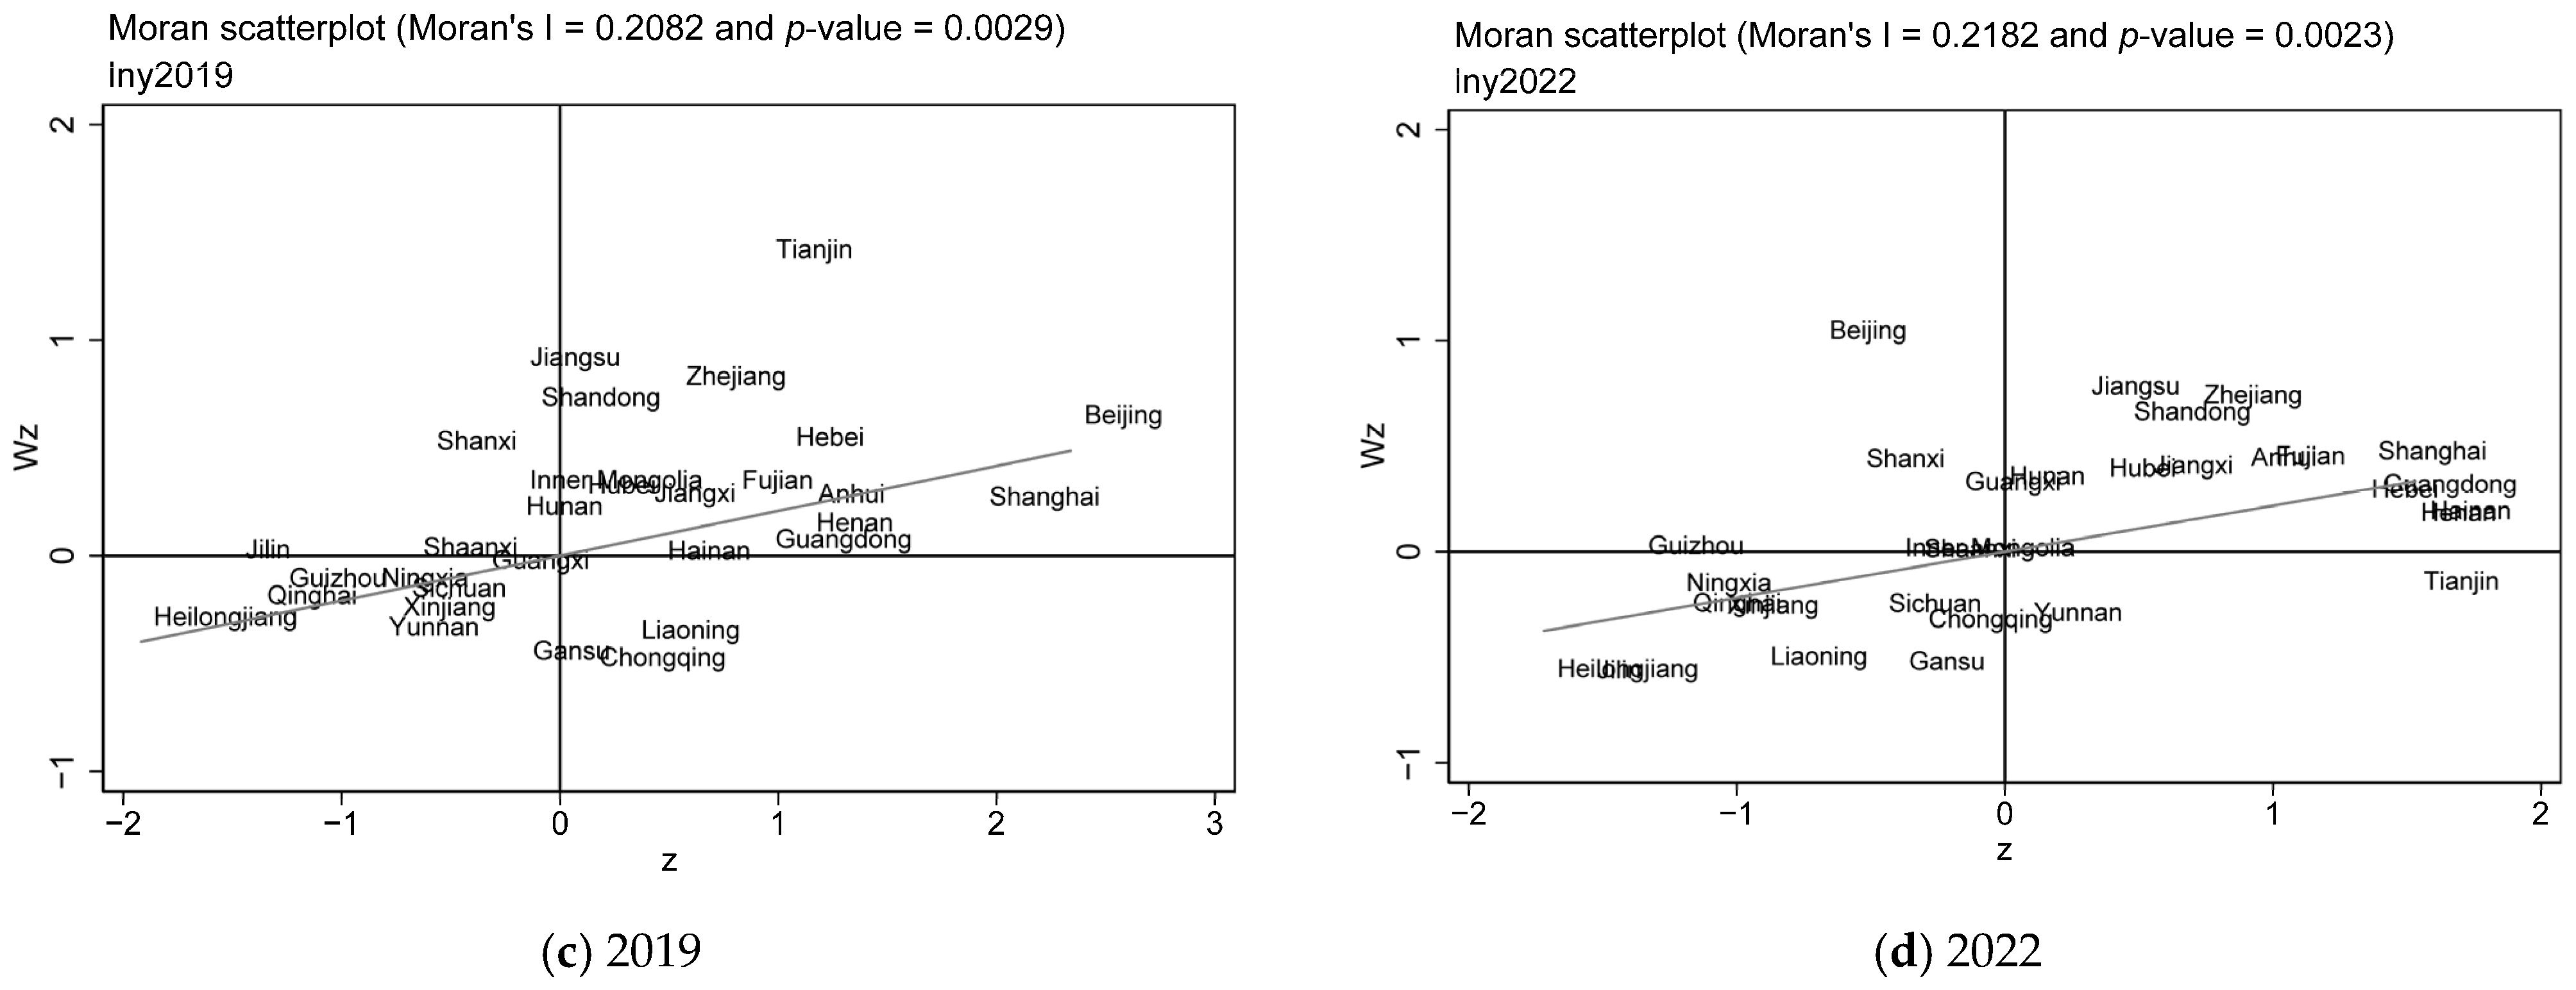
4.4.1. Spatial Correlation Test

All variables were first converted to natural logarithms to stabilize variance and permit elasticity-based interpretations. The analysis focuses on two core explanatory factors—digital transformation and energy structure. Four logged controls capture economic development, urbanization, industrial upgrading, and population density. Using a balanced panel of 30 Chinese provinces from 2013 to 2022, we employed STATA 15.1 to declare the data as panel, apply a row-standardized spatial weight matrix, and compute annual Moran’s I statistics for logistics carbon-emission efficiency, confirming significant positive spatial autocorrelation throughout the study period.
In Table 6, the Moran index of 30 Chinese provinces (cities and districts) from 2013 to 2022 are all positive, and the Moran index is less significant from 2013 to 2016, while the Moran indices from 2017 to 2022 show different degrees of significance, which basically shows that there are spatial correlations in the LCEE in different regions of China, and the spatial econometric model should be used.
After understanding the relevance of LCEE in the whole region, this paper further applies the Moran scatterplot study to intercept the scatterplot of Moran index for the four years of 2013, 2016, 2019, and 2022(Figure 9). From a macro point of view, the provinces (cities and districts) across the country have been characterized by “low-low” clustering and “high-high” dispersion over the past ten years. Provinces (cities and districts) with higher levels of LCEE are more likely to be spatially clustered. From the perspective of difference, if the number of samples of “low-low” and “high-high” types is large, it means that the spatial difference is small at this time. According to the theory of technology diffusion, the study should focus on the high-high type (first quadrant HH) and low-low type (third quadrant LL) regions of Moran scatterplot. From the above figure, there is indeed a significant agglomeration and strong positive spatial correlation between the spatial geographic distribution of China’s LCEE.
However, the development of LCEE is largely influenced by the stage of economic development and agglomeration effect. Comprehensively analyzing the Moran scatterplot from 2013 to 2022, the trend of spatial autocorrelation of variable values can be observed. From 2013 to 2019, many provinces are concentrated in the first and third quadrants and converge to the curve, the spatial aggregation trend of LCEE is increasing. The number of points in quadrants 2 and 4 decreased, proving that the “island” phenomenon is decreasing and the spatial distribution is more even. By 2022, the points in each province had a tendency to gradually detach from the origin, which means that the aggregation significance level of LCEE was good.

4.4.2. Spatial Model Selection

After exploring the spatial correlation, we needed to perform some necessary tests to inform the selection of the spatial model. In this paper, LM, Wald, LR, and Hausman tests have been conducted to initially determine the specific form of the model used. The results of Table 7 show that the SDM with time and spatial fixed effects was finally chosen in this study to explore the spatial spillover effect.

4.4.3. Multiple Covariance Test

Before conducting regression analysis, it is crucial to examine whether the explanatory variables are highly correlated, which is known as multicollinearity. The study uses the variance inflation factor (VIF) to assess multicollinearity among the variables. A higher value of VIF indicates a higher covariance among the variables.
The results of the multicollinearity test (Table 8) show that the highest VIF value among all variables is 8.02, which is below the threshold of 10. This suggests that the regression model does not exhibit significant multicollinearity, making the regression results reliable.

4.4.4. Spatial Durbin Model Results

In summary of the above test described, we will choose the optimal Spatial Durbin Model (SDM) with fixed effects and double fixed for spatial econometric analysis.
The Main variable represents the main effect, i.e., the own effect. The Wx variable is its spatial lag term, reflecting the spatial spillover effect of neighboring regions on LCEE in the region. According to the higher Log-likelihood value shown in Table 9, it can indicate that the model has high explanatory power. Rho = −0.1892 means that spatial spillover effect is existence. The improvement of local efficiency has a negative effect on the surrounding area, thus inhibiting the growth of LCEE in these areas. In addition, the coefficients of both energy structure and digital transformation are more significant, and both have a negative effect on LCEE. Meanwhile, spatial lag term coefficients (Wx) are more indicative of the spatial transmission effect than the coefficients in Main. From the coefficients in spatial lag term coefficients, digital transformation has a positive spatial spillover effect, and the neighboring regions have a positive transmission effect on the local LCEE.

4.4.5. Decomposition Effects of Spillovers

LeSage and Pace [58] proposed direct and indirect impacts. Direct impacts denote the effect of a change in the independent variable of a region on its own dependent variable, while indirectly impacts denote the effect of such a change on the dependent variable of other regions. To measure this impact, they suggest using averages to measure direct, indirect, and aggregate impacts. Subsequently, Elhorst and Fréret [59] further developed this theory by providing corresponding statistical tests to validate these effects. When analyzing spatial spillovers, the effects are decomposed through a matrix of partial derivatives. This allows one to observe and analyze the effects of different variables on complex phenomena such as geographic coverage in more detail, and to understand more accurately how key economic indicators such as the digital economy and environmental regulation interact and influence each other spatially, thus providing a more precise basis for policymaking and economic strategy, as shown in the results in Table 10 below.
The spatial spillover effect of LCEE is an important manifestation of interregional synergies, and its decomposition effect reveals the differentiated performance of direct and indirect effects in different regions. From a national perspective, the direct effect of energy structure optimization on LCEE is significantly negative, indicating that clean energy play a role in suppressing carbon emissions; however, its indirect effect is also negative, reflecting that energy structure adjustment may have a suppressive effect on LCEE in the neighboring regions through inter-regional competition for resources or policy spillover effects. In contrast, the direct effect of digital transformation is negative, but its indirect effect is significantly positive, indicating that the application of digital technology, although it may increase energy consumption in the short term, has a significant positive spillover effect on neighboring regions through optimizing resource allocation and improving logistics efficiency. This positive spillover effect is mainly reflected in the sharing of logistics information, intelligent scheduling, and the promotion of green logistics models, which further promotes the synergistic improvement of LCEE among regions.
At the regional level, the direct effect of energy structure optimization on LCEE in the eastern region is weak, but its indirect effect is significantly negative, which may be related to the relative optimization of energy structure in the eastern region and the intensification of interregional resource competition. The direct effect of digital transformation in the eastern region is significantly negative, but its indirect effect is weak, suggesting that the promotion of digital technology in the eastern region is more mature, with limited spillover effects on neighboring regions. The optimization of energy structure in the central region has a weaker direct effect on LCEE, but its indirect effect is significantly positive, reflecting that the central region, through policy support and technology diffusion, has produced a strong positive spillover effect on the LCEE of the neighboring regions. The direct effect of digital transformation in the central region is weaker, but its indirect effect is significantly positive, indicating that the application of digital technology in the central region plays a demonstration and driving role for the surrounding regions. The direct effect of energy structure optimization on LCEE in the western region is significantly positive, but its indirect effect is significantly negative, which may be related to the complex geographic conditions of the western region as well as the lack of policy implementation. The direct effect of digital transformation in the western region is significantly negative, but its indirect effect is significantly positive, indicating that the application of digital technology in the western region, although starting late, has produced a strong positive spillover effect on the surrounding regions through technology introduction and regional collaboration.

4.5. Discussion

This study systematically analyzes the impacts of digital transformation and energy structure on LCEE and their regional heterogeneity and spatial spillover effects through Super-SBM model and spatial measurement model. Compared with existing academic studies, this study further reveals regional heterogeneity and spatial spillover effects on the basis of confirming the positive impacts of digital transformation and energy structure optimization on LCEE. Specifically, this study finds that digital transformation has limited direct enhancement effects on LCEE in the eastern region, but has significant positive spillover effects on neighboring regions. In the western region, although the direct effect of digital transformation is not obvious, its positive spillover effect on the neighboring regions is more significant. Energy structure optimization has a weaker direct effect on LCEE in the eastern region, but has a significant positive spillover effect on the surrounding regions in the central region. In addition, this study improves the precision and reliability of carbon emission measurement by constructing an integrated data system of “micro-medium-macro”, which provides a solid data foundation for more accurately evaluating the impacts of digital transformation and energy structure on LCEE. These findings not only validate the conclusions of existing studies, but also provide new theoretical basis and policy recommendations for the realization of regional cooperative emission reduction and “dual-carbon” goal.
Although this study has made some breakthroughs, there is still some room for improvement. First, the timeliness and coverage of the data can be further expanded to more comprehensively reflect the dynamic changes in the logistics industry in different regions. Second, future studies can further refine the specific dimensions of digital transformation and energy structure, such as distinguishing the differentiated impacts of different types of digital technologies and clean energy on LCEE. In addition, considering the complexity of policy implementation and inter-regional interactions, future research can introduce policy variables to analyze the moderating effect of policy tools on logistics carbon emission efficiency. Finally, combining actual cases and enterprise micro-data, in-depth discussion of the specific implementation path and effect of digital transformation and energy structure optimization at the enterprise level will provide more targeted guidance for policy formulation and enterprise practice.

5. Conclusions and Suggestions

5.1. Conclusions

(1)
Spatial Heterogeneity of LCEE: The overall LCEE in China shows a spatial pattern of “high in the east and low in the west”, with significant regional differences. The eastern region has higher LCEE due to better infrastructure and technological capabilities, while the western region lags behind.
(2)
Temporal Trends in LCEE: LCEE has shown an overall upward trend over the past decade, with a decline in 2020 due to COVID-19 but a rapid recovery afterward. The growth rate of LCEE decreases from east to west, indicating uneven development across regions.
(3)
Technological Progress as a Key Driver: Technological progress is the primary factor driving the improvement of LCEE nationwide. The eastern region benefits significantly from technological advancements, while the central and western regions also show improvements driven by technology.
(4)
Spatial Dependence and Spillover Effects: LCEE exhibits significant spatial dependence, with energy consumption structure showing a negative spillover effect and digital transformation showing a positive spillover effect. Regional cooperation and the diffusion of digital technologies can enhance overall logistics carbon emission efficiency.

5.2. Recommendations

5.2.1. Strengthen Regional Policy Coordination and Promote Balanced Development of Logistics Carbon Emissions

Government Actions and Implementation
To address the significant spatial and temporal differences in logistics carbon emission efficiency (LCEE), the government should enhance inter-regional policy coordination. The eastern region, with its technological and economic advantages, should support the central and western regions through technology transfer and experience sharing. The central and western regions should focus on increasing infrastructure investment and policy support, optimizing their energy structures, and promoting the use of clean energy. Specifically, the government can establish regional cooperation agreements to facilitate the sharing of advanced logistics technologies and management practices. Additionally, increasing funding for logistics infrastructure in the central and western regions, focusing on improving transportation networks and logistics hubs, will be crucial.
Expected Outcomes and Conclusion Basis
By strengthening regional policy coordination, the government can help narrow the efficiency gap between regions, leading to more balanced development of LCEE across the country. This will not only improve overall logistics efficiency but also contribute to national carbon reduction goals. The conclusion is based on the findings from the Super-SBM model, which revealed significant regional differences in LCEE, with the eastern region having higher efficiency due to better infrastructure and technological capabilities.

5.2.2. Accelerate the Digital Transformation of Enterprises and Optimize Green Logistics Resource Allocation

Enterprise Actions and Implementation
Logistics enterprises should accelerate their digital transformation to optimize resource allocation and reduce energy consumption. This includes investing in advanced technologies such as artificial intelligence, the Internet of Things (IoT), and data analytics to improve operational efficiency and reduce carbon emissions. Enterprises should develop and apply environmentally friendly logistics equipment and transportation tools, such as electric vehicles and smart routing systems. Additionally, implementing intensive logistics models like co-built fleets, shared warehousing, and common distribution can reduce resource waste and environmental pollution.
Expected Outcomes and Conclusion Basis
By accelerating digital transformation, logistics enterprises can significantly improve their LCEE. This will not only enhance their competitiveness but also contribute to the overall sustainability of the logistics industry. The conclusion is based on the analysis using the Spatial Durbin Model (SDM), which found that digital transformation has a positive spillover effect on neighboring regions, indicating that digital technologies can optimize resource allocation and improve logistics efficiency, thereby reducing carbon emissions.

5.2.3. Strengthen Regional Cooperation and Establish a National Green Logistics System

Government Actions and Implementation
To address the spatial spillover effect of LCEE, the government should enhance inter-regional cooperation and fully leverage the strengths of each region. The eastern region should facilitate the improvement of LCEE in the central and western regions through technological spillover and policy demonstration. The central region should utilize its geographic location and resource endowment to become a bridge for regional synergistic development. The western region should narrow the efficiency gap with the eastern region through policy support and technology introduction. Specifically, the government can encourage the eastern region to share advanced technologies and best practices with the central and western regions, implement pilot projects in the central region to demonstrate the effectiveness of green logistics policies and technologies, and provide incentives for the western region to adopt new technologies and practices from other regions.
Expected Outcomes and Conclusion Basis
By strengthening regional cooperation and establishing a unified national green logistics system, the government can improve overall LCEE and promote sustainable development across the country. This will lead to more efficient logistics operations and reduced carbon emissions. The conclusion is based on the SDM analysis, which found that digital transformation has a positive spillover effect on neighboring regions, suggesting that regional cooperation and the diffusion of digital technologies can enhance overall logistics carbon emission efficiency.

5.2.4. Promote Technological Innovation and Policy Support for Energy Structure Optimization

Government Actions and Implementation
The government should promote technological innovation and provide policy support to optimize the energy structure in the logistics industry. This includes increasing the use of clean energy sources such as electricity and hydrogen and reducing the reliance on traditional fossil fuels. Specifically, the government can invest in R&D to develop new technologies for clean energy applications in logistics, provide subsidies and tax incentives for logistics companies that adopt clean energy technologies, and build charging stations and hydrogen refueling stations to support the use of electric and hydrogen-powered vehicles in logistics.
Expected Outcomes and Conclusion Basis
By optimizing the energy structure, the logistics industry can significantly reduce its carbon emissions, leading to improved LCEE. This will contribute to the overall goal of achieving carbon neutrality. The conclusion is based on the analysis of the impact of energy structure on LCEE using the SDM, which found that energy structure optimization has a negative spillover effect on neighboring regions. The findings suggest that while optimizing the energy structure can improve LCEE, it may also create competitive pressures that need to be managed through policy interventions.

Author Contributions

Methodology, Y.G., J.Y., and L.Z.; Software, Y.G.; Validation, R.W., L.Z., and M.W.; Formal analysis, R.W. and L.Z.; Investigation, M.W.; Resources, M.W.; Writing—original draft, Y.G. and J.Y.; Writing—review and editing, J.Y. and R.W. All authors have read and agreed to the published version of the manuscript.

Funding

This research received no external funding.

Institutional Review Board Statement

Not applicable.

Informed Consent Statement

Not applicable.

Data Availability Statement

The original contributions presented in this study are included in the article. Further inquiries can be directed to the corresponding author.

Conflicts of Interest

The authors have no relevant financial or non-financial interests to disclose.

References

  1. Xu, B.; Xu, R. Assessing the role of environmental regulations in improving energy efficiency and reducing CO2 emissions: Evidence from the logistics industry. Environ. Impact Assess. Rev. 2022, 96, 106831. [Google Scholar] [CrossRef]
  2. Portillo Juan, N.; Negro Valdecantos, V.; Olalde Rodríguez, J.; Iglesias, G. Environmental Policy vs. the Reality of Greenhouse Gas Emissions from Top Emitting Countries. Energies 2024, 17, 5705. [Google Scholar] [CrossRef]
  3. Subramoniam, R.; Huisingh, D.; Sundin, E.; Chinnam, R.B.; Bayulken, B.; Gaur, J.; Govindan, K.; Viegas, C. Special Issue Editorial: Supply Chain Planning & Management Challenges and Opportunities Driven by Climate Change and Other Disruptions and How to Accelerate Societal Transition to Equitable, Sustainable and Livable Societies; Elsevier: Amsterdam, The Netherlands, 2024. [Google Scholar]
  4. Bugarčić, F.Ž.; Mićić, V.; Stanišić, N. The role of logistics in economic growth and global competitiveness. Zb. Rad. Ekon. Fak. U Rij. 2023, 41, 499. [Google Scholar] [CrossRef]
  5. Mckinnon, A.C.; Piecyk, M. Setting targets for reducing carbon emissions from logistics: Current practice and guiding principles. Carbon Manag. 2012, 3, 629. [Google Scholar] [CrossRef]
  6. Lopes De Sousa Jabbour, A.B.; Chiappetta Jabbour, C.J.; Sarkis, J.; Latan, H.; Roubaud, D.; Godinho Filho, M.; Queiroz, M. Fostering low-carbon production and logistics systems: Framework and empirical evidence. Int. J. Prod. Res. 2021, 59, 7106. [Google Scholar] [CrossRef]
  7. Verbivska, L.; Zhygalkevych, Z.; Fisun, Y.; Chobitok, I.; Shvedkyi, V. Digital technologies as a tool of efficient logistics. Rev. De La Univ. Del Zulia 2023, 14, 492. [Google Scholar] [CrossRef]
  8. Gan, M.; Yang, S.; Li, D.; Wang, M.; Chen, S.; Xie, R.; Liu, J. A novel intensive distribution logistics network design and profit allocation problem considering sharing economy. Complexity 2018, 2018, 4678358. [Google Scholar] [CrossRef]
  9. Xiao, R.; Pan, L.; Xiao, H.; Xiao, H.; Zhu, Z. Research of intelligent logistics and high-quality economy development for Yangtze River cold chain shipping based on carbon neutrality. J. Mar. Sci. Eng. 2022, 10, 1029. [Google Scholar] [CrossRef]
  10. Zhou, F.; Yu, K.; Xie, W.; Lyu, J.; Zheng, Z.; Zhou, S. Digital twin-enabled smart maritime logistics management in the context of industry 5.0. IEEE Access 2024, 12, 10920. [Google Scholar] [CrossRef]
  11. Huang, Y.; Hu, M.; Xu, J.; Jin, Z. Digital transformation and carbon intensity reduction in transportation industry: Empirical evidence from a global perspective. J. Environ. Manag. 2023, 344, 118541. [Google Scholar] [CrossRef]
  12. Xu, Y.; Jia, F.; Chen, L.; Wang, Y. Does digital transformation foster carbon emissions reduction? Evidence from China’s manufacturing supply chain. Int. J. Logist. Manag. 2024, 35, 1827. [Google Scholar] [CrossRef]
  13. Mutambik, I. Digital Transformation as a Driver of Sustainability Performance—A Study from Freight and Logistics Industry. Sustainability 2024, 16, 4310. [Google Scholar] [CrossRef]
  14. Mckinnon, A. Green logistics: The carbon agenda. Electron. Sci. J. Logist. 2010, 6, 1–9. [Google Scholar]
  15. Wong, E.Y.; Tai, A.H.; Zhou, E. Optimising truckload operations in third-party logistics: A carbon footprint perspective in volatile supply chain. Transp. Res. Part D Transp. Environ. 2018, 63, 649. [Google Scholar] [CrossRef]
  16. Jiang, X.; Ma, J.; Zhu, H.; Guo, X.; Huang, Z. Evaluating the carbon emissions efficiency of the logistics industry based on a Super-SBM Model and the Malmquist Index from a strong transportation strategy perspective in China. Int. J. Environ. Res. Public Health 2020, 17, 8459. [Google Scholar] [CrossRef] [PubMed]
  17. Cheng, C.; Han, Y.; Ren, X. Analysis of technological innovation on provincial green development levels of logistics industry in China. Environ. Sci. Pollut. Res. 2023, 30, 53020. [Google Scholar] [CrossRef]
  18. Richnák, P.; Gubová, K. Green and reverse logistics in conditions of sustainable development in enterprises in Slovakia. Sustainability 2021, 13, 581. [Google Scholar] [CrossRef]
  19. Xiao, F.; Hu, Z.-H.; Wang, K.-X.; Fu, P.-H. Spatial distribution of energy consumption and carbon emission of regional logistics. Sustainability 2015, 7, 9140. [Google Scholar] [CrossRef]
  20. Akram, M.W.; Hafeez, M.; Yang, S.; Sethi, N.; Mahar, S.; Salahodjaev, R. Asian logistics industry efficiency under low carbon environment: Policy implications for sustainable development. Environ. Sci. Pollut. Res. 2023, 30, 59793. [Google Scholar] [CrossRef] [PubMed]
  21. Aydin, B.; Stecuła, K.; Olczak, P.; Kulpa, J.; Stecuła, B. Exploring the Green Horizon: Recent Research on Renewable Energy in Poland—A Review. Energies 2025, 18, 1695. [Google Scholar] [CrossRef]
  22. Li, M.; Wang, J. Spatial-temporal evolution and influencing factors of total factor productivity in China’s logistics industry under low-carbon constraints. Environ. Sci. Pollut. Res. 2022, 29, 883. [Google Scholar] [CrossRef] [PubMed]
  23. Wang, C.; Ibrahim, H.; Wu, F.; Chang, W. Spatial and temporal evolution patterns and spatial spillover effects of carbon emissions in China in the context of digital economy. J. Environ. Manag. 2025, 373, 123811. [Google Scholar] [CrossRef]
  24. Yao, H.; Yu, X.; Mao, H.; Bai, D.; Zhang, S. The spatial spillover impact and transmission mechanisms of logistics agglomeration on eco-efficiency: A case study in China. Energy 2024, 308, 132826. [Google Scholar] [CrossRef]
  25. Zhang, H.; You, J.; Haiyirete, X.; Zhang, T. Measuring logistics efficiency in China considering technology heterogeneity and carbon emission through a meta-frontier model. Sustainability 2020, 12, 8157. [Google Scholar] [CrossRef]
  26. Li, R.; Li, L.; Wang, Q. The impact of energy efficiency on carbon emissions: Evidence from the transportation sector in Chinese 30 provinces. Sustain. Cities Soc. 2022, 82, 103880. [Google Scholar] [CrossRef]
  27. Huisingh, D.; Zhang, Z.; Moore, J.C.; Qiao, Q.; Li, Q. Recent advances in carbon emissions reduction: Policies, technologies, monitoring, assessment and modeling. J. Clean. Prod. 2015, 103, 1. [Google Scholar] [CrossRef]
  28. Kaack, L.H.; Vaishnav, P.; Morgan, M.G.; Azevedo, I.L.; Rai, S. Decarbonizing intraregional freight systems with a focus on modal shift. Environ. Res. Lett. 2018, 13, 083001. [Google Scholar] [CrossRef]
  29. Kumar, D.; Sharma, R. Plasmonic Nanosensors for Detection of Aqueous Toxic Metals; CRC Press: Boca Raton, FL, USA, 2022. [Google Scholar]
  30. Wang, B.; Tian, Y. Green and low-carbon efficiency assessment of urban agglomeration logistics industry: Evidence from China’s beijing-tianjin-hebei metropolitan area (2008–2020). Sustainability 2023, 15, 11833. [Google Scholar] [CrossRef]
  31. Du, Y.; Xu, J.; Yuan, X. The development relationship between circular economy and advanced digital technology: Based on an innovative literature review method. Environ. Technol. Rev. 2024, 13, 614. [Google Scholar] [CrossRef]
  32. Ojadi, J.O.; Odionu, C.; Onukwulu, E.; Owulade, O. Big data analytics and AI for optimizing supply chain sustainability and reducing greenhouse gas emissions in logistics and transportation. Int. J. Multidiscip. Res. Growth Eval. 2024, 5, 1536. [Google Scholar] [CrossRef]
  33. Bekrar, A.; Ait El Cadi, A.; Todosijevic, R.; Sarkis, J. Digitalizing the closing-of-the-loop for supply chains: A transportation and blockchain perspective. Sustainability. 2021, 13, 2895. [Google Scholar] [CrossRef]
  34. Nitsche, B.; Straube, F. Current State and Future of International Logistics Networks—The Role of Digitalization and Sustainability in a Globalized World. Logistics 2023, 7, 83. [Google Scholar] [CrossRef]
  35. Herold, D.M.; Lee, K.-H. Carbon management in the logistics and transportation sector: An overview and new research directions. Carbon Manag. 2017, 8, 79. [Google Scholar] [CrossRef]
  36. Yan, B.; Yao, B.; Zhang, C. Industrial structure, high-quality development of logistics industry and the economy. PLoS ONE 2023, 18, e0285229. [Google Scholar] [CrossRef]
  37. Kang, X.; Chen, L.; Wang, Y.; Liu, W. Analysis on the spatial correlation network and driving factors of carbon emissions in China’s logistics industry. J. Environ. Manag. 2024, 366, 121916. [Google Scholar] [CrossRef] [PubMed]
  38. Riviere, M. Drivers and Outcomes of Communicating Sustainability on Supply Chain: A Systematic Literature Review. Master’s Thesis, Ca’ Foscari University, Venice, Italy, 2024. [Google Scholar]
  39. Zhou, L.; Zhou, C.; Che, L.; Wang, B. Spatio-temporal evolution and influencing factors of urban green development efficiency in China. J. Geogr. Sci. 2020, 30, 724. [Google Scholar] [CrossRef]
  40. Tone, K.; Chang, T.-S.; Wu, C.-H. Handling negative data in slacks-based measure data envelopment analysis models. Eur. J. Oper. Res. 2020, 282, 926. [Google Scholar] [CrossRef]
  41. Tone, K. A slacks-based measure of super-efficiency in data envelopment analysis. Eur. J. Oper. Res. 2002, 143, 32. [Google Scholar] [CrossRef]
  42. Tone, K. A slacks-based measure of efficiency in data envelopment analysis. Eur. J. Oper. Res. 2001, 130, 498. [Google Scholar] [CrossRef]
  43. Chen, B.; Liu, F.; Gao, Y.; Ye, C. Spatial and temporal evolution of green logistics efficiency in China and analysis of its motivation. Environ. Dev. Sustain. 2024, 26, 2743. [Google Scholar] [CrossRef]
  44. Cui, Y.; Zou, X.; Zhao, Y.; Fu, X.; Shen, Y. A novel power system-electricity-carbon integrated demand response scheduling method considering dynamic electric-carbon emission factors. Electr. Power Autom. Equip. 2024, 44, 10. [Google Scholar]
  45. Oh, D.-H. A global Malmquist-Luenberger productivity index. J. Product. Anal. 2010, 34, 183. [Google Scholar] [CrossRef]
  46. Lacouture, Y.; Cousineau, D. How to use MATLAB to fit the ex-Gaussian and other probability functions to a distribution of response times. Tutor. Quant. Methods Psychol. 2008, 4, 35. [Google Scholar] [CrossRef]
  47. Beardah, C.C.; Baxter, M.J. MATLAB routines for kernel density estimation and the graphical representation of archaeological data. Anelecta Prehist. Leiden. 1955, 28, 179–184. [Google Scholar]
  48. Chen, Y. New approaches for calculating Moran’s index of spatial autocorrelation. PLoS ONE 2013, 8, e68336. [Google Scholar] [CrossRef] [PubMed]
  49. Kelejian, H.H.; Prucha, I.R. On the asymptotic distribution of the Moran I test statistic with applications. J. Econom. 2001, 104, 219. [Google Scholar] [CrossRef]
  50. Mur, J.; Angulo, A. The spatial Durbin model and the common factor tests. Spat. Econ. Anal. 2006, 1, 207. [Google Scholar] [CrossRef]
  51. Anselin, L. Spatial Econometrics: Methods and Models; Springer Science & Business Media: New York, NY, USA, 1988. [Google Scholar]
  52. Lesage, J. Spatial Econometrics; Edward Elgar Publishing: Cheltenham, UK, 2015. [Google Scholar]
  53. Breusch, T.S.; Pagan, A.R. The Lagrange multiplier test and its applications to model specification in econometrics. Rev. Econ. Stud. 1980, 47, 239. [Google Scholar] [CrossRef]
  54. Gregory, A.W.; Veall, M.R. Formulating Wald tests of nonlinear restrictions. Econom. J. Econom. Soc. 1985, 53, 1465–1468. [Google Scholar] [CrossRef]
  55. Pace, R.K.; Lesage, J.P. A spatial Hausman test. Econ. Lett. 2008, 101, 282. [Google Scholar] [CrossRef]
  56. Engle, R.F. Wald, likelihood ratio, and Lagrange multiplier tests in econometrics. Handb. Econom. 1984, 2, 775. [Google Scholar]
  57. Chong, C.H.; Zhou, X.; Zhang, Y.; Ma, L.; Bhutta, M.S.; Li, Z.; Ni, W. LMDI decomposition of coal consumption in China based on the energy allocation diagram of coal flows: An update for 2005–2020 with improved sectoral resolutions. Energy 2023, 285, 129266. [Google Scholar] [CrossRef]
  58. Lesage, J.P.; Pace, R.K. Spatial Econometric Models; Springer: London, UK, 2009. [Google Scholar]
  59. Elhorst, J.P.; Fréret, S. Evidence of political yardstick competition in France using a two-regime spatial Durbin model with fixed effects. J. Reg. Sci. 2009, 49, 931. [Google Scholar] [CrossRef]
Figure 1. Method application flow.
Atmosphere 16 00929 g001
Figure 2. Flowchart of DEA measurement.
Atmosphere 16 00929 g002
Figure 3. Mean values of LCEE measures by region.
Atmosphere 16 00929 g003
Figure 4. Efficiency measures for the three regions.
Atmosphere 16 00929 g004
Figure 5. Distribution of LCEE averages over 10 years.
Atmosphere 16 00929 g005
Figure 6. Distribution of LCEE in 2013, 2016, 2019, and 2022.
Atmosphere 16 00929 g006aAtmosphere 16 00929 g006b
Figure 7. Area-wide kernel density analysis.
Atmosphere 16 00929 g007
Figure 8. Eastern, central, and western regions nuclear density analysis.
Atmosphere 16 00929 g008
Figure 9. Localized Moran’s index in different regions; 2013, 2016, 2019, 2022.
Atmosphere 16 00929 g009aAtmosphere 16 00929 g009b
Table 1. Input and output indicator system.
Level 1 IndicatorsLevel 2 Indicators
InputsCapital inputsInvestment in Fixed Assets in Logistics Industry (CNY 100 million)
Labor inputsNumber of Employees in Logistics Industry (10,000)
Energy inputsEnergy Consumption in Logistics Industry (10,000 tons of standard coal)
OutputsDesired outputsValue Added of Logistics Industry (CNY 100 million)
Social Freight Turnover (100 million tons of kilometers)
Undesired outputsCarbon Emission in Logistics Industry (10,000 tons)
Table 2. Digital transformation indicator system.
Level 1 IndicatorsSecondary IndicatorsDescription of IndicatorsUnitWeights
Digital infrastructureDegree of Internet penetrationNumber of Internet broadband access portsmillion0.0305
Number of Internet broadband access usersmillion households0.0339
Number of Internet domain namesmillion0.0699
Degree of cell phone penetrationDensity of cell phone base stationsunits/square kilometer0.087
Mobile phone penetration rateunits/hundred0.0145
Digital industrializationSoftware and information technology servicesSoftware business revenue as a share of GDP%0.0755
Number of employees in the information transmission, software and information technology service industrymillion0.0652
Level of development of electronic information manufacturingInformation technology service revenue as a share of GDP%0.0819
Total telecommunication business as a share of GDPmillion0.0443
Total telecommunication business per capitaYuan/person0.0739
Level of development of post and telecommunicationsTotal postal business per capitaYuan/person0.0344
E-commerce transaction turnover of enterprisesbillion0.0724
Digitization of industryDegree of development of enterprise digitizationE-commerce transaction activities proportion of active enterprises%0.0147
Number of computers used by enterprises per hundred peoplepeople0.0222
Number of websites per hundred enterprisesunits0.0059
Digital inclusive financeDigital Inclusive Finance Index/0.015
Digital innovation capacityLevel of development of research and experimentationNumber of R&D projects (issues) of industrial enterprises above scaleitems0.0799
Technological innovation capacityTotal transaction value of technology contractsmillion0.1007
Number of patent applications authorizedpieces0.0782
Data sources: China Provincial Statistical Yearbooks, provincial statistical yearbooks, Peking University Digital Finance Research Center, and all data are publicly available.
Table 3. Results of descriptive statistics.
VariableObsMeanStd. Dev.MinMax
LCEE3000.33960.21030.09721.0637
ES3000.35590.14420.00560.6664
DT3000.18020.10470.05390.5673
EDL30062,662.8831,082.5922,089.10189,988.00
UL3000.61410.11370.37890.8958
AIS3001.42160.75670.66535.2440
PD300474.2257713.52077.90743951.4760
Table 4. Measurement results of LCEE.
RegionProvince2013201420152016201720182019202020212022MeanSort by Mean
Eastern
Region
Beijing0.1190.1080.0970.1390.3721.0011.0200.2520.3280.2430.36810
Tianjin0.5130.5320.4250.4310.4620.4790.4740.4690.7811.0470.5614
Hebei0.6860.6490.5890.5590.6010.5250.4990.5861.0590.9210.6672
Liaoning0.2010.2020.2410.3190.3640.3590.3400.2500.2260.2100.27118
Shanghai0.4810.6160.5250.5330.6300.7450.8061.0071.0450.9370.7321
Jiangsu0.3390.3360.2680.2400.2500.2410.2580.2920.5280.4630.32113
Zhejiang0.3530.3550.3490.3440.3400.3680.3790.3530.5900.6100.4049
Fujian0.3530.3660.3810.4200.4320.4530.4360.4350.7110.7280.4727
Shandong0.2350.2390.2410.2420.2700.2680.2650.2440.4590.5140.29815
Guangdong0.2680.3550.3510.4380.4630.4650.4740.4291.0110.9480.5206
Hainan0.1740.2450.2310.2320.1860.2200.3630.4840.8781.0640.4088
Central
Region
Shanxi0.1700.1710.1850.1830.2050.2020.2040.2130.2770.2660.20823
Inner Mongolia0.1850.2190.2260.2300.2660.2770.2570.2410.2930.2930.24920
Jilin0.1770.1680.1470.1370.1180.1260.1270.1390.1680.1370.14429
Heilongjiang0.1270.1270.1280.1250.1300.1090.1010.1010.1190.1240.11930
Anhui1.0091.0030.5770.5540.5220.5740.5270.4960.7010.6850.6653
Jiangxi0.3270.3020.2860.2930.3370.3730.3510.3270.5130.5390.36511
Henan0.3850.4210.4000.4280.4470.5060.5240.4580.8621.0400.5475
Hubei0.2440.2710.2750.2920.3180.3050.2970.2220.4590.4830.31714
Hunan0.3500.3610.3610.4180.4190.4040.2550.2460.3810.3780.35712
Guangxi0.2470.2600.2880.3050.3010.2840.2350.2500.3340.3390.28416
Western
Region
Chongqing0.2390.2440.2440.2590.2720.3000.3060.2840.3520.3100.28117
Sichuan0.1190.1440.1430.1550.1850.2090.1920.1920.2690.2810.18925
Guizhou0.1670.1840.1800.1850.2060.1740.1420.1370.1670.1560.17027
Yunnan0.1570.1650.1950.2130.2210.2370.1820.1750.3330.4020.22822
Shaanxi0.2270.2450.2360.2440.2330.2120.1980.2320.2850.3060.24221
Gansu0.2810.2580.2400.2250.2440.2510.2600.2340.2480.2960.25419
Qinghai0.1910.2260.2120.2010.1570.1630.1340.1320.1510.1740.17426
Ningxia0.2600.2430.2280.2290.2000.1830.1780.2160.1610.1710.20724
Xinjiang0.1390.1530.1570.1620.1800.2220.1880.1450.1570.1890.16928
National Average0.29070.2910.3060.2800.2910.3110.3410.3320.3080.4610.475
Table 5. The GML index and decomposition of the three regions.
RegionEastern RegionCentral RegionWestern Region
TypeGMLECTCGMLECTCGMLECTC
Time
2013–20141.1271.03021.0941.06161.24750.8511.08770.98961.0992
2014–20150.94210.99450.94731.00251.02020.98261.01391.02970.9846
2015–20161.05471.02771.02631.03571.0031.03261.04560.98391.0628
2016–20171.13141.01321.11661.02530.98081.04541.05870.95281.1112
2017–20181.00610.9911.01521.01480.99161.02351.06021.08990.9727
2018–20191.00311.05080.95460.94490.99550.94920.94471.87110.5049
2019–20200.99321.02420.96970.92750.99360.93340.96781.00490.9631
2020–20211.46161.0171.43721.6851.00221.68121.30410.99411.3118
2021–20220.98781.02150.9671.30431.0121.28892.09061.00032.0898
Average Values1.07861.01891.05871.11131.02741.08751.17481.10181.1222
Table 6. Moran’s I and p-values for logistics carbon-emission efficiency (2013–2022): positive Moran’s I signals spatial clustering, while p-values < 0.05 reject the null of spatial randomness.
YearsMoran’s Ip-ValueYearsMoran’s Ip-Value
20130.0910.11920180.1890.006
20140.0760.17220190.2080.003
20150.0410.35320200.1710.011
20160.0440.34120210.270.000
20170.1540.02120220.2180.002
Table 7. Results of model selection tests.
Testing MethodStatisticTesting MethodStatistic
LM (lag) test6.719 ***lr_both_ind25.83 ***
Robust LM (lag) test0.53lr_both_time336.9 ***
LM (error) Moran−61,000Wald_spatial_lag16.91 ***
LM (error) test11.615 ***LR_spatial_lag16.41 **
Robust LM (error) test5.431 **Wald_spatial_error16.72 **
Hausman test70.4 ***LR_spatial_error16.36 **
Note: *** indicate p < 0.01, ** indicate p < 0.05.
Table 8. Multicollinearity test results.
Variableln LCEEln ESln DTln EDLln ULln AIS
VIF3.213.248.024.832.691.48
1/VIF0.31140.30850.12470.20690.37210.6773
Table 9. Spatial measurement regression results.
VariableTwo-Way Fixed Effects
Mainln LCEE−0.2767 ***
ln ES−0.3076 **
ln DT0.9294 **
ln EDL−2.4430 ***
ln UL0.8726 ***
ln AIS2.5289 ***
Wxln LCEE−0.3915 ***
ln ES0.8105 ***
ln DT−1.4593
ln EDL1.9143
ln UL0.3358
ln AIS2.3886
R-square0.3579
rho−0.1892 **
Log-likelihood64.0475
Note: *** indicate p < 0.01, ** indicate p < 0.05.
Table 10. Decomposition results for spillover effects.
VariableDirect EffectIndirect EffectTotal Effect
Nationwideln ES−0.2658 ***−0.2942 **−0.5600 ***
ln DT−0.3332 ***0.7477 ***0.4145 *
Easternln ES−0.1904−0.4068 **−0.5973 ***
ln DT−0.31550.1475−0.1680
Centralln ES0.07611.3863 **1.4624 *
ln DT−0.00210.56790.5658
Westernln ES0.6394 ***−1.5142 ***−0.8748
ln DT−0.3171 **0.7110 *0.3939
Note: *** indicate p < 0.01, ** indicate p < 0.05, * indicate p < 0.1.
Disclaimer/Publisher’s Note: The statements, opinions and data contained in all publications are solely those of the individual author(s) and contributor(s) and not of MDPI and/or the editor(s). MDPI and/or the editor(s) disclaim responsibility for any injury to people or property resulting from any ideas, methods, instructions or products referred to in the content.

