Exploring the Role of Energy Consumption Structure and Digital Transformation in Urban Logistics Carbon Emission Efficiency
Abstract
1. Introduction
2. Literature Review
2.1. Connotation and Measurement of LCEE
2.2. Research on the Spatial and Temporal Evolution of LCEE
2.3. Research on the Influencing Factors of LCEE
2.4. Research Questions, Ideas, and Implications
3. Methodology
3.1. Measurement Methods of LCEE
3.1.1. Super-SBM Model
3.1.2. GML Index Decomposition
3.2. Analysis of Spatial and Temporal Evolution
3.3. Impact of Digital Transformation and Energy Mix on Logistics Carbon Efficiency Based on Spatial Measurement
3.3.1. Spatial Correlation Analysis
3.3.2. Spatial Metrology Analysis Methods
3.3.3. Variable Selection and Model Construction
- (1)
- Explained Variables
- (2)
- Core Explanatory Variables
- (3)
- Control variables
4. Results
4.1. Measurement Results of LCEE
4.2. Decomposition of GML Index for LCEE
4.3. Spatio-Temporal Distribution
4.4. Analysis of Spatial Effects
4.4.1. Spatial Correlation Test
4.4.2. Spatial Model Selection
4.4.3. Multiple Covariance Test
4.4.4. Spatial Durbin Model Results
4.4.5. Decomposition Effects of Spillovers
4.5. Discussion
5. Conclusions and Suggestions
5.1. Conclusions
- (1)
- Spatial Heterogeneity of LCEE: The overall LCEE in China shows a spatial pattern of “high in the east and low in the west”, with significant regional differences. The eastern region has higher LCEE due to better infrastructure and technological capabilities, while the western region lags behind.
- (2)
- Temporal Trends in LCEE: LCEE has shown an overall upward trend over the past decade, with a decline in 2020 due to COVID-19 but a rapid recovery afterward. The growth rate of LCEE decreases from east to west, indicating uneven development across regions.
- (3)
- Technological Progress as a Key Driver: Technological progress is the primary factor driving the improvement of LCEE nationwide. The eastern region benefits significantly from technological advancements, while the central and western regions also show improvements driven by technology.
- (4)
- Spatial Dependence and Spillover Effects: LCEE exhibits significant spatial dependence, with energy consumption structure showing a negative spillover effect and digital transformation showing a positive spillover effect. Regional cooperation and the diffusion of digital technologies can enhance overall logistics carbon emission efficiency.
5.2. Recommendations
5.2.1. Strengthen Regional Policy Coordination and Promote Balanced Development of Logistics Carbon Emissions
Government Actions and Implementation
Expected Outcomes and Conclusion Basis
5.2.2. Accelerate the Digital Transformation of Enterprises and Optimize Green Logistics Resource Allocation
Enterprise Actions and Implementation
Expected Outcomes and Conclusion Basis
5.2.3. Strengthen Regional Cooperation and Establish a National Green Logistics System
Government Actions and Implementation
Expected Outcomes and Conclusion Basis
5.2.4. Promote Technological Innovation and Policy Support for Energy Structure Optimization
Government Actions and Implementation
Expected Outcomes and Conclusion Basis
Author Contributions
Funding
Institutional Review Board Statement
Informed Consent Statement
Data Availability Statement
Conflicts of Interest
References
- Xu, B.; Xu, R. Assessing the role of environmental regulations in improving energy efficiency and reducing CO2 emissions: Evidence from the logistics industry. Environ. Impact Assess. Rev. 2022, 96, 106831. [Google Scholar] [CrossRef]
- Portillo Juan, N.; Negro Valdecantos, V.; Olalde Rodríguez, J.; Iglesias, G. Environmental Policy vs. the Reality of Greenhouse Gas Emissions from Top Emitting Countries. Energies 2024, 17, 5705. [Google Scholar] [CrossRef]
- Subramoniam, R.; Huisingh, D.; Sundin, E.; Chinnam, R.B.; Bayulken, B.; Gaur, J.; Govindan, K.; Viegas, C. Special Issue Editorial: Supply Chain Planning & Management Challenges and Opportunities Driven by Climate Change and Other Disruptions and How to Accelerate Societal Transition to Equitable, Sustainable and Livable Societies; Elsevier: Amsterdam, The Netherlands, 2024. [Google Scholar]
- Bugarčić, F.Ž.; Mićić, V.; Stanišić, N. The role of logistics in economic growth and global competitiveness. Zb. Rad. Ekon. Fak. U Rij. 2023, 41, 499. [Google Scholar] [CrossRef]
- Mckinnon, A.C.; Piecyk, M. Setting targets for reducing carbon emissions from logistics: Current practice and guiding principles. Carbon Manag. 2012, 3, 629. [Google Scholar] [CrossRef]
- Lopes De Sousa Jabbour, A.B.; Chiappetta Jabbour, C.J.; Sarkis, J.; Latan, H.; Roubaud, D.; Godinho Filho, M.; Queiroz, M. Fostering low-carbon production and logistics systems: Framework and empirical evidence. Int. J. Prod. Res. 2021, 59, 7106. [Google Scholar] [CrossRef]
- Verbivska, L.; Zhygalkevych, Z.; Fisun, Y.; Chobitok, I.; Shvedkyi, V. Digital technologies as a tool of efficient logistics. Rev. De La Univ. Del Zulia 2023, 14, 492. [Google Scholar] [CrossRef]
- Gan, M.; Yang, S.; Li, D.; Wang, M.; Chen, S.; Xie, R.; Liu, J. A novel intensive distribution logistics network design and profit allocation problem considering sharing economy. Complexity 2018, 2018, 4678358. [Google Scholar] [CrossRef]
- Xiao, R.; Pan, L.; Xiao, H.; Xiao, H.; Zhu, Z. Research of intelligent logistics and high-quality economy development for Yangtze River cold chain shipping based on carbon neutrality. J. Mar. Sci. Eng. 2022, 10, 1029. [Google Scholar] [CrossRef]
- Zhou, F.; Yu, K.; Xie, W.; Lyu, J.; Zheng, Z.; Zhou, S. Digital twin-enabled smart maritime logistics management in the context of industry 5.0. IEEE Access 2024, 12, 10920. [Google Scholar] [CrossRef]
- Huang, Y.; Hu, M.; Xu, J.; Jin, Z. Digital transformation and carbon intensity reduction in transportation industry: Empirical evidence from a global perspective. J. Environ. Manag. 2023, 344, 118541. [Google Scholar] [CrossRef]
- Xu, Y.; Jia, F.; Chen, L.; Wang, Y. Does digital transformation foster carbon emissions reduction? Evidence from China’s manufacturing supply chain. Int. J. Logist. Manag. 2024, 35, 1827. [Google Scholar] [CrossRef]
- Mutambik, I. Digital Transformation as a Driver of Sustainability Performance—A Study from Freight and Logistics Industry. Sustainability 2024, 16, 4310. [Google Scholar] [CrossRef]
- Mckinnon, A. Green logistics: The carbon agenda. Electron. Sci. J. Logist. 2010, 6, 1–9. [Google Scholar]
- Wong, E.Y.; Tai, A.H.; Zhou, E. Optimising truckload operations in third-party logistics: A carbon footprint perspective in volatile supply chain. Transp. Res. Part D Transp. Environ. 2018, 63, 649. [Google Scholar] [CrossRef]
- Jiang, X.; Ma, J.; Zhu, H.; Guo, X.; Huang, Z. Evaluating the carbon emissions efficiency of the logistics industry based on a Super-SBM Model and the Malmquist Index from a strong transportation strategy perspective in China. Int. J. Environ. Res. Public Health 2020, 17, 8459. [Google Scholar] [CrossRef] [PubMed]
- Cheng, C.; Han, Y.; Ren, X. Analysis of technological innovation on provincial green development levels of logistics industry in China. Environ. Sci. Pollut. Res. 2023, 30, 53020. [Google Scholar] [CrossRef]
- Richnák, P.; Gubová, K. Green and reverse logistics in conditions of sustainable development in enterprises in Slovakia. Sustainability 2021, 13, 581. [Google Scholar] [CrossRef]
- Xiao, F.; Hu, Z.-H.; Wang, K.-X.; Fu, P.-H. Spatial distribution of energy consumption and carbon emission of regional logistics. Sustainability 2015, 7, 9140. [Google Scholar] [CrossRef]
- Akram, M.W.; Hafeez, M.; Yang, S.; Sethi, N.; Mahar, S.; Salahodjaev, R. Asian logistics industry efficiency under low carbon environment: Policy implications for sustainable development. Environ. Sci. Pollut. Res. 2023, 30, 59793. [Google Scholar] [CrossRef] [PubMed]
- Aydin, B.; Stecuła, K.; Olczak, P.; Kulpa, J.; Stecuła, B. Exploring the Green Horizon: Recent Research on Renewable Energy in Poland—A Review. Energies 2025, 18, 1695. [Google Scholar] [CrossRef]
- Li, M.; Wang, J. Spatial-temporal evolution and influencing factors of total factor productivity in China’s logistics industry under low-carbon constraints. Environ. Sci. Pollut. Res. 2022, 29, 883. [Google Scholar] [CrossRef] [PubMed]
- Wang, C.; Ibrahim, H.; Wu, F.; Chang, W. Spatial and temporal evolution patterns and spatial spillover effects of carbon emissions in China in the context of digital economy. J. Environ. Manag. 2025, 373, 123811. [Google Scholar] [CrossRef]
- Yao, H.; Yu, X.; Mao, H.; Bai, D.; Zhang, S. The spatial spillover impact and transmission mechanisms of logistics agglomeration on eco-efficiency: A case study in China. Energy 2024, 308, 132826. [Google Scholar] [CrossRef]
- Zhang, H.; You, J.; Haiyirete, X.; Zhang, T. Measuring logistics efficiency in China considering technology heterogeneity and carbon emission through a meta-frontier model. Sustainability 2020, 12, 8157. [Google Scholar] [CrossRef]
- Li, R.; Li, L.; Wang, Q. The impact of energy efficiency on carbon emissions: Evidence from the transportation sector in Chinese 30 provinces. Sustain. Cities Soc. 2022, 82, 103880. [Google Scholar] [CrossRef]
- Huisingh, D.; Zhang, Z.; Moore, J.C.; Qiao, Q.; Li, Q. Recent advances in carbon emissions reduction: Policies, technologies, monitoring, assessment and modeling. J. Clean. Prod. 2015, 103, 1. [Google Scholar] [CrossRef]
- Kaack, L.H.; Vaishnav, P.; Morgan, M.G.; Azevedo, I.L.; Rai, S. Decarbonizing intraregional freight systems with a focus on modal shift. Environ. Res. Lett. 2018, 13, 083001. [Google Scholar] [CrossRef]
- Kumar, D.; Sharma, R. Plasmonic Nanosensors for Detection of Aqueous Toxic Metals; CRC Press: Boca Raton, FL, USA, 2022. [Google Scholar]
- Wang, B.; Tian, Y. Green and low-carbon efficiency assessment of urban agglomeration logistics industry: Evidence from China’s beijing-tianjin-hebei metropolitan area (2008–2020). Sustainability 2023, 15, 11833. [Google Scholar] [CrossRef]
- Du, Y.; Xu, J.; Yuan, X. The development relationship between circular economy and advanced digital technology: Based on an innovative literature review method. Environ. Technol. Rev. 2024, 13, 614. [Google Scholar] [CrossRef]
- Ojadi, J.O.; Odionu, C.; Onukwulu, E.; Owulade, O. Big data analytics and AI for optimizing supply chain sustainability and reducing greenhouse gas emissions in logistics and transportation. Int. J. Multidiscip. Res. Growth Eval. 2024, 5, 1536. [Google Scholar] [CrossRef]
- Bekrar, A.; Ait El Cadi, A.; Todosijevic, R.; Sarkis, J. Digitalizing the closing-of-the-loop for supply chains: A transportation and blockchain perspective. Sustainability. 2021, 13, 2895. [Google Scholar] [CrossRef]
- Nitsche, B.; Straube, F. Current State and Future of International Logistics Networks—The Role of Digitalization and Sustainability in a Globalized World. Logistics 2023, 7, 83. [Google Scholar] [CrossRef]
- Herold, D.M.; Lee, K.-H. Carbon management in the logistics and transportation sector: An overview and new research directions. Carbon Manag. 2017, 8, 79. [Google Scholar] [CrossRef]
- Yan, B.; Yao, B.; Zhang, C. Industrial structure, high-quality development of logistics industry and the economy. PLoS ONE 2023, 18, e0285229. [Google Scholar] [CrossRef]
- Kang, X.; Chen, L.; Wang, Y.; Liu, W. Analysis on the spatial correlation network and driving factors of carbon emissions in China’s logistics industry. J. Environ. Manag. 2024, 366, 121916. [Google Scholar] [CrossRef] [PubMed]
- Riviere, M. Drivers and Outcomes of Communicating Sustainability on Supply Chain: A Systematic Literature Review. Master’s Thesis, Ca’ Foscari University, Venice, Italy, 2024. [Google Scholar]
- Zhou, L.; Zhou, C.; Che, L.; Wang, B. Spatio-temporal evolution and influencing factors of urban green development efficiency in China. J. Geogr. Sci. 2020, 30, 724. [Google Scholar] [CrossRef]
- Tone, K.; Chang, T.-S.; Wu, C.-H. Handling negative data in slacks-based measure data envelopment analysis models. Eur. J. Oper. Res. 2020, 282, 926. [Google Scholar] [CrossRef]
- Tone, K. A slacks-based measure of super-efficiency in data envelopment analysis. Eur. J. Oper. Res. 2002, 143, 32. [Google Scholar] [CrossRef]
- Tone, K. A slacks-based measure of efficiency in data envelopment analysis. Eur. J. Oper. Res. 2001, 130, 498. [Google Scholar] [CrossRef]
- Chen, B.; Liu, F.; Gao, Y.; Ye, C. Spatial and temporal evolution of green logistics efficiency in China and analysis of its motivation. Environ. Dev. Sustain. 2024, 26, 2743. [Google Scholar] [CrossRef]
- Cui, Y.; Zou, X.; Zhao, Y.; Fu, X.; Shen, Y. A novel power system-electricity-carbon integrated demand response scheduling method considering dynamic electric-carbon emission factors. Electr. Power Autom. Equip. 2024, 44, 10. [Google Scholar]
- Oh, D.-H. A global Malmquist-Luenberger productivity index. J. Product. Anal. 2010, 34, 183. [Google Scholar] [CrossRef]
- Lacouture, Y.; Cousineau, D. How to use MATLAB to fit the ex-Gaussian and other probability functions to a distribution of response times. Tutor. Quant. Methods Psychol. 2008, 4, 35. [Google Scholar] [CrossRef]
- Beardah, C.C.; Baxter, M.J. MATLAB routines for kernel density estimation and the graphical representation of archaeological data. Anelecta Prehist. Leiden. 1955, 28, 179–184. [Google Scholar]
- Chen, Y. New approaches for calculating Moran’s index of spatial autocorrelation. PLoS ONE 2013, 8, e68336. [Google Scholar] [CrossRef] [PubMed]
- Kelejian, H.H.; Prucha, I.R. On the asymptotic distribution of the Moran I test statistic with applications. J. Econom. 2001, 104, 219. [Google Scholar] [CrossRef]
- Mur, J.; Angulo, A. The spatial Durbin model and the common factor tests. Spat. Econ. Anal. 2006, 1, 207. [Google Scholar] [CrossRef]
- Anselin, L. Spatial Econometrics: Methods and Models; Springer Science & Business Media: New York, NY, USA, 1988. [Google Scholar]
- Lesage, J. Spatial Econometrics; Edward Elgar Publishing: Cheltenham, UK, 2015. [Google Scholar]
- Breusch, T.S.; Pagan, A.R. The Lagrange multiplier test and its applications to model specification in econometrics. Rev. Econ. Stud. 1980, 47, 239. [Google Scholar] [CrossRef]
- Gregory, A.W.; Veall, M.R. Formulating Wald tests of nonlinear restrictions. Econom. J. Econom. Soc. 1985, 53, 1465–1468. [Google Scholar] [CrossRef]
- Pace, R.K.; Lesage, J.P. A spatial Hausman test. Econ. Lett. 2008, 101, 282. [Google Scholar] [CrossRef]
- Engle, R.F. Wald, likelihood ratio, and Lagrange multiplier tests in econometrics. Handb. Econom. 1984, 2, 775. [Google Scholar]
- Chong, C.H.; Zhou, X.; Zhang, Y.; Ma, L.; Bhutta, M.S.; Li, Z.; Ni, W. LMDI decomposition of coal consumption in China based on the energy allocation diagram of coal flows: An update for 2005–2020 with improved sectoral resolutions. Energy 2023, 285, 129266. [Google Scholar] [CrossRef]
- Lesage, J.P.; Pace, R.K. Spatial Econometric Models; Springer: London, UK, 2009. [Google Scholar]
- Elhorst, J.P.; Fréret, S. Evidence of political yardstick competition in France using a two-regime spatial Durbin model with fixed effects. J. Reg. Sci. 2009, 49, 931. [Google Scholar] [CrossRef]






| Level 1 Indicators | Level 2 Indicators | |
|---|---|---|
| Inputs | Capital inputs | Investment in Fixed Assets in Logistics Industry (CNY 100 million) |
| Labor inputs | Number of Employees in Logistics Industry (10,000) | |
| Energy inputs | Energy Consumption in Logistics Industry (10,000 tons of standard coal) | |
| Outputs | Desired outputs | Value Added of Logistics Industry (CNY 100 million) |
| Social Freight Turnover (100 million tons of kilometers) | ||
| Undesired outputs | Carbon Emission in Logistics Industry (10,000 tons) |
| Level 1 Indicators | Secondary Indicators | Description of Indicators | Unit | Weights |
|---|---|---|---|---|
| Digital infrastructure | Degree of Internet penetration | Number of Internet broadband access ports | million | 0.0305 |
| Number of Internet broadband access users | million households | 0.0339 | ||
| Number of Internet domain names | million | 0.0699 | ||
| Degree of cell phone penetration | Density of cell phone base stations | units/square kilometer | 0.087 | |
| Mobile phone penetration rate | units/hundred | 0.0145 | ||
| Digital industrialization | Software and information technology services | Software business revenue as a share of GDP | % | 0.0755 |
| Number of employees in the information transmission, software and information technology service industry | million | 0.0652 | ||
| Level of development of electronic information manufacturing | Information technology service revenue as a share of GDP | % | 0.0819 | |
| Total telecommunication business as a share of GDP | million | 0.0443 | ||
| Total telecommunication business per capita | Yuan/person | 0.0739 | ||
| Level of development of post and telecommunications | Total postal business per capita | Yuan/person | 0.0344 | |
| E-commerce transaction turnover of enterprises | billion | 0.0724 | ||
| Digitization of industry | Degree of development of enterprise digitization | E-commerce transaction activities proportion of active enterprises | % | 0.0147 |
| Number of computers used by enterprises per hundred people | people | 0.0222 | ||
| Number of websites per hundred enterprises | units | 0.0059 | ||
| Digital inclusive finance | Digital Inclusive Finance Index | / | 0.015 | |
| Digital innovation capacity | Level of development of research and experimentation | Number of R&D projects (issues) of industrial enterprises above scale | items | 0.0799 |
| Technological innovation capacity | Total transaction value of technology contracts | million | 0.1007 | |
| Number of patent applications authorized | pieces | 0.0782 |
| Variable | Obs | Mean | Std. Dev. | Min | Max |
|---|---|---|---|---|---|
| LCEE | 300 | 0.3396 | 0.2103 | 0.0972 | 1.0637 |
| ES | 300 | 0.3559 | 0.1442 | 0.0056 | 0.6664 |
| DT | 300 | 0.1802 | 0.1047 | 0.0539 | 0.5673 |
| EDL | 300 | 62,662.88 | 31,082.59 | 22,089.10 | 189,988.00 |
| UL | 300 | 0.6141 | 0.1137 | 0.3789 | 0.8958 |
| AIS | 300 | 1.4216 | 0.7567 | 0.6653 | 5.2440 |
| PD | 300 | 474.2257 | 713.5207 | 7.9074 | 3951.4760 |
| Region | Province | 2013 | 2014 | 2015 | 2016 | 2017 | 2018 | 2019 | 2020 | 2021 | 2022 | Mean | Sort by Mean |
|---|---|---|---|---|---|---|---|---|---|---|---|---|---|
| Eastern Region | Beijing | 0.119 | 0.108 | 0.097 | 0.139 | 0.372 | 1.001 | 1.020 | 0.252 | 0.328 | 0.243 | 0.368 | 10 |
| Tianjin | 0.513 | 0.532 | 0.425 | 0.431 | 0.462 | 0.479 | 0.474 | 0.469 | 0.781 | 1.047 | 0.561 | 4 | |
| Hebei | 0.686 | 0.649 | 0.589 | 0.559 | 0.601 | 0.525 | 0.499 | 0.586 | 1.059 | 0.921 | 0.667 | 2 | |
| Liaoning | 0.201 | 0.202 | 0.241 | 0.319 | 0.364 | 0.359 | 0.340 | 0.250 | 0.226 | 0.210 | 0.271 | 18 | |
| Shanghai | 0.481 | 0.616 | 0.525 | 0.533 | 0.630 | 0.745 | 0.806 | 1.007 | 1.045 | 0.937 | 0.732 | 1 | |
| Jiangsu | 0.339 | 0.336 | 0.268 | 0.240 | 0.250 | 0.241 | 0.258 | 0.292 | 0.528 | 0.463 | 0.321 | 13 | |
| Zhejiang | 0.353 | 0.355 | 0.349 | 0.344 | 0.340 | 0.368 | 0.379 | 0.353 | 0.590 | 0.610 | 0.404 | 9 | |
| Fujian | 0.353 | 0.366 | 0.381 | 0.420 | 0.432 | 0.453 | 0.436 | 0.435 | 0.711 | 0.728 | 0.472 | 7 | |
| Shandong | 0.235 | 0.239 | 0.241 | 0.242 | 0.270 | 0.268 | 0.265 | 0.244 | 0.459 | 0.514 | 0.298 | 15 | |
| Guangdong | 0.268 | 0.355 | 0.351 | 0.438 | 0.463 | 0.465 | 0.474 | 0.429 | 1.011 | 0.948 | 0.520 | 6 | |
| Hainan | 0.174 | 0.245 | 0.231 | 0.232 | 0.186 | 0.220 | 0.363 | 0.484 | 0.878 | 1.064 | 0.408 | 8 | |
| Central Region | Shanxi | 0.170 | 0.171 | 0.185 | 0.183 | 0.205 | 0.202 | 0.204 | 0.213 | 0.277 | 0.266 | 0.208 | 23 |
| Inner Mongolia | 0.185 | 0.219 | 0.226 | 0.230 | 0.266 | 0.277 | 0.257 | 0.241 | 0.293 | 0.293 | 0.249 | 20 | |
| Jilin | 0.177 | 0.168 | 0.147 | 0.137 | 0.118 | 0.126 | 0.127 | 0.139 | 0.168 | 0.137 | 0.144 | 29 | |
| Heilongjiang | 0.127 | 0.127 | 0.128 | 0.125 | 0.130 | 0.109 | 0.101 | 0.101 | 0.119 | 0.124 | 0.119 | 30 | |
| Anhui | 1.009 | 1.003 | 0.577 | 0.554 | 0.522 | 0.574 | 0.527 | 0.496 | 0.701 | 0.685 | 0.665 | 3 | |
| Jiangxi | 0.327 | 0.302 | 0.286 | 0.293 | 0.337 | 0.373 | 0.351 | 0.327 | 0.513 | 0.539 | 0.365 | 11 | |
| Henan | 0.385 | 0.421 | 0.400 | 0.428 | 0.447 | 0.506 | 0.524 | 0.458 | 0.862 | 1.040 | 0.547 | 5 | |
| Hubei | 0.244 | 0.271 | 0.275 | 0.292 | 0.318 | 0.305 | 0.297 | 0.222 | 0.459 | 0.483 | 0.317 | 14 | |
| Hunan | 0.350 | 0.361 | 0.361 | 0.418 | 0.419 | 0.404 | 0.255 | 0.246 | 0.381 | 0.378 | 0.357 | 12 | |
| Guangxi | 0.247 | 0.260 | 0.288 | 0.305 | 0.301 | 0.284 | 0.235 | 0.250 | 0.334 | 0.339 | 0.284 | 16 | |
| Western Region | Chongqing | 0.239 | 0.244 | 0.244 | 0.259 | 0.272 | 0.300 | 0.306 | 0.284 | 0.352 | 0.310 | 0.281 | 17 |
| Sichuan | 0.119 | 0.144 | 0.143 | 0.155 | 0.185 | 0.209 | 0.192 | 0.192 | 0.269 | 0.281 | 0.189 | 25 | |
| Guizhou | 0.167 | 0.184 | 0.180 | 0.185 | 0.206 | 0.174 | 0.142 | 0.137 | 0.167 | 0.156 | 0.170 | 27 | |
| Yunnan | 0.157 | 0.165 | 0.195 | 0.213 | 0.221 | 0.237 | 0.182 | 0.175 | 0.333 | 0.402 | 0.228 | 22 | |
| Shaanxi | 0.227 | 0.245 | 0.236 | 0.244 | 0.233 | 0.212 | 0.198 | 0.232 | 0.285 | 0.306 | 0.242 | 21 | |
| Gansu | 0.281 | 0.258 | 0.240 | 0.225 | 0.244 | 0.251 | 0.260 | 0.234 | 0.248 | 0.296 | 0.254 | 19 | |
| Qinghai | 0.191 | 0.226 | 0.212 | 0.201 | 0.157 | 0.163 | 0.134 | 0.132 | 0.151 | 0.174 | 0.174 | 26 | |
| Ningxia | 0.260 | 0.243 | 0.228 | 0.229 | 0.200 | 0.183 | 0.178 | 0.216 | 0.161 | 0.171 | 0.207 | 24 | |
| Xinjiang | 0.139 | 0.153 | 0.157 | 0.162 | 0.180 | 0.222 | 0.188 | 0.145 | 0.157 | 0.189 | 0.169 | 28 | |
| National Average | 0.2907 | 0.291 | 0.306 | 0.280 | 0.291 | 0.311 | 0.341 | 0.332 | 0.308 | 0.461 | 0.475 | ||
| Region | Eastern Region | Central Region | Western Region | ||||||
|---|---|---|---|---|---|---|---|---|---|
| Type | GML | EC | TC | GML | EC | TC | GML | EC | TC |
| Time | |||||||||
| 2013–2014 | 1.127 | 1.0302 | 1.094 | 1.0616 | 1.2475 | 0.851 | 1.0877 | 0.9896 | 1.0992 |
| 2014–2015 | 0.9421 | 0.9945 | 0.9473 | 1.0025 | 1.0202 | 0.9826 | 1.0139 | 1.0297 | 0.9846 |
| 2015–2016 | 1.0547 | 1.0277 | 1.0263 | 1.0357 | 1.003 | 1.0326 | 1.0456 | 0.9839 | 1.0628 |
| 2016–2017 | 1.1314 | 1.0132 | 1.1166 | 1.0253 | 0.9808 | 1.0454 | 1.0587 | 0.9528 | 1.1112 |
| 2017–2018 | 1.0061 | 0.991 | 1.0152 | 1.0148 | 0.9916 | 1.0235 | 1.0602 | 1.0899 | 0.9727 |
| 2018–2019 | 1.0031 | 1.0508 | 0.9546 | 0.9449 | 0.9955 | 0.9492 | 0.9447 | 1.8711 | 0.5049 |
| 2019–2020 | 0.9932 | 1.0242 | 0.9697 | 0.9275 | 0.9936 | 0.9334 | 0.9678 | 1.0049 | 0.9631 |
| 2020–2021 | 1.4616 | 1.017 | 1.4372 | 1.685 | 1.0022 | 1.6812 | 1.3041 | 0.9941 | 1.3118 |
| 2021–2022 | 0.9878 | 1.0215 | 0.967 | 1.3043 | 1.012 | 1.2889 | 2.0906 | 1.0003 | 2.0898 |
| Average Values | 1.0786 | 1.0189 | 1.0587 | 1.1113 | 1.0274 | 1.0875 | 1.1748 | 1.1018 | 1.1222 |
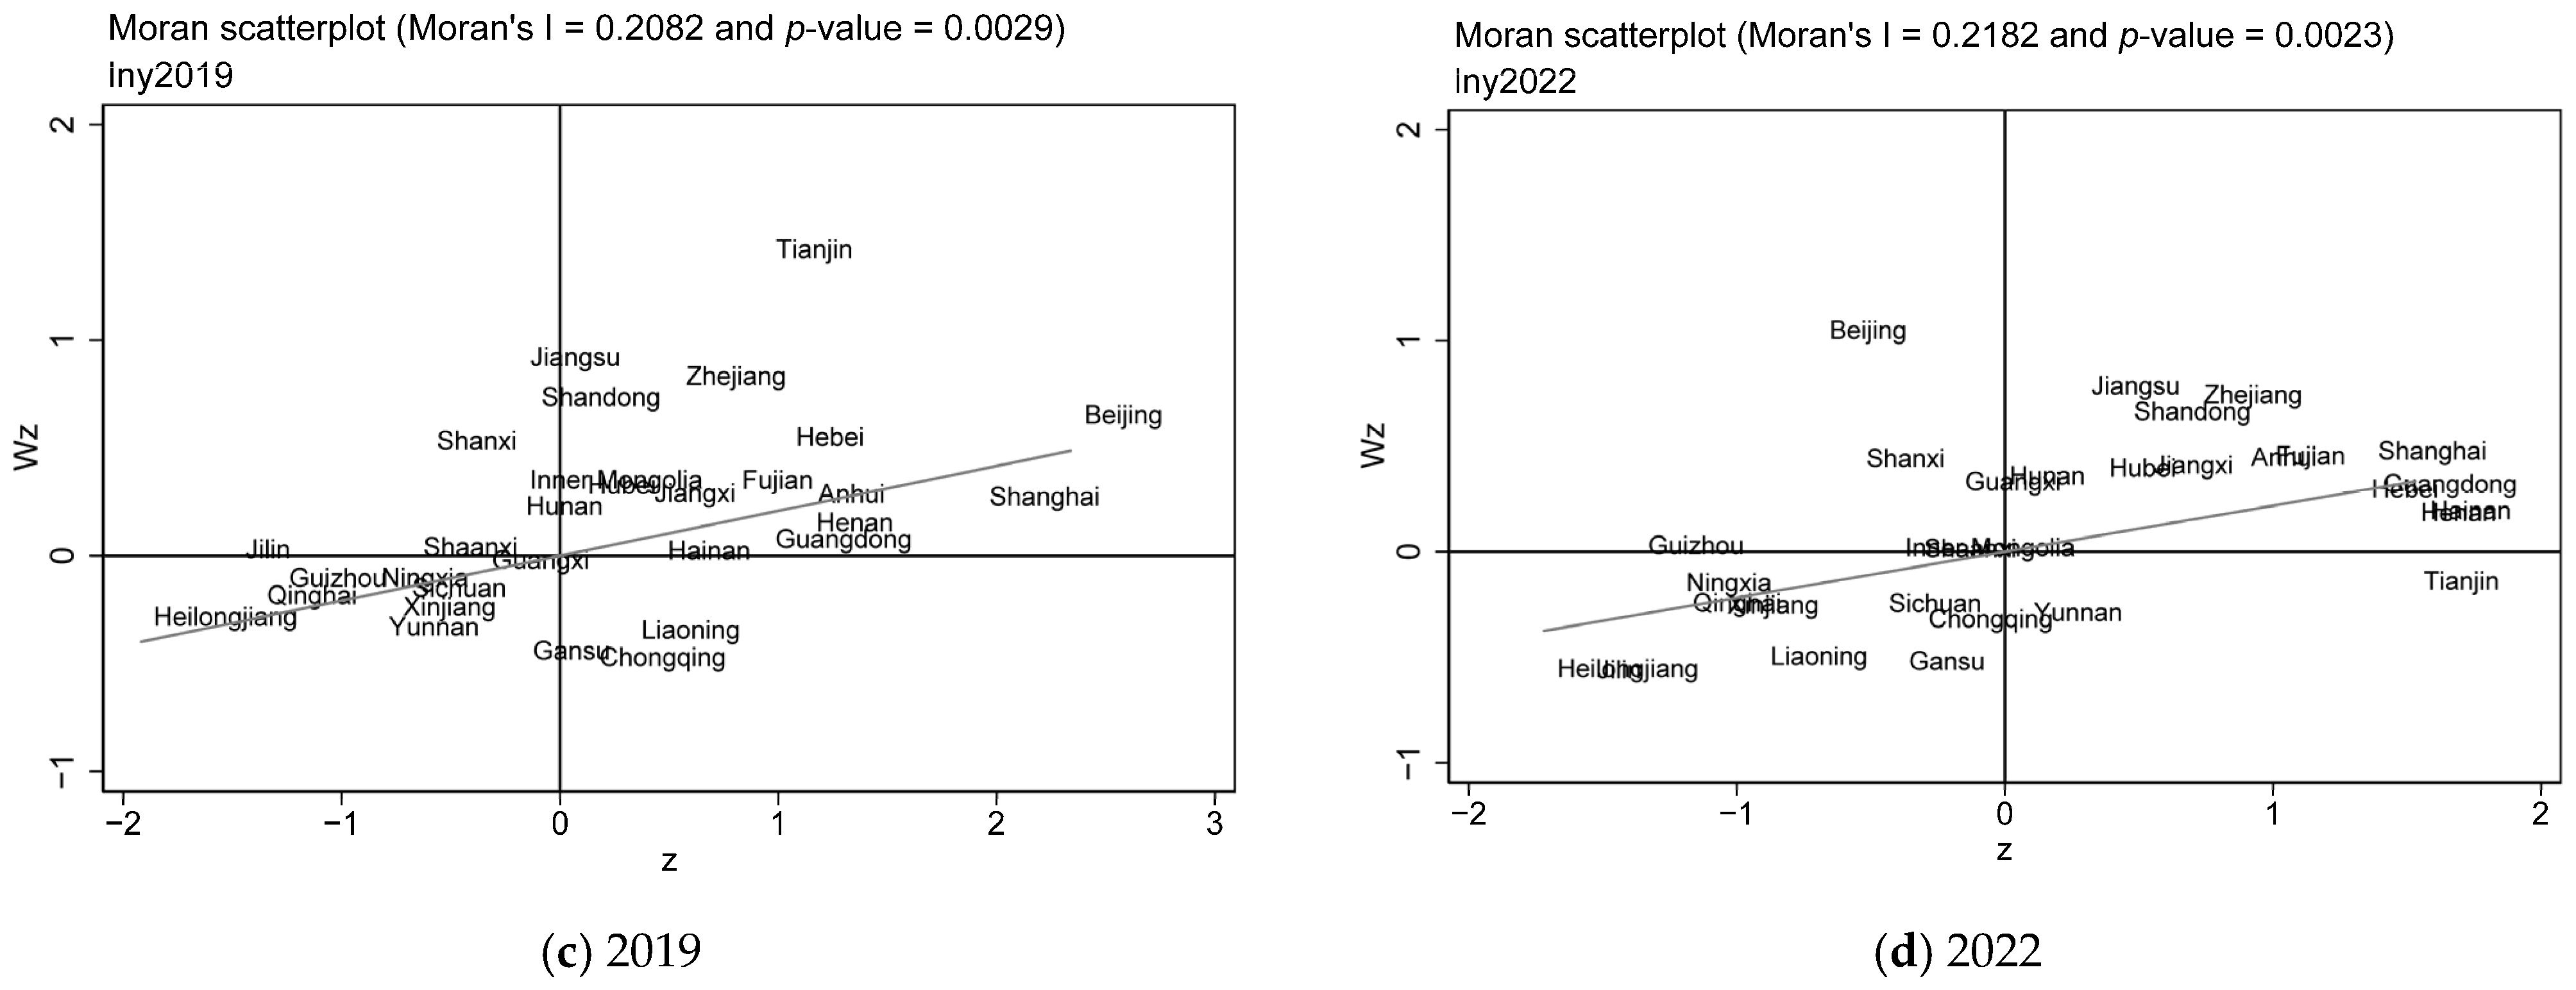
| Years | Moran’s I | p-Value | Years | Moran’s I | p-Value |
|---|---|---|---|---|---|
| 2013 | 0.091 | 0.119 | 2018 | 0.189 | 0.006 |
| 2014 | 0.076 | 0.172 | 2019 | 0.208 | 0.003 |
| 2015 | 0.041 | 0.353 | 2020 | 0.171 | 0.011 |
| 2016 | 0.044 | 0.341 | 2021 | 0.27 | 0.000 |
| 2017 | 0.154 | 0.021 | 2022 | 0.218 | 0.002 |
| Testing Method | Statistic | Testing Method | Statistic |
|---|---|---|---|
| LM (lag) test | 6.719 *** | lr_both_ind | 25.83 *** |
| Robust LM (lag) test | 0.53 | lr_both_time | 336.9 *** |
| LM (error) Moran | −61,000 | Wald_spatial_lag | 16.91 *** |
| LM (error) test | 11.615 *** | LR_spatial_lag | 16.41 ** |
| Robust LM (error) test | 5.431 ** | Wald_spatial_error | 16.72 ** |
| Hausman test | 70.4 *** | LR_spatial_error | 16.36 ** |
| Variable | ln LCEE | ln ES | ln DT | ln EDL | ln UL | ln AIS |
|---|---|---|---|---|---|---|
| VIF | 3.21 | 3.24 | 8.02 | 4.83 | 2.69 | 1.48 |
| 1/VIF | 0.3114 | 0.3085 | 0.1247 | 0.2069 | 0.3721 | 0.6773 |
| Variable | Two-Way Fixed Effects | |
|---|---|---|
| Main | ln LCEE | −0.2767 *** |
| ln ES | −0.3076 ** | |
| ln DT | 0.9294 ** | |
| ln EDL | −2.4430 *** | |
| ln UL | 0.8726 *** | |
| ln AIS | 2.5289 *** | |
| Wx | ln LCEE | −0.3915 *** |
| ln ES | 0.8105 *** | |
| ln DT | −1.4593 | |
| ln EDL | 1.9143 | |
| ln UL | 0.3358 | |
| ln AIS | 2.3886 | |
| R-square | 0.3579 | |
| rho | −0.1892 ** | |
| Log-likelihood | 64.0475 |
| Variable | Direct Effect | Indirect Effect | Total Effect | |
|---|---|---|---|---|
| Nationwide | ln ES | −0.2658 *** | −0.2942 ** | −0.5600 *** |
| ln DT | −0.3332 *** | 0.7477 *** | 0.4145 * | |
| Eastern | ln ES | −0.1904 | −0.4068 ** | −0.5973 *** |
| ln DT | −0.3155 | 0.1475 | −0.1680 | |
| Central | ln ES | 0.0761 | 1.3863 ** | 1.4624 * |
| ln DT | −0.0021 | 0.5679 | 0.5658 | |
| Western | ln ES | 0.6394 *** | −1.5142 *** | −0.8748 |
| ln DT | −0.3171 ** | 0.7110 * | 0.3939 |
Disclaimer/Publisher’s Note: The statements, opinions and data contained in all publications are solely those of the individual author(s) and contributor(s) and not of MDPI and/or the editor(s). MDPI and/or the editor(s) disclaim responsibility for any injury to people or property resulting from any ideas, methods, instructions or products referred to in the content. |
© 2025 by the authors. Licensee MDPI, Basel, Switzerland. This article is an open access article distributed under the terms and conditions of the Creative Commons Attribution (CC BY) license (https://creativecommons.org/licenses/by/4.0/).
Share and Cite
Guan, Y.; Yang, J.; Wang, R.; Zhang, L.; Wang, M. Exploring the Role of Energy Consumption Structure and Digital Transformation in Urban Logistics Carbon Emission Efficiency. Atmosphere 2025, 16, 929. https://doi.org/10.3390/atmos16080929
Guan Y, Yang J, Wang R, Zhang L, Wang M. Exploring the Role of Energy Consumption Structure and Digital Transformation in Urban Logistics Carbon Emission Efficiency. Atmosphere. 2025; 16(8):929. https://doi.org/10.3390/atmos16080929
Chicago/Turabian StyleGuan, Yanfeng, Junding Yang, Rong Wang, Ling Zhang, and Mingcheng Wang. 2025. "Exploring the Role of Energy Consumption Structure and Digital Transformation in Urban Logistics Carbon Emission Efficiency" Atmosphere 16, no. 8: 929. https://doi.org/10.3390/atmos16080929
APA StyleGuan, Y., Yang, J., Wang, R., Zhang, L., & Wang, M. (2025). Exploring the Role of Energy Consumption Structure and Digital Transformation in Urban Logistics Carbon Emission Efficiency. Atmosphere, 16(8), 929. https://doi.org/10.3390/atmos16080929


