Article

On the Links Between Tropical Sea Level and Surface Air Temperature in Middle and High Latitudes

by
Sergei Soldatenko
*,
Genrikh Alekseev
and
Yaromir Angudovich
Arctic and Antarctic Research Institute, St. Petersburg 199397, Russia
*
Author to whom correspondence should be addressed.
Atmosphere 2025, 16(8), 913; https://doi.org/10.3390/atmos16080913
Submission received: 28 April 2025 / Revised: 15 July 2025 / Accepted: 25 July 2025 / Published: 28 July 2025
(This article belongs to the Section Climatology)

Abstract

Change in sea level (SL) is an important indicator of global warming, since it reflects alterations in several components of the climate system at once. The main factors behind this phenomenon are the melting of glaciers and thermal expansion of ocean water, with the latter contributing about 40% to the overall rise in SL. Rising SL indirectly indicates an increase in ocean heat content and, consequently, its surface temperature. Previous studies have found that tropical sea surface temperature (SST) is critical to regulating the Earth’s climate and weather patterns in high and mid-latitudes. For this reason, SST and SL in the tropics can be considered as precursors of both global climate change and the emergence of climate anomalies in extratropical latitudes. Although SST has been used in this capacity in a number of studies, similar research regarding SL had not been conducted until recently. In this paper, we examine the links between SL in the tropical North Atlantic and North Pacific Oceans and surface air temperature (SAT) at mid- and high latitudes, with the aim of assessing the potential of SL as a predictor in forecasting SAT anomalies. To identify similarities between the variability of tropical SL and SST and that of SAT in high- and mid-latitude regions, as well as to estimate possible time lags, we applied factor analysis, clustering, cross-correlation and cross-spectral analyses. The results reveal a structural similarity in the internal variability of tropical SL and extratropical SAT, along with a significant lagged relationship between them, with a time lag of several years.

1. Introduction

Long-range meteorological and climate prediction is a typical boundary value problem, where the goal is to predict the climate system statistics, rather than specific atmospheric parameters at regional or global scales [1]. Examples of boundary conditions in climate prediction include, but are not limited to, changes in atmospheric aerosol and greenhouse gas concentrations, as well as sea surface temperature (SST). In this paper, the terms “long-range meteorological forecast” and “climate prediction” are used interchangeably. In addressing the climate prediction problem, the primary focus is on estimating how external forcings affect the first- and second-moment climate statistics. In other words, climate prediction involves predictability of the second kind [2,3,4,5,6,7,8,9,10], also known as forced predictability or boundary value predictability. It is worth noting that predictability refers to both the physical system being studied and the model used for prediction. We will focus on the predictability of real climate processes, rather than the predictability of models used to simulate them.
Numerous studies (e.g., [11,12,13,14,15,16,17] and references therein) confirm that ocean–atmosphere interactions play a key role in long-term weather and climate variations, as well as their predictability. These interactions are particularly significant in low latitudes, where oceans accumulate most of Earth’s incoming solar heat, which then redistributes to mid- and high latitudes through atmospheric and oceanic circulation patterns (e.g., [13,18,19,20,21,22,23,24,25,26,27]). Therefore, ocean heat content is critical to regulating the Earth’s climate and driving weather patterns. The accelerated increase in ocean heat uptake due to global warming results in sea level (SL) rise through glacier melt and thermal expansion of the ocean water [28,29]. The latter accounts for more than two-thirds of the total SL rise [30,31,32]. This gives us a rationale for using SL as an indicator of climate change. Little et al. [33] identified the main component of global warming based on the analysis of SL variability in the North Pacific and linked it to aerosol pollution of the atmosphere. In [26,27], a lagged correlation was found between tropical SST anomalies and mid- and high-latitude surface air temperature (SAT) anomalies, which allows SST to be used as a predictor in climate prediction models. It can be expected that SL has the ability to be considered in this capacity due to the close connection between SST and SL.
It should be noted that the impact of tropical SST on the climate of remote regions and the generation of extratropical teleconnections patterns has been addressed in numerous previous studies (e.g., [34,35,36,37,38,39,40,41,42]). In several papers, the influence of tropical SST on the Arctic has also been considered (e.g., [22,43,44,45,46]). Although the impact of SST on climate formation has been extensively explored, similar research involving SL had not been conducted until recently.
The aim of this paper is to study the relationships between SL variations in the tropical North Atlantic and North Pacific Oceans and SAT at high and mid-latitudes of the Northern Hemisphere, as well as to assess the possibility of using SL as a predictor in constructing empirical models for predicting climate anomalies.

2. Materials and Methods

2.1. Datasets

In this study, we proceed from the basic concept that SST anomalies in the tropics are reliable predictors of SAT anomalies at high and mid-latitudes. This concept, with supporting evidence, was discussed, for example, in [26,27]. The assumption that SL can serve as a reliable candidate predictor for SAT anomalies in empirical predictive climate models fits into the framework of the concept in question. The selection of tide gauge stations given below was made taking this fact into account.
To examine the links between tropical SL and SAT anomalies in high and mid-latitudes, the Permanent Service for Mean Sea Level (PSMSL) dataset was used as the data source for SL. This dataset is available from the PSMSL website at https://psmsl.org/data (accessed on 21 January 2024). Only North Atlantic and North Pacific SL records for the period 1940–2024 were examined in this study.
According to the basic concept, the stations whose data are used for analysis should, firstly, be located in tropical North Atlantic and North Pacific Oceans, and, secondly, the data from these stations should contain as few gaps as possible. However, there is an additional important aspect that should be considered when selecting the most representative stations. This aspect is related to multicollinearity, which occurs when there are high correlations between candidate predictors. Detecting and fixing multicollinearity will be discussed in the Results section. There are 5 tide gauge stations in the low-latitude region of the North Atlantic extending to 30° N, and 7 stations in the low-latitude region of the North Pacific (see Table 1 and Table 2). Monthly and seasonal mean SLs were used for the analysis. To fill the gaps that were found in the selected time series, second-order polynomial spline interpolation was used.
The predictands (dependent variables being predicted) are monthly mean and seasonal SAT anomalies spatially averaged over Eastern Europe, Western and Eastern Siberia, and Western and Eastern Arctic, respectively (Figure 1). Geographical characteristics of the regions are presented in Table 3. The main data source for SAT for the period 1948–2024 is the ERA5 reanalysis data [47].

2.2. Methods

To assess the structure of variability of SL and SAT time series and the relationships between them, correlation, cross-correlation, and cross-spectral methods are used.
The expression for the discrete normalized cross-correlation function r x y ( τ ) between two N -dimensional time series x i and y i at delay τ is defined as
r x y τ = 1 N τ i = 1 N τ x i x ¯ y i + τ y ¯ σ x σ y ,
where x ¯ and y ¯ are sample means of time series x i and y i , σ x and σ y are their sample standard deviations. By changing τ , we can gain insight into the possible interaction between the two time series by identifying the time lags (delays) at which this interaction is most significant.
Cross-correlation function (1) is used to calculate the cross-power spectral density, since the latter, in accordance with the Wiener–Khinchin theorem, is the Fourier transform of the cross-correlation function. The cross-power spectral density is computed with a Tukey window as follows [48]:
S x y k = δ k m 1 + k = 1 m r x y τ cos π k τ m 1 + cos π τ m δ k = 1 2 ,                 k = 0 ,   m 1 ,                 0 < k < m .
Using the Tukey window allows us to represent the proportion of total variance in the k-th frequency band. There are m frequency bands in total, based on the number of autocorrelation function values used, which are set based on the desired spectrum resolution and the requirement for statistical reliability of the estimate. The calculated estimates of power spectral density are dimensionless, since the autocorrelation function is normalized.
To remove redundant predictors and therefore solve the problem of multicollinearity, we use factor analysis and clustering. This procedure will be discussed in detail in the Results section.

3. Results

3.1. Selection of Representative Tide Gauge Stations

Based on teleconnections between SST anomalies (across the Atlantic, Pacific, Indian and Southern Oceans) and SAT anomalies at high and mid-latitudes explored in [26,27,49] using the ERA5 reanalysis and HadlSST datasets [50], we identified two geographic regions, namely the North Atlantic and the North Pacific, to study the links between low-latitude SL variations and high and mid-latitude SAT anomalies. However, as we mentioned earlier, the problem of multicollinearity of predictors may arise when constructing empirical predictive models. If models are based on neural networks, then multicollinearity causes the problem of model overtraining.
One of the common approaches to detecting multicollinearity is calculating a correlation matrix, which provides a visual representation of the relationships between predictors. Sea levels at various tide gauge stations are oscillating functions of time, having monotonically increasing trend components. Figure 2 shows change in monthly average SL anomalies at Key West and Manila Bay South Harbour stations. The SL trend at Key West calculated over the period from 1974 to 2023 is 3.82 mm/yr with a 95% confidence interval of ±0.59 mm/yr, while at Manila Bay South Harbour the trend is 12.71 ± 0.93 mm/yr. Correlation matrices were calculated with both detrended and trended data (Figure 3).
From Figure 3a it can be seen that SLs at stations in the North Atlantic, located at relatively small distances from each other, are highly correlated with each other before and after detrending. One of the reasons for such high cross-correlation may be not only thermal expansion of ocean water but also the influence of large-scale water circulation, which in this region is represented by two powerful gyres: the anticyclonic subtropical gyre and the cyclonic subpolar gyre. In the tropical North Atlantic, the station “Grand Isle” stands out. The data from this station show the weakest correlation with those from other stations in the region. Apparently, this is because the station “Grand Isle” is not located on the Atlantic coast, but on the shore of the Gulf of Mexico.
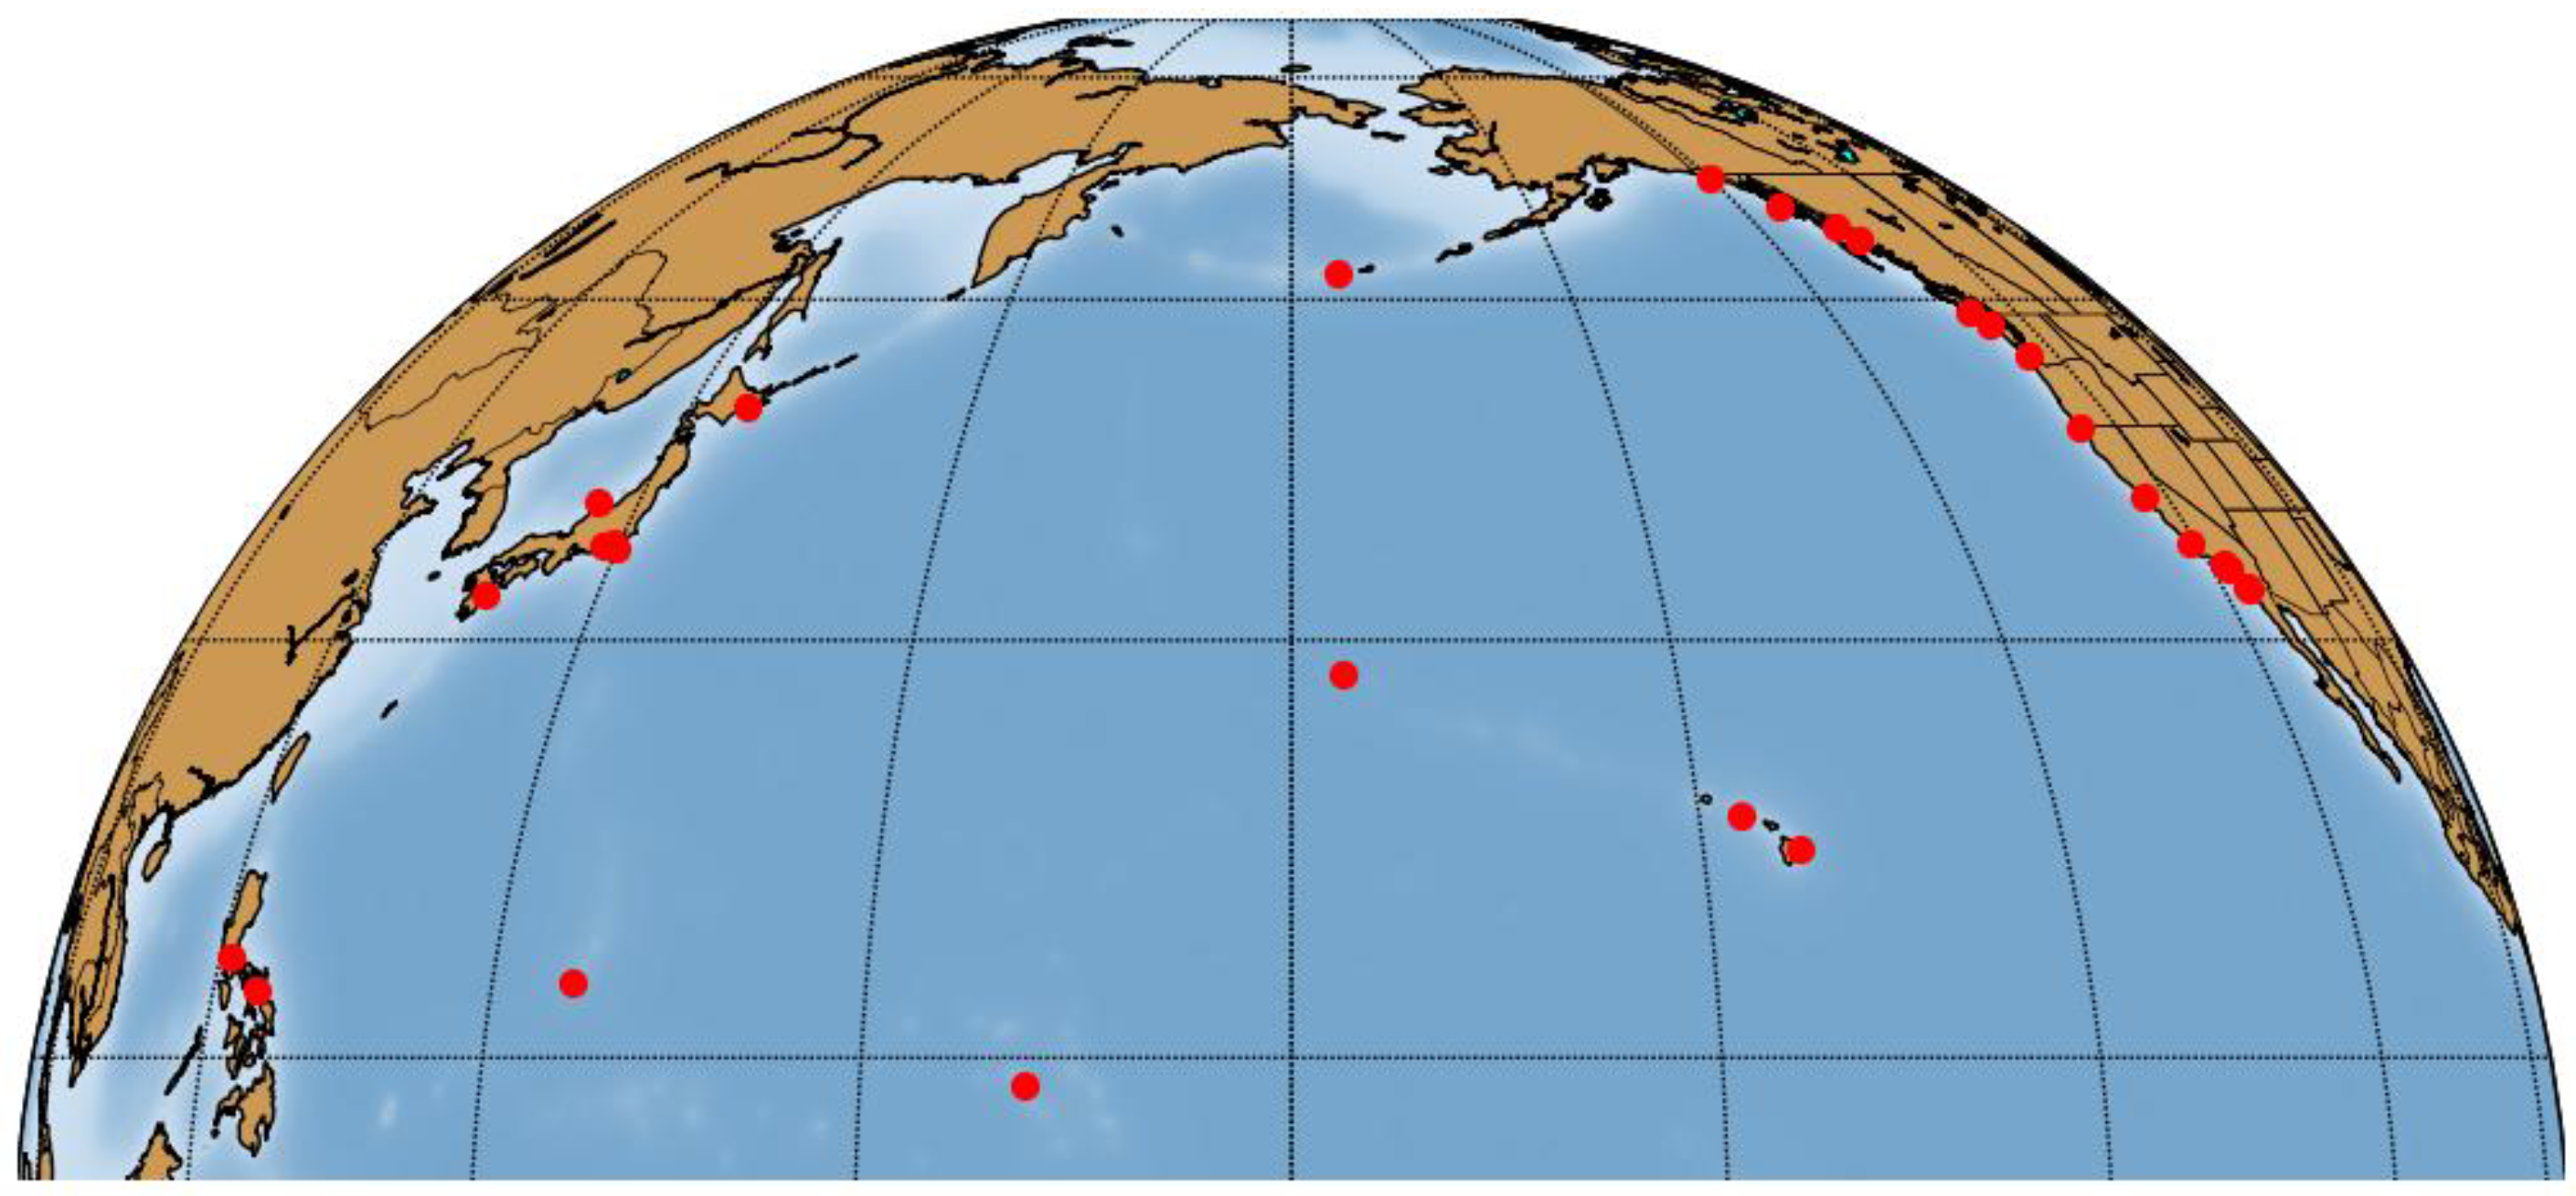
In the North Pacific region, the cross-correlation between stations is less clear due to the large distances between them. As noted above, when selecting predictors, it should be taken into consideration that there may be dependence between them. If large absolute values of cross-correlation coefficients (above 0.7–0.8) are found between some predictors, then one of the predictors should be excluded. The data from reference stations considered as candidate predictors should most fully reflect the climatic features of a large geographical region (information-homogeneous zone) and have long-term homogeneous observation series with a minimum number of gaps. In addition, reference stations should be located close to (or within) regions whose SST anomalies affect SAT anomalies at high and mid-latitudes [26,27]. Such a region in the North Atlantic is the tropical region (5.5° N–23.5° N, 15° W–57.5° W) [51], where the Tropical Northern Atlantic (TNA) index is determined, and in the North Pacific it is the Warm Pool. The Key West and Manila Bay South Harbour tide gauge stations, located in the North Atlantic and North Pacific Oceans, respectively, meet these requirements.
In practice, however, a priori information useful for a reasonable selection of reference stations may often be lacking. A priori information may include, for example, estimates of the influence of anomalies in ocean characteristics (SST and/or SL) at low latitudes on atmospheric and oceanic heat transport to high latitudes and the formation of climatic anomalies in the Arctic and extratropics. In such cases, factor analysis and clustering can be used as a tool for selecting stations [52,53]. This implies, first of all, a structural analysis of the correlation matrix, which can be performed via principal component analysis. To this end, the SL data are detrended and normalized, and then a reduced correlation matrix is constructed. It may be recalled that a reduced correlation matrix is a matrix of pairwise correlations of observed variables. Its eigenvalues determine the fraction of each factor to common (total) variance allowing for the selection of a number of factors. At this stage, the factors that provide the largest proportion of cumulative variance are selected. In this context, factors are latent, cannot be measured directly, and are therefore hypothetical. The results obtained are used to form a factor loadings matrix. Its rows correspond to the original variables, and the columns correspond to the factors. At the intersection of a row and a column, the value of the loading is indicated, which represents the correlation coefficient between the original variable and the latent factor. Then, by applying hierarchical clustering to the factor analysis results, we can construct a connectivity matrix that can be visualized via a dendrogram. 
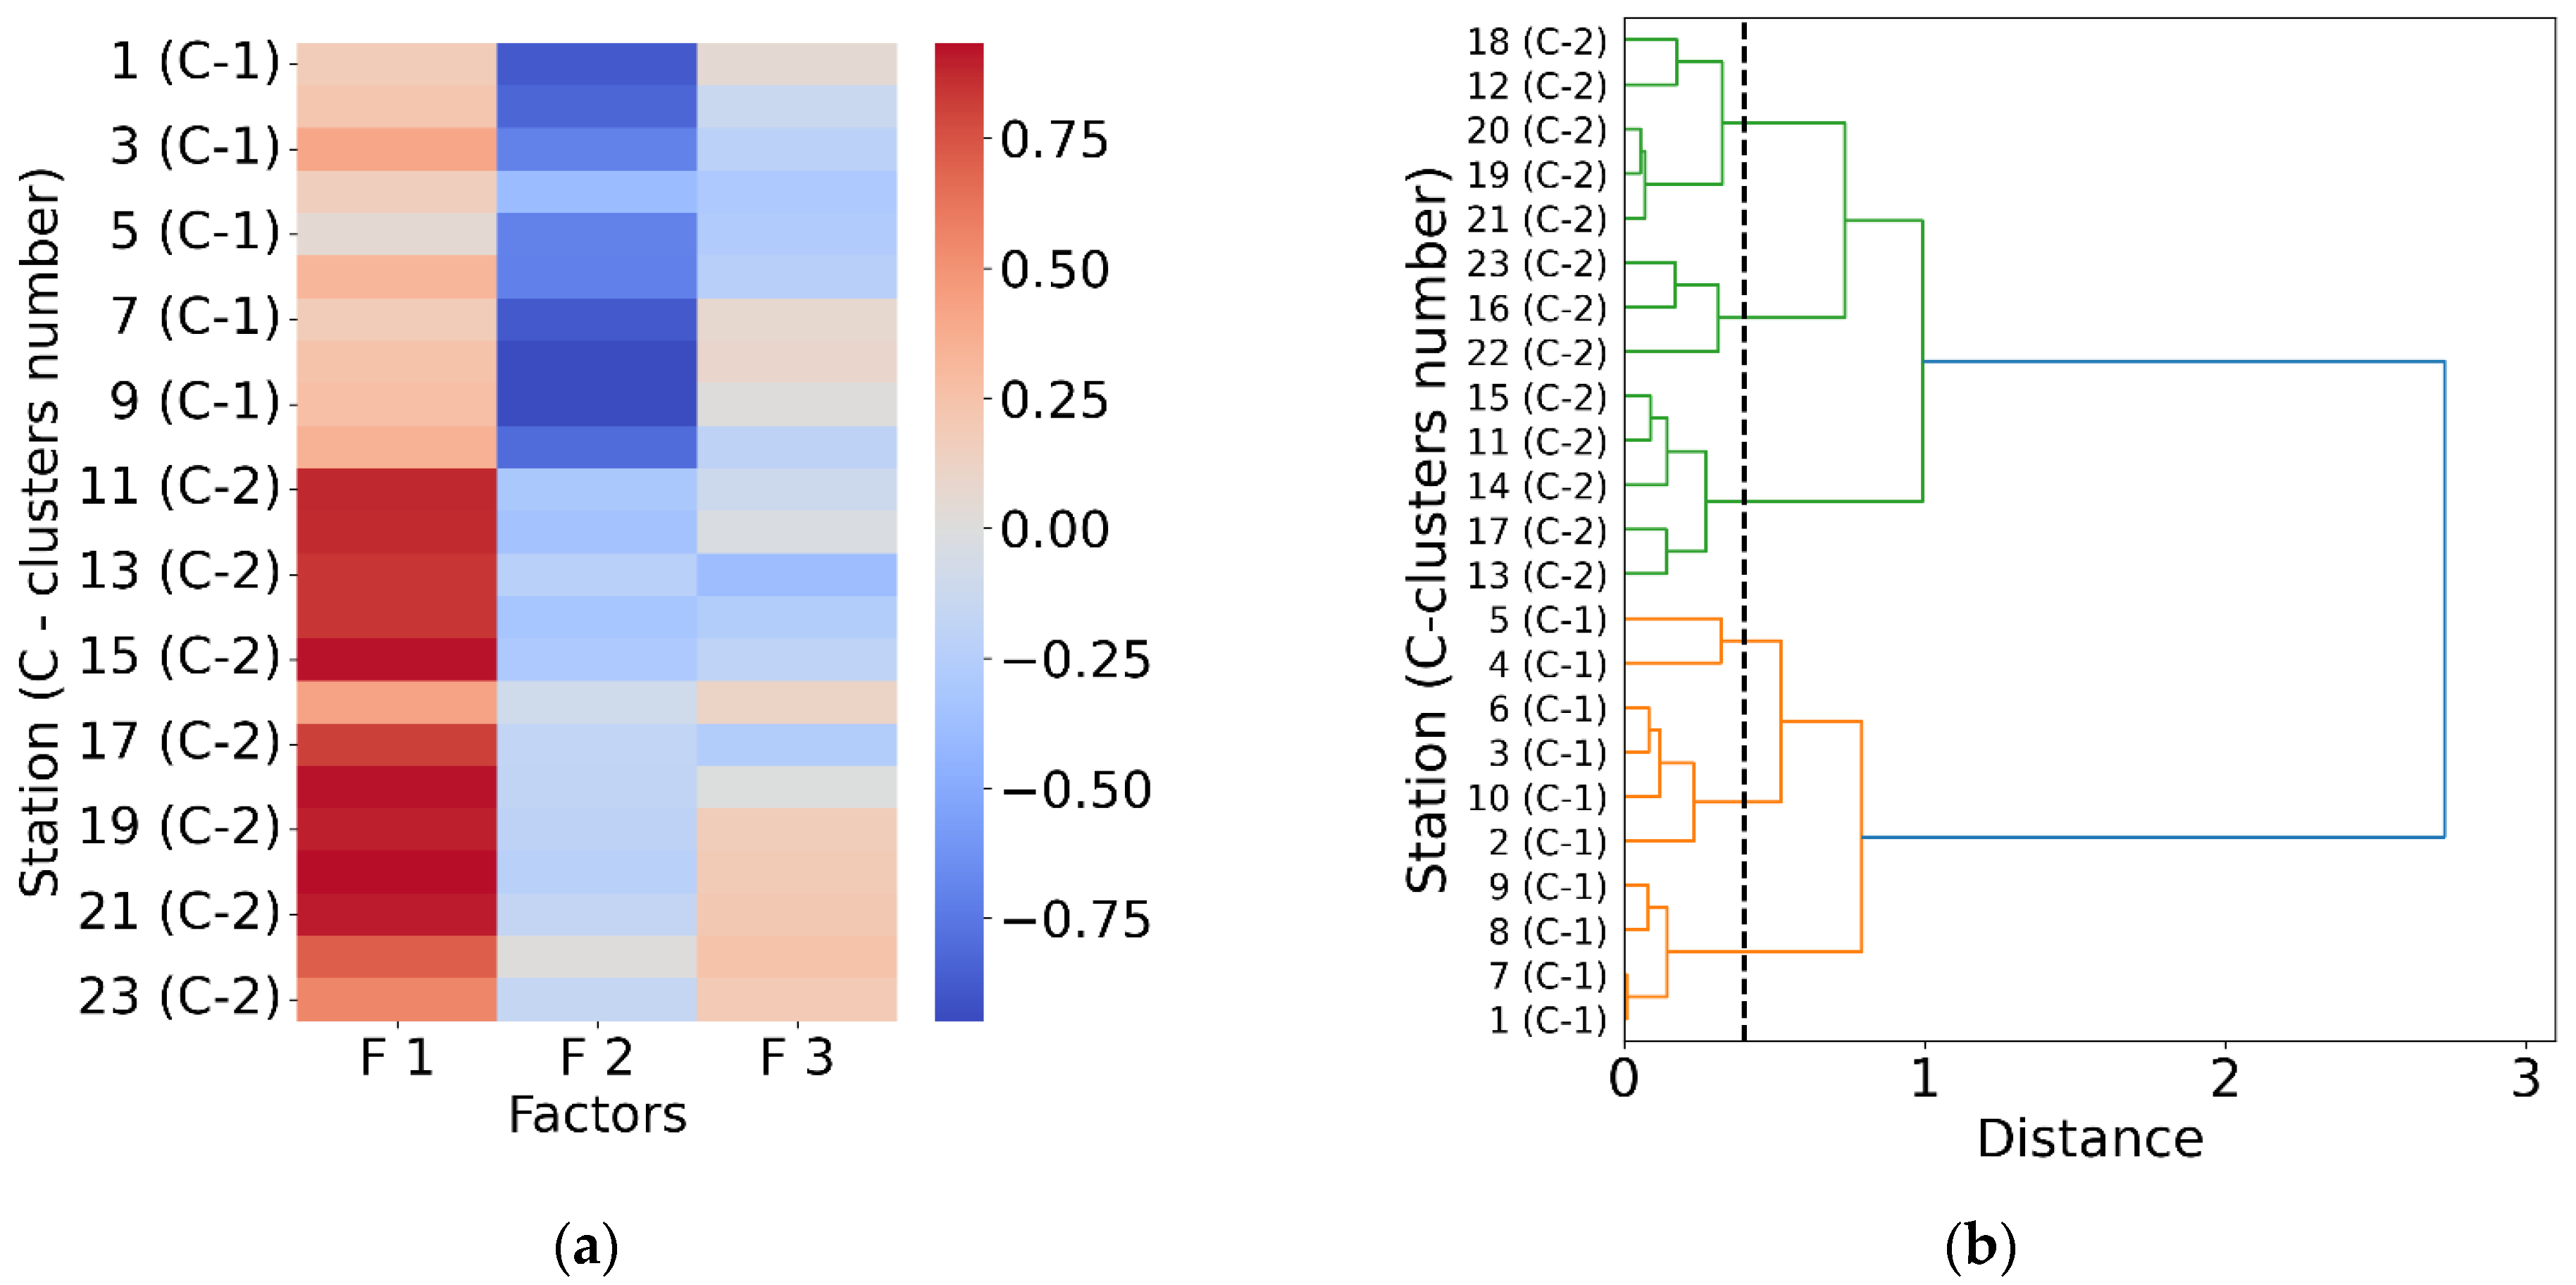
Table 4 presents the eigenvalues of the reduced correlation matrix, as well as the percentage of the total variance that is accounted for by each factor. The first two factors with eigenvalues of 12.89 and 4.19 determine the main patterns in the original data, explaining 74.2% of the total variance. Figure 4a shows the factor loading matrix heat map, which provides a visual representation of the association of each factor with SL measured at each station. The largest contribution to the SL variance at stations 11–23 is made by the first factor, while the second factor is the most significant for stations 1–10. The third factor, not to mention other ones, makes the smallest contribution to the SL variance. The result of hierarchical clustering is visualized as a dendrogram and represented in Figure 4b. This dendrogram shows two main clusters of stations. Cluster 1 is at the bottom and contains 10 stations (1–10), while cluster 2 is at the top and contains 13 stations (11–23). In total, the dendrogram has 6 levels. Stations of interest (1–5) located in tropical North Atlantic belong to cluster 1. All of these stations are root nodes, and each of them could theoretically be considered as a candidate for a reference station. However, all other things being equal, the proximity of the Key West tide gauge station to the “TNA” region and the completeness of its observation series are the determining factors in its selection as a reference station. The Key West station is located on the Florida Peninsula, near which the Florida Current merges with the Antilles Current, forming the Gulf Stream (at about 25° N). As is known, the Gulf Stream is part of the Atlantic Meridional Overturning Circulation (AMOC), which, in turn, affects the climate of remote regions located outside the North Atlantic, since it is part of the Broecker’s great ocean conveyor belt. Therefore, SL variations at Key West are a reliable indicator of variability in water circulation and various climate indices in the North Atlantic [54].
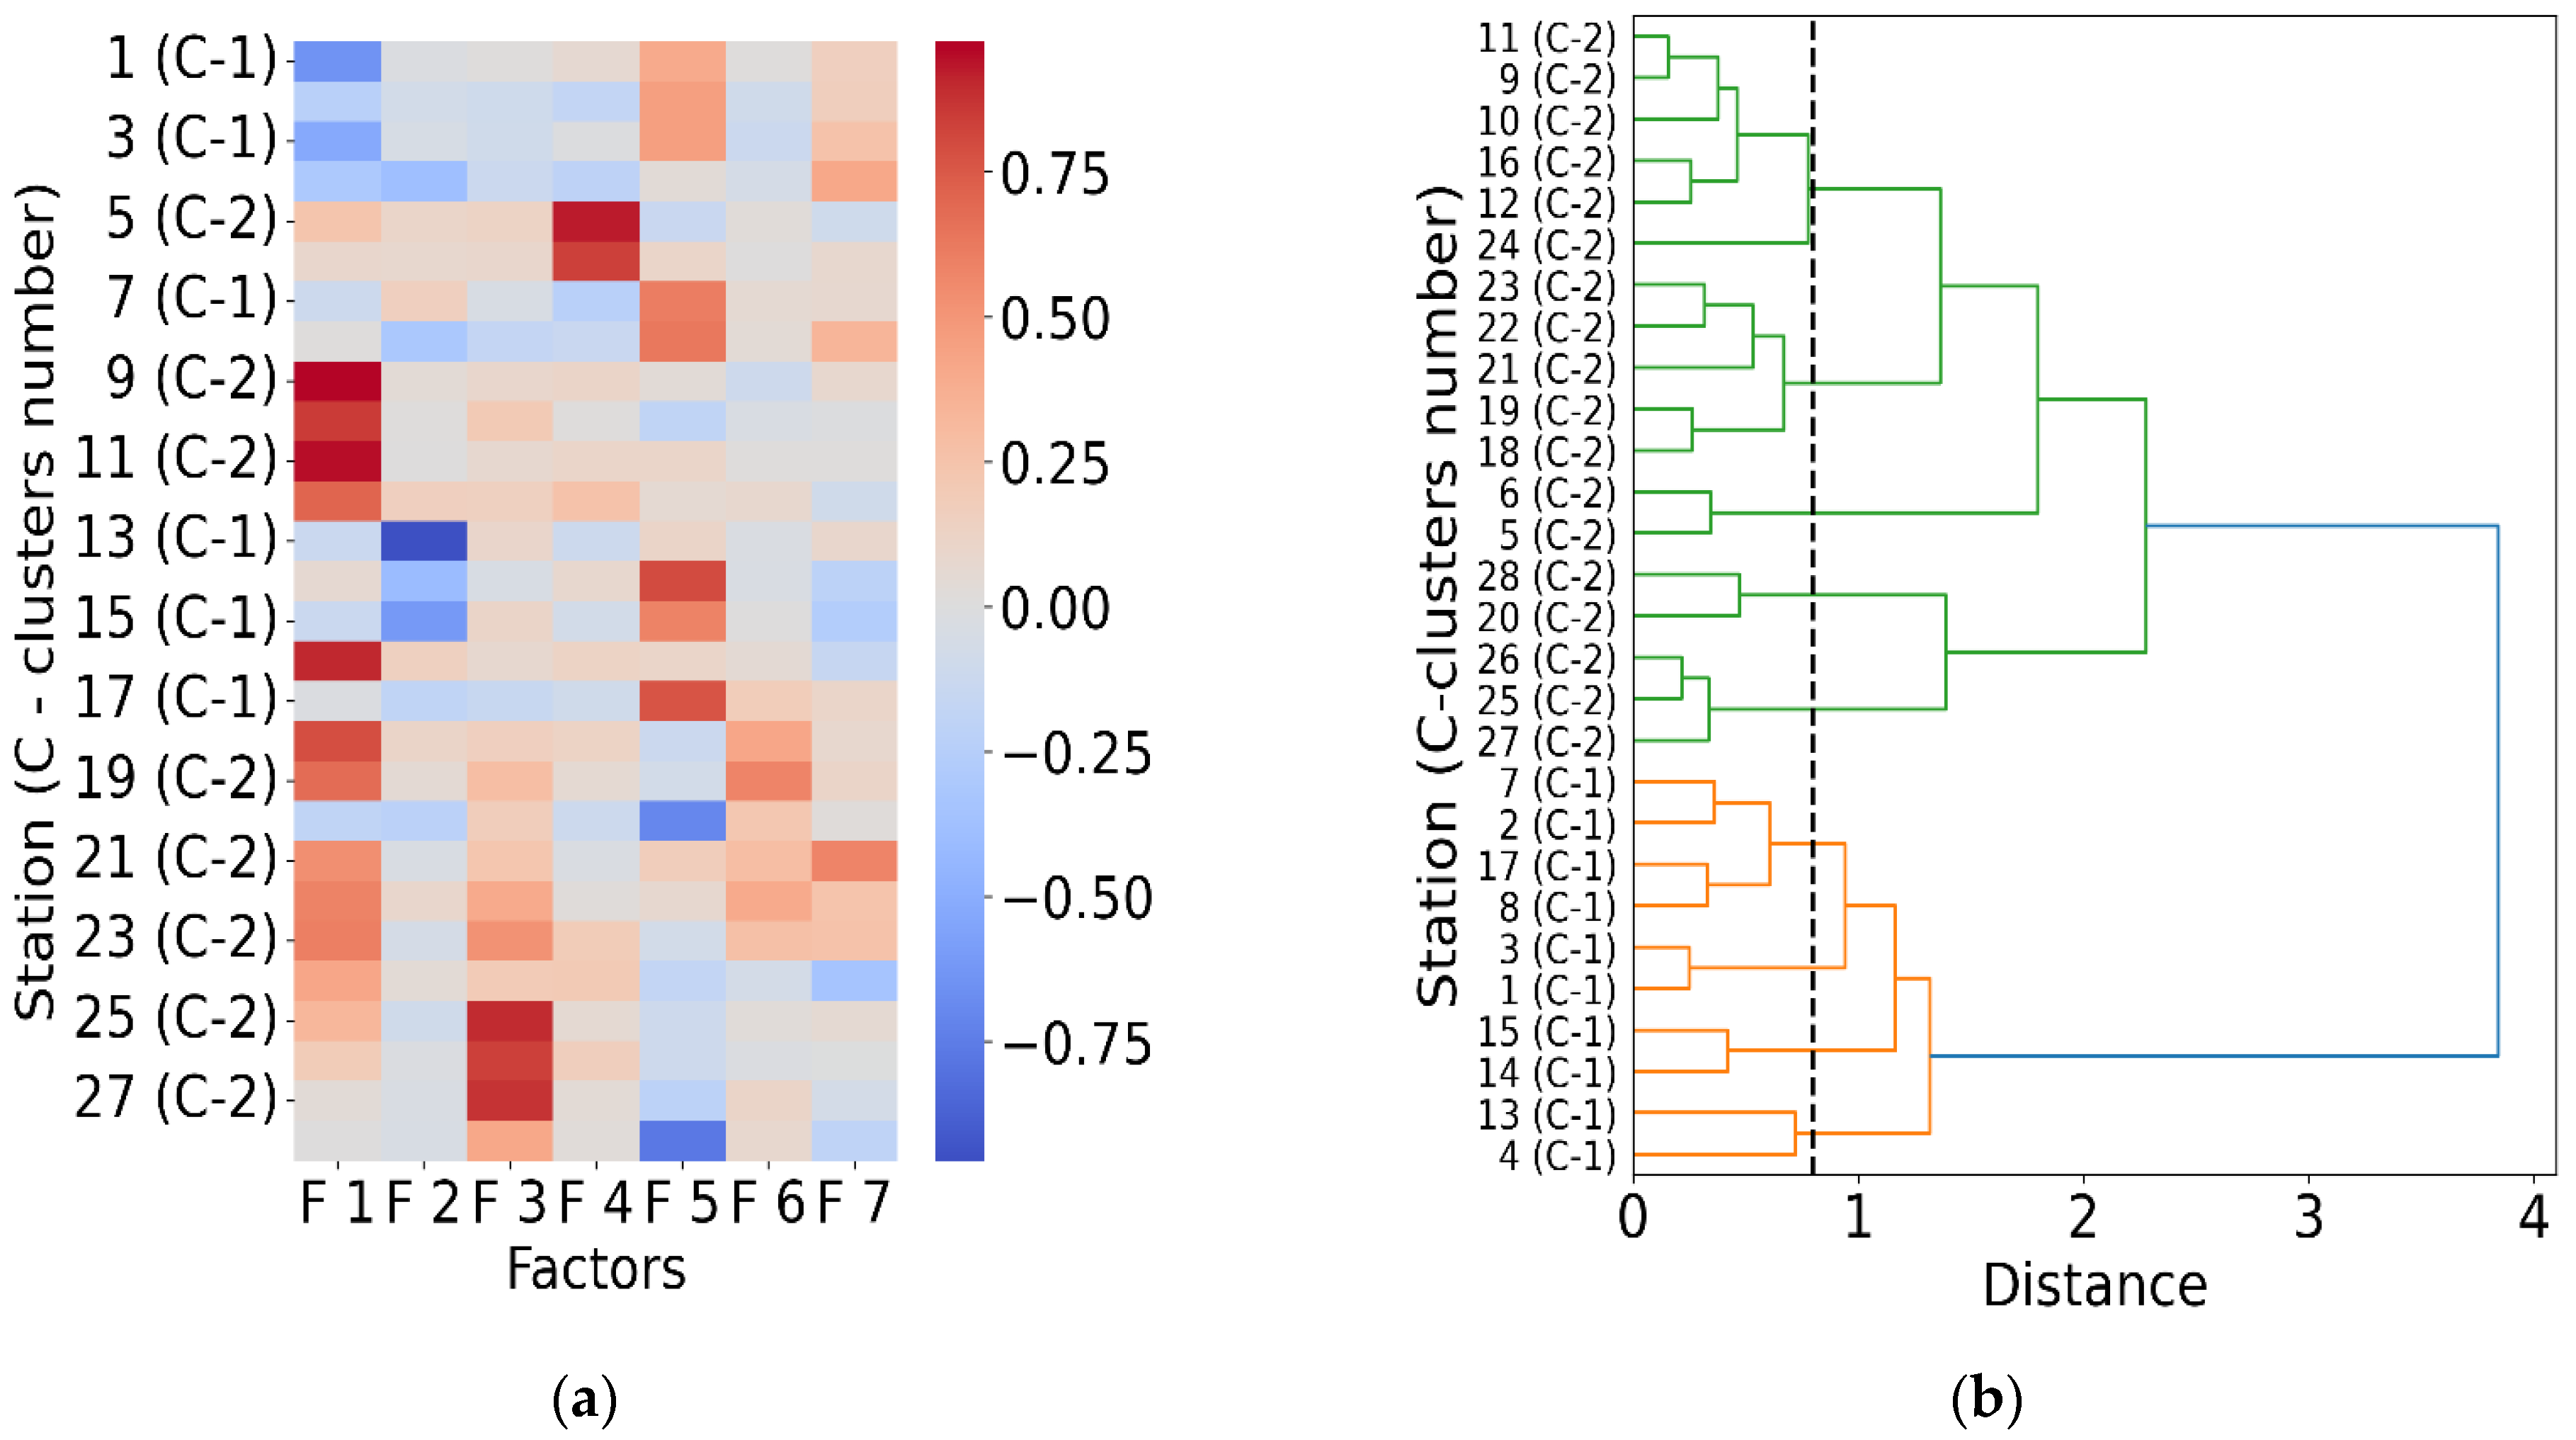
For the North Pacific Ocean, the situation is somewhat different. The eigenvalues of the reduced correlation matrix and the percentage of the total variance that is accounted for by each factor is presented in Table 5 (for convenience’s sake, only data for factors 1–7 are included). Here, the first two factors explain more than 50% of the total variance. The corresponding heat map of the factor load matrix and dendrogram are shown in Figure 5. The Manila Bay South Harbour tide gauge station, along with stations 1, 2, 3, and 7, belongs to cluster 1 and serves as the root node. It is the only station in the region with a long records and high data completeness (greater than 85%) and is located in the tropical Warm Pool. For these reasons, the Manila Bay South Harbour station was selected as the reference (candidate predictor) station for characterizing SL variations in the tropical North Pacific Ocean.
The Key West and Manila Bay South Harbour stations, selected as candidate predictors, are located in tropical regions where SSTs, as established earlier [26,27], influence SAT anomalies at high latitudes. The tropical North Atlantic region is defined as TNA (5.5° N–23.5° N, 15° W–57.5° W) [38], while in the North Pacific Ocean, the relevant region is the Pacific Warm Pool Region (60° E–170° E, 15° S–15° N) [55].

3.2. Variability and Links Sea Levels with Surface Air Temperature

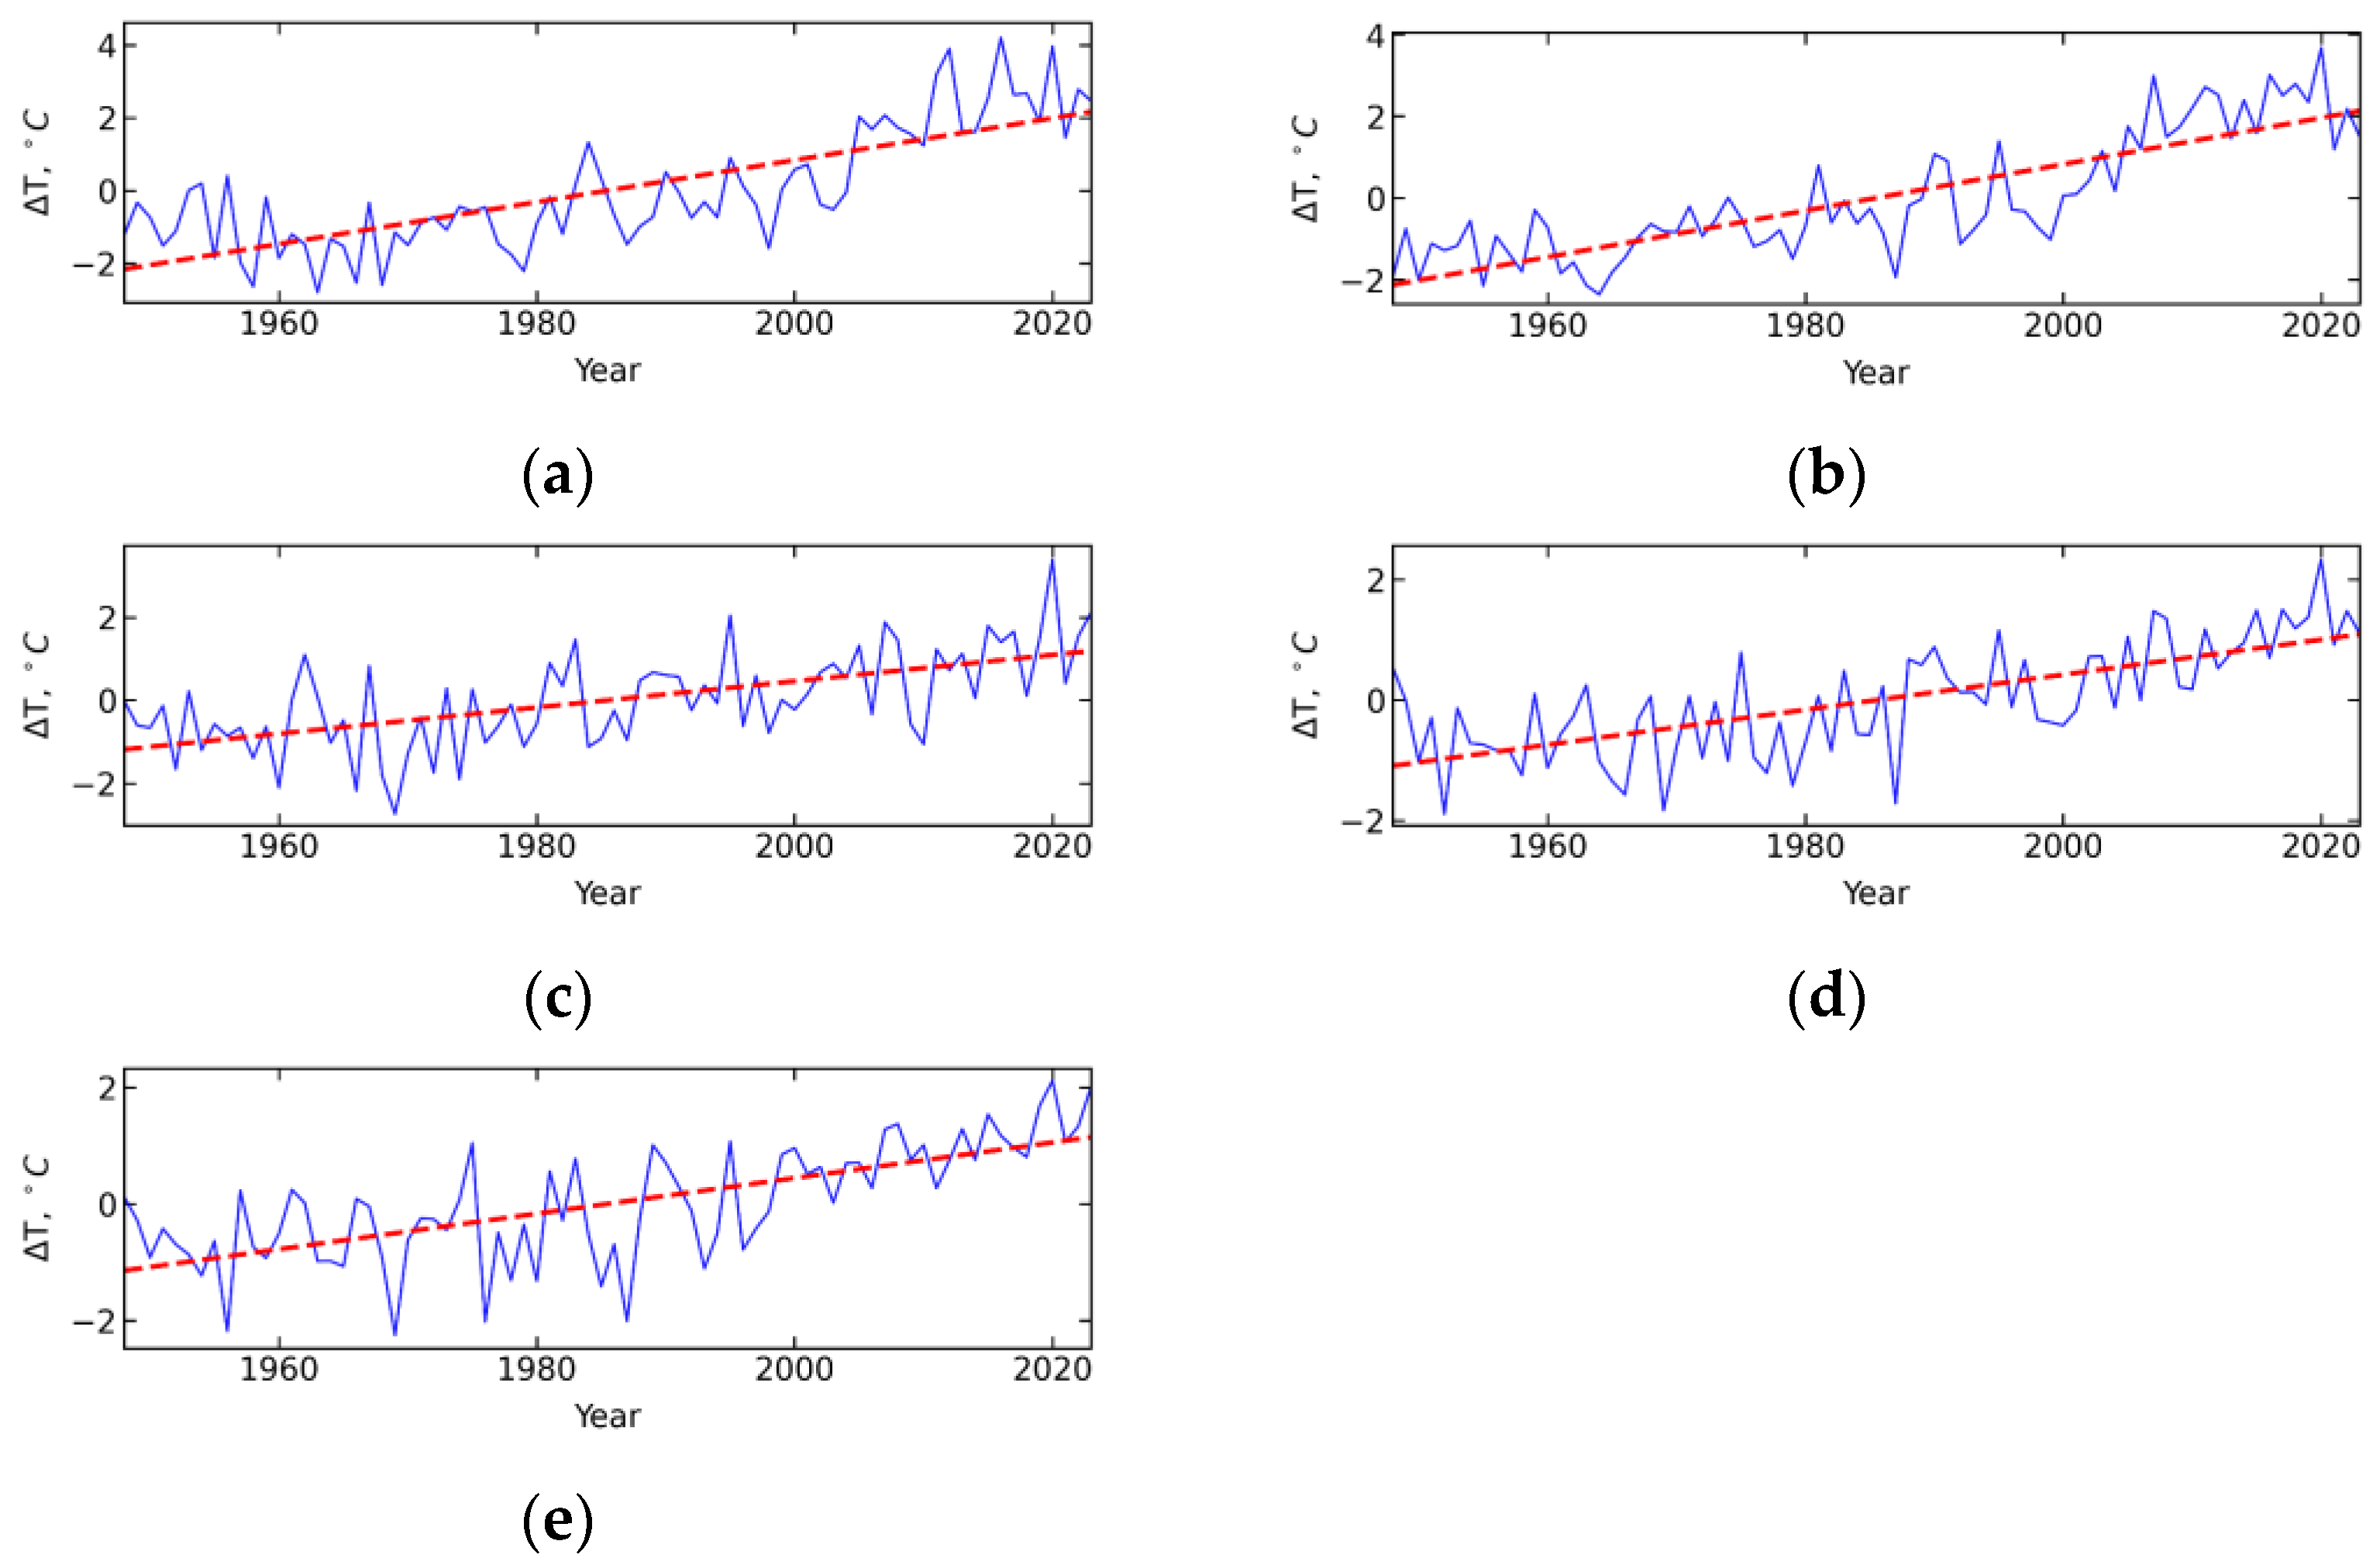
Further analysis requires information on how SATs changed from 1948 to 2023 in the five regions under consideration (see Table 6 and Figure 6). As is well known, since 1850, Earth’s temperature has increased by approximately 0.06 °C per decade, with the rate of warming accelerating to 0.26 ± 0.05 °C per decade over the past thirty years [56]. It is therefore not surprising that regional SATs have also risen in recent decades, with the largest increases observed in the Arctic due to the Arctic amplification phenomenon. Indeed, over the past three decades, the Western Arctic has experienced the largest positive trend in annual average, increasing at a rate of 1.18 °C per decade, followed by the Eastern Arctic, and then Siberia and Europe (see Table 6 for details).
As noted earlier, SST anomalies in the tropical North Atlantic and North Pacific, both exhibiting positive trends, have a time-lagged effect on SAT anomalies in mid- and high-latitude regions. This, along with other factors, support the assertion of a cause-and-effect relationship between tropical SST anomalies and SAT anomalies in these latitudes [26,27]. Since SL, like SST, shows a positive trend, and since the main drivers of SL increase are similar to those of SST, it is reasonable to assume a causal relationship also exists between rising SL in the tropics and the increase SAY in mid- and high-latitude regions.
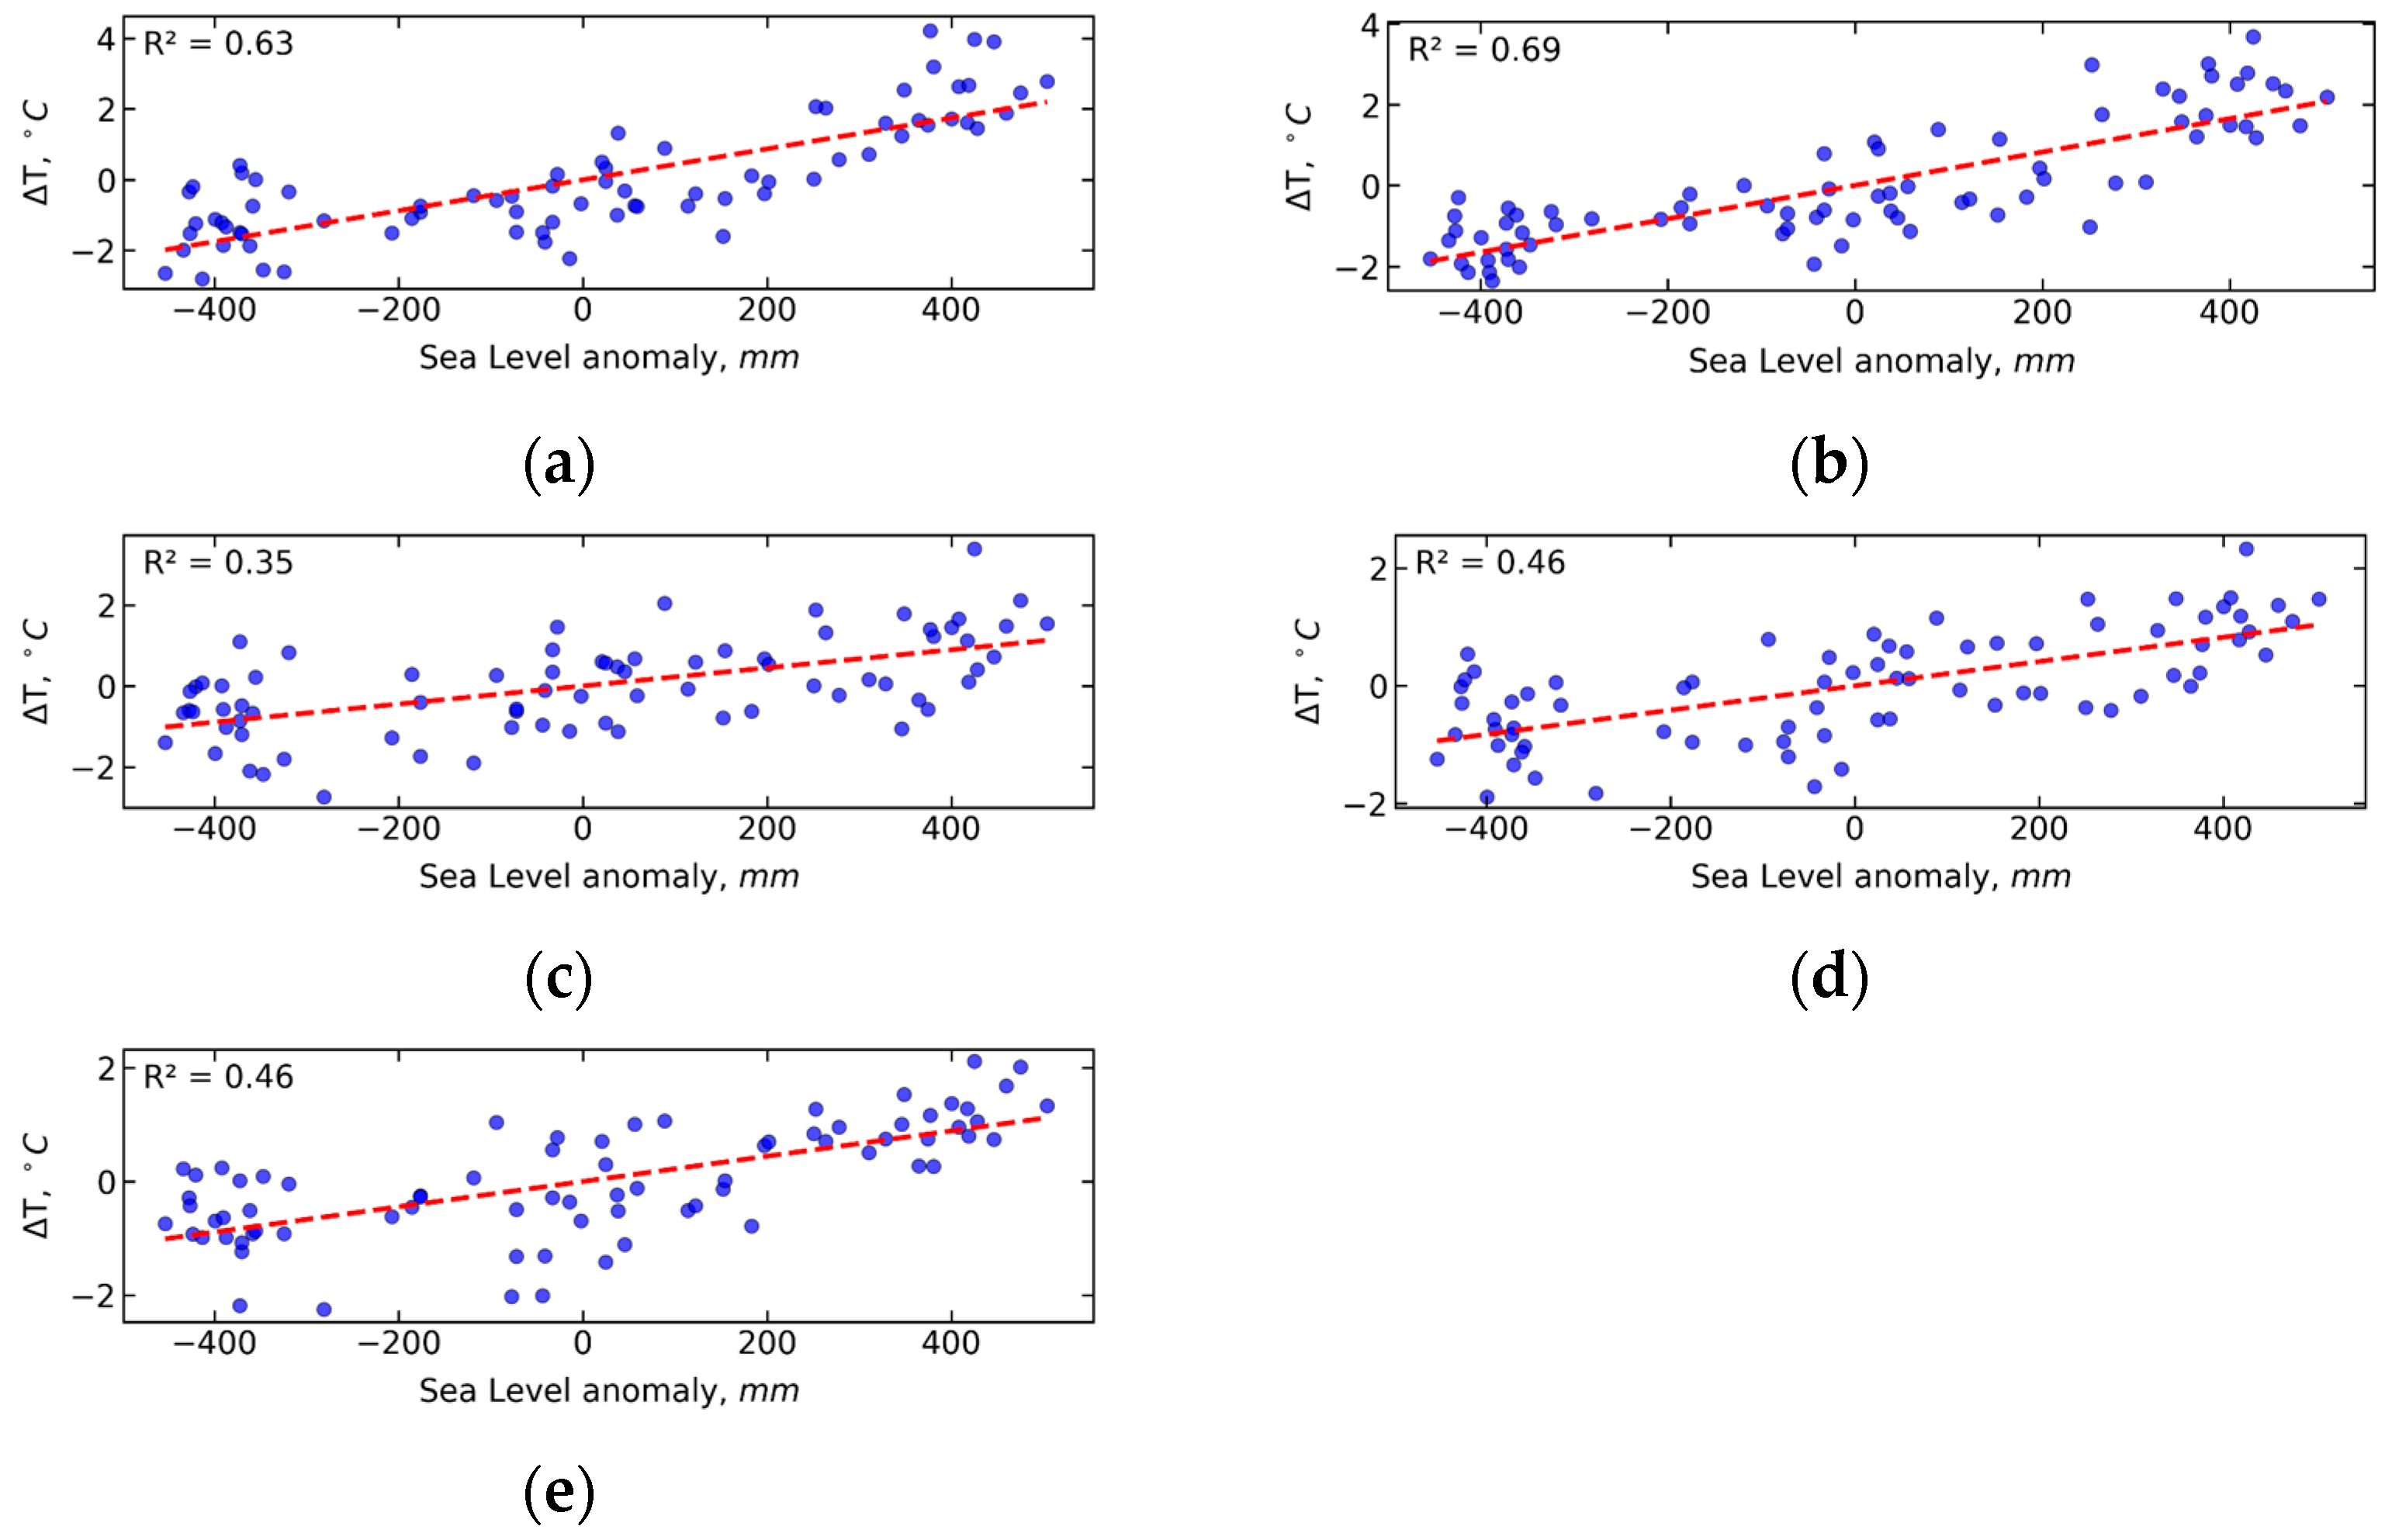
To explore the relationship between SL and SAT over the study period, scatterplots were generated and are presented in Figure 7 and Figure 8. The yearly average, time-unlagged correlation coefficient of approximately 0.80 indicates a strong positive linear relationship between SL anomalies in the tropical North Atlantic and tropical North Pacific SL anomalies and SAT anomalies in the Western and Eastern Arctic. A correlation coefficient of 0.75 between tropical North Atlantic SL anomalies and SAT anomalies in Eastern Europe also suggests a significant relationship. The linear relationship between tropical North Atlantic SL anomalies and SAT anomalies in Siberia is slightly stronger than that between tropical North Pacific SL anomalies and SAT anomalies in Siberia. SL variations in the North Atlantic also show a strong correlation with regional temperature changes (see Figure 8 for details).
An analysis of correlations between annual mean SL in the tropics and annual mean SAT in various regions does not reveal a significant time lag between SL and SAT. However, time lag becomes evident when examining correlations based on seasonal and monthly mean data. Table 7 presents the correlation coefficients among SST, SL, and SAT for the fall season, with the corresponding time lags indicated in parentheses. The focus on the fall season is based on previous findings [26], which indicate that SST exerts its strongest influence on both SL and SAT during this period. As shown in Table 7, the correlation coefficients between SL and SAT are comparable to those between SST and SAT, supporting the potential use of SL use as an indicator and predictor of climate change. The reliability of these results is further supported by the consistency of the observed time lags with the following principle of transitivity: L a g S S T S A T L a g S S T S L + L a g S L S A T , where L a g A B denotes the time lag between variables A and B .
Additional evidence supporting the reliability of SL as a potential predictor is the structural similarity in the variability of SL, SST, and SAT, as observed in their power spectra. Figure 9 displays the power spectra for SL at Key West and SAT anomalies in the Eastern Europe, both calculated for the fall season. After detrending, spectral density maxima are observed at periods of approximately 48, 8, 4, and 2.2 years in both spectra. Similar peaks are also evident in the SST spectra. In Figure 9, the x –axis represents the conditional frequency k , and the y –axis shows the normalized spectral density. The period of oscillation T related to the conditional frequency k by the equation: T = 48 / k .
To describe the relationship between SL in the tropical regions of the North Atlantic and Pacific Oceans and SAT in remote regions, a multiple linear regression model was constructed. Sea level measurements from the Key West and Manila stations were used as independent variables in the model. Formally, the model can be represented by the following equation:
T i = a 0 + a 1 L K W + a 1 L M + ε i ,
where T i is the SAT in the i-th region, L K W and L M are the SL at the Key West and Manila stations, respectively; a 0 , a 1 and a 2 are the regression coefficients, and ε i is the random error term.
Table 8 presents the values of the coefficients of determination and the standard errors of the regression model calculated for the five regions under consideration. The table shows that the coefficients of determination calculated for the Western and Eastern Arctic are significantly higher than those for the other regions. As is well known, the coefficient of determination is a measure of the quality of the forecast obtained using a regression model. Thus, it can be concluded that the regression model best explains the variability of SAT in the Arctic due to SL fluctuations in the tropics.

4. Discussion

Identifying climatically significant causal relationships along with quantitatively assessing the role of various factors in shaping surface temperature trends both globally and across different latitudinal zones over varying time horizons remains one of the major challenges in climate science. From this perspective, incorporating SL as an indicator of climate change and variability in high and mid-latitudes appears to be a promising approach.
The findings of this study support the potential use of SST and SL in the tropical regions of the North Atlantic and North Pacific as a predictor of SAT anomalies in the Arctic and adjacent mid-latitude regions. This is consistent with earlier numerical experiments using global atmospheric and oceanic models, which successfully reproduced high-latitude climatic anomalies when observed tropical SST anomalies were used as forcing data [22,57,58]). The unexpected global SAT anomalies recorded in 2023 and 2024 were also driven by abnormal SST increases in the tropical Atlantic and Indo-Pacific regions.
The reliability of tropical SL as an indicator of the SST influence on SAT at mid- and high latitudes is supported not only by significant correlation coefficients but also by the consistence time lags between SST, SL, and SAT, as well as the structural similarity observed in their spectral characteristics. These findings reinforce the case for using SL in tropical oceanic regions as a predictive tool for SAT variability in the Arctic and nearby mid-latitude zones.
However, it is important to keep in mind that SL variability reflects the influence of multiple factors, including thermohaline circulation, wind forcing, and SST anomalies, all of which, in turn, affect atmospheric circulation and poleward heat transport. Thus, identifying representative predictors of climate variability in high and mid-latitudes remains an important scientific objective.

5. Conclusions

The quality of climate and long-term meteorological forecasts remains relatively low; thus, the search for new methods and approaches to this field is a pressing scientific challenge with significant practical importance. In our view artificial intelligence technologies, particularly deep learning algorithms, offer promising potential in this context. In this study, we have demonstrated that variations in tropical SL can serve as effective predictors in empirical models for forecasting climate anomalies in remote regions. Given that SL is a key indicator of ongoing climate change, its use as a predictor appears both logical and appropriate.
Our future research is focused on developing empirical forecasting models capable of predicting climate anomalies with greater accuracy than currently available methods. In these models, tropical sea levels will serve as one of the most important components of the predictor vector.

Author Contributions

Conceptualization, S.S. and G.A.; methodology, S.S. and G.A.; software, S.S. and Y.A.; validation, S.S., G.A. and Y.A.; writing—original draft preparation, S.S.; supervision, S.S. and G.A.; project administration, S.S.; funding acquisition, S.S. All authors have read and agreed to the published version of the manuscript.

Funding

This research was funded by RSF, grant number 23-47-10003.

Institutional Review Board Statement

Not applicable.

Informed Consent Statement

Not applicable.

Data Availability Statement

The data used in this study were retrieved from the following resources available in public domains: https://psl.noaa.gov (accessed on 21 January 2024); http://wdc.aari.ru/datasets (accessed on 20 January 2024); https://www.metoffice.gov.uk/hadobs/hadisst/ (accessed on 21 January 2021).

Acknowledgments

The authors express their deep gratitude to three anonymous reviewers, who contributed to improving the quality of the presented material. The authors express special gratitude to Natalia Glock and Natalia Kharlanenkova for technical support.

Conflicts of Interest

The authors declare no conflicts of interest.

Appendix A

The lists of North Atlantic and North Pacific tide gauge stations whose data were used for the analysis are presented in Table A1 and Table A2 and shown in Figure A1 and Figure A2, respectively. One of the critical considerations when selecting stations with SL records for the analysis of long-distance relationships (teleconnections) between tropical ocean characteristics and high and mid-latitude temperature anomalies is data availability. Unfortunately, SL observations from many stations contain a large number of irregular gaps. This study uses the longest and most reliable continuous SL time series that are virtually gap-free.
Table A1. List of the North Atlantic tide gauge stations.
ItemStationLatitudeLongitude
1Key West24.56° N81.81° W
2St. Petersburg27.76° N82.63° W
3Cedar Key II29.14° N83.03° W
4Grand Isle29.26° N89.96° W
5Galveston II Pier 21 TX29.31° N94.79° W
6Pensacola30.40°N87.21° W
7Fernanda Beach30.67°N81.47° W
8Fort Pulaski32.03° N80.00° W
9Charleston I32.78° N79.93° W
10Wilmington34.23° N77.95° W
11Sewells Point36.95° N76.33° W
12Lewes38.78° N75.12° W
13Washington DC38.87° N77.02° W
14Annapolis38.98° N76.48° W
15Baltimore39.27° N76.58° W
16Atlantic City39.36° N74.42° W
17Philadelphia39.93° N75.14° W
18New York40.70° N74.01° W
19New London41.36° N72.09° W
20Newport41.51° N71.33° W
21Boston42.35° N71.05° W
22Portland43.66° N70.25° W
23Eastport44.90° N66.90° W
Figure A1. Location of the North Atlantic tide gauge stations.
Atmosphere 16 00913 g0a1
Table A2. List of the North Pacific tide gauge stations.
ItemStationLatitudeLongitude
1Kwajalein8.73° N167.74° E
2Legaspi, Albay13.15° N123.75° E
3Apra Harbor13.44° N144.65° E
4Manila Bay, S. Harbor14.58° N120.97° E
5Hilo, Hawaii Island 19.73° N155.06° W
6Honolulu21.31° N157.87° W
7Midway Island28.21° N177.36° W
8Hosojima32.43° N131.67° E
9San Diego32.71° N117.17° W
10La Jolla32.87° N117.26° W
11Los Angeles33.72° N118.27° W
12Santa Monica34.01° N118.50° W
13Mera34.92° N139.83° E
14Uchiura35.02° N138.89° E
15Aburatsubo 35.16° N139.62° E
16Port San Luis35.18° N120.76° W
17Wajima37.41° N136.90° E
18San Francisco37.81° N122.47° W
19Crescent City41.75° N124.18° W
20Kushiro42.98° N144.37° E
21Astoria46.21° N123.77° W
22Neah Bay48.37° N124.61° W
23Tofino49.15° N125.92° W
24Adak Sweeper Cove51.86° N176.63° W
25Prince Rupert54.32° N130.33° W
26Ketchikan55.33° N131.63° W
27Sitka57.05° N135.34° W
28Yakutat59.55° N139.73° W
Figure A2. Location of the North Pacific tide gauge stations.
Atmosphere 16 00913 g0a2

References

  1. Krishnamurthy, V. Predictability of weather and climate. Earth Space Sci. 2019, 6, 1043–1056. [Google Scholar] [CrossRef] [PubMed]
  2. Lorenz, E.N. Deterministic nonperiodic flow. J. Atmos. Sci. 1963, 20, 130–141. [Google Scholar] [CrossRef]
  3. Lorenz, E.N. The predictability of hydrodynamic flow. Proc. N. Y. Acad. Sci. 1963, 25, 409–432. [Google Scholar]
  4. Leith, C.E. Predictability in theory and practice. In Large-Scale Dynamical Processes in the Atmosphere; Hoskins, B.J., Pearce, R.P., Eds.; Academic Press: New York, NY, USA, 1983; pp. 365–383. [Google Scholar]
  5. Fraedrich, K. Estimating weather and climate predictability on attractors. J. Atmos. Sci. 1987, 44, 722–728. [Google Scholar] [CrossRef]
  6. Chu, P.C. Two kinds of predictability in the Lorenz system. J. Atmos. Sci. 1999, 56, 1427–1432. [Google Scholar] [CrossRef]
  7. DelSole, T. Predictability and information theory. Part I: Measures of predictability. J. Atmos. Sci. 2004, 61, 2425–2440. [Google Scholar] [CrossRef]
  8. Dymnikov, V.P. Potential predictability of large-scale atmospheric processes. Atmos. Ocean. Phys. 2004, 40, 579–585. [Google Scholar]
  9. Palmer, T.N. Predictability of weather and climate: From theory to practice. In Predictability of Weather and Climate; Palmer, T.N., Hagedorn, R., Eds.; Cambridge University Press: Cambridge, UK, 2006; pp. 1–29. [Google Scholar]
  10. Brayshaw, D.J. Weather, Climate and the Nature of Predictability. In Climate Services for the Energy Industry; Troccoli, A., Ed.; Palgrave Macmillan: Cham, Switzerland, 2018; pp. 85–95. [Google Scholar]
  11. Bigg, G.R.; Jickells, T.D.; Liss, P.S.; Osborn, T.J. The role of the ocean in climate. Int. J. Climatol. 2003, 23, 1127–1159. [Google Scholar] [CrossRef]
  12. Gulev, S.K.; Latif, M.; Keenlyside, N.; Park, W.; Koltermann, K.P. North Atlantic Ocean control on surface heat flux on multidecadal timescales. Nature 2013, 499, 464–467. [Google Scholar] [CrossRef]
  13. Årthun, M.; Eldevik, T. On anomalous ocean heat transport toward the Arctic and associated climate predictability. J. Clim. 2016, 29, 689–704. [Google Scholar] [CrossRef]
  14. Årthun, M.; Eldevik, T.; Viste, E.; Drange, H.; Furevik, T.; Johnson, H.L.; Keenlyside, N.S. Skillful prediction of northern climate provided by the ocean. Nat. Commun. 2017, 8, 15875. [Google Scholar] [CrossRef]
  15. Schmitt, R. The Ocean’s Role in Climate. Oceanography 2018, 31, 32–40. [Google Scholar] [CrossRef]
  16. Smith, D.M.; Eade, R.; Scaife, A.A.; Caron, L.P.; Danabasoglu, G.; DelSole, T.M.; Delworth, T.; Doblas-Reyes, F.J.; Dunstone, N.J.; Hermanson, L.; et al. Robust skill of decadal climate predictions. Npj Clim. Atmos. Sci. 2019, 2, 13. [Google Scholar] [CrossRef]
  17. Zardi, D. Atmosphere and ocean interactions. Rend. Lincei Sci. Fis. Nat. 2024, 35, 311–325. [Google Scholar] [CrossRef]
  18. Hoerling, M.P.; Hurrell, J.W.; Xu, T. Tropical Origins for Recent North Atlantic Climate Change. Science 2001, 292, 90–92. [Google Scholar] [CrossRef] [PubMed]
  19. Yoo, C.; Feldstein, S.; Lee, S. The impact of the Madden-Julian Oscillation trend on the Arctic amplification of surface air temperature during the 1979–2008 boreal winter. Geophys. Res. Lett. 2011, 38, L24804. [Google Scholar] [CrossRef]
  20. Yoo, C.; Lee, S.; Feldstein, S.B. Arctic response to an MJO-like tropical heating in an idealized GCM. J. Atmos. Sci. 2012, 69, 2379–2393. [Google Scholar] [CrossRef]
  21. Wettstein, J.J.; Deser, C. Internal variability in projections of twenty-first-century Arctic sea ice loss: Role of the large-scale atmospheric circulation. J. Clim. 2014, 27, 527–550. [Google Scholar] [CrossRef]
  22. Ding, Q.; Wallace, J.M.; Battisti, D.S.; Steig, E.J.; Gallant, A.J.; Kim, H.J.; Geng, L. Tropical forcing of the recent rapid Arctic warming in northeastern Canada and Greenland. Nature 2014, 509, 209–212. [Google Scholar] [CrossRef]
  23. Ye, K.; Wu, R.; Liu, Y. Interdecadal change of Eurasian snow, surface temperature, and atmospheric circulation in the late 1980s. J. Geophys. Res. Atmos. 2015, 120, 2738–2753. [Google Scholar] [CrossRef]
  24. Goss, M.; Feldstein, S.B.; Lee, S. Stationary wave interference and its relation to tropical convection and Arctic warming. J. Clim. 2016, 29, 1369–1389. [Google Scholar] [CrossRef]
  25. Meehl, G.A.; Chung, C.T.; Arblaster, J.M.; Holland, M.M.; Bitz, C.M. Tropical decadal variability and the rate of Arctic sea ice decrease. Geophys. Res. Lett. 2018, 45, 11326–11333. [Google Scholar] [CrossRef]
  26. Alekseev, G.; Kuzmina, S.; Bobylev, L.; Urazgildeeva, A.; Gnatiuk, N. Impact of atmospheric heat and moisture transport on the Arctic warming. Int. J. Climatol. 2019, 39, 3582–3592. [Google Scholar] [CrossRef]
  27. Alekseev, G.V.; Glok, N.I.; Vyazilova, A.E.; Kharlanenkova, N.E.; Kulakov, M.Y. Influence of SST in Low Latitudes on the Arctic Warming and Sea Ice. J. Mar. Sci. Eng. 2021, 9, 1145. [Google Scholar] [CrossRef]
  28. Kondeti, V.P.; Palanisamy, S. Estimating ocean heat content from the ocean thermal expansion parameters using satellite data. Earth Syst. Dynam. 2025, 16, 91–114. [Google Scholar] [CrossRef]
  29. Liu, C.; Jin, L.; Cao, N.; Su, Q.; Cheng, L.; Liao, X.; Allan, R.P.; Qiao, F.; Song, Z.; Mayer, M.; et al. Assessment of the global ocean heat content and North Atlantic heat transport over 1993–2020. npj Clim. Atmos. Sci. 2024, 7, 314. [Google Scholar] [CrossRef]
  30. Widlansky, M.J.; Long, X.; Schloesser, F. Increase in sea level variability with ocean warming associated with the nonlinear thermal expansion of seawater. Commun. Earth Environ. 2020, 1, 9. [Google Scholar] [CrossRef]
  31. Mimura, N. Sea-level rise caused by climate change and its implications for society. Proc. Jpn. Acad. Ser. B Phys. Biol. Sci. 2013, 89, 281–301. [Google Scholar] [CrossRef]
  32. Horwath, M.; Gutknecht, B.D.; Cazenave, A.; Palanisamy, H.K.; Marti, F.; Marzeion, B.; Paul, F.; Le Bris, R.; Hogg, A.E.; Otosaka, I.; et al. Global sea-level budget and ocean-mass budget, with a focus on advanced data products and uncertainty characterization. Earth Syst. Sci. Data 2022, 14, 411–447. [Google Scholar] [CrossRef]
  33. Little, C.M.; Yeager, S.G.; Fasulo, J.T.; Karnauskas, K.B.; Nerem, R.S.; Etige, N.S. Pan-Pacific low-frequency modes of sea level and climate variability. Sci. Adv. 2025, 11, eadw3661. [Google Scholar] [CrossRef]
  34. Bjerknes, I. Atmospheric teleconnections from the equatorial Pacific. Mon. Wea. Rev. 1969, 97, 163–172. [Google Scholar] [CrossRef]
  35. Wallace, J.M.; Gutzler, D.S. Teleconnections in the geopotential height field during the Northern Hemisohere Winter. Mon. Wea. Rev. 1982, 109, 784–812. [Google Scholar] [CrossRef]
  36. Horel, J.; Wallace, J.M. Planetary-scale atmospheric phenomena associated with the Southern Oscillation. Mon. Wea. Rev. 1981, 109, 813–829. [Google Scholar] [CrossRef]
  37. Livezey, R.E.; Mo, K.C. Tropical-extratropical teleconnections during the northern hemisphere winter. Part II: Relationships between monthly mean northern hemisphere circulation patterns and proxies for tropical convection. Mon. Wea. Rev. 1987, 115, 3115–3132. [Google Scholar] [CrossRef]
  38. Neelin, J.D.; Latif, M.; Allaart, M.A.F.; Cane, M.A.; Cubasch, U.; Gates, W.L.; Gent, P.R.; Ghil, M.; Gordon, C.; Lau, N.C.; et al. Tropical air-sea interaction in general circulation models. Clim. Dyn. 1992, 7, 73–104. [Google Scholar] [CrossRef]
  39. Trenberth, K.E.; Branstator, G.W.; Karoly, D.; Kumar, A.; Lau, N.-C.; Ropelewski, C. Progress during TOGA in understanding and modeling global teleconnections associated with tropical sea surface temperatures. J. Geophys. Res. 1998, 103, 14291–14324. [Google Scholar] [CrossRef]
  40. Henderson, S.A.; Maloney, E.D.; Son, S.W. Madden-Julian oscillation Pacific teleconnections. J. Clim. 2017, 30, 4567–4587. [Google Scholar] [CrossRef]
  41. An, S.-I.; Wang, C.; Mechoso, C.R. Teleconnections in the atmosphere. In Interacting Climates of Ocean Basins: Observations, Mechanisms, Predictability, and Impacts; Mechoso, C.R., Ed.; Cambridge University Press: Cambridge, UK, 2020; pp. 54–88. [Google Scholar]
  42. Feng, X.; Ding, Q.; Wu, L. Comprehensive representation of tropical–extratropical teleconnections obstructed by tropical Pacific convection biases in CMIP6. J. Clim. 2023, 36, 7041–7059. [Google Scholar] [CrossRef]
  43. Trenberth, K.E.; Fasullo, J.T.; Branstator, G.; Phillips, A.S. Seasonal aspects of the recent pause in surface warming. Nat. Climate Change 2014, 4, 911–916. [Google Scholar] [CrossRef]
  44. Cohen, J. An observational analysis: Tropical relative to Arctic influence on midlatitude weather in the era of Arctic amplification. Geophys. Res. Lett. 2016, 43, 5287–5294. [Google Scholar] [CrossRef]
  45. Deser, C.; Guo, R.; Lehner, F. The relative contributions of tropical Pacific sea surface temperatures and atmospheric internal variability to the recent global warming hiatus. Geophys. Res. Lett. 2017, 44, 7945–7954. [Google Scholar] [CrossRef]
  46. Feng, X.; Ding, Q.; Wu, L.; Jones, C.; Baxter, I.; Tardif, R.; Stevenson, S.; Emile-Geay, J.; Mitchell, J.; Carvalho, L.M.; et al. A multidecadal-scale tropically driven global teleconnections over the past millennium and its recent strengthening. J. Clim. 2021, 34, 2549–2565. [Google Scholar] [CrossRef]
  47. Hersbach, H.; Bell, B.; Berrisford, P.; Hirahara, S.; Horányi, A.; Muñoz-Sabater, J.; Nicolas, J.; Peubey, C.; Radu, R.; Schepers, D.; et al. The ERA5 global reanalysis. Q. J. R. Meteorol. Soc. 2020, 146, 1999–2495. [Google Scholar] [CrossRef]
  48. Alekseev, G.V.; Svyashennikov, P.N. Natural Variability of Climate Characteristics of the North Polar Region and the Northern Hemisphere; Hydrometeoizdat: Leningrad, Russia, 1991; 159p. [Google Scholar]
  49. Alekseev, G.; Soldatenko, S.; Glok, N.; Kharlanenkova, N.; Angudovich, Y.; Smirnov, M. Tropical Sea Surface Temperature and Sea Level as Candidate Predictors for Long-Range Weather and Climate Forecasting in Mid-to-High Latitudes. Climate 2025, 13, 84. [Google Scholar] [CrossRef]
  50. Hadley Centre Sea Ice and Sea Surface Temperature Data Set (HadISST). Available online: https://www.metoffice.gov.uk/hadobs/hadisst (accessed on 21 January 2021).
  51. Enfield, D.B.; Mestas-Nuñez, A.M.; Mayer, D.A.; Cid-Serrano, L. How ubiquitous is the dipole relationship in tropical Atlantic sea surface temperatures. J. Geophys. Res. Ocean 1999, 104, 7841–7848. [Google Scholar] [CrossRef]
  52. Jöreskog, K.G. Structural analysis of covariance and correlation matrices. Psychometrika 1978, 43, 443–477. [Google Scholar] [CrossRef]
  53. Lawley, D.N.; Maxwell, A.E. Factor Analysis as a Statistical Method, 2nd ed.; Butterworth: London, UK, 1971; 153p. [Google Scholar]
  54. Malinin, V.N.; Angudovich, Y.I. Sea level as an indicator of interannual variability of water circulation and climate in the North Atlantic. Curr. Probl. Remote Sens. Earth Space 2024, 21, 335–353. [Google Scholar] [CrossRef]
  55. Hoerling, M.P.; Eischeid, J.; Perlwitz, J. Regional Precipitation Trends: Distinguishing Natural Variability from Anthropogenic Forcing. J. Clim. 2010, 23, 2131–2145. [Google Scholar] [CrossRef]
  56. Global Climate Highlights 2024. Available online: https://climate.copernicus.eu/global-climate-highlights-2024 (accessed on 21 March 2025).
  57. Shin, S.-I.; Sardeshmukh, P.D. Critical influence of the pattern of tropical ocean warming on remote climate trends. Clim. Dyn. 2011, 36, 1577–1591. [Google Scholar] [CrossRef]
  58. Barsugli, J.J.; Shin, S.-I.; Sardeshmukh, P.D. Sensitivity of global warming to the pattern of tropical ocean warming. Clim. Dyn. 2006, 27, 483–492. [Google Scholar] [CrossRef]
Figure 1. Regions considered in this research (see Table 3 for region numbers. For convenience, the regions are highlighted in different colors).
Atmosphere 16 00913 g001
Figure 2. Changes in monthly average sea level anomalies, 1948–2023, recorded by tide gauges at (a) Key West; (b) Manila Bay South Harbour. Trend lines are shown with dashed red lines.
Atmosphere 16 00913 g002
Figure 3. Heat maps of Pearson’s correlation coefficients between tide gauge station: (a) North Atlantic region (Table A1); (b) North Pacific region (Table A2). The upper-right triangles are detrended cross-correlations, and the lower-left triangles show cross-correlations accounting for trends.
Atmosphere 16 00913 g003
Figure 4. Heat map of the factor load matrix for the North Atlantic tide gauge stations (a) and the corresponding tree-like dendrogram for the hierarchical relationships between clasters with Ward’s linkage to determine the number of clusters in the analysis (b). Vertical dashed-line indicates a threshold point defining the number of clusters identified within the data.
Atmosphere 16 00913 g004
Figure 5. Heat map of the factor load matrix for the North Pacific tide gauge stations (a) and the corresponding dendrogram for the hierarchical clustering with Ward’s linkage to determine the number of clusters in the analysis (b). Vertical dashed-line indicates a threshold point defining the number of clusters identified within the data.
Atmosphere 16 00913 g005
Figure 6. Changes in annual surface air temperature anomalies Δ T ° C , 1948–2023, at different regions: (a) Western Arctic; (b) Eastern Arctic; (c) Western Siberia; (d) Eastern Siberia; (e) Eastern Europe. Trend lines are shown with dashed red lines.
Atmosphere 16 00913 g006
Figure 7. Scatter plot of annual surface temperature anomaly Δ T ° C at different regions versus annual sea level at Key West: (a) Western Arctic; (b) Eastern Arctic; (c) Western Siberia; (d) Eastern Siberia; (e) Eastern Europe. Trend lines are shown with dash red lines.
Atmosphere 16 00913 g007
Figure 8. Scatter plot of annual mean temperature anomaly Δ T ° C versus annual mean sea level at Manila Bay South Harbor: (a) Western Arctic; (b) Eastern Arctic; (c) Western Siberia; (d) Eastern Siberia; (e) Eastern Europe. Trend lines are shown with dash red lines.
Atmosphere 16 00913 g008
Figure 9. Power spectra of sea level, surface air temperature, and sea surface temperature for the fall season: (a) Detrended Key West sea level data (1), Eastern European surface air temperature data (2), and white noise level (3); (b) Spectral density of North Atlantic sea surface temperature with trend (1) and detrended (2).
Atmosphere 16 00913 g009
Table 1. List of the tropical North Atlantic tide gauge stations.
ItemStationLatitudeLongitude
1Key West24.56° N81.81° W
2St. Petersburg27.76° N82.63° W
3Cedar Key II29.14° N83.03° W
4Grand Isle29.26° N89.96° W
5Galveston II Pier 21 TX29.31° N94.79° W
Table 2. List of the tropical North Pacific tide gauge stations.
ItemStationLatitudeLongitude
1Kwajalein8.73° N167.74° E
2Legaspi, Albay13.15° N123.75° E
3Apra Harbor13.44° N144.65° E
4Manila Bay, S. Harbor14.58° N120.97° E
5Hilo, Hawaii Island 19.73° N155.06° W
6Honolulu21.31° N157.87° W
7Midway Island28.21° N177.36° W
Table 3. Geographical characteristics of the regions.
RegionDescription
Region No. 1Part of Eastern Europe (45–60° N; 20–60° E)
Region No. 2Western Siberia (50–70° N; 60–100° E)
Region No. 3Eastern Siberia (50–70° N; 100–160° E)
Region No. 4Western Arctic (70–87.5° N; 20–120° E)
Region No. 5 Eastern Arctic (70–87.5° N; 120–180° E)
Table 4. Eigenvalues of the reduced correlation matrix and the percentage of the total variance accounted by each factor (calculated for the entire North Atlantic tide gauge stations).
Factor NumberEigenvalue% of Total Variance
112.8956.0%
24.1918.2%
31.114.8%
40.994.3%
50.843.6%
60.642.8%
70.472.1%
80.301.3%
90.281.2%
100.221.0%
110.160.7%
120.160.7%
130.140.6%
140.120.5%
150.100.4%
160.090.4%
170.070.3%
180.070.3%
190.050.2%
200.040.2%
210.030.1%
220.020.1%
230.020.1%
Table 5. Eigenvalues of the reduced correlation matrix and the percentage of the total variance accounted by each factor (calculated for the North Pacific tide gauge stations).
Factor NumberEigenvalue% of Total Variance
19.5334.0%
24.7517.0%
32.8110.0%
42.037.2%
51.585.6%
61.224.4%
71.023.7%
Table 6. Decadal trends in surface air temperature ° C / 10   y r in different geographical regions.
Region1970–20231990–2023Last Decade
Western Arctic0.841.181.04
Eastern Arctic0.720.970.52
Western Siberia0.430.450.62
Eastern Siberia0.400.420.52
Eastern Europe0.430.540.58
Table 7. Correlation coefficients between variables SST, SL, and SAT calculated for the fall season, and the corresponding time lags (in brackets).
Tide Gauge StationSST → SLSL → SATSST → SAT
Key West (KW)TNA KW 0.65 (1)KW → East Europe 0.47 (0)TNA → East Europe 0.46 (2)
KW → West Arctic 0.50 (4)TNA → West Arctic 0.60 (4)
Manila Bay South Harbor (M)PWR M 0.91 (1)M → East Arctic 0.77 (1)PWR → East Arctic 0.74 (2)
M → East Siberia 0.58 (5)M → East Siberia 0.59 (5)
Table 8. Regression estimates.
RegionR2Standard Error
West Arctic0.670.97
East Arctic0.710.81
West Siberia0.440.87
East Siberia0.540.63
Eastern Europe0.560.66
Disclaimer/Publisher’s Note: The statements, opinions and data contained in all publications are solely those of the individual author(s) and contributor(s) and not of MDPI and/or the editor(s). MDPI and/or the editor(s) disclaim responsibility for any injury to people or property resulting from any ideas, methods, instructions or products referred to in the content.

