Article

Analysis of the Charge Structure Accompanied by Hail During the Development Stage of Thunderstorm on the Qinghai–Tibet Plateau

1
Institute of New Energy, School of Physics and Electromechanical Engineering, Hexi University, Zhangye 734000, China
2
Department of Plateau Atmospheric Physics, Northwest Institute of Eco-Environment and Resources, Chinese Academy of Sciences, Lanzhou 730030, China
3
School of Electronic Information and Electrical Engineering, Tianshui Normal University, Tianshui 741001, China
*
Author to whom correspondence should be addressed.
Atmosphere 2025, 16(8), 906; https://doi.org/10.3390/atmos16080906 (registering DOI)
Submission received: 15 June 2025 / Revised: 22 July 2025 / Accepted: 24 July 2025 / Published: 26 July 2025
(This article belongs to the Section Meteorology)

Abstract

The charge structure and lightning activities during the development stage of a thunderstorm with a hail-falling process in Datong County of Qinghai Province on 16 August 2014 were studied by using a multi-station observation network composed of a very-high-frequency, three-dimensional, lightning-radiation-source location system and broadband electric field. The research results show that two discharge regions appeared during the development stage of the thunderstorm. The charge structure was all a negative dipolar polarity in two discharge regions; however, the heights of the charge regions were different. The positive-charge region at a height of 2–3.5 km corresponds to −1–−10 °C and the negative-charge region at a height of 3.5–5 km corresponds to −11–−21 °C in one discharge region; the positive-charge region at a height of 4–5 km corresponds to −15–−21 °C and the negative-charge region at a height of 5–6 km corresponds to −21–−29 °C in another region. The charge regions with the same polarity at different heights in the two discharge regions gradually connected with the occurrence of the hail-falling process during the development stage of the thunderstorm, and the overall height of the charge regions decreased. All the intracloud lightning flashes that occurred in the thunderstorm were of inverted polarity discharge, and the horizontal transmission distance of the discharge channel was short, all within 10 km. The negative intracloud lightning flash, negative cloud-to-ground lightning flash, and positive cloud-to-ground lightning flash generated during the thunderstorm process accounted for 83%, 16%, and 1% of the total number of lightning flashes, respectively. Negative cloud-to-ground lightning flashes mainly occurred more frequently in the early phase of the thunderstorm development stage. As the thunderstorm developed, the frequency of intracloud lightning flashes became greater than that of negative cloud-to-ground lightning flashes, and finally far exceeded it. The frequency of lightning flashes decreases sharply and the intensity of thunderstorms decreases during the hail-falling period.

1. Introduction

The Qinghai–Tibet Plateau is characterized by a unique geographical environment, where convective activities are particularly frequent during summer. Notably, multiple thunderstorm processes may occur within a single day during the thunderstorm season. Numerous observational studies have found that most thunderstorms on the Qinghai–Tibet Plateau are localized, with small spatial scales, short durations, and a low frequency of lightning flash generation during the development process of thunderstorms [1,2,3]. Zheng et al. [4] conducted a comparative analysis of thunderstorms in different regions using satellite data and found that the reasons for the low lightning flash rate and small lightning discharge scale during thunderstorm processes on the Qinghai–Tibet Plateau can be attributed to the relatively weak convective processes in thunderstorms. Thunderstorms on the Qinghai–Tibet Plateau, thus, are significantly different from those in other regions, with their charge structure and lightning activity characteristics displaying unique features.
In the 1990s, research results based on the ground electric fields revealed that the charge structures of most thunderstorms in the Qinghai–Tibet Plateau region are tripolar and the ground electric fields of thunderstorms maintain a dominant positive charge overhead during the mature stage. Conversely, a few thunderstorms have a normal dipolar charge structure and the ground electric field maintains a dominant negative for a long time [3,5]. The fast and slow electric field data were used to fit calculations based on the point charge model and point dipole model, which confirmed the common occurrence of tripolar charge structures in this area. The normal tripole charge structure of a thunderstorm has three charge layers, namely the main positive-charge region in the upper layer, the main negative-charge region in the middle layer, and an additional positive center below the main negative-charge region [6,7,8,9,10,11]. Notably, the lower-positive-charge region in the tripolar charge structure of Qinghai–Tibet thunderstorms is comparatively larger than usual [2,5,12,13,14,15,16]. This larger-than-usual positive-charge region does not typically produce a large number of positive cloud-to-ground (CG) lightning flashes, and negative CG lightning flashes often occur during the later stages of the storm [12]. The intracloud (IC) lightning primarily occurs between the larger-than-usual lower-positive-charge region and the middle-negative-charge region in Qinghai–Tibet thunderstorms [15,17,18].
A high-precision, very-high-frequency (VHF), three-dimensional (3D) lightning-radiation-source location system was employed to observe thunderstorms in the Northeastern Qinghai–Tibet Plateau. The data obtained have been used to analyze lightning discharge processes and the evolution of charge structures [19,20]. Analysis of 3D lightning location data indicate that during the development stage, thunderstorms in this region often display a negative dipolar charge structure; at the mature stage, they typically change into a tripolar charge structure; and during the dissipation stage, the charge structure becomes more diverse, involving the coexistence of multiple structures. For multi-cell thunderstorms, the charge structures exhibit considerable complex variation, largely due to merging and splitting processes during storm evolution [21]. Further analysis of lightning activity in tripolar, multi-cell thunderstorms shows that positive IC lightning flashes between the upper-positive- and middle-negative-charge regions are more numerous than negative IC flashes between the middle-negative- and lower-positive-charge regions. However, in some thunderstorms, the number of negative IC flashes is greater than that of positive IC flashes [22]. Additionally, some IC flashes occur within the three charge regions in a tripole-charge-structure thunderstorm. These observations indicated that the evolution of charge structures on the Qinghai–Tibet Plateau is complex and significant during storm development. Different types of thunderstorms also exhibit distinct lightning activity characteristics, which are closely linked to their charge structures.
Changes in lightning activity can serve as indicators of severe weather phenomena, such as hail [23,24,25]. For example, the change in the frequency of CG lightning flashes is closely related to the hailing process [26,27]. Because of the high altitude of the Qinghai–Tibet Plateau, the convective activity of thunderstorms tends to produce hailstones smaller than 1 cm, with lifetimes around 5–10 min [28,29].
This paper analyzes a thunderstorm that occurred on 16 August 2014. This study focused on the charge structures and lightning activity associated with hail-producing thunderstorms during severe weather events in this region. The results indicate that the charge structure during such events differs from typical thunderstorms in this region, with a persistent negative dipolar charge structure maintained throughout the development stage of the thunderstorm.

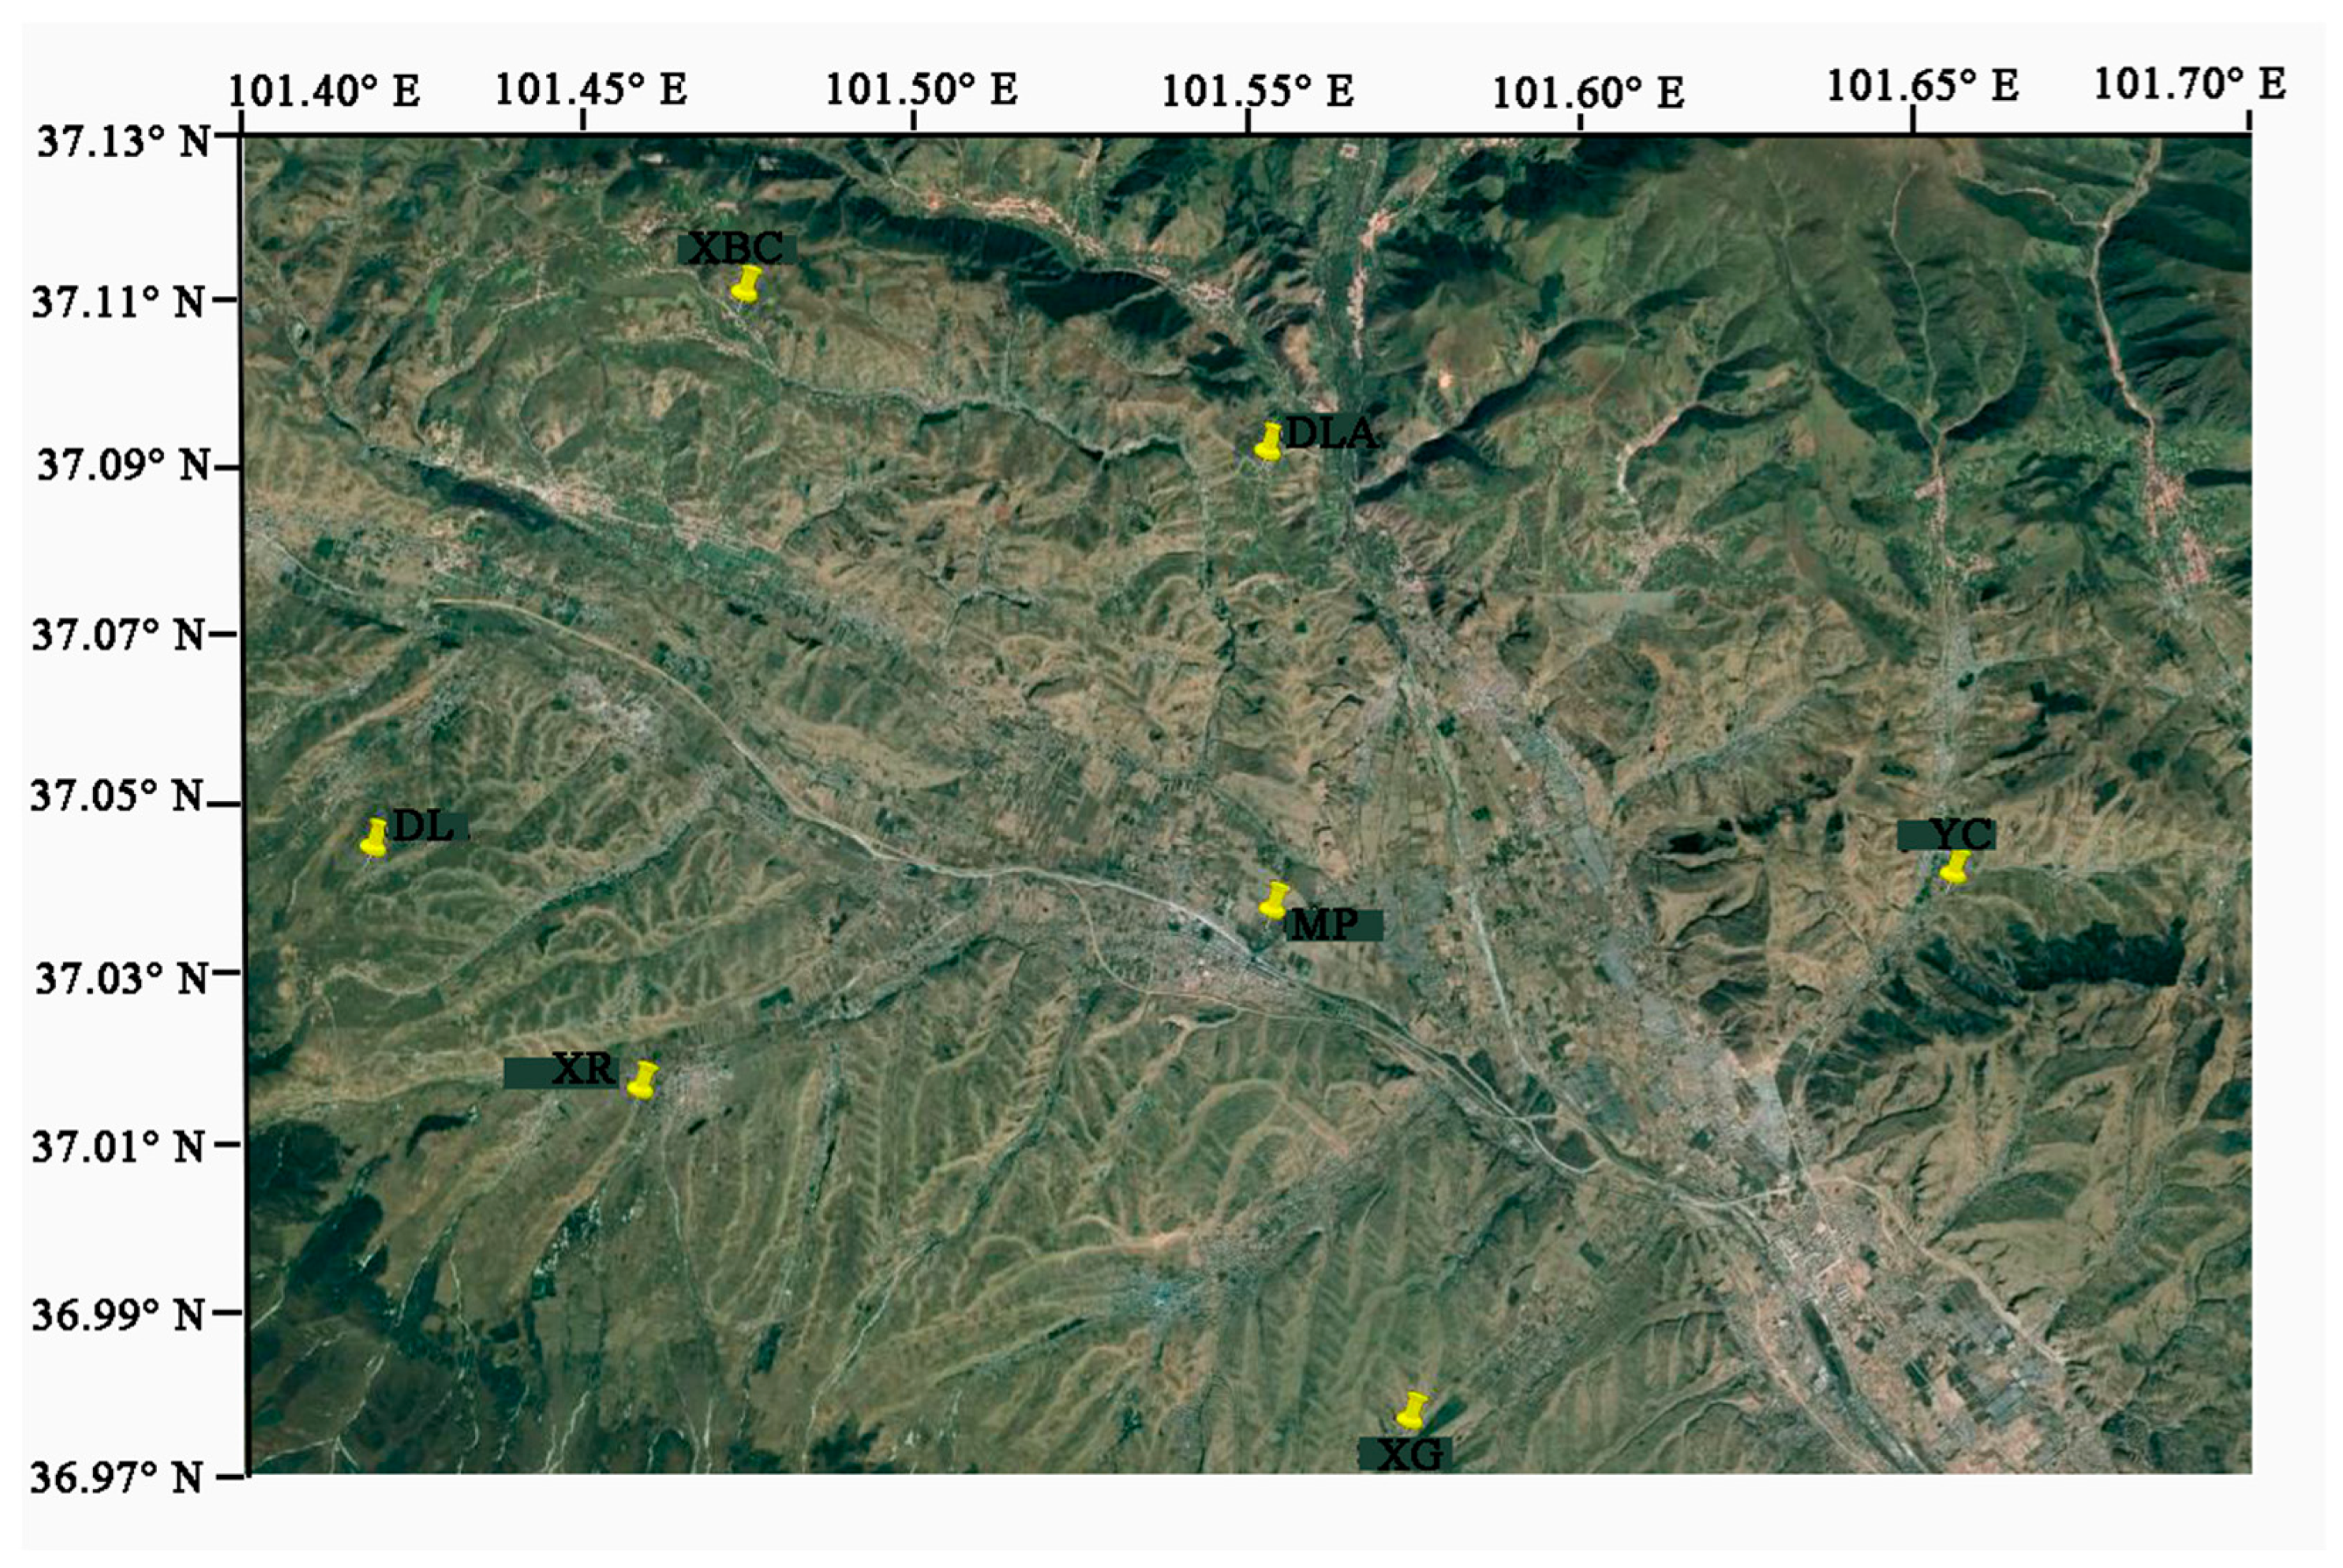
2. Introduction of the Observation Network and Data

Since 2009, the Northwest Institute of Eco-Environment and Resources, Chinese Academy of Sciences, has continuously conducted comprehensive lightning observation experiments in Datong County, Qinghai Province, located in the northeastern part of the Qinghai–Tibet Plateau. Datong County experiences frequent thunderstorms during summer, influenced by the local terrain and environment. These thunderstorms are often accompanied by hail and strong winds as they develop. The observational experiment employs a network of VHF 3D lightning-radiation-source location systems to monitor lightning activity [30]. This lightning-detection network consists of seven observation sub-stations, as shown in Figure 1. The XBC Station serves as the main observation station and is used as the coordinate origin, with coordinates E101.4725989, N37.1096603, and an elevation of 2894.95 m above ground. All distances and heights referenced in this paper are based on the coordinates of the XBC Station. The network has a radius of approximately 10 km.
Each sub-station is equipped with a VHF 3D lightning-radiation-source location-system receiver, which operates at a center frequency of 270 MHz with a bandwidth of 6 MHz (within the 267–273 MHz frequency band). The system has a time resolution of 50 ns for receiving lightning radiation pulses. The network is synchronized using a 20 MHz high-precision clock, GPS-based, to accurately record the arrival times of the same lightning radiation pulses at each sub-station. The location accuracy of the network was validated by comparing the observed trajectories with those generated by a self-made balloon-borne lightning-simulation source equipped with GPS. Results showed that the horizontal error (root mean square, RMS) above the center of the network is between 10 and 48 m, while the vertical error ranges from 20 to 78 m. Outside the network, the location errors increase with distance, displaying a parabolic relationship with the radial distance [31]. These results confirm that the geometric configuration, measurement techniques, and calculation methods of the 3D lightning source location network are reasonable and effective.
Using the absolute arrival times, the non-linear least squares fitting method is applied to determine the occurrence time and location of the lightning source during the discharge process. These 3D lightning location results detail the entire lightning discharge process, providing a spatial depiction image. The method and underlying principle for identifying positive- and negative-charge regions using VHF lightning radiation sources are the same as those employed in the Lightning Mapping Array (LMA) system [32,33,34]. This approach is based on the bidirectional leader model [35,36], which determines the polarity of a charge region by analyzing the transmission mode and the spatiotemporal characteristics of positive and negative leaders within positive- and negative-charge regions [31,36]. Wu et al. [19] employed a synchronous 3D lightning VHF radiation-source location system combined with broadband electric-field observations to demonstrate that the initial breakdown propagation direction is related to the polarity of pulse clusters. Consequently, the polarity of the pulse clusters generated during the initial preliminary breakdown process can also be used to infer the polarity of the charge region. Furthermore, the polarity of the charge regions involved in individual discharges can be identified. By examining the temporal and spatial changes in the polarity and position of multiple lightning flashes in the time series, the evolution of the thunderstorm charge structure in the lightning discharge region can be inferred.
In addition to the VHF 3D lightning-radiation-source mapping system, each observation sub-station is equipped with a broadband electric field with a bandwidth of 10 MHz and a time constant of 100 μs for synchronous measurements. The broadband electric-field data can be used to determine the type of lightning flash. Furthermore, the comprehensive lightning observation experiment includes data from the new-generation C-band Doppler weather radar operated by the Qinghai Meteorological Bureau. This radar provides echo data on the development process of thunderstorms. The radar, located at E101.77 and N36.59, is situated southeast of the observation network, approximately 63.58 km from the main station. The radar completes a full volume scan every 6 min.

3. Analysis of the Charge Structure and Lightning Activity Characteristics During the Thunderstorm Process

3.1. Introduction of the Thunderstorm Overview

The thunderstorm process on 16 August 2014 was a strong local thunderstorm in the Qinghai–Tibet Plateau. It began around 13:36 and ended approximately at 16:20. Observation data indicate that local thunderstorms in this region generally have short durations, typically ranging from 0.5 h to 1 h. However, this thunderstorm lasted about 3 h, which is relatively long, and a hail event occurred during its development stage. Figure 2a–f illustrate the development of the thunderstorm using composite radar reflectivity images. Figure 3 presents the ground electric field at the XBC Station alongside lightning flash rates throughout this thunderstorm. The thunderstorm was first observed at 13:36 (Figure 2a) as an isolated cell located roughly 20 km northwest of the main observation station, XBC. As shown in Figure 2a,b, during the development stage, radar echo intensity and coverage were both minimal. Figure 3a shows that the ground electric field is of negative polarity at this time. The thunderstorm gradually moved toward the southeast during its development process. As the thunderstorm developed further, both the intensity and the area of the strong echo region reached their maximum values in Figure 2c during the development stage. At this point, the thunderstorm has moved over the observation station, and as shown in Figure 3a, the ground electric field has also switched to a positive polarity. Between 14:31 and 14:48, the storm showed signs of weakening, with diminished echo intensity and a smaller area, as seen in Figure 2d. Subsequently, the storm redeveloped, and by 15:18 (Figure 2e), the radar echo intensity peaked at 63 dBZ, marking the most vigorous stage of the thunderstorm before it fully dissipated at 16:19 (Figure 2f). Throughout its life cycle, the thunderstorm did not merge with other thunderstorms in the area. The cloud base height was about 1 km.
During the development stage of the thunderstorm, two hail events were recorded at XBC Station. The first hail event occurred at 14:34 and lasted approximately two minutes until 14:36, with hailstones around 0.5 cm in diameter. The second hail event began at 14:40 and ended at 14:46, with hail sizes varying from 0.5 cm to 1 cm.
To compare with radar echo data, Figure 3b shows the change in lightning flash frequency every six minutes during the development stage of the thunderstorm. The first lightning flash was recorded at 13:38:10. Between 13:38 and 14:48, a total of 372 lightning flashes occurred, including 307 negative IC flashes, 60 negative CG flashes, and 5 positive CG flashes. As shown in Figure 3b, the lightning flash frequency was relatively low from 13:38 to 14:06. It then increased significantly from 14:07 to 14:30, reaching a maximum of 73 flashes per 6 min at 14:18. After 14:31, the frequency began to decline sharply.
This paper focuses on analyzing the charge structure and lightning activity characteristics during the early development stage of the thunderstorm, which was accompanied by hail.

3.2. Analysis of the Thunderstorm Charge Structure

3.2.1. Analysis of the Charge Structure Before Hailing

Figure 4a shows the vertical section of the radar echo from 13:42 to 13:47. Since the thunderstorm moved southeast during its development, the vertical radar echo section was selected along the north–south direction for analysis. Figure 5 is the height of maximum radar echo dBZ value versus the time plot. As shown in Figure 5, the strongest echo at the thunderstorm center exceeds 45 dBZ. However, the area of the strong echo region above 40 dBZ was small in Figure 4a, with a horizontal extent of less than 10 km. The number of lightning flashes generated gradually increased during this time. As the thunderstorm developed further, the echo intensity grew stronger. From 13:54 to 13:59, the radar echoes with an intensity above 50 dBZ become stronger in Figure 5, coinciding with a significant increase in lightning flash frequency. The radar echo from 14:00 to 14:05 is shown in Figure 4c; during this period, the thunderstorm’s cell rapidly dissipates. Figure 5 shows that the height of radar echoes above 40 dBZ decreased sharply, and the horizontal scale contracted to less than 5 km (Figure 4c). Correspondingly, as seen in Figure 3, the lightning flash frequency declined during this time.
Because the VHF 3D lightning-radiation-source location system determines the thunderstorm charge structure based on the lightning discharge process, it can only reveal the charge structure in regions involved in lightning discharges. Therefore, all charge structures discussed in this paper pertain to thunderstorms with lightning activity. By analyzing the lightning discharge process from 13:38 to 14:05, all IC lightning flashes occurred between the upper-negative-charge region and the lower-positive-charge region. The lightning discharge between these two regions is typically referred to as an inverted polarity discharge process. It means that all IC lightning flashes were of negative polarity. The heights of the charge regions are shown in Figure 6a. The lower-positive-charge region was located between 2 and 3.5 km, while the upper-negative-charge region was distributed between 3.5 and 5 km.
The typical tripolar charge structure consists of a negative-charge region in the middle, flanked by a main positive-charge region above and a lower-positive-charge region below [37,38], which the middle main negative-charge region lies within the temperature range of −10 °C to −25 °C [39]. Sounding data that were recorded at 08:00 from Xining Station (101.75° E, 36.71° N), approximately 50 km from XBC Station, were used. Figure 4 and Figure 5 show that the 0 °C isotherm was at roughly 1.8 km above ground, the −10 °C isotherm at 3.3 km, the −20 °C isotherm at around 4.7 km, and the −30 °C isotherm at about 6.1 km. The negative-charge region during the development stage of this thunderstorm (3.5–5 km) falls within the −10 °C to −25 °C temperature range, while the positive-charge region (2–3.5 km) lies between −11 °C and −21 °C. These correspond closely to the temperature layers of the middle-negative- and lower-positive-charge regions in a conventional tripolar charge structure. Figure 5 shows that the radar echo height is low, and the thunderstorm was relatively small. Thus, it is possible that an upper-positive-charge region was either absent or too weak at this stage to participate in lightning discharges. The analysis result of the lightning discharge process from 13:38 to 14:05 indicates the presence of only two charge layers: a positive-charge region between 2 and 3.5 km in height, and a negative-charge region between 3.5 and 5 km in height, and the positive- and negative-charge regions correspond to the main negative-charge region and the lower-positive-charge region in the tripolar charge structure, respectively.
Zhang et al. [24] and Bruning et al. [40] proposed the concept of a negative dipolar charge structure based on the ideas of inverted and tripolar polarity charge structures. They defined the upper-positive- and middle-negative-charge regions in a normal tripolar structure, or the middle-positive- and lower-negative-charge regions in an inverted tripolar structure, as a positive dipolar structure. Conversely, the middle-negative- and lower-positive-charge regions in a normal tripolar structure, or the upper-negative- and middle-positive-charge regions in an inverted tripolar structure, were defined as a negative dipolar structure. This paper adopts these definitions. A charge structure consisting of only two layers, with an upper-negative-charge region and a lower-positive-charge region, is referred to as a negative dipolar charge structure. Therefore, the thunderstorm charge structure from 13:38 to 14:05 can be referred to as a negative dipolar structure.
During the initial development stage of the thunderstorm, the thunderstorm’s scale was small and the lightning flash frequency was relatively low. As shown in Figure 3, the numbers of negative CG flashes and negative IC flashes were approximately equal, and no positive CG flashes were observed within the first 16 min after lightning activity began. Between 14:00 and 14:05, the thunderstorm underwent a rapid and brief dissipation, during which the lightning frequency also dropped sharply. This suggests that convection was likely weak during the early thunderstorm development stage, resulting in a low number of lightning flashes.
Between 14:06 and 14:11, as shown in Figure 5, the 40 dBZ radar echo at the thunderstorm rose to 6 km, and its horizontal extent expanded (Figure 4d), indicating that the thunderstorm had intensified compared to the previous period. All intracloud lightning discharges between 14:06 and 14:11 exhibited inverted polarity. Two typical IC lightning flashes that occurred during this period are presented in Figure 7, illustrating the locations and altitudes of the charge regions. As indicated by the lightning radiation source at position 1, the lightning discharge mainly occurred between a positive-charge region at 2–3.5 km and a negative-charge region at 3.5–5 km, consistent with the charge region heights observed in the previous period. A new discharge region appeared in the southern part of the thunderstorm. According to the lightning radiation source at position 2 in Figure 7, this discharge also had inverted polarity and occurred between a positive-charge region at 3.5–4.5 km and a negative-charge region at 5–6 km. From Figure 7, the thunderstorm charge structure during this period still displayed a negative dipolar polarity. The lightning discharge channels were very short, only a few kilometers. There were two distinct lightning flash discharge regions, with differing heights for the positive- and negative-charge layers, and the regions of the same polarity were not connected. Compared with the radar echo, the height distribution of the positive- and negative-charge regions corresponded well with the vertical extent of the echo region above 40 dBZ within the thunderstorm. As shown in Figure 3, lightning frequency increased significantly from 14:06 to 14:11 (about five times higher than the previous period), with IC flashes greatly outnumbering negative CG flashes.
The increase in radar echo intensity indicated a strengthening of the updraft during this time. This strong updraft at the front of the thunderstorm caused positively and negatively charged hydrometeor particles to be lifted to higher altitudes, forming a new discharge region at a higher level and increasing the lightning flash frequency. Despite this, the lightning discharge process remained in an inverted polarity, and the charge structure continued to be negatively dipolar.
Figure 4e shows a vertical cross-section of the radar echo from 14:12 to 14:17. As depicted, the strongest echo intensity of the thunderstorm reached 50 dBZ, with the height extending up to 5 km (Figure 5), indicating that the thunderstorm continued to intensify. According to Figure 3, the lightning flash frequency peaked at 73 flashes per 6 min during this period. Most flashes were IC flashes, with the frequency of IC flashes far exceeding that of both positive and negative CG flashes. All IC lightning discharges and CG flash discharge within the thunderstorm from 14:12 to 14:17 exhibited inverted polarity, and the thunderstorm charge structure remained negatively dipolar. In the northern region of the thunderstorm (position 1 in Figure 6), lightning discharges occurred between the positive-charge region at 2–3.5 km and the negative-charge region at 3.5–5 km. In the southern region (position 2 in Figure 6), inverted polarity discharges mainly took place between a positive-charge region at 4–5 km and a negative-charge region at 5–6 km, with the positive-charge region in this area showing a slight upward shift in height.
Table 1 presents the atmospheric pressure and wind speed data during this thunderstorm. From the table, it can be seen that in the lower layer (0–2905 m), the wind direction shifted abruptly from due north (0°) to west–northwest (285°), creating a significant vertical wind direction shear. This strong directional shear altered the airflow direction of the lower cloud, forming a “turning layer” that caused the thunderstorm cloud to tilt northward. In the middle layer (2905–6675 m), wind speeds increased from 18.0 m/s to 39.1 m/s at an average rate of 1.02 m/s per 100 m, indicating strong wind speed shear. This intensified horizontal wind shear in the upper-middle levels of the thunderstorm stretched the cloud horizontally by strong westerly winds, resulting in an elongated anvil extending westward. Due to this wind shear, the thunderstorm’s charge layers were displaced. The lower-layer directional shear and middle-layer wind-speed shear caused the thunderstorm’s structure to tilt and led to a lateral displacement of the charge layers, resulting in the formation of two distinct discharge regions.
During the period from 14:18 to 14:23, the cloud top height was raised, although both the area and height of the echo region with intensity above 50 dBZ decreased, as Figure 4f and Figure 5 show. The distribution of the radar echo region above 40 dBZ was still lower in the north and higher in the south, forming an overhanging shape. Such overhanging radar echoes often occur during hail events. Table 1 shows that wind speed increased from 3.1 m/s to 11.8 m/s in the low level (187–2905 m), generating a wind-speed shear-driven vertical circulation. The relatively low wind speed in the lower layer resulted in weaker resistance to particle ascent, making it easier for particles to be entrained into the thunderstorm’s updraft. In contrast, stronger wind speeds in the middle layer promoted the conversion of horizontal momentum into vertical motion, potentially enhancing the rotation of the updraft. This caused particles to move repeatedly up and down within the rotating airflow, further encouraging riming—the collision and freezing of supercooled water droplets onto ice crystals—which favors hail formation. The airflow disturbances caused by strong wind-speed shear in the middle layer also intensified particle collisions, promoting the freezing of supercooled droplets on ice crystal surfaces, accelerating their growth into graupel, thereby providing the material basis for subsequent hail formation. The combined effect of low-level directional shear (187–2905 m) and middle-level wind-speed shear (4605–6675 m) generated vertical vorticity within the thunderstorm. This enhanced vorticity could contribute to the thunderstorm’s development into a strong thunderstorm, whose rotating updraft further organizes the distribution of hydrometeors—such as the accumulation and growth of hailstones.
Analysis of the lightning discharge process between 14:18 and 14:23 highlights that more lightning flashes occurred in the northern part of the thunderstorm before 14:22, where the positive-charge region was located between 2 and 3.5 km and the negative-charge region between 3.5 and 4.5 km. After 14:22, lightning activity increased in the southern part, between a positive-charge region at 4–5 km and a negative-charge region at 5–6 km. The overall thunderstorm charge structure continued to exhibit a negative dipolar polarity.
As shown in Figure 3, the lightning flash frequency decreased during this period but the total number of flashes remained large and reached 57 per 6 min. Some lightning flashes followed a discharge process similar to the IC flash 141815 illustrated in Figure 8. The IC flash 141815 discharge originated in the negative-charge region above 5 km (indicated by the blue radiation source in Figure 8(b2)) and then developed downward. Upon reaching about 4 km in height, the discharge turned to horizontal propagation (as shown by arrow 1 in Figure 8(e1,e2)). After continuing in horizontal propagation for some time, it descended again from the negative-charge region near the initial discharge position. Upon reaching approximately 2–3 km, it shifted again to horizontal development (arrow 2 in Figure 8(e1,e2)) until the discharge ended. The negative-charge region involved in flash 141815 was located between 5 and 6 km. However, within the horizontal transmission range of less than 10 km, there were two positive-charge regions at distinctly different heights, indicating the presence of two separate discharge regions with different positive-charge height distributions in the thunderstorm. Thus, some lightning flashes at the adjacent discharge region discharged from the same negative-charge region to two positive-charge regions at different heights during this period.
The vertical cross-section of the radar echo from 14:24 to 14:29 is illustrated in Figure 4g and Figure 5. During this period, the radar echo height reached 6 km for 40 dBZ and 5 km for 50 dBZ. In Figure 4g, the radar echo reveals a bounded weak echo region—a well-known hallmark of hail occurrence. The height of the charge regions for inverted polarity lightning discharges in the southern part of the thunderstorm remained consistent with the previous period. In the northern part, lightning discharges occurred between the positive-charge region at heights of 1.5–3 km and the negative-charge region at heights of 3–5 km. The height of the charge regions decreased, the thickness of the negative-charge region increased, and the overall charge structure remained negatively dipolar. There were a small number of lightning flashes with a discharge process similar to the lightning flash 141815—showing the same height for the negative-charge region but the heights of the positive-charge regions differed significantly. While the frequency of negative IC lightning flashes continued to decline, it remained at 50 flashes per 6 min, with no positive or negative CG lightning flashes observed.
Between 14:30 and 14:35, the XBC Station recorded hail beginning at 14:34 and lasting about two minutes. As Figure 4h and Figure 5 show, both the area and the height of radar echoes above 50 dBZ sharply decreased, and lightning flash frequency fell substantially. From 14:31 to 14:34, flashes were concentrated in the southern area of the storm, where the echo intensity was strongest. In that region, the charge structure retained its negative dipole configuration, with a positive charge layer between 3.5 km and 5 km and a negative layer between 5 km and 6 km, and the positive layer grew thicker. Only two lightning flashes occurred during the hail event, and the ground electric field switched to negative polarity quickly.

3.2.2. Characteristics of the Charge Structure After Hailing

From 14:36 to 14:41, the thunderstorm continued to move southeast. As shown in the radar echo in Figure 5, the height of echoes above 40 dBZ increased, and echoes above 50 dBZ rose again, indicating a strengthening of the thunderstorm. The ground electric field initially returned to positive before gradually shifting back to negative during this phase. As depicted in Figure 3, lightning flash frequency recovered after the hail ceased. A negative IC lightning flash 143653 occurred after the hailing event. As illustrated in Figure 9, this lightning flash 143653 discharge initially developed downward from the negative-charge region at 5–6 km to the lower-positive-charge region at 4–5 km, then extended horizontally within this positive-charge region (as indicated by arrow 1 in Figure 9) for about 50 ms. Subsequently, the lightning flashes again developed from a position near the initial point along the original channel toward the position marked by arrow 2 in Figure 9. After approximately 30 ms, as shown by arrow 2, the lightning extended about 1 km from the end of a branch of the original positive-charge region at 4–5 km. Following this, the lightning discharge extended downward from the starting position of arrow 3 to an altitude of 2–3 km before turning to develop horizontally. Ultimately, the lightning ended after propagating horizontally for a distance of about 6 km. The horizontally developing positive-charge region manifested at two heights: one at 2–3 km and another at 4–5 km. This lightning flash 143653 developed from the same negative-charge region toward two different positive-charge regions at varying heights. However, as opposed to Figure 7, the two positive-charge regions had overlapping areas, indicating that they were connected at this stage.
Figure 5 shows the radar echo height above 40 dBZ decreased from 14:42 to 14:47, indicating the dissipation of the thunderstorm. Hail began to fall again at 14:40, with hailstones measuring 1 cm in size, until the event ended at 14:46. During the hail period, the lightning flash frequency dropped sharply, changing from 30/6 min to 10/6 min; therefore, the thunderstorm’s intensity weakened.
From 14:36 to 14:47, all lightning discharges were of inverted polarity, with lightning discharge processes resembling the negative IC lightning flash 143653. The positive-charge regions were fully connected, while the negative-charge region was situated at a height of 4–5 km and the positive-charge region sloped between 2 and 4 km, higher in the south and lower in the north. Overall, the height of the thunderstorm charge region distribution decreased, and the thunderstorm charge structure persisted in a negative dipolarity. The changes in lightning flash frequency and the distribution of charge regions from 14:36 to 14:47 indicate that the hailing process led to a weakening of the thunderstorm, with a rapid reduction in the discharge regions within the storm. The charge regions of the same polarity in the thunderstorm tended to converge at the same heights, and an overall descent in the charge region heights occurred. After the hail event, the ground electric field fully switched to negative polarity.

3.3. Analysis of the Relationship Between Characteristics of Lightning Activity and Charge Structure

As shown in Figure 3, negative IC flashes dominated this thunderstorm and accounted for 83% of the total lightning activity during the thunderstorm’s development stage. Negative CG lightning flashes ranked second, comprising 16% of the total, while positive CG flashes were very rare, making up only 1%. In the initial thunderstorm development stages, the frequency of negative CG lightning flashes exceeded that of negative IC lightning flashes. However, as the thunderstorm developed further, the frequency of negative IC flashes began to surpass that of negative CG flashes and eventually became significantly more frequent after 14:05.
During the early stages of thunderstorm development, the positive-charge region was located at heights of 2–3.5 km, while the negative-charge region was located between 3.5 and 5 km. At this stage, the negative-charge region was relatively low, and the lower-positive-charge region was weak, which may be facilitating the development of negative leaders toward the ground that easily produced CG lightning flashes. As the thunderstorm gradually intensified, the strength of the lower-positive-charge region increased, inhibiting the downward progression of negative leaders and resulting in a decrease in the frequency of negative CG lightning flashes and increase in the frequency of negative IC lightning flashes. Furthermore, a new lightning discharge region emerged in addition to the original one within the thunderstorm. In this new lightning discharge region, the positive-charge region was at 4–5 km, while the negative-charge region was at 5–6 km. Since the negative-charge region of this new lightning discharge area was relatively high above the ground, the development of negative leaders toward the ground is unfavorable, leading to the absence of negative CG lightning flashes. Consequently, all lightning discharges originating from this new region were IC lightning flashes.
The discharge process of lightning flash 141815 occurred between the same negative-charge region and two positive-charge regions at different heights. As the lightning flash developed downward toward the lower-positive-charge region, it neutralized a significant amount of negative charge, which might have impeded the negative leader traversal through the positive-charge region and its subsequent movement toward the ground, thereby increasing the prevalence of negative IC lightning flashes.
The intensity of the thunderstorm weakened during the hail event, resulting in an absence of negative CG lightning, with only negative IC lightning flashes observed. At this time, the discharge process was similar to that of flash 143653. The connection between the two layers of lower-positive-charge regions caused an expansion of the lower-positive-charge region. This relatively large lower-positive-charge region may have further impeded the development of negative leaders toward the ground. As a result, negative CG lightning flashes were rare, with almost all lightning discharges being negative IC flashes.
Positive CG lightning flashes were extremely infrequent during this thunderstorm event, accounting for only 1%. This is very similar to other observations of positive CG lightning flashes on the Tibetan Plateau, where positive CG flashes are also very rare [20,41]. Table 2 presents a statistical analysis of lightning discharge durations. The data indicate that the average discharge duration for positive CG lightning flashes was longer than that of negative CG lightning flashes, and the average duration of negative CG lightning flashes was longer than that of IC lightning flashes. Analysis using a 3D lightning-radiation-source location system combined with broadband electric-field waveforms shows that the negative leaders of most negative CG lightning flashes developed downward from the negative-charge region, passed through the positive-charge region, and directed their discharge straight toward the ground, resulting in a very short within-cloud discharge process. In contrast, positive CG lightning flashes typically exhibited longer horizontal discharge processes within the cloud. From this analysis of lightning activity characteristics and charge structure, it is evident that in the thunderstorm development stage, multiple small-scale discharge regions existed. The heights of same-polarity charge regions within different discharge regions varied, and the horizontal transmission distances of lightning discharge processes within the cloud were relatively short. This distribution of charge regions did not favor the sustained horizontal development of positive CG lightning flashes within the cloud, leading to a lower frequency of positive CG lightning flashes.
In summary, the lower-positive-charge region is weak during the early stage of thunderstorm development on the Qinghai–Tibet Plateau, leading to a higher frequency of negative CG lightning flashes. As the thunderstorm progresses, the lower-positive-charge region gradually strengthens, resulting in an increase in negative IC lightning flashes. Additionally, the presence of multiple discharge areas at different heights during the development stage of the thunderstorm inhibits the sustained long-time discharge process within the cloud for positive CG flashes, which accounts for their lower frequency.

4. Conclusions and Discussion

In this paper, we investigated the charge structure and characteristics of lightning activity during the development stage of a local thunderstorm using 3D lightning radiation source data and radar echo. The local thunderstorm included hail events that occurred in Datong County, Qinghai Province, on 16 August 2014. The conclusions were drawn as follows:
  • Throughout the thunderstorm’s development stage, the charge structure remained a negative dipole, although the vertical positions of the same-polarity charge layers differed between the two discharge regions. In one region, the positive-charge region lay between 2.0 and 3.5 km (−1 °C to −10 °C), with the negative-charge region above it from 3.5 to 5.0 km (−11 °C to −21 °C). In the other region, the positive-charge region was from 4.0 to 5.0 km (−15 °C to −21 °C), and the negative-charge region from 5.0 to 6.0 km (−21 °C to −29 °C).
  • In the development stage of the thunderstorm, multiple discharge regions existed within the same thunderstorm cell. The horizontal propagation distance of lightning discharge processes was relatively short, remaining within 10 km.
  • Initially, the frequency of negative IC lightning flashes was approximately equal to that of negative CG lightning flashes. However, as the thunderstorm progressed, the frequency of negative IC flashes surpassed that of negative CG flashes, ultimately leading to a situation where negative IC flashes significantly outnumbered negative CG flashes; negative IC flashes reached six times as many as negative CG flashes.
  • Negative IC lightning flashes accounted for 83% of the total lightning activity during the thunderstorm, with negative CG lightning flashes constituting 16%, and positive CG lightning flashes being extremely rare at only 1%. The average discharge duration for positive CG lightning flashes was the longest, while the duration for negative CG flashes was longer than that for IC flashes.
  • A few lightning flashes occurred during the hail period. The ongoing hail significantly diminished the intensity of the thunderstorm, leading to a decrease in overall height of the charge region and a reduction in lightning flash frequency. Additionally, the hail process resulted in adjustments to the charge regions within the thunderstorm, causing charge regions of the same polarity in different discharge areas to become connected. Despite these changes, the charge structure continued to exhibit negative dipolar polarity.
The radar data indicated that the thunderstorm extended approximately 30 km in the east–west direction and about 20 km in the north–south direction, moving approximately 20 km toward the southeast. Although the overall spatial extent of the thunderstorm was relatively small, multiple discharge regions existed, and same-polarity charge regions exhibited different heights simultaneously. This observation contrasts with previous findings that suggested a more stratified distribution of the charge regions [42]. The sounding data from that day indicated a strong low-level directional wind shear that maintained the tilted structure of the thunderstorm cloud. This tilted structure caused a vertical stratification of the charge regions within the storm and led to the formation of two discharge areas at different heights. Mid-level wind-speed shear enhanced vertical vorticity, promoting the development of a strongly rotating thunderstorm. Additionally, wind-shear-driven airflow regulated the growth and distribution of hydrometeors, thereby influencing precipitation type (rain or hail) and intensity. On that day, the low-level relative humidity in the area was 93%, with a mixing ratio (MIXR) of 7.51 g/kg. At 500 hPa, the MIXR is 2.23 g/kg, although by 400 hPa, it has dropped to 0.2 g/kg. Referring to Table 1 and Figure 5, it is evident that the region of the lower-positive-charge region contains a relatively abundant liquid water content, whereas the area corresponding to the negative-charge region lacks sufficient liquid water. Therefore, the lower-positive-charge region is mainly composed of large graupel particles carrying positive charge, while the upper-negative-charge region likely consists of smaller ice crystals hydrometeors. The ample liquid water content in the lower region favors hail formation within the thunderstorm. However, due to the reduced liquid water content at higher altitudes and relatively weak updrafts during the development stage of the thunderstorm, hail does not appear at higher levels within the thunderstorm cloud. Additionally, the low liquid water content at upper levels is unfavorable for the formation of an upper-positive-charge region, causing the thunderstorm to maintain a negative dipole charge structure throughout its development. The hail events subsequently caused a redistribution of the charge regions inside the thunderstorm, lowering the height of charge layers and connecting charge regions of the same polarity. This demonstrates that the dynamic microphysical processes in thunderstorms influenced the distribution of charge regions and altered the thunderstorm’s charge structure.
As shown in Figure 3, when the thunderstorm was away from the observation station, the ground electric field was negative, indicating a negative-charge region in the upper levels of the storm. As the thunderstorm moved overhead, the ground electric field shifted to positive, reflecting the presence of a positive-charge region in the lower part of the storm. These variations in the electric field confirm that the thunderstorm exhibited a negative dipole charge structure. Two hail events occurred during the storm’s development stage: the first lasted about two minutes, and the second approximately six minutes. Prior to the first hail event, the surface electric field was positive. During hailfall, the field switched from positive to negative. After the hail ended, the electric field briefly recovered to positive before reverting back to negative. These observations suggest that the lower-positive-charge region in this thunderstorm was primarily formed by large, positively charged graupel particles, and that hailfall caused a rapid shift in the electric field toward negative polarity. This pattern suggests that the hailfall weakened the lower-positive-charge region. Additionally, after the charge regions connected and tilted, the exposed upper-level-negative charge may cause a further negative shift in the electric field. Once the field switched to negative polarity, the occurrence of negative polarity IC flashes led to a gradual recovery of the electric field toward positive polarity. However, following the second hail event, the ground electric field fully returned to negative polarity, and lightning activity ceased. This behavior contrasts with previous observations [42], where the electric field recovered to positive polarity and remained that way for an extended period after hailfall. The combined changes in the electric field and charge structure indicate that the hail process affects the distribution of charge regions and accelerates the negative shift of the electric field. Nonetheless, because the updrafts during the development stage of thunderstorms are weaker than those in the mature stage, the electric field cannot fully recover to or sustain a positive polarity. Furthermore, the thunderstorm’s tilted structure helps maintain the negative polarity of the electric field.

Author Contributions

Conceptualization, Y.L. and X.F.; methodology, Y.L. and X.F.; software, X.F.; validation, Y.L., X.F. and Y.Z.; formal analysis, Y.L. and X.F.; investigation, Y.L.; resources, X.F.; data curation, Y.L., X.F. and Y.Z.; writing—original draft preparation, Y.L.; writing—review and editing, Y.L.; visualization, Y.L. and X.F.; supervision, X.F. and. Y.Z.; project administration, Y.L. and Y.Z.; funding acquisition, Y.L. and Y.Z. All authors have read and agreed to the published version of the manuscript.

Funding

This work was supported by the National Natural Science Foundation of China (Grant No. 42165006); the Doctoral Scientific Research Startup Fund of Hexi University (KYQD2024008); General Project of the Soft Science Special Fund under Gansu Provincial Science and Technology Plan (Grant No. 25JRZE003); and the General Project of the 14th Five-Year Plan for Educational Science in Gansu Province (2022) (GS [2022] GHB1872).

Institutional Review Board Statement

Not applicable.

Informed Consent Statement

Not applicable.

Data Availability Statement

Readers can obtain the data from the corresponding author (lliyajun@lzb.ac.cn).

Acknowledgments

We are indebted to all those who participated in our lightning observation experiments in Qinghai. We also thank the Qinghai Provincial Meteorological Bureau for their support. We are also very grateful to the reviewers for their very helpful comments!

Conflicts of Interest

The authors declare no conflict of interest.

References

  1. Qie, X.S.; Toumi, R.; Zhou, Y.J. Lightning activity on the central Tibetan Plateau and its response to convective available potential energy. Chin. Sci. Bull. 2003, 48, 296–299. [Google Scholar] [CrossRef]
  2. Qie, X.S.; Zhang, T.L.; Chen, C.P.; Zhang, G.S.; Zhang, T.; Wei, W.Z. The lower positive charge center and its effect on lightning discharges on the Tibetan Plateau. Geophys. Res. Lett. 2005, 32, L05814. [Google Scholar] [CrossRef]
  3. Zhang, Y.J.; Dong, W.S.; Zhao, Y.; Zhang, G.S.; Zhang, H.F.; Chen, C.P.; Zhang, T. Study of charge structure and radiation characteristic of intracloud discharge in thunderstorms of Qinghai-Tibet Plateau. Sci. China Earth Sci. 2004, 47, 108–114. [Google Scholar]
  4. Zheng, D.; Zhang, Y. New insights into the correlation between lightning flash rate and size in thunderstorms. Geophys. Res. Lett. 2021, 48, e2021GL096085. [Google Scholar] [CrossRef]
  5. Qie, X.S.; Zhang, T.L.; Zhang, G.S.; Zhang, T.; Kong, X.Z. Electrical characteristics of thunderstorms in different plateau regions of China. Atmos. Res. 2009, 91, 244–249. [Google Scholar] [CrossRef]
  6. Williams, E.R. The tripole structure of thunderstorms. J. Geophys. Res. 1989, 94, 13151. [Google Scholar] [CrossRef]
  7. Simpson, G.; Scrase, F.J. The distribution of electricity in thunderclouds. Proc. R. Soc. Lond. Ser. A 1937, 161, 309–352. [Google Scholar]
  8. Marshall, T.C.; Winn, W.P. Measurements of charged precipitation in a New Mexico thunderstorm: Lower positive charge center. J. Geophys. Res. 1982, 87, 7141–7157. [Google Scholar] [CrossRef]
  9. Marshall, T.C.; Stolzenburg, M. Estimates of cloud charge densities in thunderstorms. Geophys. Res. 1998, 103, 19769–19775. [Google Scholar] [CrossRef]
  10. Bateman, M.G.; Marshall, T.C.; Stolzenburg, M.; Rust, W.D. Precipitation charge and size measurements inside a New Mexico mountain thunderstorm. J. Geophys. Res. Atmos. 1999, 104, 9643–9653. [Google Scholar] [CrossRef]
  11. Mo, Q.; Helsdon, J.H., Jr.; Winn, W.P. Aircraft observations of the creation of lower 893 positive charges in thunderstorms. J. Geophys. Res. Atmos. 2002, 107, ACL 4-1–ACL 4-15. [Google Scholar] [CrossRef]
  12. Qie, X.S. The possible charge structure of thunderstorm and lightning discharges in northeastern verge of Qinghai-Tibetan Plateau. Atmos. Res. 2005, 76, 231–246. [Google Scholar] [CrossRef]
  13. Qie, X.; Zhang, Y.; Zhang, Q. Characteristics of lightning discharges and electric structure of thunderstorm. Acta Meteorol. Sin. 2006, 20, 244–257. [Google Scholar]
  14. Cui, H.; Qie, X.; Zhang, Q.; Zhang, T.; Zhang, G.; Yang, J. Intracloud discharge and the correlated basic charge structure of a thunderstorm in Zhongchuan, a Chinese inland plateau region. Atmos. Res. 2008, 91, 425–429. [Google Scholar] [CrossRef]
  15. Zhang, T.; Qie, X.; Yuan, T.; Zhang, G.; Zhang, T.; Zhao, Y. Charge source of cloud-to-ground lightning and charge structure of a typical thunderstorm in the Chinese inland plateau. Atmos. Res. 2009, 92, 475–480. [Google Scholar] [CrossRef]
  16. Zhao, Z.; Qie, X.; Zhang, T.; Zhang, T.; Zhang, H.; Wang, Y.; She, Y.; Sun, B.; Wang, H. Electric field soundings and the charge structure within an isolated thunderstorm. Chin. Sci. Bull. 2010, 55, 872–876. [Google Scholar] [CrossRef]
  17. Liu, X.S.; Ye, Z.X.; Shao, X.M.; Wang, C.W.; Yan, M.H.; Guo, C.M. Intracloud lightning discharges in the lower part of thundercloud. Acta Meteorol. Sin. 1989, 3, 212–219. [Google Scholar]
  18. Wang, D.H.; Liu, X.S. Preliminary Analysis of Thunderstorm Ground Flash Characteristics in Zhongchuan Area, Gansu. Plateau Meteorol. 1990, 9, 405–410. [Google Scholar]
  19. Wu, B.; Zhang, G.; Wen, J.; Zhang, T.; Li, Y.; Wang, Y. Correlation analysis between initial preliminary breakdown process, the characteristic of radiation pulse, and the charge structure on the Qinghai-Tibetan Plateau. J. Geophys. Res. Atmos. 2016, 121, 12434–12459. [Google Scholar] [CrossRef]
  20. Fan, X.P.; Zhang, Y.J.; Zhang, G.S.; Zheng, D. Lightning characteristics and electric charge structure of a hail-producing thunderstorm on the Eastern Qinghai–Tibetan Plateau. Atmosphere 2018, 9, 295. [Google Scholar] [CrossRef]
  21. Li, Y.J.; Zhang, G.S.; Wang, Y.H.; Wu, B. Observation and analysis of electrical structure change and diversity in thunderstorms on the Qinghai-Tibet Plateau. Atmos. Res. 2017, 194, 130–141. [Google Scholar] [CrossRef]
  22. Li, Y.; Zhang, G.; Zhang, Y. Evolution of the charge structure and lightning discharge characteristics of a Qinghai-Tibet Plateau thunderstorm dominated by negative cloud-to-ground flashes. J. Geophys. Res. Atmos. 2020, 125, e2019JD031129. [Google Scholar] [CrossRef]
  23. Zhang, Y.J.; Hua, G.Y.; Yan, M.H.; An, X.M. Correlative Analysis of Electrical Activities, Convection and Precipitation Characteristics in Convective and Stratiform Cloud Systems. Plateau Meteorol. 1995, 14, 396–405. [Google Scholar]
  24. Zhang, Y.J.; Xu, L.T.; Zheng, D.; Wang, F. Research Progress on An tipolar Charge Structures in Severe Storms. J. Appl. Meteorol. Sci. 2014, 25, 513–526. [Google Scholar]
  25. Feng, G.L.; Chen, W.X.; Liu, S.J.; Li, Q.C. Analysis of Lightning Characteristics in Shandong Region. J. Appl. Meteorol. Sci. 2002, 13, 347–355. [Google Scholar]
  26. Feng, G.L.; Qie, X.S.; Yuan, T.; Niu, S. Lightning activity and precipitation structure of hailstorms. Sci. China Ser. D Earth Sci. 2007, 50, 629–639. [Google Scholar] [CrossRef]
  27. Chen, Z.Z. The characteristics of lightning from cloud to ground accompanying with hailstroms. Acta Meteorol. Sin. 1995, 53, 367–374. [Google Scholar]
  28. Qie, X.S.; Zhang, Y.J.; Yuan, T. A review of atmospheric electricity research in China. Adv. Atmos. Sci. 2015, 32, 169–191. [Google Scholar] [CrossRef]
  29. Liu, Z.G.; Wang, P.X.; Yang, J.C.; Yan, H.X.; Mao, Y.Q.; Cheng, P. Statistical Characteristics of Local Hail in the Northeastern Tibetan Plateau and Discussion on Special Hail Cloud Monomers. J. Arid Meteorol. 2007, 25, 7. [Google Scholar]
  30. Zhang, G.S.; Wang, Y.H.; Qie, X.S.; Zhang, T.; Zhao, Y.X.; Li, Y.J.; Cao, D.J. Using lightning locating system based on time-of-arrival technique to study three-dimensional lightning discharge processes. Sci. China Earth Sci. 2010, 53, 591–602. [Google Scholar] [CrossRef]
  31. Rison, W.; Thomas, R.J.; Krehbiel, P.R.; Hamlin, T.; Harlin, J. A GPS-based three-dimensional lightning mapping system: Initial observations in central New Mexico. Geophys. Res. Lett. 1999, 26, 3573–3576. [Google Scholar] [CrossRef]
  32. Krehbiel, P.R.; Thomas, R.J.; Rison, W.; Hamlin, T.; Hamlin, J.; Davis, M. GPS-based mapping system reveals lightning inside storms. Eos Trans. Am. Geophys. Union 2000, 81, 21–25. [Google Scholar] [CrossRef]
  33. MacGorman, D.R.; Rust, W.D.; Schuur, T.J.; Biggerstaff, M.I.; Straka, J.M.; Ziegler, C.L.; Mansell, E.R.; Bruning, E.C.; Kuhlman, K.M.; Lund, N.R.; et al. TELEX: The Thunderstorm Electrification and Lightning Experiment. Bull. Am. Meteorol. Soc. 2008, 9, 997–1013. [Google Scholar] [CrossRef]
  34. Mazur, V.; Ruhnke, L.H. Common physical processes in natural and artificially triggered lightning. J. Geophys. Res. Atmos. 1993, 98, 12913–12930. [Google Scholar] [CrossRef]
  35. Kasemir, H.W. A contribution to the electrostatic theory of lightning discharge. J. Geophys. Res. Atmos. 1960, 65, 1873–1878. [Google Scholar] [CrossRef]
  36. Shao, X.M.; Krehbiel, P.R. The spatial and temporal development of intracloud lightning. Geophys. Res. Lett. 1996, 101, 26641–26668. [Google Scholar] [CrossRef]
  37. Krehbiel, P.R.; Brook, M.; Mccrory, R.A. An analysis of the charge structure of lightning discharges to ground. J. Geophys. Res. 1979, 84, 2432. [Google Scholar] [CrossRef]
  38. Krehbiel, P.R. The Electrical Structure of Thunderstorms, The Earth′s Electrical Environment; National Academy Press: Washington, DC, USA, 1986; pp. 90–113. [Google Scholar]
  39. Takahashi, T. Riming electrification as a charge generation mechanism in thunderstorms. J. Atmos. Sci. 1978, 35, 1536–1548. [Google Scholar] [CrossRef]
  40. Bruning, E.C.; Weiss, S.A.; Calhoun, K.M. Continuous variability in thunderstorm primary electrification and an evaluation of inverted-polarity terminology. Atmos. Res. 2014, 135–136, 274–284. [Google Scholar] [CrossRef]
  41. Liu, D.; Li, F.; Qie, X.; Sun, Z.; Wang, Y.; Yuan, S.; Sun, C.; Zhu, K.; Wei, L.; Lyu, H.; et al. Charge structure and lightning discharge in a thunderstorm over the central Tibetan Plateau. Geophys. Res. Lett. 2024, 51, e2024GL109602. [Google Scholar] [CrossRef]
  42. Li, Y.; Zhang, G.; Lyu, W.; Zhao, Y. Analysis of Inverted Charge Structure and Lightning Activity during the 8.14 Local Hailstorm on the Qinghai–Tibet Plateau. Atmosphere 2023, 14, 1795. [Google Scholar] [CrossRef]
Figure 1. The site distribution of VHF 3D lightning-location-system observation network.
Atmosphere 16 00906 g001
Figure 2. The radar composite reflectivity of thunderstorms at different times on 16 August 2014, the ○ represents the observation stations. XBC Station is a hail observation station.
Atmosphere 16 00906 g002
Figure 3. (a) Changes in the ground electric field at XBC Station on 16 August 2014. (b) The frequency distribution of different types of lightning flashes during thunderstorm development process on 16 August 2014. All IC lightning flashes were of negative polarity.
Atmosphere 16 00906 g003
Figure 4. The north–south cross-section of basic reflectivity in different times of thunderstorm development process on 16 August 2014: (a) 13:42 (the coordinates of cross-section (−13.86, 0; −13.86, 25); (b) 13:54 (−12.04, 0; −12.04, 25); (c) 14:00 (−7.87, 1; −7.87, 20); (d) 14:06 (−10.74, 0; −10.74, 25); (e) 14:12 (−8.9, −5; −8.9, 25); (f) 14:18 (−5.8, −5; −5.8, 20); (g) 14:24 (−3.5, −5; −3.5, 25); (h) 14:30 (−2.4, −10; −2.4, 10).
Atmosphere 16 00906 g004
Figure 5. The height versus time plot of maximum radar echo dBZ values on 16 August 2014. Color shade and black contour stand for radar reflectivity (unit: dBZ); black dashed line stands for the level isotherm (°C). Labels on the left-hand axis stand for the height (km, AGL).
Atmosphere 16 00906 g005
Figure 6. Variation in the height of negative IC lightning-mapping radiation source in the north–south direction during the thunderstorm development stage. The red dots represent the positive-charge region, and blue dots represent the negative-charge region.
Atmosphere 16 00906 g006
Figure 7. The maps of 3D lightning-discharge radiation source in different regions during 14:12–14:17: (a) the distribution of lightning source height changing with time; (b) the height distribution of lightning sources in the east–west direction; (c) statistical chart of lightning radiation sources changing with height; (d) horizontal distribution plan of lightning radiation sources; (e) the height distribution of lightning sources in a north–south direction. Red and blue represent the regions of positive and negative charge.
Atmosphere 16 00906 g007
Figure 8. The distribution maps of IC flash 141815 3D lightning radiation source. The different colors in the left figure represent the time variation in the lightning radiation source: (a1,a2) the distribution of lightning source height changing with time; (b1,b2) the height distribution of lightning sources in the east–west direction; (c1,c2) statistical chart of lightning radiation sources changing with height; (d1,d2) horizontal distribution plan of lightning radiation sources; (e1,e2) the height distribution of lightning sources in a north–south direction. The other diagrams of the right figure are the same as in Figure 7. The gray lines with arrows and number represent the sequence of development of the lightning discharge channel and channel order.
Atmosphere 16 00906 g008
Figure 9. The maps of negative IC lightning flash 143653 VHF 3D lightning radiation source. The different colors in the figure represent the time variation in the lightning radiation source: (a) the distribution of lightning source height changing with time; (b) the height distribution of lightning sources in the east–west direction; (c) statistical chart of lightning radiation sources changing with height; (d) horizontal distribution plan of lightning radiation sources; (e) the height distribution of lightning sources in a north–south direction. The gray lines with arrows and number represent the sequence of development of the lightning discharge channel and channel order.
Atmosphere 16 00906 g009
Table 1. Barometric pressure and wind speed table.
PRES (hPa)Height (m)Wind Direction (°)Wind Speed (m/s)Wind Speed Shear Rate (m/s/100 m)Wind Direction Shear Rate
(°/100 m)
700.01870 3.10.390
500.02905285 11.80.3910.4
400.0460530018.00.360.88
300.06675300 39.11.020
250.07935290 46.80.60.79
225.08648285 50.90.570.7
200.09445290 50.900.62
The data are from the balloon sounding at Xining Station.
Table 2. The statistics of different types of lightning discharge duration.
Type of Lightning Flash Maximum Value (ms)Minimum Value (ms)Average Value (ms)
IC63932227
Negative CG430132267
Positive CG607282383
Disclaimer/Publisher’s Note: The statements, opinions and data contained in all publications are solely those of the individual author(s) and contributor(s) and not of MDPI and/or the editor(s). MDPI and/or the editor(s) disclaim responsibility for any injury to people or property resulting from any ideas, methods, instructions or products referred to in the content.

