Abstract
The Yangtze River Delta urban agglomeration, characterized by high population density, an advanced transportation system, and a concentration of industrial activity, is one of the regions severely affected by O3 pollution in central and eastern China. Using data collected from 251 monitoring stations between 2015 and 2025, this paper analyzed the spatio-temporal variation of 8 h O3 concentrations and instances of exceedance. On the basis of exploring the influence of meteorological factors on regional 8 h O3 concentration, the potential source contribution areas of pollutants under the exceedance condition were investigated using the HYSPLIT model. The results indicate a rapid increase in the 8 h O3 concentration at a rate of 0.91 ± 0.98 μg·m−3·a−1, with the average number of days exceeding concentration standards reaching 41.05 in the Yangtze River Delta urban agglomeration. Spatially, the 8 h O3 concentrations were higher in coastal areas and lower in inland regions, as well as elevated in plains compared to hilly terrains. This distribution was significantly distinct from the concentration growth trend characterized by higher levels in the northwest and lower levels in the southeast. Furthermore, it diverged from the spatial characteristics where exceedances primarily occurred in the heavily industrialized northeastern region and the lightly industrialized central region, indicating that the growth and exceedance of 8 h O3 concentrations were influenced by disparate factors. Local human activities have intensified the emissions of ozone precursor substances, which could be the key driving factor for the significant increase in regional 8 h O3 concentrations. In the context of high temperatures and low humidity, this has contributed to elevated levels of 8 h O3 concentrations. When wind speeds were below 2.5 m·s−1, the proportion of 8 h O3 concentrations exceeding the standards was nearly 0 under almost calm wind conditions, and it showed an increasing trend with rising wind speeds, indicating that the potential precursor sources that caused high O3 concentrations originated occasionally from inland regions, with very limited presence within the study area. This observation implies that the main cause of exceedances was the transport effect of pollution from outside the region. Therefore, it is recommended that the Yangtze River Delta urban agglomeration adopt economic and technological compensation mechanisms within and between regions to reduce the emission intensity of precursor substances in potential source areas, thereby effectively controlling O3 concentrations and improving public living conditions and quality of life.
1. Introduction
High concentrations of ozone (O3) in the troposphere significantly negatively affect human health [1], particularly in densely populated areas, leading to respiratory and cardiovascular diseases [2]. This results in a global loss of over 5 million disability-adjusted life years [3]. Given the continuously growing population and the anticipated increase in O3 levels, emergency hospitalizations are expected to rise by 11.7% by 2050 [4]. Furthermore, O3 pollution adversely impacts climate change, the carbon sequestration capacity of ecosystems, and food security [5,6]. Consequently, since the commencement of the “14th Five-Year Plan,” controlling atmospheric O3 pollution has become a key priority in China’s environmental protection agenda.
O3 is not directly emitted into the atmosphere; rather, it is a secondary pollutant formed through photochemical reactions involving nitrogen oxides (NOx), volatile organic compounds (VOCs), and other precursor substances under suitable conditions [7]. The rate of these photochemical reactions is influenced by temperature and humidity. The increase in ozone concentration is also influenced by surface types, topography, and wind direction [8,9,10]. Changes in surface types not only affect the intensity of biogenic precursor emissions but also relate to the dry deposition rate of ozone [11]. Stable weather conditions are also crucial for the accumulation of ozone and sustained pollution [12]. Atmospheric turbulence facilitates the diffusion of O3 pollutants and exacerbates pollution levels between regions through long-distance transport. This turbulence disrupts the linear relationship between O3 concentration and the emission intensity of precursors and meteorological factors within a region, complicating the identification of potential sources of pollutant contributions [13].
China, recognized as one of the world’s fastest-growing economies, has witnessed environmental pollution and ecological damage rise to major public concerns amid its industrial expansion for global markets and the development of transportation infrastructure [14]. Following the systematic implementation of key environmental policies, including the “Action Plan for the Prevention and Control of Air Pollution” and the “Three-Year Action Plan for Air Pollution Control,” significant progress has been made in reducing concentrations and mitigating the impacts of major pollutants, such as PM2.5 [15], black carbon [16], and nitrogen oxides [17]. However, ground-level O3 pollution has emerged as an increasing environmental challenge, displaying persistent and widespread characteristics across affected regions. Currently, significant progress has been made in the study of the mechanisms of O3 formation, the identification of precursor emission sources, impacts on agricultural crops and their feedback, and mitigation strategies [11,18,19]. However, the spatiotemporal patterns of O3 concentrations under exceedance conditions and the driving factors behind them, particularly the potential contribution areas of pollution sources, still require further analysis to ensure that subsequent management measures and strategies are more targeted [20].
The Yangtze River Delta (YRD) urban agglomeration, characterized by intense anthropogenic activities and industrial concentration, has become a critical research area for O3 pollution studies in China [21]. Daily monitoring data from 2022 indicated that the region’s 90th percentile value of 8 h O3 concentration reached 162 μg·m−3, surpassing the national mean by over 10% and ranking as the second highest nationwide, exceeded only by the Beijing–Tianjin–Hebei region [20]. Currently, research on ozone in the region is largely limited to aspects such as precursor emission sources and formation mechanisms [18,19,21], the effects of deposition processes, and different underlying surfaces on degradation rates [11], as well as the impacts and feedback of concentration changes on crops [20]. Therefore, through comprehensive analysis of spatiotemporal variations and exceedance events of ground-level O3 concentrations across the YRD urban agglomeration, this study systematically investigated the meteorological drivers of O3 pollution. By employing the HYSPLIT trajectory model [22], we further identified potential source contribution areas during pollution episodes, thereby enhancing mechanistic understanding of O3 formation and air quality deterioration patterns in the economically vital region.
2. Materials and Methods
2.1. Study Area
The YRD urban agglomeration encompasses 41 cities across the jurisdictions of Jiangsu, Zhejiang, Shanghai, and Anhui, covering an area of approximately 3.59 × 10⁵ km2. This region lies within the transition zone between subtropical and temperate climates, characterized by an average annual temperature of 15.59 °C and annual precipitation of 1248.8 mm, influenced by the East Asian monsoon [23]. While regional vegetation coverage is considerable, the landforms vary considerably. The southern parts of Jiangsu and Anhui are predominantly characterized by low hills and knolls, shaped by the Jiangnan hills. In contrast, the central and northern sections, including Shanghai, consist mainly of low plains formed by the Huang-Huai Plain and the Jiang-Huai Plain. Zhejiang Province features rugged terrain with the Zhe-Min Hills and includes mountains exceeding 1000 m in elevation, such as the Tianmu, Jiulong, Yandang, and Kuaiji Mountains (Figure 1). The YRD urban agglomeration is demographically and economically significant, with a population of 237 million. Its transportation infrastructure includes 59.84 million privately owned vehicles, and the regional economy contributes approximately 24% to China’s GDP, of which industrial activities account for 40% [24]. Amid China’s escalating ground-level O3 pollution crisis, the YRD urban agglomeration has emerged as one of the four principal hotspots for O3 pollution in eastern and central China [1].
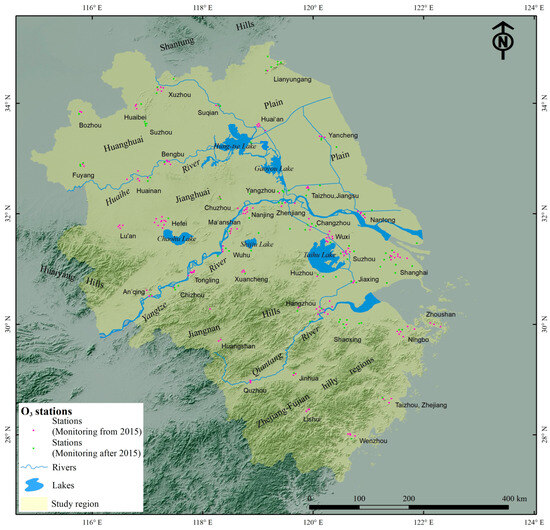
Figure 1.
Topographic characteristics and distribution of near-ground O3 monitoring stations in the YRD urban agglomeration.
2.2. Data
From January 2015 to February 2025, the 1 h O3 concentration data from 251 surface monitoring stations in the YRD Urban Agglomeration was provided by the Chinese National Environmental Monitoring Center (http://www.cnemc.cn/, accessed on 24 July 2025.) after quality control, in accordance with the “Ambient Air Quality Standards” (GB 3095-2012) [25]. The 8 h O3 concentration was the moving average of the 1 h data. Among these monitoring stations, 157 have been continuously monitored since 2015 (Figure 1). The analyzed 8 h O3 concentration data must meet the requirement that the average concentration value reaches the standard for at least 6 h out of 8 h [26]. The spatial distribution, inter-annual variability, and number of days exceeding 8 h O3 concentrations were obtained using ordinary Kriging interpolation. Additionally, meteorological parameters, including temperature, precipitation, and relative humidity, were acquired from the China National Meteorological Science Data Center (http://data.cma.cn/, accessed on 24 July 2025.). A digital elevation model (DEM) data with a spatial resolution of 7.5 arc-seconds (approximately 250 m) was obtained from the United States Geological Survey (https://earthexplorer.usgs.gov). Additionally, Global Data Assimilation System (GDAS) data at 0.5° × 0.5° resolution was downloaded from the National Centers for Environmental Prediction (https://psl.noaa.gov/data/gridded/data.ncep.html, accessed on 19 July 2025) for air parcel back trajectory analysis.
2.3. Methodology
2.3.1. Backward Trajectory Model
The HYSPLIT model (v5.2.0) was adopted here to determine the transport paths and potential source contribution areas of pollutants, so as to reveal the reasons for the exceedance of O3 concentrations in the YRD urban agglomeration [22,27]. The model calculated the 48 h backward trajectories of air mass arriving at the study area. The starting time interval was 1 h, and the starting altitude was set at 1000 m, which was chosen to accurately reflect the average flow field characteristics of the boundary layer in the complex terrain area [28]. After the obtained backward trajectories were clustered by the angle distance method to determine the main transport path of pollutants, the potential source contribution function with weight values (WPSCF) was further used to determine the potential source area of O3. For more information about the HYSPLIT backward trajectory model, please refer to https://www.arl.noaa.gov/hysplit/, accessed on 19 July 2025.
2.3.2. Terrain Ruggedness Index
In addition to affecting the variation of meteorological factors and the emission of O3 precursors, complex regional terrains may also significantly influence the diffusion and accumulation of O3 [8]. Consequently, terrain indices are employed to quantify these terrain factors and ascertain their correlation with 8 h O3 concentrations. Such indices are commonly utilized in studies examining watershed hydrological characteristics and disaster assessments [29]. The terrain index employed in this study is the Topographic Roughness Index (TRI), which characterizes terrain ruggedness by measuring the average elevation difference between a central pixel and its eight surrounding pixels [30]. The specific calculation method is as follows:
where TRI was used for local indicators of spatial autocorrelation (LISA) and global Moran’s I [31]. The formula for the LISA is as follows:
where , , , and are the values of the properties l and m of the space unit p, respectively. and are the average values of properties l and m, respectively. and are the variances of properties l and m, respectively [32].
Moran’s I formula for global spatial autocorrelation is as follows:
where xi and xj are the observed values at points i and j, respectively. is the average of x. Wij is the spatial weight adjacency matrix of space units i and j (i, j = 1, 2, 3, …, n). Global Moran’s I is between −1 and 1, and its positive and negative values correspond to the positive and negative spatial correlation, respectively [26].
3. Results
3.1. Change in 8 h O3 Concentration
3.1.1. Temporal Variation of 8 h O3 Concentration
In 2024, the average ground-level 8 h O3 concentration in the YRD urban agglomeration, measured at 251 sites, was 71.69 ± 22.72 μg·m−3. Seasonal analysis demonstrated distinct patterns in the 8 h O3 concentrations, with summer (June–August) exhibiting the highest mean value of 85.75 ± 20.32 μg·m−3, which was approximately 20% lower than the levels recorded in Shijiazhuang City, a major industrial and transportation hub in North China [33]. Following summer, the average concentrations in spring (March to May) and autumn (September to November) were 83.76 ± 18.81 μg·m−3 and 66.26 ± 17.80 μg·m−3, respectively. The lowest average concentration occurred in winter (December to February), at 50.47 ± 12.60 μg·m−3 (Figure 2a), representing about 60% of the summer average.
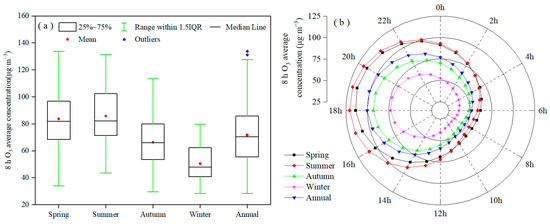
Figure 2.
Variations of 8 h O3 concentration in the YRD urban agglomeration at the (a) seasonal scale and (b) hourly scale.
The seasonal variation in the 8 h O3 concentration was consistent with the natural conversion of precursor pollutants into O3 under conditions of high temperature and low humidity [21], as well as with the impact of regional winds on the transport and diffusion of O3 and its precursors. This was reflected in the strong winds during winter in the Yangtze River Delta region, driven by inland cold high pressure, which aided in the diffusion of pollutants. In contrast, during summer, under the influence of the subtropical high pressure, the upper-level ozone could descend to the near-surface layer, and relatively weak winds contributed to the accumulation of pollutants [34].
The diurnal 8 h O3 concentration pattern in the YRD urban agglomeration displayed a pronounced unimodal distribution on both annual and seasonal timescales (Figure 2b). The peak concentrations typically occurred between 18:00 and 20:00 local time, which coincided with the optimal conditions for photochemical reactions in the afternoon, characterized by the strongest solar radiation, higher temperatures, and lower humidity [18]. In contrast, minimum concentrations were consistently observed during the early morning hours (07:00–09:00), attributed to the combined effects of nocturnal O3 deposition processes and NOx titration mechanisms in the near-surface layer [4,7].
The Action Plan for the Prevention and Control of Air Pollution has achieved notable success in reducing certain pollutant concentrations across the YRD urban agglomeration [15]. However, concurrent monitoring data from 2015 to 2024 indicated a contrasting trend in ground-level 8 h O3, which increased at an average rate of 0.91 ± 0.98 μg·m−3·a−1 (Table 1), consistent with nationwide patterns of 8 h O3 elevation [14]. Seasonal variations in 8 h O3 growth rates were pronounced, with spring exhibiting the highest increase at 1.14 ± 1.41 μg·m−3·a−1, followed by autumn at 0.94 ± 1.12 μg·m−3·a−1 and summer at 0.82 ± 1.41 μg·m−3·a−1, while winter showed the most modest rise at 0.65 ± 0.83 μg·m−3·a−1, representing only 57% of the rate observed in spring.

Table 1.
Interannual variation rates of 8 h O3 concentration in the YRD urban agglomeration from March 2015 to February 2025 (μg·m−3·a−1).
3.1.2. Spatial Variations in 8 h O3 Concentration
The YRD urban agglomeration exhibited significant spatial heterogeneity in 8 h O3 concentrations (Figure 3), attributable to varying natural environments, anthropogenic influences [21], and topographical conditions. The annual mean 8 h O3 concentration reached its peak (90.48 ± 31.28 μg·m−3) at monitoring station 3434A in Lianyungang City, located along the southern periphery of Shantung’s hilly terrain. In contrast, the minimum value (48.47 ± 19.36 μg·m−3) was recorded at station 1269A in Lishui City, situated within the low mountainous area of the Zhejiang-Fujian hilly region. Spatially, the 8 h O3 concentrations exhibited a trend of being higher along the coast and in the northeastern region, while being lower in inland areas and the southwestern region, as well as higher in plains compared to hilly areas. This pattern was largely consistent with the spatial distribution of 8 h O3 concentrations observed in the region in 2017 [35]. Notably, the 8 h O3 concentrations in major metropolitan centers (Nanjing: 72.65 ± 28.66 μg·m−3; Hefei: 71.78 ± 29.14 μg·m−3; Hangzhou: 64.00 ± 27.71 μg·m−3; Shanghai: 70.14 ± 24.65 μg·m−3) were consistently lower than those in the less developed northern regions of Anhui Province and the central-northern part of Jiangsu Province, underscoring the complexity of O3 formation dynamics, which involve interactions that extend beyond simple anthropogenic determinants.
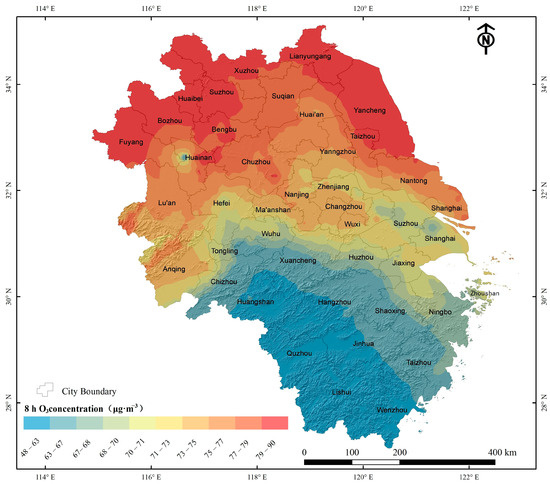
Figure 3.
Spatial distribution of 8 h O3 concentration in the YRD urban agglomeration.
Spatial analysis revealed pronounced regional disparities in the 8 h O3 concentration trends across the study area (Figure 4), with the central and western regions of the Huang-Huai Plain and Jianghuai Plain exhibiting particularly concerning growth rates. These areas, especially within Anhui Province, where economic development has lagged while industrial integration with the YRD urban agglomeration has accelerated, demonstrated the most dramatic increases in 8 h O3 levels. For instance, Fuyang City and Chuzhou City exhibited average 8 h O3 concentration increase rates as high as 2.95 ± 0.57 μg·m−3·a−1 and 2.65 ± 0.68 μg·m−3·a−1, respectively. In contrast, eastern coastal cities, such as Shanghai (−0.57 ± 0.45 μg·m−3·a−1), Nantong (−0.06 ± 0.55 μg·m−3·a−1), and Ningbo (0.16 ± 0.99 μg·m−3·a−1), have successfully mitigated 8 h O3 growth through the rigorous implementation of national emission reduction policies and industrial technology upgrades [36]. Meanwhile, the southern periphery of the YRD urban agglomeration, including Lishui and Quzhou, achieved notable 8 h O3 reductions by leveraging geographic advantages to develop tertiary industries focused on tourism, leisure, and eldercare services [21], thereby demonstrating the effectiveness of region-specific pollution control strategies.
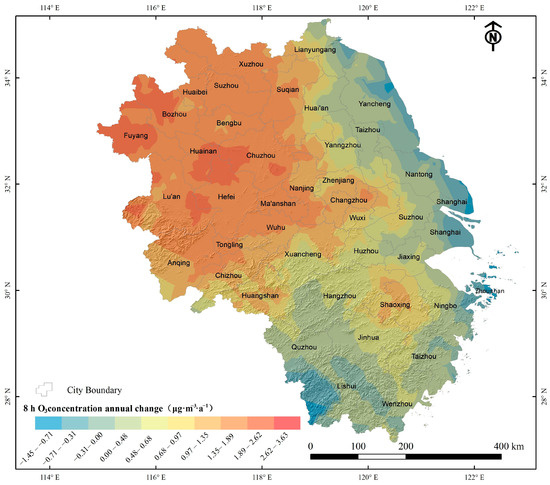
Figure 4.
Spatial distribution of interannual variability of 8 h O3 concentration in the YRD urban agglomeration from 2015 to 2024.
3.2. Situation of Elevated 8 h O3 Concentration
3.2.1. Temporal Variation of Elevated 8 h O3 Concentration
According to the secondary concentration threshold of 8 h O3 in China’s “Ambient Air Quality Standards” (GB 3095-2012) [25], which was 160 μg·m−3, the O3 pollution situation in the YRD urban agglomeration was very severe. From an annual perspective, none of the cities met the standards, with the average number of days of non-compliance of 8 h O3 concentration at 41.05 days per monitoring site. The most polluted site recorded 83 days of violations (Table 2). Among them, the average number of days of non-compliance at various sites in summer reached 20.95 days, accounting for 23%, and the station with the most severe pollution was the Huanghe Xin Village Monitoring Station in Xuzhou City, Jiangsu Province, where the proportion of non-compliance days could be as high as 45%. The spring and autumn seasons followed, with average non-compliance days at 13.18 days and 3.96 days, respectively. Although there might be occasional instances of exceeding the concentration threshold at a small number of stations in winter, the duration of exceedance could generally be ignored. Therefore, the seasonal probability of exceeding 8 h O3 concentration aligned closely with the concentration change trends and corresponded to the changes in regional temperature and humidity [18].
Table 2.
Situation of 8 h O3 concentration exceeding the threshold in the YRD urban agglomeration (threshold of first-level concentration:160 μg·m−3).
The average frequency of 8 h O3 concentration exceeding standards at various stations in the YRD urban agglomeration on an annual scale was consistent with the hourly concentration variation trend, showing a unimodal characteristic (Figure 5), with a peak value of about 9% occurring mostly between 18:00 and 20:00, while the trough, with values below 1%, was distributed from 02:00 to 14:00, indicating that the regional 8 h O3 concentration exceedances were significantly influenced by the diurnal temperature variation process. The periods in summer when the 8 h O3 concentration exceedance frequency was greater than 1% were from 14:00 to 03:00, accounting for about 60% of the duration, particularly from 18:00 to 20:00, where the exceedance frequency was approximately 20%, suggesting that the public should try to reduce outdoor activities [37]. In spring, the duration when the concentration exceedance frequency was greater than 1% accounts for about 46%, while in autumn, the hourly exceedance frequency was consistently below 4%, mostly occurring from 17:00 to 20:00.
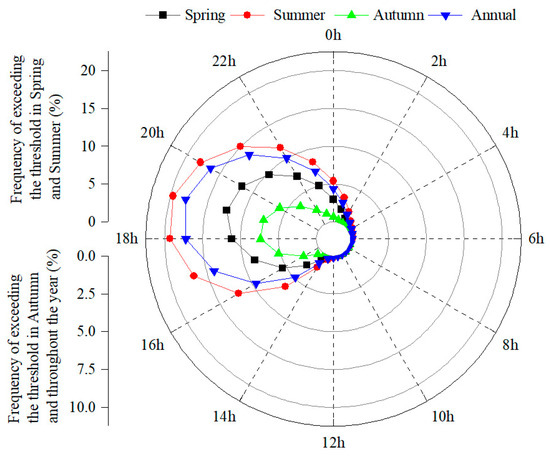
Figure 5.
Status of the frequency at which the 8 h O3 concentration exceeded the threshold in the YRD urban agglomeration March 2015 to February 2025.
3.2.2. Spatial Distribution of Elevated 8 h O3 Concentration
The number of days exceeding the 8 h O3 concentration at various monitoring stations in the YRD urban agglomeration ranged from 3 to 83 days. Along the main line from Suzhou (Anhui Province) to Bengbu, Chuzhou, Nanjing, Changzhou, Huzhou, and Jiaxing, the number of exceedance days was over 1.5 months. In the two major core areas—Xuzhou-Suzhou (Anhui Province)-Huaibei in the northwest, which was primarily dominated by heavy industry (coal, steel, and heavy machinery manufacturing, etc.), and Zhenjiang–Changzhou–Wuxi in the central region, which was primarily characterized by light industry (textile, machinery, electronics, and chemical industries, etc.)—the 8 h O3 exceedance days could exceed 2 months (Figure 6), indicating that air quality management in the rapidly developing YRD urban agglomeration still has a long way to go. In contrast, the coastal eastern regions with high levels of industrial clustering, the economically lagging western inland areas, and the topographically complex southern hilly regions exhibited significantly fewer exceedance days. This demonstrates a distinct difference from the spatial distribution characteristics of 8 h O3 concentration (Figure 2) and implies that the severe exceedance of 8 h O3 concentrations could result from abnormal regional human activities, intermittent inputs of external pollutants, and the influence of complex terrain.
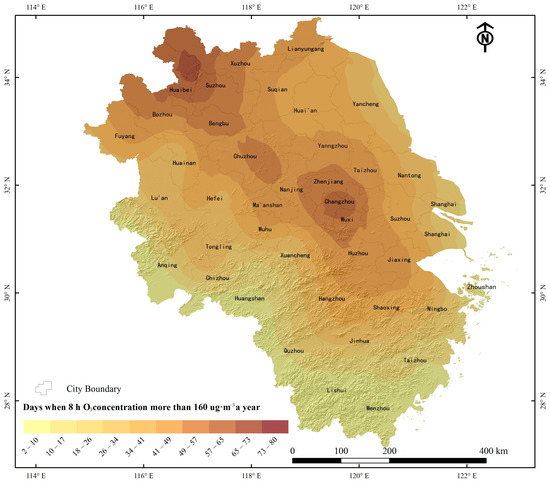
Figure 6.
Distribution of days of 8 h O3 concentration exceeding the standard (>160 μg·m−3) within in the YRD urban agglomeration.
4. Discussion
4.1. Meteorological Factors
High temperature and low humidity were key meteorological factors that control the conversion of precursors such as VOCs and NOx into O3 [18,38], which was significantly reflected in the YRD urban agglomeration (Figure 7). With relative humidity and wind speed as control variables, the partial correlation coefficient between temperature and 8 h O3 concentration was 0.59; with temperature and wind speed as control variables, the partial correlation coefficient between relative humidity and 8 h O3 concentration was −0.34, both passing the significance test at Sig < 0.01 (Table 3).
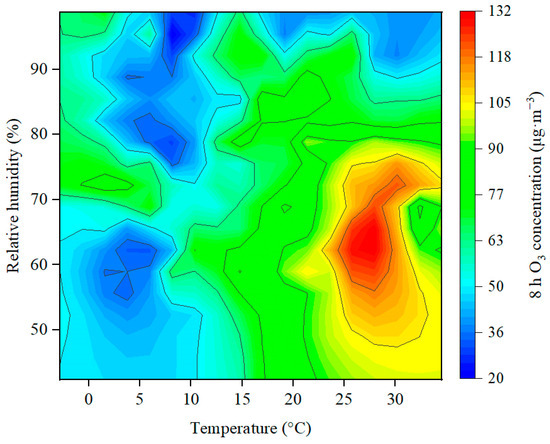
Figure 7.
Response of 8 h O3 concentration change to temperature and relative humidity in the YRD urban agglomeration.
Table 3.
Partial correlation between 8 h O3 concentration and temperature, relative humidity, and wind speed in the YRD urban agglomeration.
Wind speed influences the diffusion, enrichment, and transport rate of pollutants through the stability of the atmosphere, and its interaction with topography affects O3 concentration in a complex manner [8,39]. This complexity was also reflected in the insignificance of the correlation between 8 h O3 concentration and wind speed in the YRD urban agglomeration (Table 3). Under temperatures below about 15 °C, the impact of wind speed variation on 8 h O3 concentration within the YRD urban agglomeration was almost negligible due to low temperatures limiting the conversion efficiency of precursor substances (Figure 8a). When the temperature exceeded 15 °C and the wind speed was between 1 and 4 m·s−1, the 8 h O3 concentration was significantly elevated, indicating that regional transport effects led to the redistribution of pollutants in the boundary layer [40], making extraterritorial emissions a key factor in the elevated 8 h O3 concentrations in the YRD urban agglomeration.
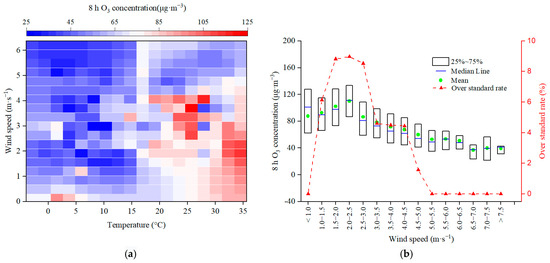
Figure 8.
Influence of wind speed and temperature on the variation of 8 h O3 concentration. (a) Heat map of 8 h O3 concentration with wind speed and temperature was based on data collected throughout the entire year of 2024. (b) Response of 8 h O3 concentration and the proportion of time it exceeds the standard to wind speed was analyzed based on data collected during the summer from 2015 to 2024.
In contrast, under high-temperature conditions, high wind speeds could also lead to significantly lower 8 h O3 concentrations (Figure 8b). This was clearly reflected in the frequent occurrences of 8 h O3 exceedances during the summer (Figure 8b), indicating that, at this time, the unstable atmospheric stratification significantly enhanced the dispersion efficiency of regional pollutants, breaking the accumulation state of local pollution [9].
It is important to note that during the frequent occurrences of 8 h O3 exceedances at high temperatures in summer, the proportion of time when the average regional 8 h O3 concentration exceeded the standard at wind speeds less than 1.0 m·s−1 was approximately 0%, which was significantly lower than at wind speeds of 2.0 to 3.5 m·s−1 (Figure 8b). During this period, wind speeds below 1.0 m·s−1 accounted for 59.84% of the daytime (07:00–18:00) and 40.16% of the nighttime (19:00–06:00), with the midnight period (22:00–03:00), when the atmosphere might be in a stable stratification state, accounting for 16.30%. This indicated that although 8 h O3 concentrations in the YRD urban agglomeration were in a state of high fluctuation, the likelihood of 8 h O3 exceedances due to the photochemical conversion of precursor substances within the region was relatively low. The main cause of these exceedances should be attributed to the transport effects of extraterritorial emissions.
4.2. Topographic Factor
Topography, while influencing regional atmospheric circulation, can also regulate the distribution of air pollutants and changes in environmental quality by altering meteorological conditions [8,41]. As one of the key parameters for quantifying terrain, there was a significant spatial negative correlation between the average surface roughness and 8 h O3 concentration in the YRD urban agglomeration, with a spatial autocorrelation index (Moran’s I) of −0.75, and this was confirmed at a significance level of 0.01 (Figure 9a). This indicates that the influence of terrain was an indispensable part of the process of spatial aggregation of regional 8 h O3 concentration and pollution prediction [7]. The bivariate local spatial autocorrelation (LISA) cluster map (α = 0.05, Figure 9b) showed that low–high clusters, which indicated low surface roughness corresponding to high 8 h O3 concentration, were primarily distributed in northern Anhui and northwestern Jiangsu in the Huang-Huai Plain. This area not only had a significantly high average 8 h O3 concentration (Figure 3) but also experienced severe exceedance phenomena (Figure 6). Conversely, high–low clusters, where high surface roughness corresponded to a low 8 h O3 concentration, were mainly found in Chizhou City and Xuancheng City at the northern edge of the Jiangnan hills, as well as in the southwestern region of Zhejiang and Fujian hills. This not only aligned with the phenomenon that complex terrain conditions, to a certain extent, constrained population and industrial agglomeration [42], thereby inhibiting the emission of 8 h O3 precursors, but also corresponded to the observation that taller terrain could reduce the intensity of external pollutant transport and supply [8].
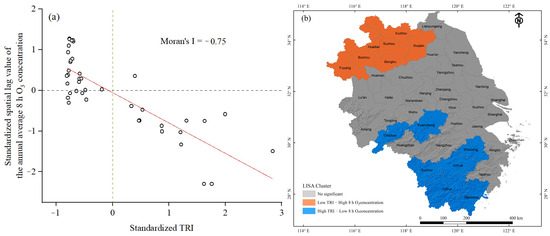
Figure 9.
Influence of terrain on 8 h O3 concentration in the YRD urban agglomeration. (a) Moran scatter of 8 h O3 concentration and topographic roughness index; (b) LISA clustering map of 8 h O3 concentration and topographic roughness index.
4.3. Potential Source of Substances
Using Changzhou, one of the core cities for O3 pollution, located at the geometric center of the regional geography, as the calculation origin, the HYSPLIT model was utilized to explore the potential source pathways of O3 substances [7,27]. On an annual scale, the southward inland pathway R1, which traversed the economically lagging northern part of the Jiangnan hills, accounted for approximately 23% of the total pathways (Figure 10 and Table 4). The average concentration of O3 in the transporting air masses and the proportion of paths exceeding the concentration threshold were 69.83 ± 37.64 μg·m−3 and 3.2%, respectively, both significantly lower than those of the northward inland path R2 (with an average concentration of 81.23 ± 51.82 μg·m−3 and a proportion exceeding the threshold of 8.9%) that passed through regions with concentrated energy mineral and steel industry activities [38]. The southward path R4, which traversed the southeastern coastal areas, and the northward path R3, located in the Yellow Sea, accounted for approximately 21% and 29%, respectively. The average concentration of R4 (55.93 ± 35.89 μg·m−3) and the proportion of paths exceeding the threshold (1.6%) were approximately 69% and 22% of those observed for R3 (with an average concentration of 80.78 ± 47.67 μg·m−3 and a proportion exceeding the threshold of 7.4%). Therefore, pollutants originating from the supply of northward air masses were likely the main cause of the elevated O3 concentrations within the YRD urban agglomeration, while the contribution of human-emitted precursors in the economically and industrially concentrated urban areas of Shanghai, Nanjing, and Hangzhou was relatively weak. This was primarily because the relatively abundant precipitation in the lower reaches of the Yangtze River had reduced the concentration of precursor substances in the atmosphere through washout [43], while sea–land winds had also facilitated the diffusion of precursor substances into the ocean [44].
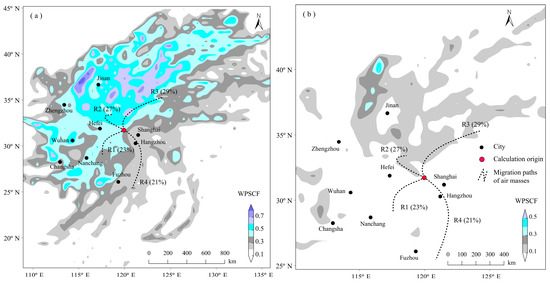
Figure 10.
Supplying routes and potential contribution source areas of the contaminated air mass on an annual scale. The concentration thresholds were set as (a) the arithmetic mean and (b) the secondary concentration threshold (160 µg·m−3), respectively.
Table 4.
Statistics of clustering of air mass source paths and its O3 concentration on an annual scale.
Furthermore, when using the arithmetic mean O3 concentration as a threshold, the potential source contribution areas responsible for O3 concentration fluctuations in the YRD urban agglomeration were primarily concentrated in the northern and central parts of Jiangsu Province and the northern part of Anhui Province. Additionally, external regions, such as the southern part of North China, the eastern part of the Korean Peninsula, and areas surrounding the Bohai Sea and the (Northern) Yellow Sea, should also be taken into consideration (WPSCF > 0.5) (Figure 10a). However, when using the secondary concentration threshold (160 µg·m−3) as the threshold, the potential pollution source contribution areas causing concentration exceedance were very limited in the inland areas and the Yangtze River Delta region and were instead relatively concentrated in the southeastern part of Hebei Province and the Beijing area in North China (Figure 10b).
In fact, apart from the near absence of O3 concentration exceedances during the winter, meaning potential source contribution areas can be neglected, the seasonal differences in potential contribution areas of exceedance air masses in the YRD urban agglomeration were quite significant due to the influence of continental high pressure, the East Asian monsoon, and geographical factors. During the spring and autumn transition periods of the East Asian monsoon, the alternating effects of cold and warm air masses led to higher atmospheric turbulence intensity [45], resulting in poor continuity of potential source contribution areas (WPSCF > 0.2), with a small distribution in the Yancheng area and surrounding regions near the Yellow Sea, and mainly scattered across western inland provinces and North China (Figure 11a,c).
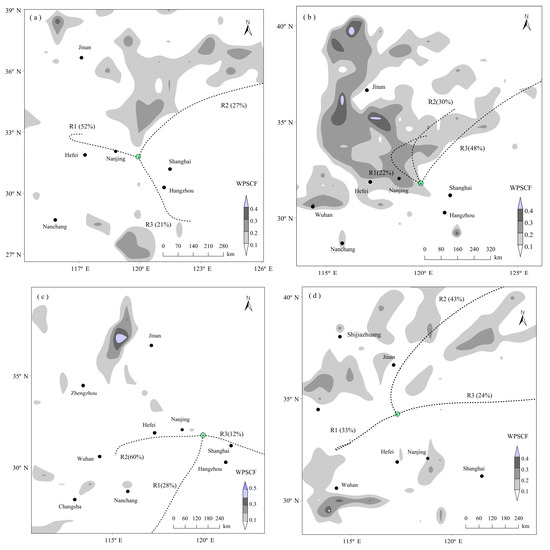
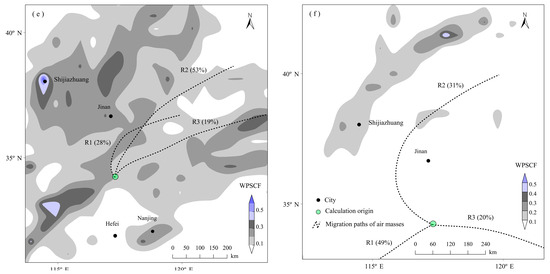
Figure 11.
Potential source contribution areas of O3 substances in (a) spring, (b) summer, and (c) autumn base on the calculation origin of Changzhou City, and in (d) spring, (e) summer, and (f) autumn base on the calculation origin of Xuzhou City. The concentration threshold was 160 μg·m−3 (i.e., the secondary concentration threshold).
During the summer, high temperatures and low humidity, influenced by the subtropical high, facilitated the formation of O3, resulting in frequent instances of O3 concentrations exceeding regulatory standards in the YRD urban agglomeration (Table 1). However, the distribution of potential source contribution areas for polluted air masses that exceed these standards was notably limited within the study area, with only a minor presence in the Nanjing–Hefei metropolitan area and its surroundings, and the majority of WPSCF values falling below 0.25. External potential source contribution areas warranted significant attention, particularly the western regions (including petrochemical, coal chemical, and fine chemical clusters in Heze and Liaocheng, Shandong Province [46]) and southern regions (containing composite panel and logistics bases in Linyi, Shandong Province [47]) adjacent to the Shantung Hills, as well as the eastern segment (featuring machinery and light industrial clusters in the Beijing–Hebei area) of the Taihang Mountains [26], where WPSCF values often exceed 0.3 (Figure 11b).
Furthermore, using a threshold of 160 μg·m−3, we calculated the potential source contribution area of another ozone pollution core with Xuzhou as the calculation origin. Although the transport pathways of the air mass showed slight differences from the results using Changzhou as the calculation origin, the potential source contribution area was similarly distributed predominantly in a discontinuous manner outside the study area (Figure 11d–f), such as in the eastern part of Henan Province and the southern part of Hebei Province. Even during the summer, when exceedances occurred frequently, areas with WPSCF values above 0.3 were quite limited in the economically and industrially developed coastal regions, particularly within the Yangtze River Delta, and exhibited a poor degree of spatial concentration (Figure 11e).
In summary, the occurrence of 8 h O3 concentrations exceeding standards in the YRD urban agglomeration was primarily influenced by the transport effects of external polluted air masses. This observation also supported the finding that the duration of 8 h O3 concentration exceedance was nearly 0% when wind speeds were below 1.0 m·s−1 (Figure 8b). Therefore, the emission and transformation of precursor substances in the YRD urban agglomeration are important factors contributing to the rise in O3 concentration, but the likelihood of these substances causing O3 concentrations to exceed the standards is relatively low. In this context, given the backdrop of uneven economic and technological development, it is recommended that the YRD urban agglomeration leverage its strengths to implement a production technology compensation mechanism [48,49], reduce the emission intensity of external O3 and precursor substances, and strive for a win–win situation in terms of economic development, technology, and living conditions as soon as possible.
5. Conclusions
- (1)
- The spatial heterogeneity of 8 h O3 concentration within the YRD urban agglomeration was significant, showing a trend of higher concentrations along the coast and lower concentrations in the inland areas, as well as higher concentrations in the plains and lower concentrations in the hills. This differed from the spatial characteristics of the concentration exceeding standards, which were primarily concentrated in the northeastern region, dominated by heavy industry, and the central region, dominated by light industry. The average number of days exceeding the 8 h O3 concentration standard at each monitoring station was 41.05 days, with concentrations continuing to rise at a rate of 0.91 ± 0.98 μg·m−3·a−1. This trend indicates that air quality management requires further enhancement.
- (2)
- The 8 h O3 concentration in the YRD urban agglomeration was significantly influenced by high temperatures and low humidity, as well as by wind speed and topography. However, when the wind speed was below 2 m·s−1, the proportion of time when concentrations exceeded the standard tended to decrease as the wind speed decreased, and it was approximately 0% when the wind speed was below 1 m·s−1. This observation suggests that the exceedance of 8 h O3 concentrations in the study area was primarily caused by the transport effect of external pollutants.
- (3)
- The potential contribution areas for the excess O3 concentration were very limited within the study area and were mostly discontinuously distributed in the inland regions outside the area. This indicates that in the future, while effectively controlling pollutant emissions, the YRD urban agglomeration should also implement a production-based technical compensation mechanism between regions to reduce the emission intensity of external pollutants, thereby enhancing public health and quality of life.
Author Contributions
Writing—original draft, J.X. and J.W.; writing—review and editing, J.X. and J.W. All authors have read and agreed to the published version of the manuscript.
Funding
This study is supported by the Jiangsu Province Industry-University-Research (IUR) Collaborative Project (No. BY20240561) and the National Natural Science Foundation of China (No. 41471060).
Institutional Review Board Statement
Not applicable.
Informed Consent Statement
Not applicable.
Data Availability Statement
Data is contained within the article.
Conflicts of Interest
The authors declare no conflicts of interest.
References
- Shen, L.J.; Zhao, T.L.; Liu, J.; Wang, H.L.; Bai, Y.Q. Meteorological impacts on interannual anomalies of O3 import over Twain-Hu Basin. Sci. Total Environ. 2023, 888, 164065. [Google Scholar] [CrossRef]
- Nuvolone, D.; Petri, D.; Voller, F. The effects of ozone on human health. Environ. Sci. Pollut. Res. Int. 2018, 25, 8074–8088. [Google Scholar] [CrossRef]
- GBD 2015 Risk Factors Collaborators. Global, regional, and national comparative risk assessment of 79 behavioral, environmental and occupational, and metabolic risks or clusters of risks, 1990–2015: A systematic analysis for the Global Burden of Disease Study 2015. Lancet 2016, 388, 1659–1724. [Google Scholar] [CrossRef]
- Macintyre, H.L.; Mitsakou, C.; Vieno, M.; Heal, M.; Heaviside, C.; Exley, K. Future impacts of O3 on respiratory hospital admission in the UK from current emissions policies. Environ. Int. 2023, 178, 108046. [Google Scholar] [CrossRef]
- Anagha, K.S.; Kuttippurath, J. Surface ozone pollution-driven risks for the yield of major food crops under future climate change scenarios in India. Environ. Res. 2025, 275, 121390. [Google Scholar] [CrossRef]
- Sanchez, D.R.; Jespersen, B.M.; Rasmussen, L.H.; Andersen, M.L. Ozone treatment of wheat reduces common bunt (Tilletia spp.) infection. J. Stored Prod. Res. 2025, 111, 102488. [Google Scholar] [CrossRef]
- Shu, X.; Xia, Z.L.; Ying, Q.; Fu, Y.H.; Qiao, X.; Tang, Y. Investigating the causes of O3 pollution in the western rim of Sichuan basin, southwestern China. Atmos. Pollut. Res. 2023, 14, 101803. [Google Scholar] [CrossRef]
- Shu, Z.Z.; Zhao, T.L.; Chen, Y.S.; Liu, Y.B.; Yang, F.M.; Jiang, Y.C.; He, G.Q.; Yang, Q.J.; Zhang, Y.Q. Terrain effect on atmospheric process in seasonal ozone variation over the Sichuan Basin, Southwest China. Environ. Pollut. 2023, 338, 122622. [Google Scholar] [CrossRef]
- Banta, R.; Senff, C.; Alvarez, R.; Langford, A.; Parrish, D.; Trainer, M.; Darby, L.; Hardesty, R.; Lambeth, B.; Neuman, J.; et al. Dependence of daily peak O3 concentrations near Houston, Texas on environmental factors: Wind speed, temperature, and boundary-layer depth. Atmos. Environ. 2011, 45, 162–173. [Google Scholar] [CrossRef]
- Hui, K.L.; Yuan, Y.; Xi, B.D.; Tan, W.B. A review of the factors affecting the emission of the ozone chemical precursors VOCs and NOx from the soil. Environ. Int. 2023, 172, 107799. [Google Scholar] [CrossRef]
- Xu, J.X.; Wang, S.; Mai, B.R.; Zheng, Y.F.; Qiu, S.; Tian, W.X.; Kang, H.Q.; Zhang, X.; Gao, J.H. Evaluations on numerical simulations of ozone dry deposition over the Yangtze River Delta. Atmos. Environ. 2023, 304, 119760. [Google Scholar] [CrossRef]
- Wang, L.L.; Li, M.G.; Wang, Q.L.; Li, Y.Y.; Xin, J.Y.; Tang, X.; Du, W.P.; Song, T.; Li, T.T.; Sun, Y.; et al. Air stagnation in China: Spatiotemporal variability and differing impact on PM2.5 and O3 during 2013–2018. Sci. Total Environ. 2022, 819, 152778. [Google Scholar] [CrossRef]
- Liu, X.; Li, Y.C.; He, J.; Zhu, H.S. Study on PM2.5 transport characteristics and pollution source in the winter of Chongqing. Environ Sci. Technol. 2018, 41, 134–141. (In Chinese) [Google Scholar]
- Zeng, Y.Y.; Cao, Y.F.; Qiao, X.; Seyler, B.C.; Tang, Y. Air pollution reduction in China: Recent success but great challenge for the future. Sci. Total Environ. 2019, 663, 329–337. [Google Scholar] [CrossRef]
- Wang, J.; Xu, J.L. Spatiotemporal variation of PM2.5 and its sources in the Yangtze River Delta urban agglomeration. Resour. Environ. Yangtze Basin 2023, 32, 1677–1685. (In Chinese) [Google Scholar]
- Zhang, L.; Shen, F.Z.; Gao, J.L.; Cui, S.J.; Yue, H.; Wang, J.F.; Chen, M.D.; Ge, X.L. Characteristics and potential sources of black carbon particles in suburban Nanjing, China. Atmos. Pollut. Res. 2020, 11, 981–991. [Google Scholar] [CrossRef]
- Yang, Y.; Zhao, Y.; Zhang, L.; Lu, Y. Evaluating the methods and influencing factors of satellite-derived estimates of NOx emissions at regional scale: A case study for Yangtze River Delta, China. Atmos. Environ. 2019, 219, 117051. [Google Scholar] [CrossRef]
- Shen, L.J.; Diao, Y.W.; Zhao, T.L.; Gu, X.S.; Shi, S.S. Meteorological influence on persistent O3 pollution events in Wuxi in the Yangtze River Delta, China. Sci. Total Environ. 2024, 917, 170484. [Google Scholar] [CrossRef]
- Wang, Y.J.; Jiang, S.; Huang, L.; Lu, G.B.; Kasemsan, M.; Yaluk, E.A.; Liu, H.Q.; Liao, J.Q.; Bian, J.T.; Zhang, K.; et al. Differences between VOCs and NOx transport contributions, their impacts on O3, and implications for O3 pollution mitigation based on CMAQ simulation over the Yangtze River Delta, China. Sci. Total Environ. 2023, 872, 162118. [Google Scholar] [CrossRef]
- OPCPC-CSES. Blue Book on Prevention and Control of Atmospheric Ozone Pollution in China (2023); Science Press: Beijing, China, 2024; pp. 11–21. (In Chinese) [Google Scholar]
- Wu, L.X.; An, J.L. Quantitative impacts of meteorology and emissions on the long-term trend of O3 in the YRD, China from 2015 to 2022. J. Environ Sci. 2025, 149, 314–329. [Google Scholar] [CrossRef]
- Kang, Y.D.; Liu, X.C. Characteristics and potential source areas of ozone pollution in Pamir Plateau. Sci. Total Environ. 2025, 967, 178783. [Google Scholar]
- Lin, P. Urbanization effects on mammal richness: A case study of Yangtze River Delta urban agglomeration. Acta Sci. Nat. Univ. Pekin. 2021, 57, 565–574. (In Chinese) [Google Scholar]
- NBS of China. China Statistical Yearbook 2023; China Statistics Press: Beijing, China, 2023; pp. 1–6. (In Chinese) [Google Scholar]
- GB 3095-2012; Ambient Air Quality Standard. MEEC (Ministry of Ecology and Environment of China): Beijing, China, 2012. (In Chinese)
- Wang, J.Y.; Gao, A.F.; Li, S.R.; Liu, Y.H.; Zhao, W.F.; Wang, P.; Zhang, H.L. Regional joint PM2.5-O3 control policy benefits further air quality improvement and human health protection in Beijing-Tianjin-Hebei and its surrounding areas. J. Environ. Sci. 2023, 130, 75–84. [Google Scholar] [CrossRef]
- Phoenix, D.B.; Berkoff, T.A.; Gronoff, G.P.; Salkovitz, D.; Bernier, C.K.; Knowland, E.; Sullivan, J.T.; Twigg, L.W.; Roots, M.; Knepp, T. Analysis of atmospheric conditions responsible for an ozone exceedance event in southeast Virginia on June 15, 2022. Atmos. Pollut. Res. 2025, 16, 102409. [Google Scholar] [CrossRef]
- Wang, J.; Han, H.D.; Xu, J.L.; Yan, W. Chemical characteristics and their influencing factors of precipitation at the end of the Koxkar Glacier, Tianshan Mountains. Arid Zone Res. 2022, 39, 347–358. (In Chinese) [Google Scholar]
- Mao, W.; Lu, X.; Lu, Y.; Yang, K. Modeling supraglacial river networks on the Greenland ice sheet using the topographic index. Chin. J. Polar Res. 2021, 33, 351–362. (In Chinese) [Google Scholar]
- Mukherjee, S.; Mukherjee, S.; Garg, R.D.; Bhardwaj, A.; Raju, P. Evaluation of topographic index in relation to terrain roughness and DEM grid spacing. J. Earth Syst. Sci. 2013, 122, 869–876. [Google Scholar] [CrossRef]
- Jiang, L.; He, S.X.; Zhou, H.F. Spatio-temporal characteristics and convergence trends of PM2.5 pollution: A case study of cities of air pollution transmission channel in Beijing-Tianjin-Hebei region, China. J. Clean. Prod. 2020, 256, 120631. [Google Scholar] [CrossRef]
- Huang, M.Q.; Li, Y.B.; Li, M.Z.; Chen, S.; Zeng, C.C.; Zhang, B.; Xia, C.H. Coupling response of human activity intensity and Landscape pattern in the Three Gorges Reservoir area. Acta Ecol. Sin. 2022, 42, 3959–3973. (In Chinese) [Google Scholar] [CrossRef]
- Wang, S.; Feng, Y.P.; Cui, J.S.; Chen, J.; Yao, B.; Liu, D.X. Spatio-temporal evolution patterns and potential source areas of ozone pollution in Shijiazhuang. Acta Sci. Circumstantiae 2020, 40, 3081–3092. (In Chinese) [Google Scholar]
- Chen, H.Y.; Lu, X.; Wang, H.C.; Pei, C.L.; Qiu, X.N.; Gao, R.Q.; Wang, C.L.; Fan, S.J. Vertical distribution of ozone in spring based on two high tower observations over the Pearl River Delta, China. Atmos. Environ. 2024, 337, 120772. [Google Scholar] [CrossRef]
- Huang, X.G.; Shao, T.J.; Zhao, J.B.; Cao, J.J.; Song, Y.Y. Spatio-temporal differentiation of ozone concentration and its driving factors in Yangtze River Delta urban agglomeration. Res. Environ. Yangtze Basin 2019, 28, 1434–1445. (In Chinese) [Google Scholar]
- Miao, Y.C.; Che, H.Z.; Zhang, X.Y.; Liu, S.H. Relationship between summertime concurring PM2.5 and O3 pollution and boundary layer height differs between Beijing and Shanghai, China. Environ. Pollut. 2021, 268, 115775. [Google Scholar] [CrossRef]
- Xu, F.S.; Shen, J.L.; Gao, Z. A field measurement study of the effects of outdoor pollutants and room volumes on indoor fine particle and ozone concentrations. J. Build. Eng. 2023, 78, 107615. [Google Scholar] [CrossRef]
- Bai, L.Y.; Feng, J.Z.; Li, Z.W.; Han, C.M.; Yan, F.L.; Ding, Y.X. Spatiotemporal Dynamics of Surface Ozone and its relationship with Meteorological factors over the Beijing–Tianjin–Tangshan Region, China, from 2016 to 2019. Sensors 2022, 22, 4854. [Google Scholar] [CrossRef]
- Kanda, I.; Wakamatsu, S. Small-scale variations in ozone concentration in low mountains. Atmos. Environ. 2018, 184, 98–109. [Google Scholar] [CrossRef]
- Yoo, J.W.; Lee, S.H. Characteristics of local recirculation affecting summer ozone in coastal areas of the Korean Peninsula. Atmos. Res. 2025, 315, 107934. [Google Scholar] [CrossRef]
- Khadgi, J.; Kafle, K.; Thapa, G.; Khaitu, S.; Sarangi, C.; Cohen, D.; Kafle, H. Concentration of particulate matter and atmospheric pollutants in the residential area of Kathmandu Valley: A case study of March–April 2021 forest fire events. Environ. Pollut. 2024, 363, 125280. [Google Scholar] [CrossRef]
- Zhang, C.G.; Zhou, Y.J.; Yin, S.G. Interaction mechanisms of urban ecosystem resilience based on pressure-state-response framework: A case study of the Yangtze River Delta. Ecol. Indic. 2024, 166, 112263. [Google Scholar] [CrossRef]
- You, Y.C.; Wang, X.M.; Wu, Y.K.; Chen, W.H.; Chen, B.Y.; Chang, M. Quantified the influence of different synoptic weather patterns on the transport and local production processes of O3 events in Pearl River Delta, China. Sci. Total Environ. 2024, 912, 169066. [Google Scholar] [CrossRef]
- Zhao, D.D.; Xin, J.Y.; Wang, W.T.; Jia, D.J.; Wang, Z.F.; Xiao, H.; Liu, C.; Zhou, J.; Tong, L.; Ma, Y.J.; et al. Effects of the sea-land breeze on coastal ozone pollution in the Yangtze River Delta, China. Sci. Total Environ. 2022, 807, 150306. [Google Scholar] [CrossRef]
- Hong, J.W.; Lee, S.D.; Lee, K.M.; Hong, J. Seasonal variations in the surface energy and CO2 flux over a high-rise, high-population, residential urban area in the East Asian monsoon region. Int. J. Climatol. 2020, 40, 4384–4407. [Google Scholar] [CrossRef]
- Liu, B.S.; Wu, J.H.; Zhang, J.Y.; Wang, L.; Yang, J.M.; Liang, D.N.; Dai, Q.L.; Bi, X.H.; Feng, Y.C.; Zhang, Y.F.; et al. Characterization and source apportionment of PM2.5 based on error estimation from EPA PMF 5.0 model at a medium city in China. Environ. Pollut. 2017, 222, 10–22. [Google Scholar] [CrossRef]
- Liu, S.; Wang, G.; Kong, F.H.; Huang, Z.W.; Zhao, N.; Gao, W.K. Chemical composition, multiple sources, and health risks of PM2.5: A case study in Linyi, China’s plate and logistics capital. Environ. Pollut. 2025, 365, 125343. [Google Scholar] [CrossRef]
- Cao, H.J.; Wang, B.Z.; Li, K. Regulatory policy and misallocation: A new perspective based on the productivity effect of cleaner production standards in China’s energy firms. Energy Policy 2021, 152, 112231. [Google Scholar] [CrossRef]
- Yang, P.H.; Yang, Y. Innovation and application of inter-provincial carbon emission transfer accounting model in China’s domestic production network. Front. Environ. Sci. 2024, 12, 1426958. [Google Scholar] [CrossRef]
Disclaimer/Publisher’s Note: The statements, opinions and data contained in all publications are solely those of the individual author(s) and contributor(s) and not of MDPI and/or the editor(s). MDPI and/or the editor(s) disclaim responsibility for any injury to people or property resulting from any ideas, methods, instructions or products referred to in the content. |
© 2025 by the authors. Licensee MDPI, Basel, Switzerland. This article is an open access article distributed under the terms and conditions of the Creative Commons Attribution (CC BY) license (https://creativecommons.org/licenses/by/4.0/).