Article

Characteristics of Surface Temperature Inversion at the Muztagh-Ata Site on the Pamir Plateau

1
School of Physics and Technology, Xinjiang University, Urumqi 830046, China
2
Xinjiang Astronomical Observatory, Chinese Academy of Sciences, Urumqi 830011, China
3
School of Astronomy and Space Science, University of Chinese Academy of Sciences, Beijing 100049, China
4
National Astronomical Observatory, Chinese Academy of Sciences, Beijing 100012, China
5
Institute for Frontiers in Astronomy and Astrophysics, Beijing Normal University, Beijing 100875, China
6
School of Physics and Astronomy, Beijing Normal University, Beijing 100875, China
*
Author to whom correspondence should be addressed.
Atmosphere 2025, 16(8), 897; https://doi.org/10.3390/atmos16080897
Submission received: 28 June 2025 / Revised: 18 July 2025 / Accepted: 19 July 2025 / Published: 23 July 2025

Abstract

In this paper, based on all the data from September 2021 to June 2024 collected by a 30 m meteorological tower and a differential image motion monitor (DIMM) at the Muztagh-Ata site located on the Pamir Plateau in western Xinjiang, China, we study the characteristics of the surface temperature inversion and its effect on astronomical seeing at the site. The results show the following: The temperature inversion at the Muztagh-Ata site is highly pronounced at night; it is typically distributed below a height of about 18 m; it weakens and disappears gradually after sunrise, while it forms gradually after sunset and remains stable during the night; and it is weaker in spring and summer but stronger in autumn and winter. Correlation studies with meteorological parameters show the following: increases in both cloud coverage and humidity weaken temperature inversion; the distribution of inversion with wind speed exhibits a bimodal distribution; southwesterly winds prevail at a frequency of 73.76% and are typically accompanied by strong temperature inversions. Finally, by statistical patterns, we found that strong temperature inversion at the Muztagh-Ata site usually bring better seeing by suppressing atmospheric optical turbulence.

1. Introduction

In the troposphere, temperature usually decreases with altitude increase. However, in some exceptional cases wherein temperature can increase with altitude, it is called temperature inversion. Temperature inversion has been observed at multiple observatory sites worldwide, like the Maunakea Observatories in Hawaii of the USA [1] and the San Pedro de Atacama in Northern Chile [2]. The surface temperature inversion can have certain effects on astronomical seeing [3,4]. Seeing is a critical parameter in the research of astronomical site selection. It refers to the blurring of star images caused by atmospheric optical turbulence, and it can directly affects the observational precision of ground-based telescopes [5]. Therefore, it is necessary to study the spatiotemporal distribution of characteristics of surface temperature inversion at an astronomical site and its effect on seeing, as it can provide important references for optimizing telescope construction at the site in the future [3].
The Muztagh-Ata site is located on the Pamir plateau in the western part of Xinjiang, China, at an altitude of about 4500 m, with geographical coordinates around 38°20′ N and 74°54′ E. The 1.93 m telescope is nearing completion [6,7]. The Muztagh-Ata site has been continuously monitored since 2017; in previous studies, based on the data of nighttime cloud coverage from 2017 to 2021, Xu et al. [8] found that the Muztagh-Ata site can annually provide over 227 observing nights, 175 clear nights, and 169 nights with continuous observing time exceeding 4 h. Based on the French DIMM at the south point of the Muztagh-Ata site data from June 2017 to November 2018, Xu et al. [9] reported a median seeing of 0.82 arcsec at heights above 11 m. Further research by Zhang et al. [10] used data from NIAOT DIMM at north point 1 of the Muztagh-Ata site and found that the annual median seeing was 0.80 arcsec, 0.94 arcsec, 1.07 arcsec, and 0.95 arcsec from 2019 to 2022. These studies indicated the Muztagh-Ata site has good conditions for astronomical observations.
In September 2021, we completed the installation of a 30 m meteorological tower at the Muztagh-Ata site (Figure 1). The tower is instrumented with temperature sensors (Young 41342) and ultrasonic anemometers (Young 81000) at five different heights, these instruments were manufactured by Young, a U.S.-based company, and the tower designed to advance research on surface-layer atmospheric optical turbulence and characteristics of surface temperature inversion.
The instruments and data used in this study are described in Section 2. Section 3 presents a statistical analysis of the characteristics of temperature inversion phenomena at the Muztagh-Ata site, analyzes their correlation with various meteorological parameters, and investigates its effects on seeing conditions. Section 4 summarizes the main conclusions of this study, with an analysis of the underlying mechanisms of temperature inversion formation.

2. Data Sources

The data in this study are collected from the 30 m meteorological tower installed at the Muztagh-Ata site. This section includes detailed information about the 30 m meteorological tower, an analysis of data completeness, and data pre-processing procedures.

2.1. Equipment Introduction

Actual equipment of the 30 m meteorological tower is as shown in Figure 1. The tower is equipped with five temperature sensors, five ultrasonic anemometers, as well as air pressure and humidity monitoring devices at different heights, with key parameters detailed in Table 1.
The meteorological tower commenced official monitoring operations in 30 September 2021. Until June 2024, meteorological data had been collected for 980 days, with data obtained for 949 days, achieving a data completeness rate of 96.84%. Wind speed data was collected for 977 days, with data obtained for 939 days, showing a completeness rate of 96.11%. The overall data completeness is excellent, with a small amount of missing data caused by instrument failures.

2.2. Data Processing

The 30 m meteorological tower directly measures temperature and wind speed data at five different heights, along with one set of pressure data and one set of humidity data. Temperature inversion is defined by an increase in temperature with altitude, and the temperature inversion value is derived by subtracting the 6 m thermometer data from the higher-height thermometer data. ( T h T 6 m ) > 0 indicates the presence of a temperature inversion.
To minimize potential systematic instruments errors on research outcomes, this study employed five identical temperature sensors of the same model and production batch during equipment selection to ensure measurement consistency. Furthermore, we conducted systematic error calibration experiments on the 30 m meteorological tower by installing all five temperature sensors at the same height for synchronous data collection. By analysis, we developed a systematic error correction strategy for the five temperature sensors.
During this process, we found that, when relative humidity exceeded 85%, systematic errors among sensors became unstable, which makes effective calibration unfeasible. Consequently, to ensure data quality and reliability, all measurements obtained under relative humidity > 85% conditions were excluded from analysis. Statistical analysis indicates such data accounted for about 12% of daytime records and 14% of nighttime records. The exclusion of these data points has minimal impact on the overall dataset’s representativeness and completeness.

3. Result

This section presents systematic results of temperature inversion at the Muztagh-Ata site, including its spatiotemporal characteristics, its correlations with meteorological parameters (cloud cover, relative humidity, wind speed, and direction), and its effects on astronomical seeing. All analyses are based on UTC+8 time, with day/night division determined by civil twilight. To resolve the inconsistency in sampling intervals between wind speed and temperature data, we performed uniform sampling on wind speed data at 30 s intervals.

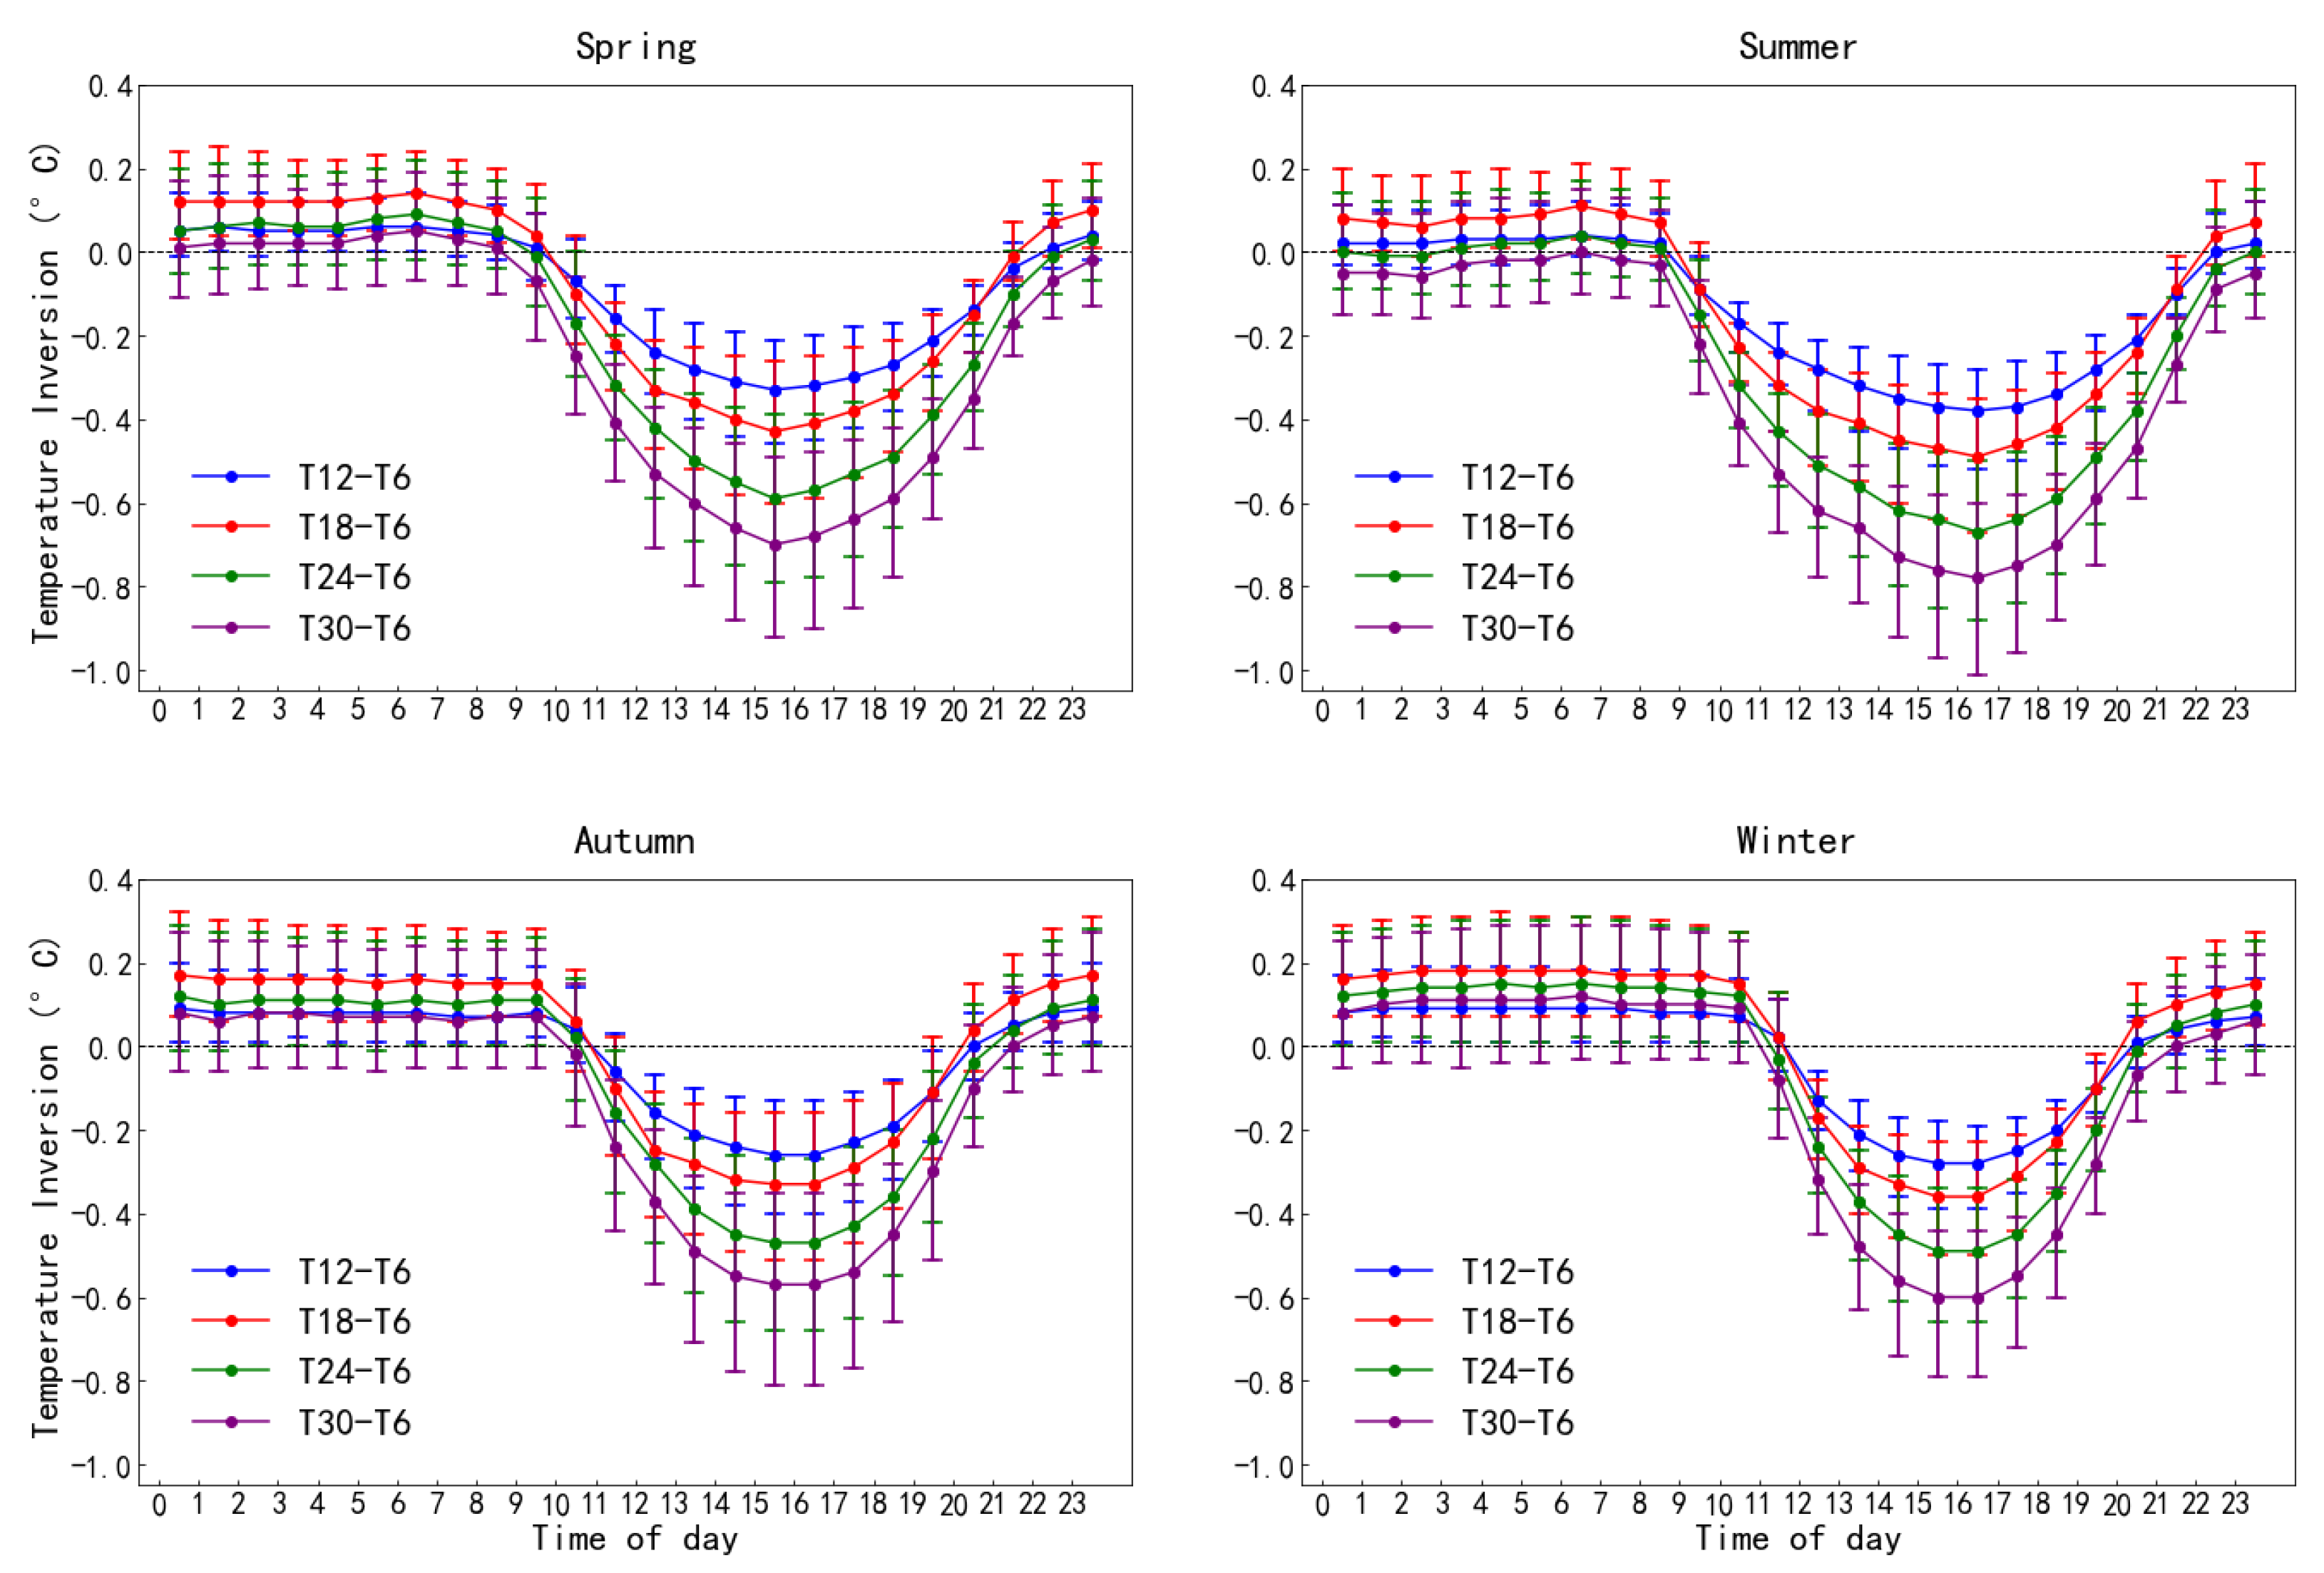
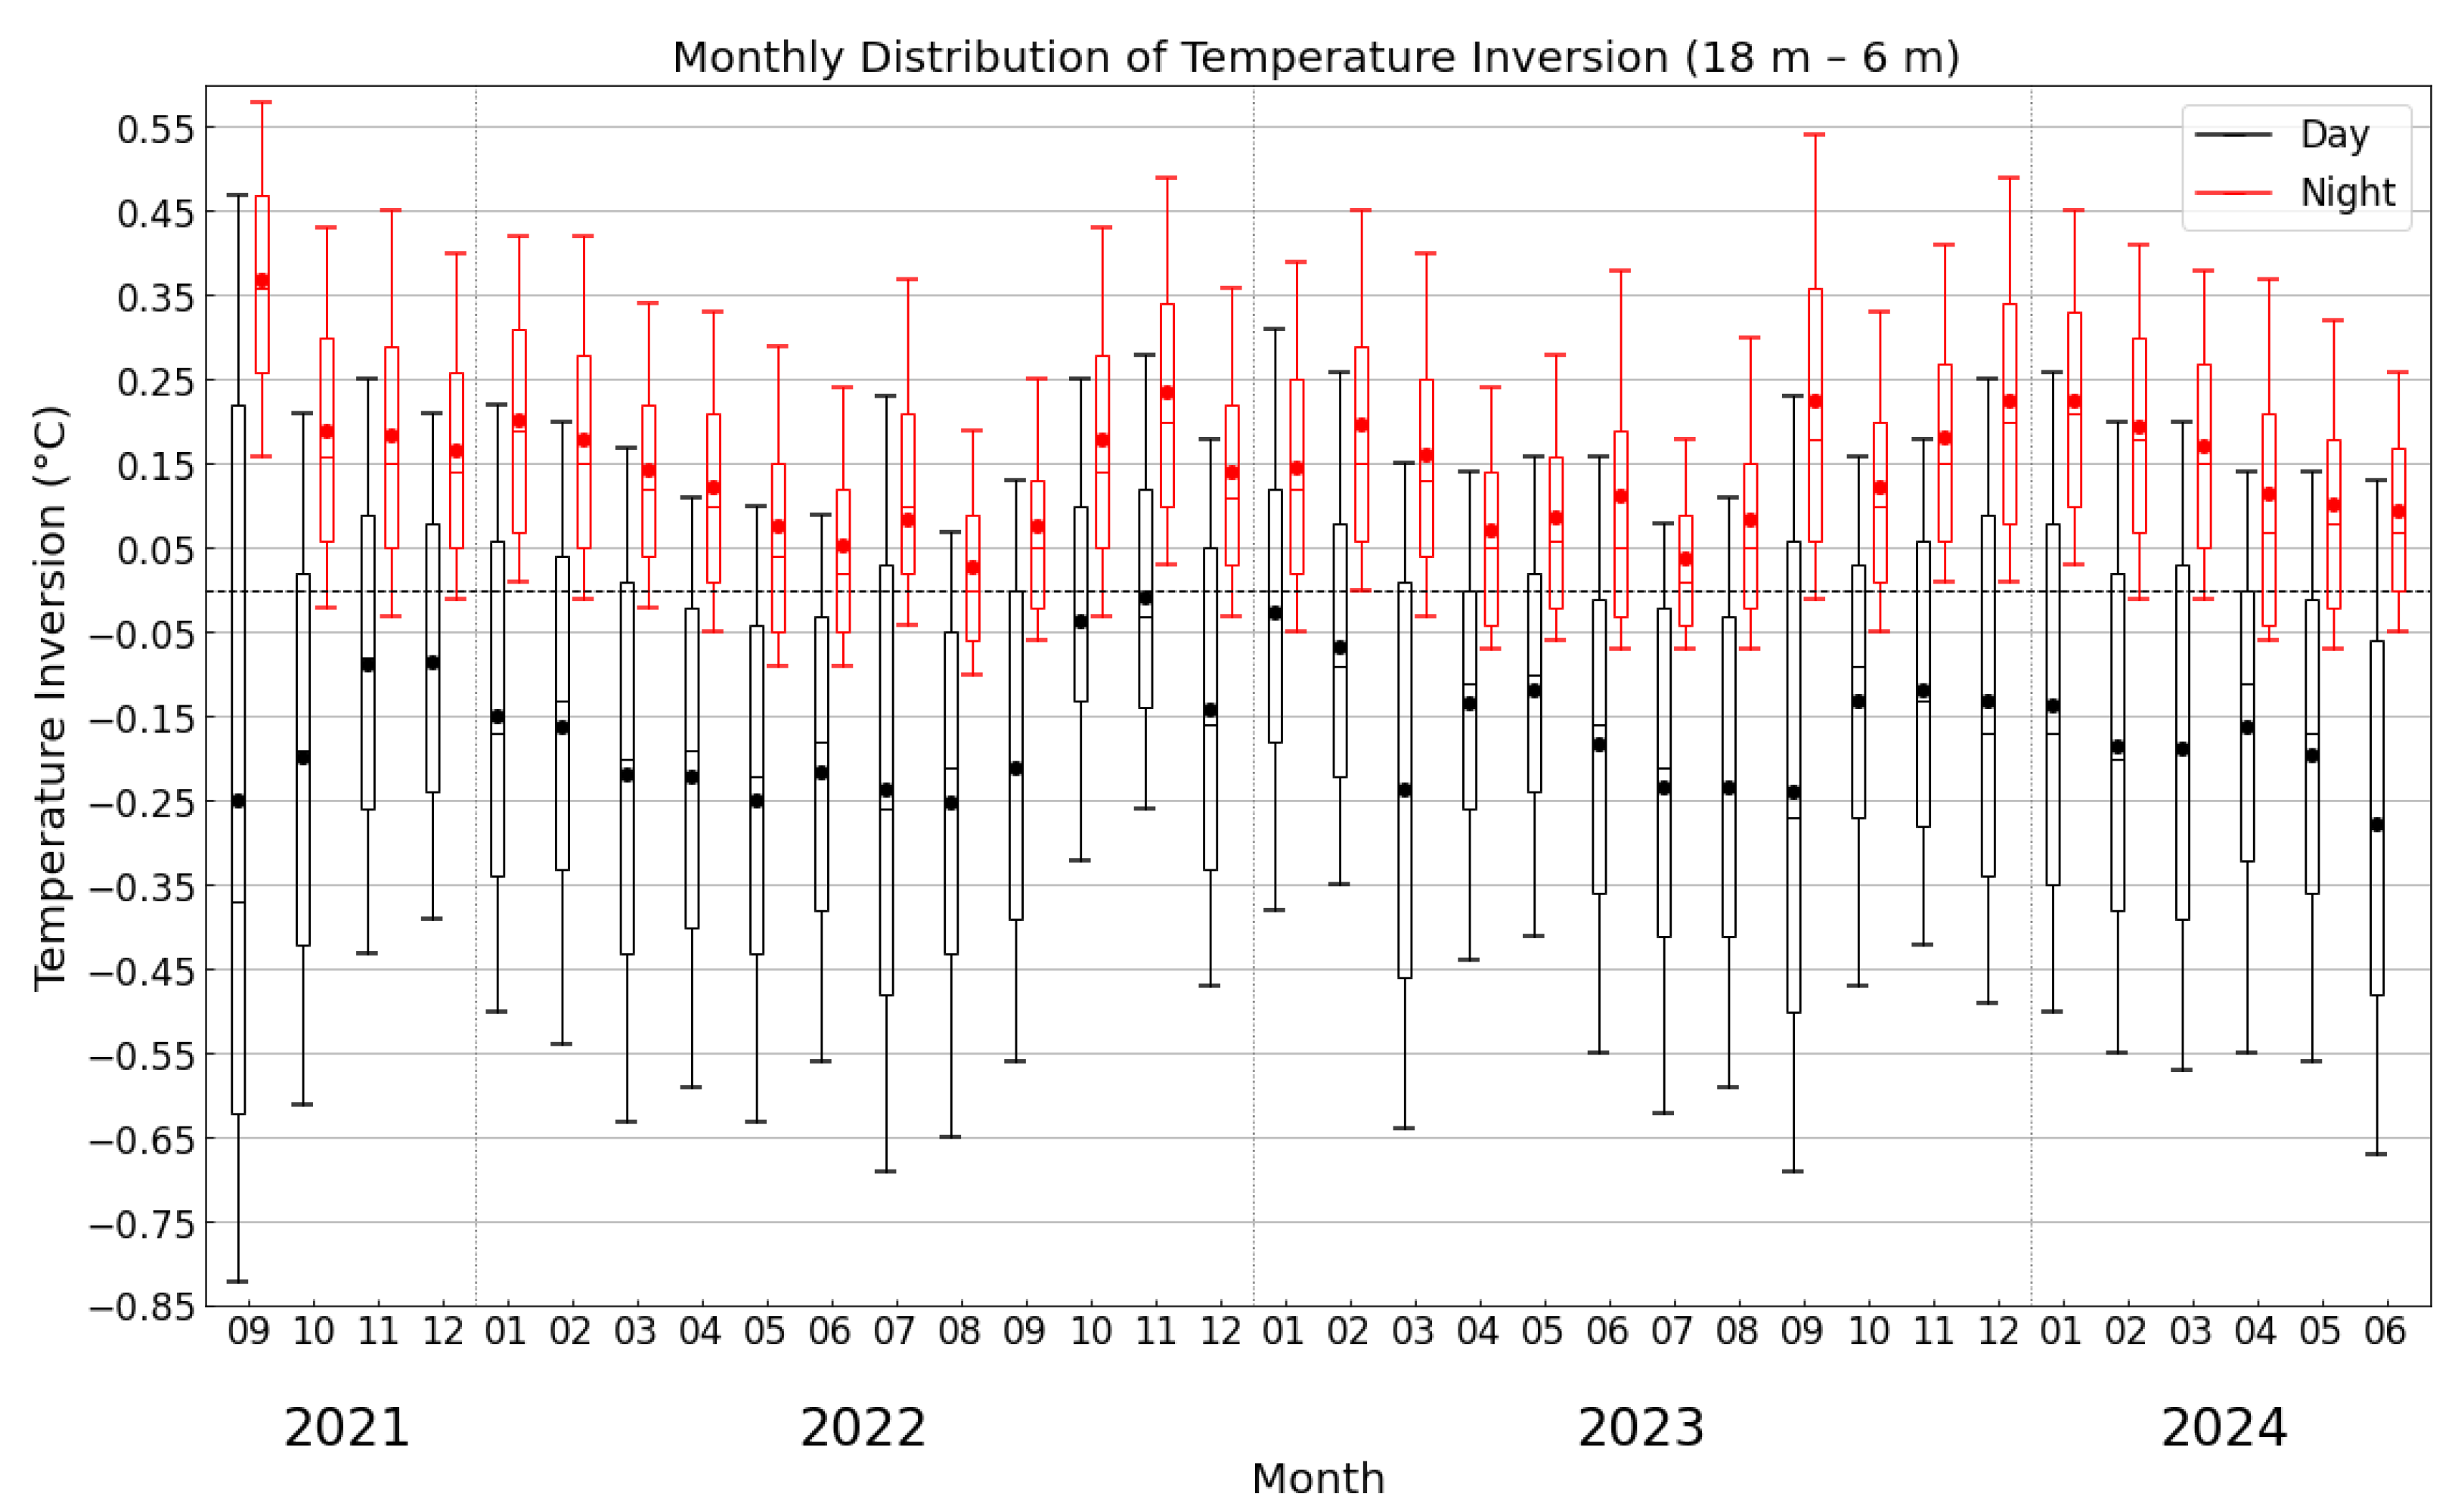
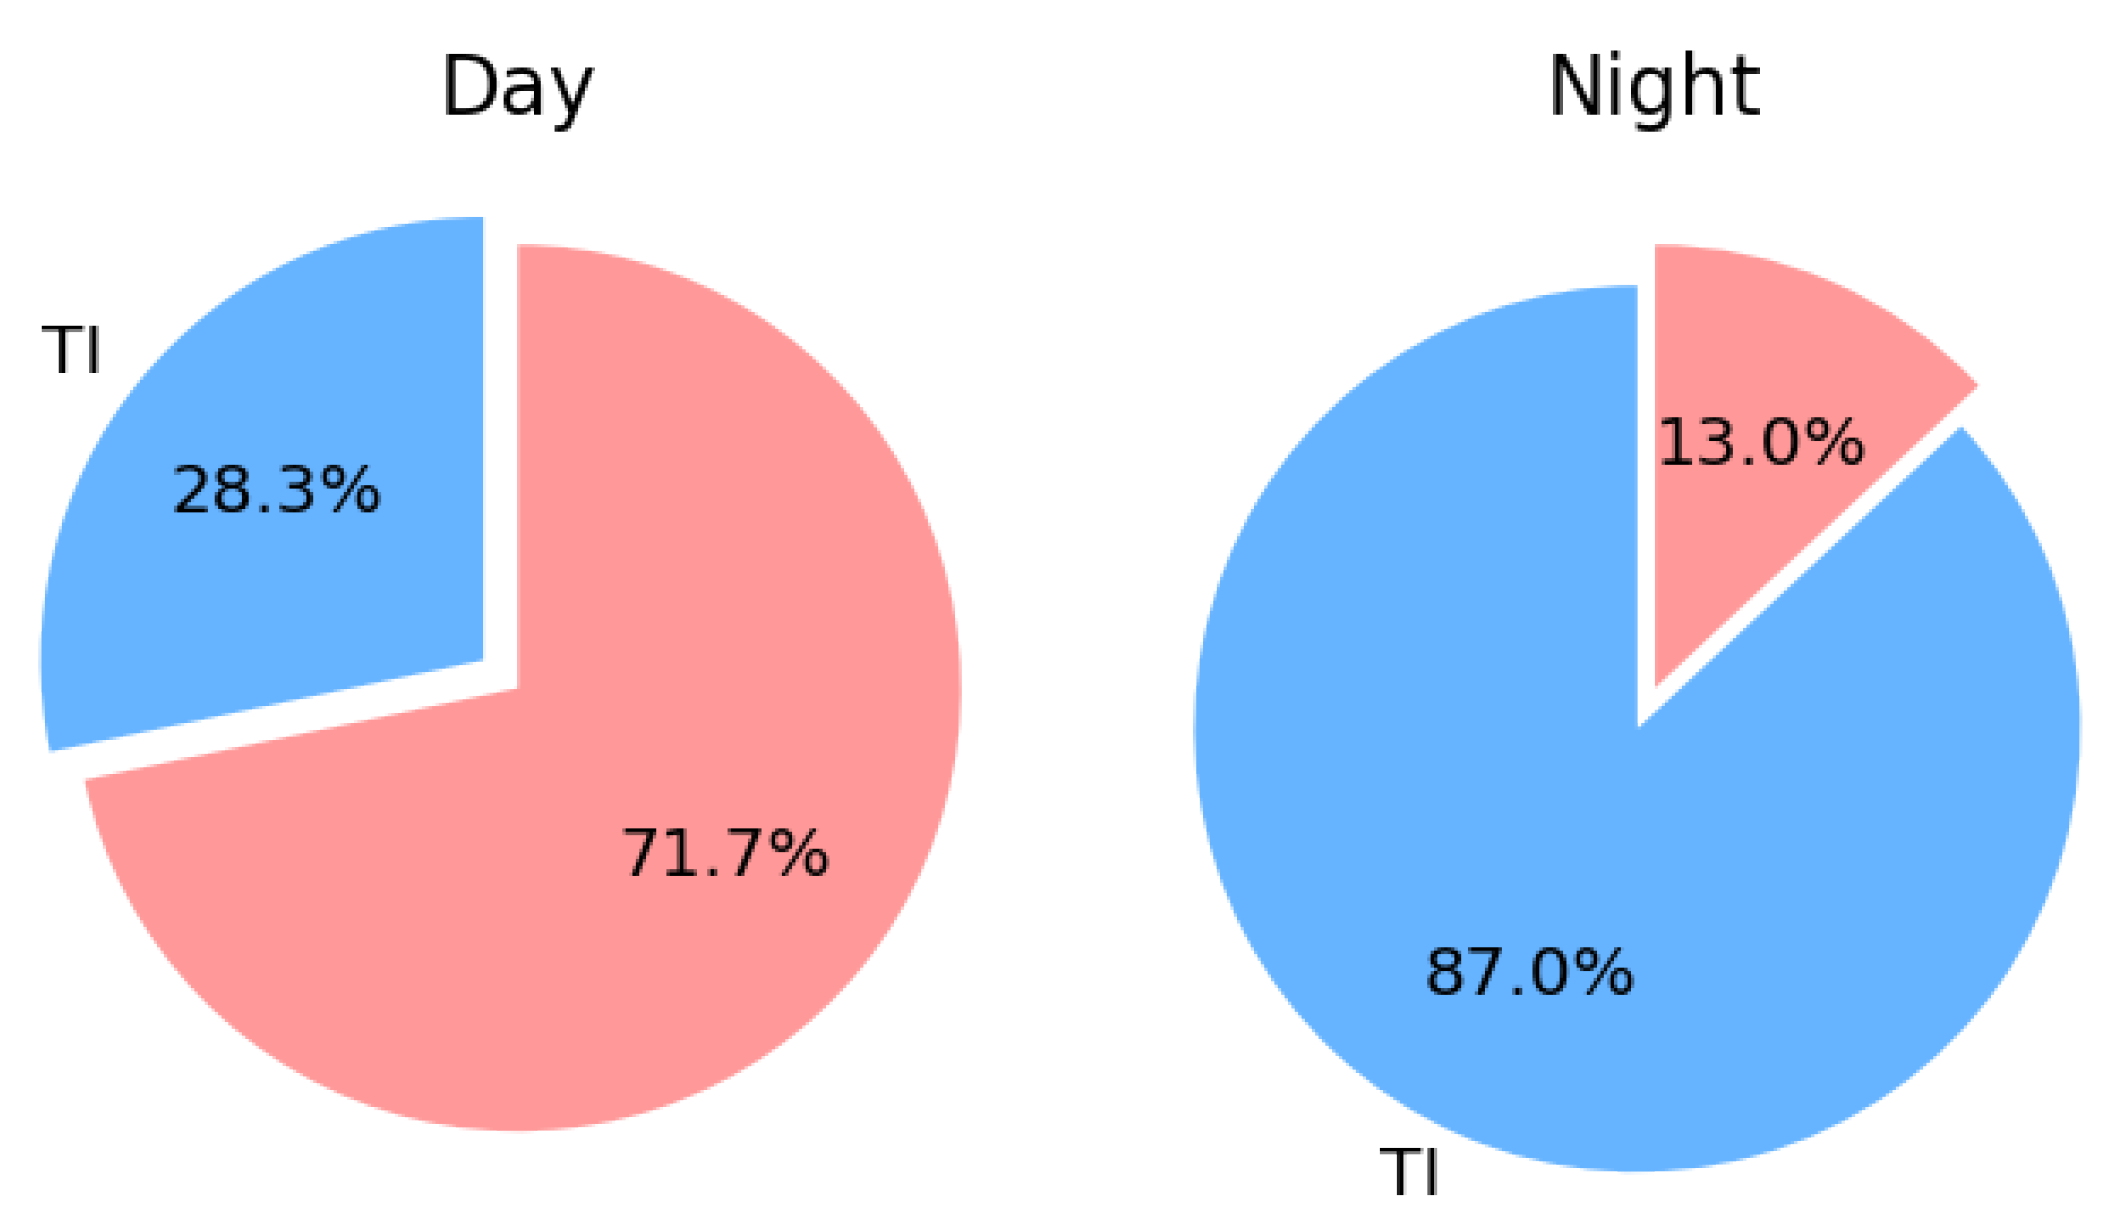
3.1. Spatiotemporal Distribution

To investigate the characteristics of temperature inversion and explore its spatiotemporal distribution patterns, we conducted statistical analyses as shown in Figure 2 and Figure 3.
Figure 2 shows the daily distribution statistics of temperature inversion at the Muztagh-Ata site. The figure reveals the following process: temperature inversion at the Muztagh-Ata site disappears after sunrise, re-forms after sunset, and persists stably throughout the night. The physical mechanism of this process is as follows: after nightfall, the surface radiates heat into the atmosphere, cooling rapidly, while the air above cools more slowly, forming a temperature inversion layer [15]; after sunrise, the ground absorbs shortwave solar radiation, causing surface temperature to rise, and surface air temperature to increase, gradually heating the bottom of the temperature inversion layer and causing the inversion to dissipate [16,17]. Meanwhile, we can find that temperature inversion duration is longer in winter and shorter in summer, corresponding to seasonal variations in sunrise and sunset times.
Furthermore, in this figure, these temperature inversion lines representing different height ranges can also reveal distinct vertical characteristics of the temperature inversion. The observed relationship ( T 18 m T 6 m ) > ( T 24 m T 6 m ) > ( T 30 m T 6 m ) clearly demonstrates that the temperature inversion primarily occurs within approximately the lowest 18 m. This finding provides crucial guidance for determining optimal installation heights for future large telescopes, enabling a balanced consideration of both observational performance and engineering constraints [3].
Based on the characteristic that temperature inversion primarily occurs below 18 m heights, we used data from this height range to conduct monthly statistical analysis of inversion distribution across different seasons, as shown in Figure 3. The results demonstrate that the surface-based temperature inversion strength at the Muztagh-Ata site is relatively weak from April to September (corresponding to spring and summer), while being significantly stronger from October to March of the following year (corresponding to autumn and winter). This distribution pattern can be attributed to the following mechanisms: strong daytime solar radiation makes the surface heat up rapidly, which quickly breaks down the temperature inversion. At the same time, the ground cools slowly at night. In contrast, in autumn and winter, nighttime radiative cooling causes the surface temperature to drop quickly. After sunset, a stable temperature inversion layer forms rapidly on the site surface [18,19,20].
Additionally, by comparing day and night conditions in Figure 3, it is evident that the temperature inversion at the Muztagh-Ata site is markedly stronger during nighttime than daytime. To more accurately study the proportion of temperature inversion at the Muztagh-Ata site, we conducted a statistical analysis of the temperature inversion within this height range, as shown in Figure 4. The proportion of daytime temperature inversion data was only 28.3%, while the proportion of nighttime temperature inversion was as high as 87.0%, which reveals that, during nighttime, the temperature inversion at the Muztagh-Ata site is very pronounced.

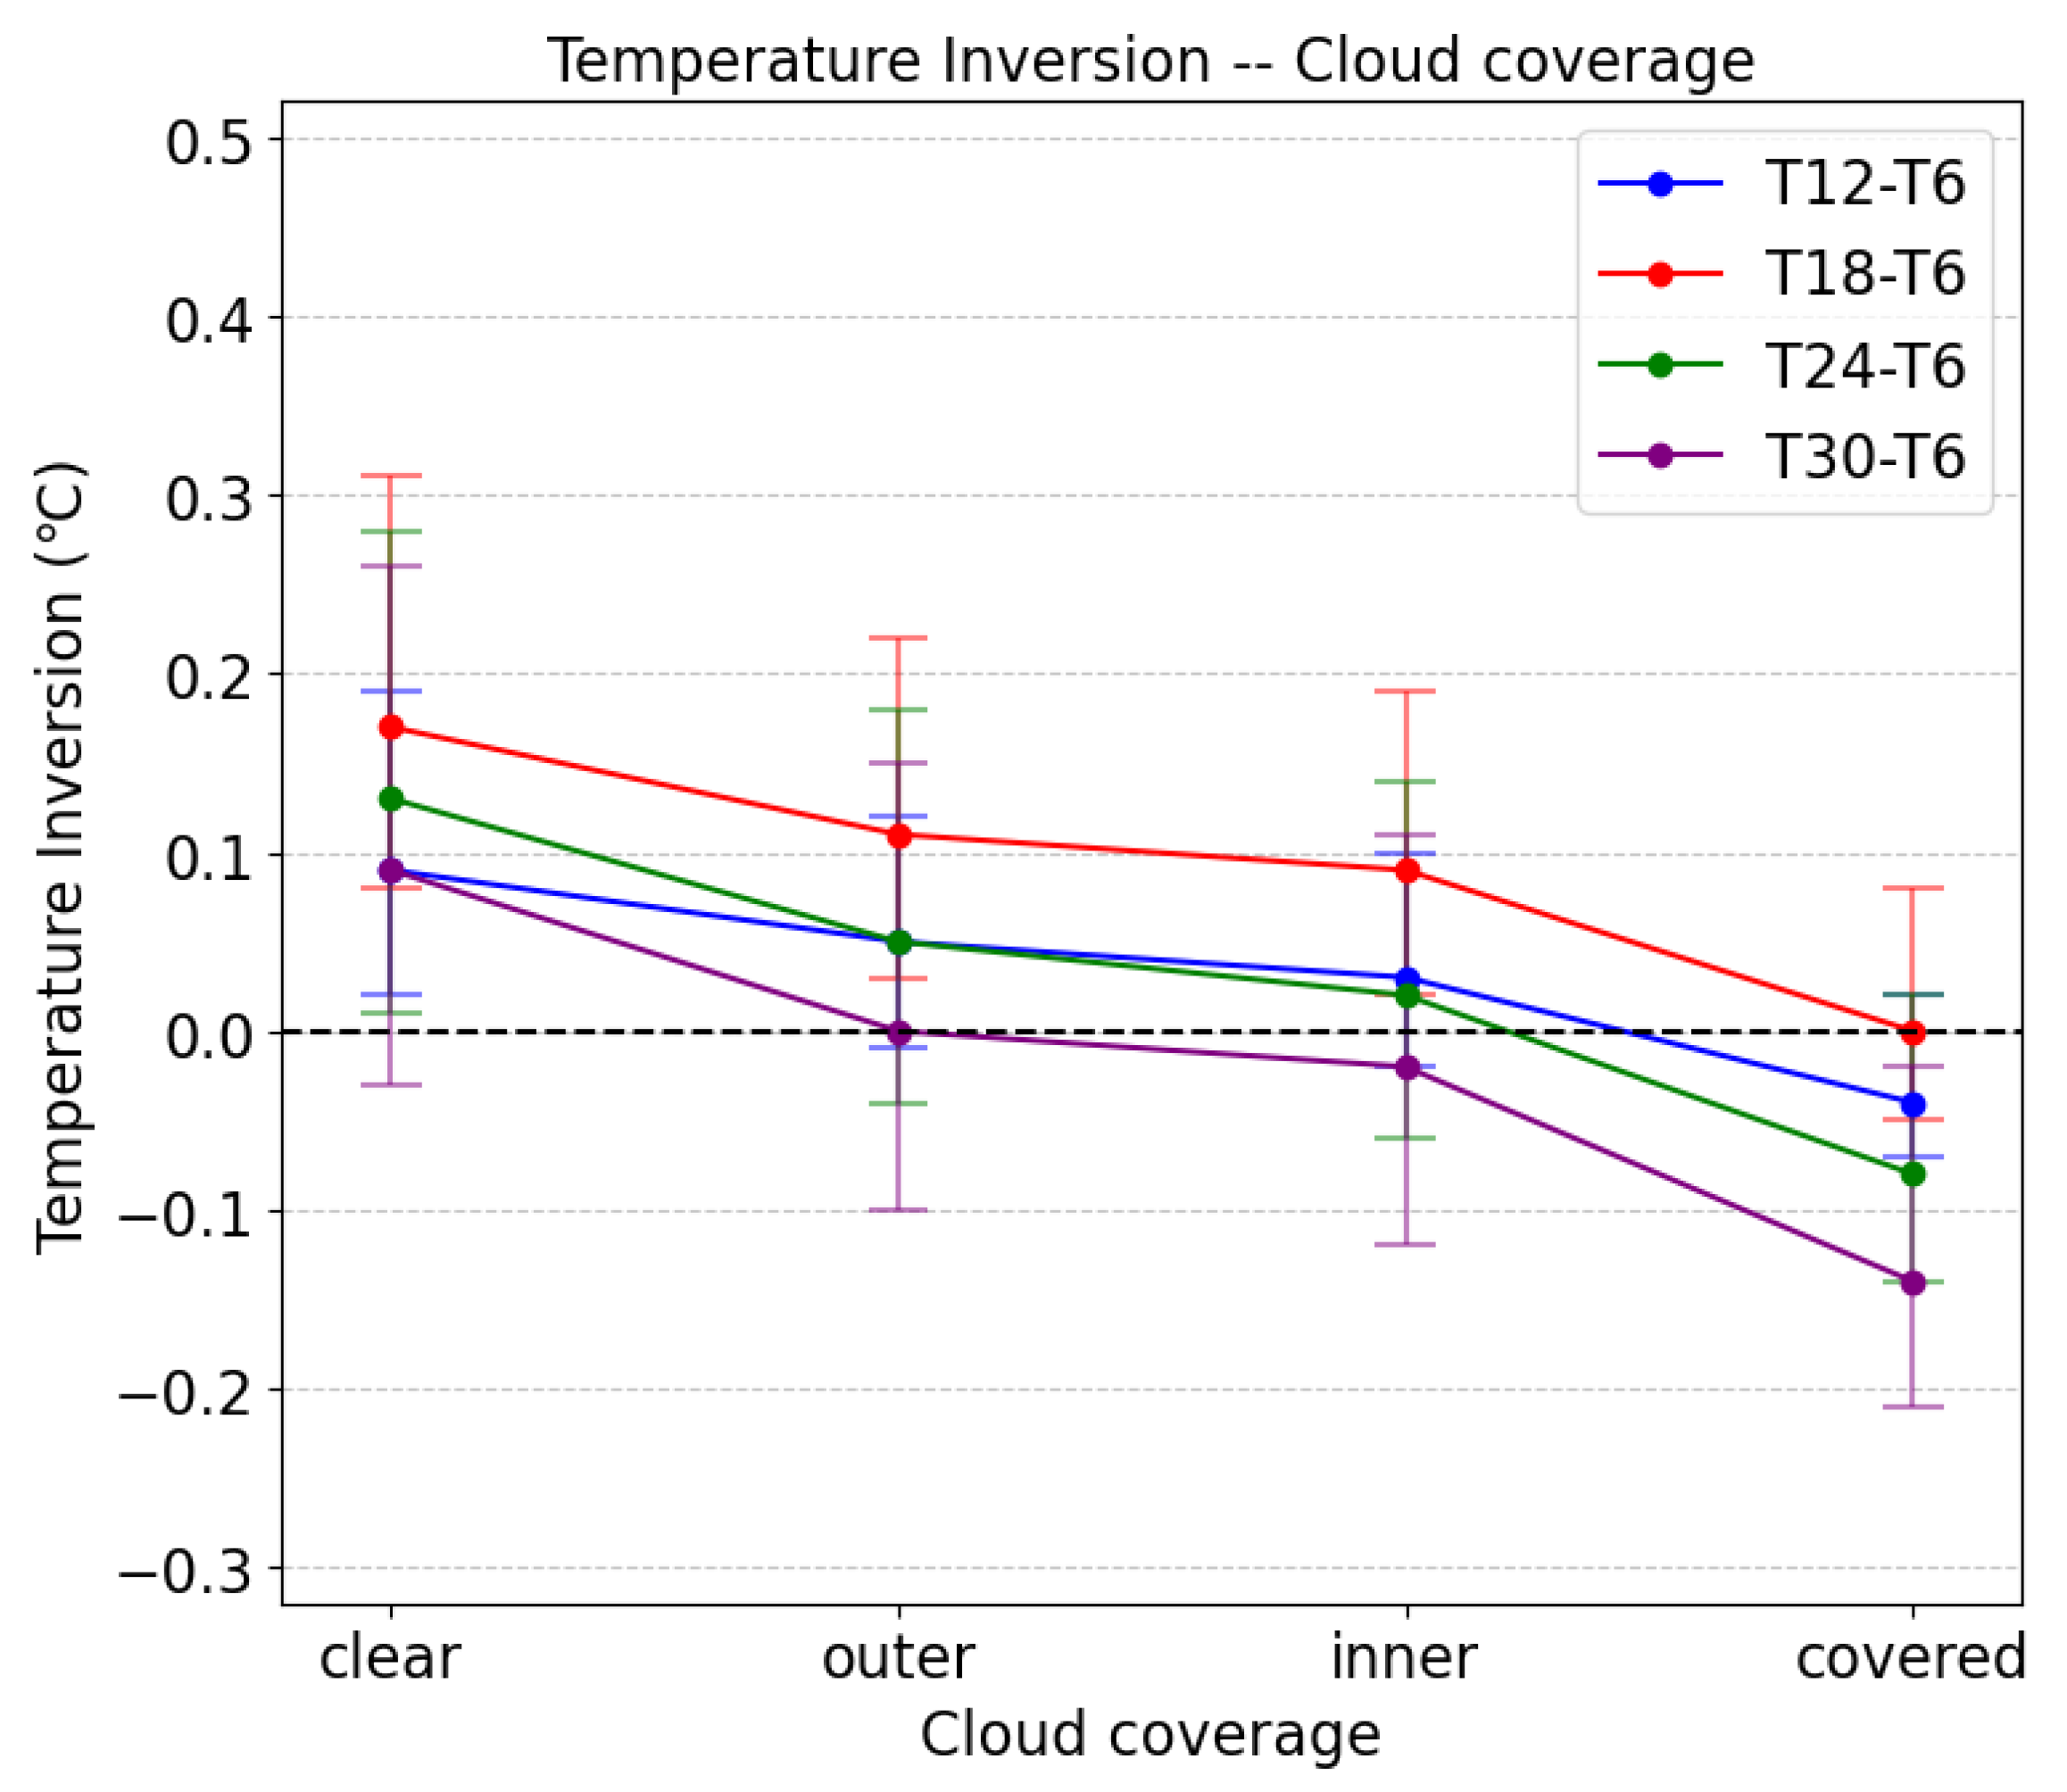
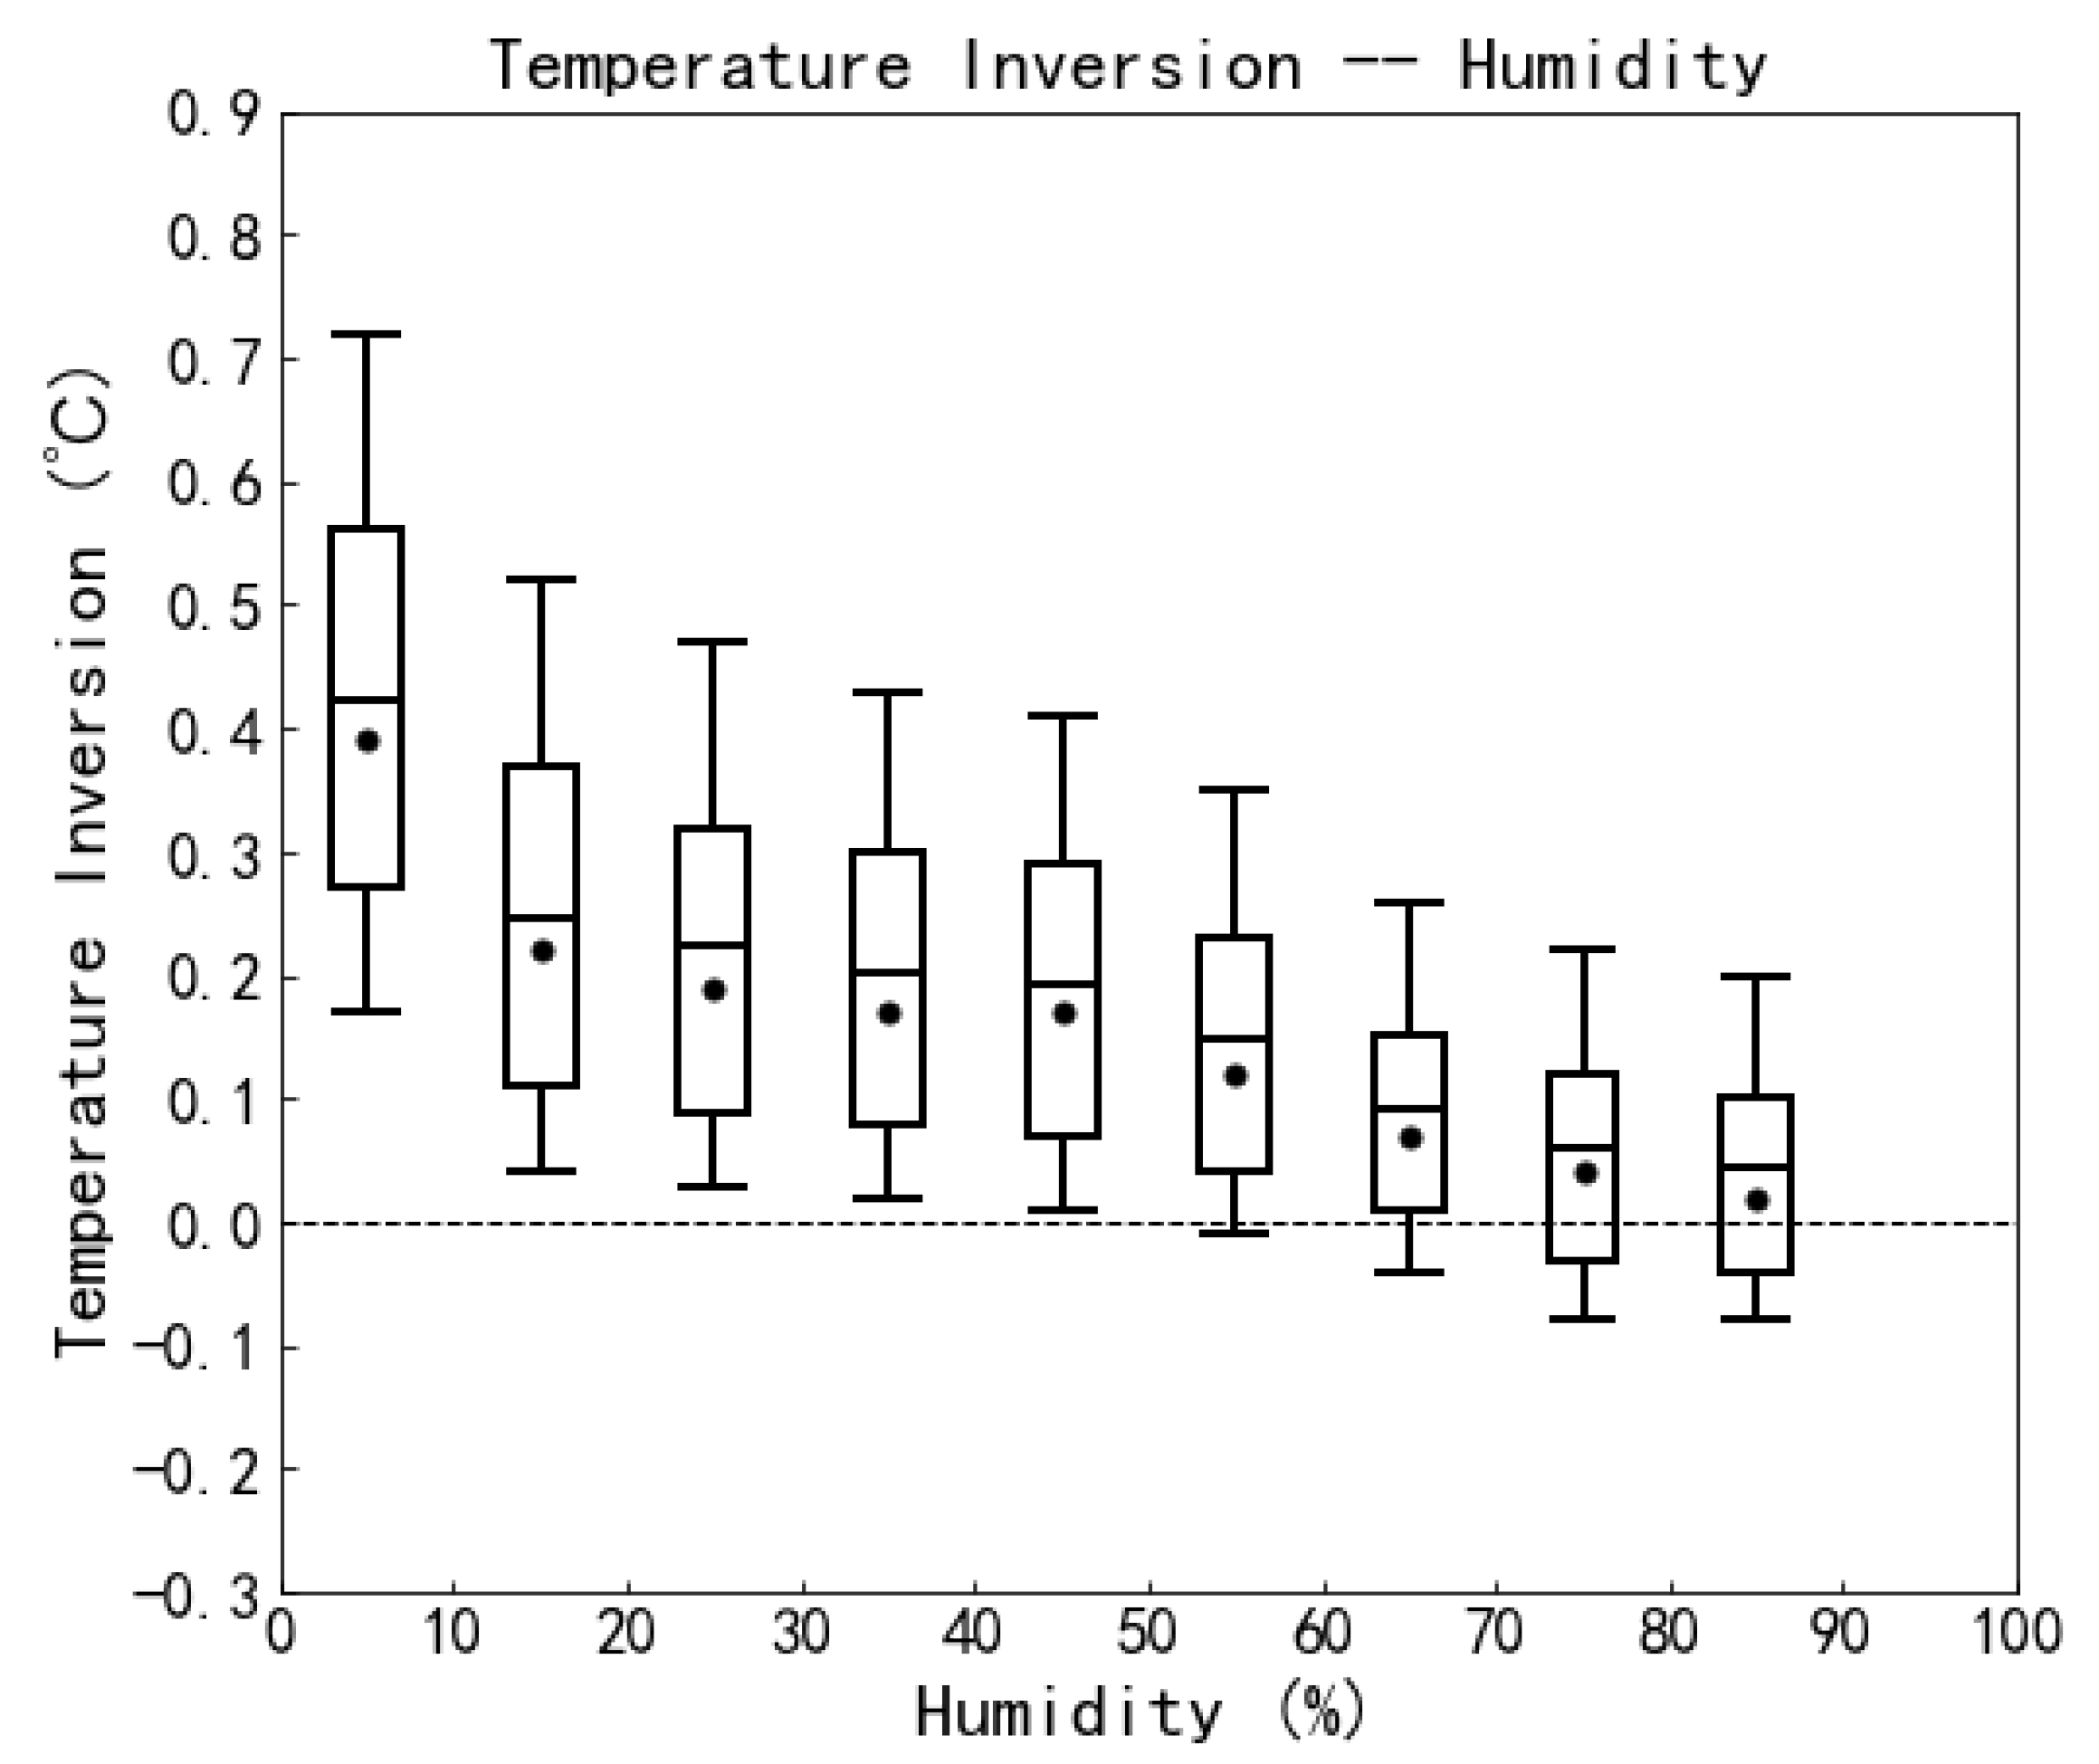
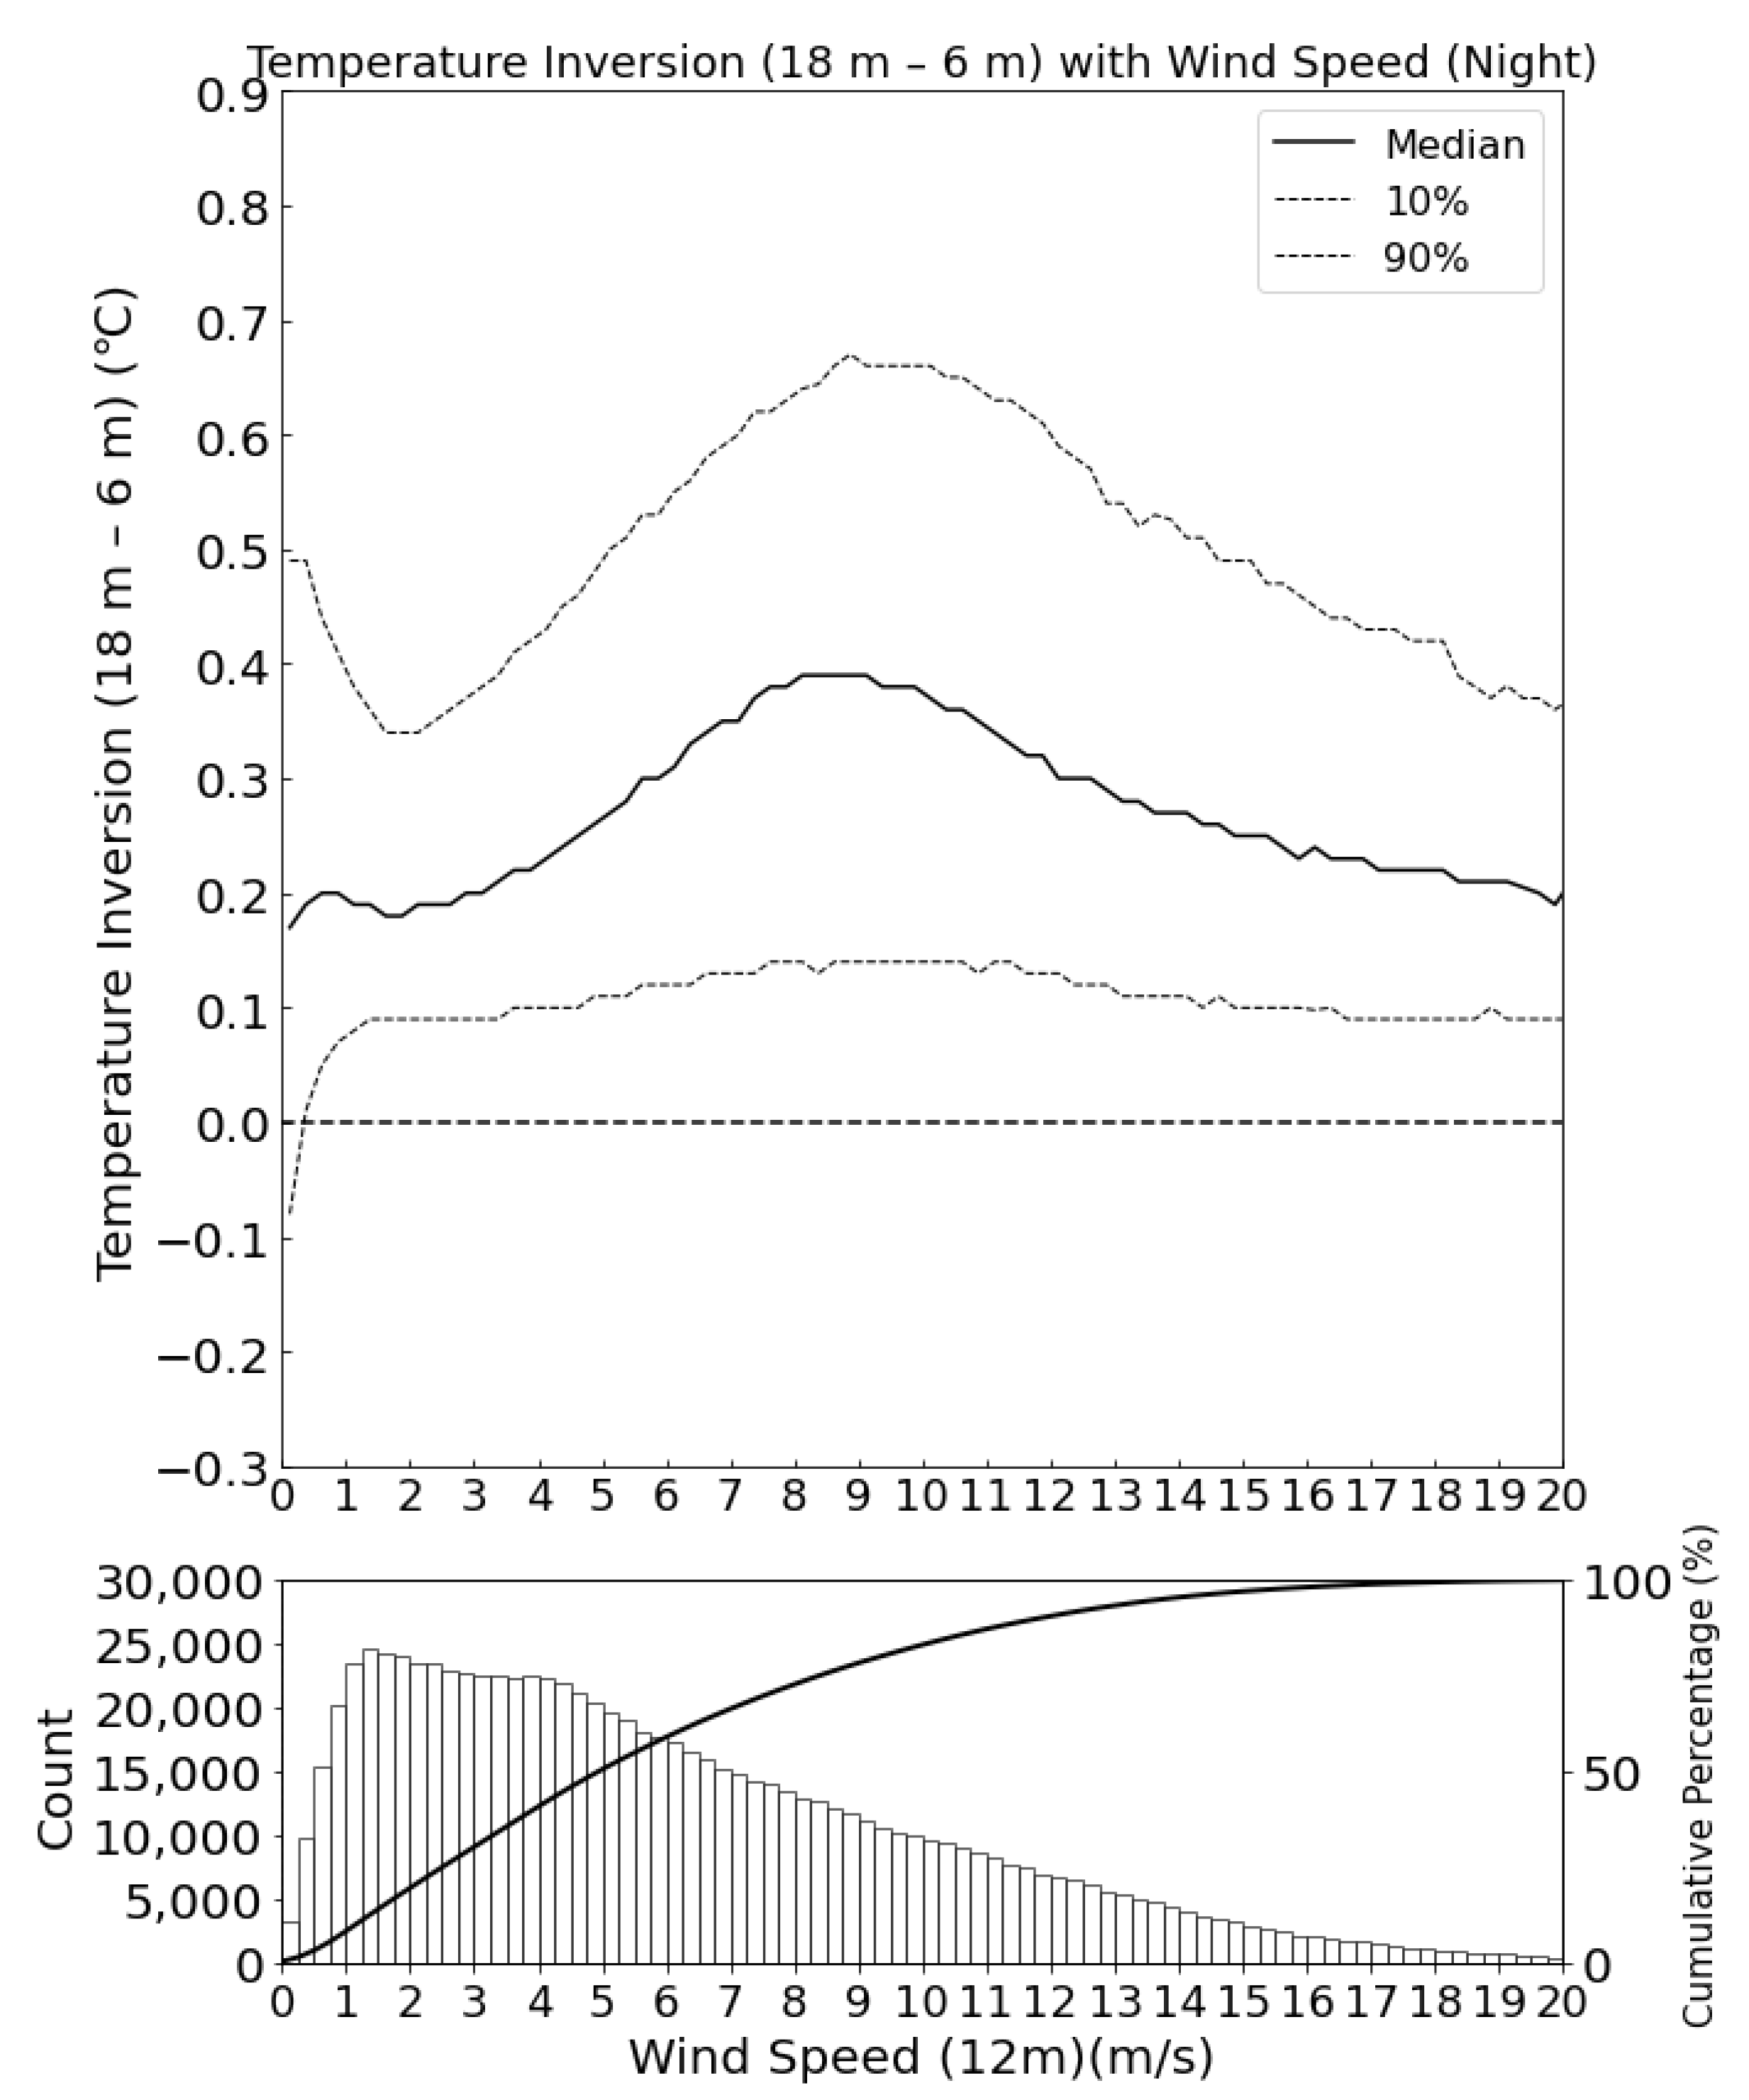
3.2. Temperature Inversion with Meteorology

In this part, we study the correlation between temperature inversion and meteorological data, including cloud coverage, relative humidity, wind speed, and wind direction.
The data of cloud coverage data at the Muztagh-Ata site is collected by an all-sky cloud camera, with detailed description of the camera provided in [8]. Regarding processing methods of images from the camera, we referred to the method in [21]. Specifically, first, we defined two regions in each image: an inner circle within 44.7° zenith angle and an outer annulus between 44.7° and 65° zenith angle. Then, we manually classified all images since September 2021 into five categories—“clear”, “outer”, “inner”, “covered”, and “cannot”—based on cloud distribution. The “cannot” category represents indistinguishable cases (possibly caused by factors like frost on the camera lens), “clear” means no clouds in either region, “outer” means clouds only in the outer annulus, “inner” means clouds in both regions, and “covered” means more than half of both regions are cloud-covered. From “clear” to “outer” to “inner” to “covered”, the cloud coverage gradually increases. “Clear” and “outer” conditions represent observable time at night for astronomy, while “inner” and “covered” represent non-observable time at night. The observable time at night at the Muztagh-Ata site is referred to in [22].
The all-sky cloud camera collects one image every 5 min at night. We associate all temperature inversion data from each 5 min interval with the corresponding cloud image type. To investigate the correlation between cloud cover and temperature inversion, we constructed the line chart shown in Figure 5. From the figure we can find the following: while the cloud coverage increases, the temperature inversion strength weakens. We attribute this to the fact that nocturnal clouds absorb longwave radiation from the ground and subsequently re-emit a portion of it; the downward-released component is reabsorbed by the surface, thereby reducing heat loss through radiation from the ground and consequently weakening inversion strength [23,24].
Figure 6 shows a boxplot for the distribution of temperature inversion strength with relative humidity, where data with excessively high humidity have been filtered out (for reasons detailed in Section 2.2 of this paper). The result shows that the temperature inversion strength at the Muztagh-Ata site weakens with increasing relative humidity. We attribute this phenomenon to the fact that moist air has a higher specific heat capacity than dry air [25]. Consequently, under the nighttime radiative cooling mechanism, the temperature variation near the ground surface is smaller when the air is more humid, resulting in weaker temperature inversion strength.
Figure 7 shows the distribution of temperature inversion strength with wind speed and a statistical histogram of wind speed. The wind speed data used here are from a height of 12 m. We can find that temperature inversion exhibits a bimodal distribution with the change in wind speed. When the wind speed is very low (below 1 m/s), the first peak in temperature inversion strength is observed. The second peak of temperature inversion appears at wind speeds between 8 m/s and 12 m/s. The phenomenon of bimodal distribution is similar to the behavior of temperature inversion with wind speed on the Antarctic Plateau [26]. The first peak value occurs because weak wind conditions reduce vertical air movement and mixing, which is a beneficial factor for the formation of strong inversions. For the second peak, normally, high wind speeds do not promote strong temperature inversion, and the causal relationship is thought to be the reverse: the cold air at the bottom of the temperature inversion layer is denser, while the warm air at the top is less dense; meanwhile, on gentle slopes, the denser cold air flows down the slope, resulting in increased wind speeds, which is called “inversion winds” [26]. The model proposed by [27] provides an explanation for this mechanism.
To study the temperature inversion distribution under different wind directions at the Muztagh-Ata site, we drew the wind rose diagram shown in Figure 8. From the diagram, we can find the following: the main wind direction at the Muztagh-Ata site is southwest wind, from 180° to 270°. It accounts for 73.76%. By statistics, we found that, under this wind direction, the temperature inversion occurrence rate is 85.79%. The median of ( T 18 m T 6 m ) is 0.15, with the quartiles Q1 and Q3 as 0.05 and 0.28, respectively. Besides southwest wind, northeast wind from 0° to 90° is also quite common, as it accounts for 13.80%. Under this wind direction, the temperature inversion occurrence rate is 63.60%, the median of ( T 18 m T 6 m ) is 0.04, with the Q1 and Q3 as −0.03 and 0.13, respectively. Additionally, winds from the southeast sector (90° to 180°) account for only 5.45%, and those from the northwest sector (270° to 360°) account for only 6.99%.

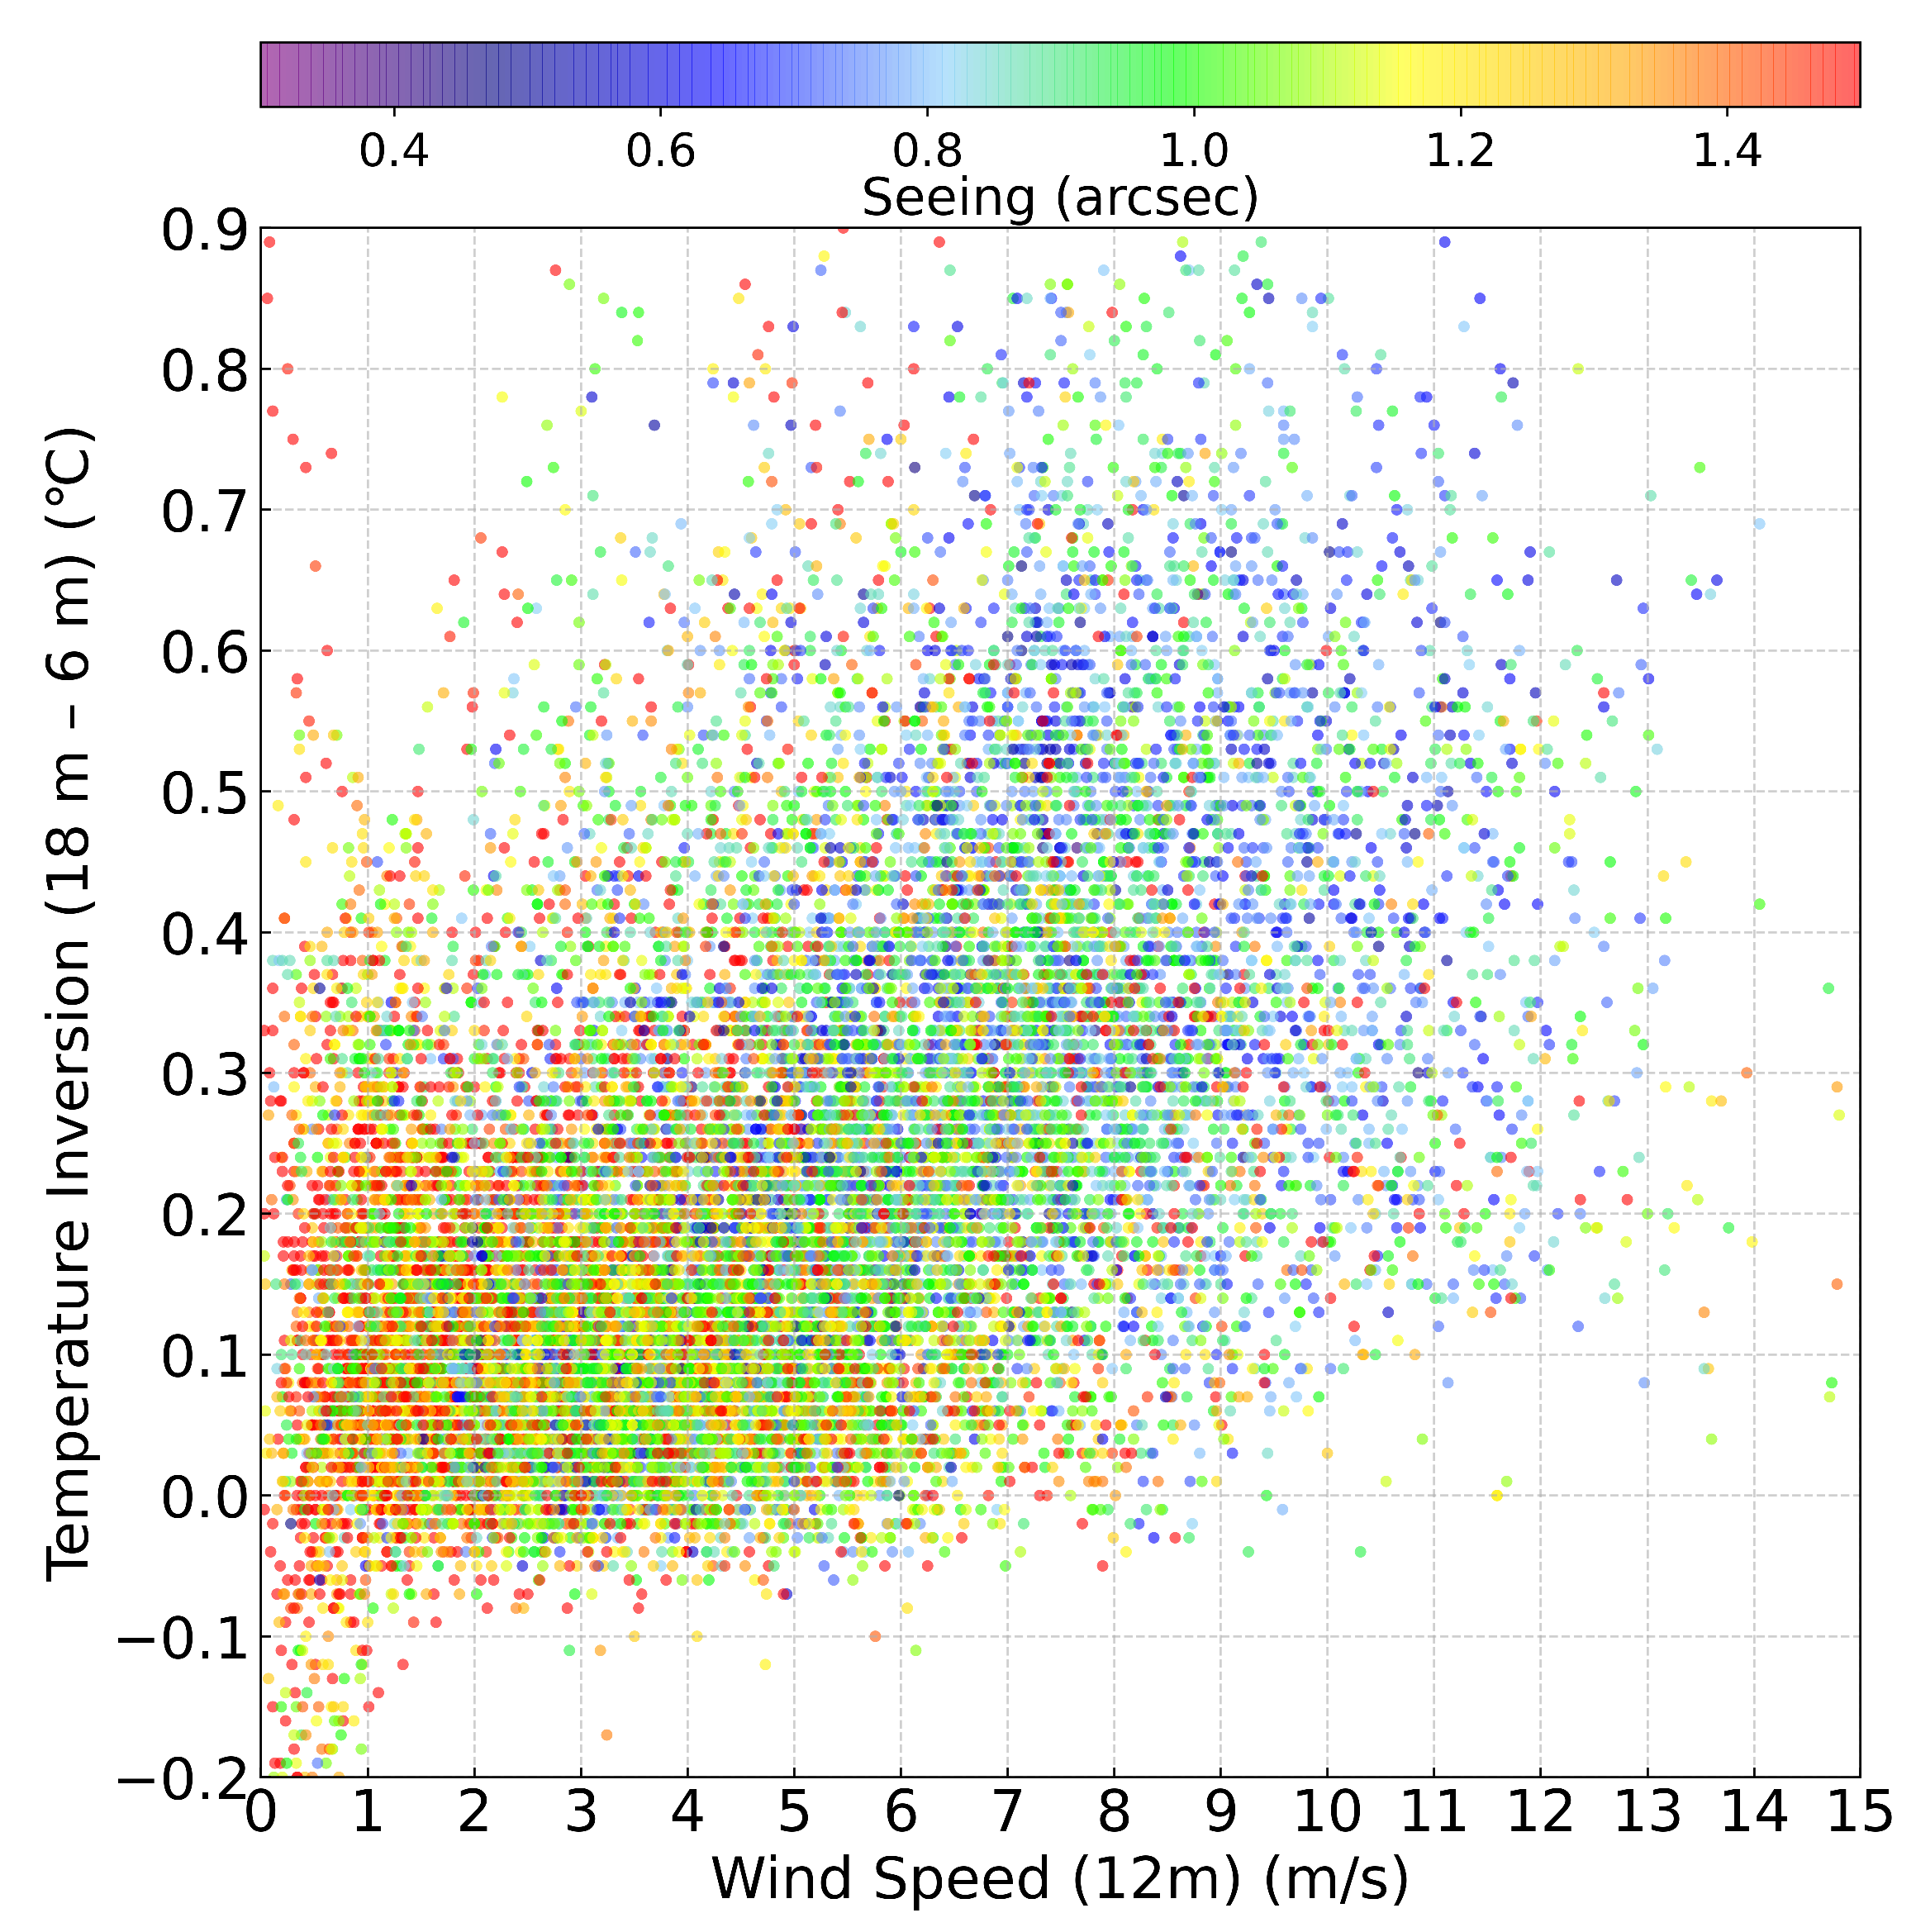
3.3. Temperature Inversion with Seeing

Seeing, one of the core parameters for astronomical site selection, quantifies the degradation of stellar image clarity caused by atmospheric optical turbulence. Smaller seeing values indicate better conditions for optical astronomical observations. In this part, we study the correlation between temperature inversion and seeing, with seeing data collected by the NIAOT DIMM. The NIAOT DIMM records one data point per minute. To solve the problem of inconsistent measurement frequencies between the temperature inversion and seeing, the temperature inversion data was uniformly sampled at one-minute intervals. Detailed specifications of the NIAOT DIMM at the Muztagh-Ata and statistical seeing characteristics were provided in [9,10].
Figure 9 is a scatter plot of seeing distribution with temperature inversion strength and wind speed. The results show that better seeing conditions typically occur under circumstances with both strong temperature inversion and moderate wind speed. The wind speed requirement may be attributed to the “inversion wind” mechanism described in Section 3.2 of this paper. To be specific, under the “inversion wind” mechanism, the “buoyancy suppression effect” in the inversion layer weakens turbulence through the following process [28,29]: While strong temperature inversion promotes downslope airflow, turbulence attempts to lift colder surface air upward. This lifting requires work against gravity, consuming turbulent energy and thereby reducing turbulence intensity, which ultimately improves seeing.
In our study, as shown in Figure 10, we used the Richardson Number R i crucial dimensionless physical parameter that quantifies flow stability (specifically, how density stratification affects turbulence). The R i is commonly used to determine whether turbulence will be suppressed or enhanced, where R i > 0.25 indicates stable atmospheric stratification (turbulence is suppressed). The calculation of R i is given by
R i = g θ · θ z v z 2
where g is the gravitational acceleration (9.8 m/s2), θ is the potential temperature (in Kelvin, K), v is the wind speed (in m/s), and z is the vertical coordinate (height). The potential temperature ( θ ) represents the temperature an air parcel would have if adiabatically brought to a standard reference pressure (1000 hPa) and is calculated as
θ = T · P 0 P R / c p
where T is the actual temperature (in Kelvin), P is the current air pressure, P0 is the reference pressure (1000 hPa), R is the gas constant for dry air ( 287 J / ( kg · K ) ), and c p is the specific heat capacity of dry air at constant pressure ( 1005 J / ( kg · K ) ).
We can find in Figure 10 that R i is typically large when the temperature inversion strength exceeds 0.1 °C, revealing that strong temperature inversion at the Muztagh-ata site effectively suppress turbulence. The median seeing trend line in the upper image also shows a trend of improving seeing conditions (decreasing values) with increasing temperature inversion strength. Therefore, the surface temperature inversion at the Muztagh-Ata site can improve seeing by suppressing atmospheric optical turbulence.
Both Figure 9 and Figure 10 consistently support the conclusion that the strong temperature inversion often brings better seeing at this site.

3.4. Discussion with Related Research on Other Observatory Sites

Temperature inversion at both coastal and inland observatory sites have a positive effect on astronomical observing conditions. But the temperature inversion characteristics are different at each site.
Hawaii, located in the central Pacific, has temperature inversion mainly of the trade wind type [30]. In one hand, this temperature inversion can stop clouds from growing upward. This reduces mountain-caused rain, which makes Hawaii drier. In the other hand, this temperature inversion can also improve seeing by suppressing atmospheric optical turbulence [31].
The coastal mountains of Northwestern Ellesmere Island, Nunavut, which is located in the Arctic region, have strong radiation temperature inversion in winter [32]. Among them, mountain peaks higher than 1000 m are mostly above the peak of this temperature inversion layer. High-altitude sites above the temperature inversion layer can effectively avoid the most unstable turbulent air layer near the ground; thus, they can expect to significantly improve seeing, which makes the high mountain sites in this area very promising candidates for excellent observatory locations.
The temperature inversion at the Dome A site on the Antarctic continent (a stable layer formed by cold surface air covered by warmer air above) is proven to be the key factor determining seeing [3]. When the temperature inversion strengthens at this site, it compresses the boundary layer thickness and reduces turbulence. This causes seeing to improve significantly.
The Delingha site on the Tibetan Plateau also has significant near-ground temperature inversion [4]. Different from the Muztagh site, when strong temperature inversions happen at Dome A and Delingha, wind speeds are usually low [3,4]; combined with the research in Section 3.2 of this paper, this is thought to be related to terrain features.

4. Conclusions

In this study, we used temperature sensors at five different heights installed on a 30 m meteorological tower and a DIMM to investigate the characteristics of temperature inversion and its effect on seeing at the Muztagh-Ata site. We found that the surface temperature inversion at the Muztagh-Ata site is very pronounced at night, with the proportion is about 87.0%. And the best seeing often occurs with strong temperature inversions and moderate wind speeds, with strong temperature inversion often resulting in better seeing by suppressing atmospheric optical turbulence, so it is further proved that the site has excellent conditions for astronomical observation.
In the study of spatiotemporal distribution about the phenomenon, we found the following: (1) The temperature inversion phenomenon begins to weaken at dawn and disappears, while the temperature inversion forms after sunset and remains stable during the night. (2) The temperature inversion mainly occurs below 18 m. (3) The temperature inversion is weaker in spring and summer but stronger in autumn and winter.
In the study about correlation with meteorological parameters, we found the following: (1) The temperature inversion weakens as cloud coverage increases because clouds reflect part of the radiation from the ground. (2) The temperature inversion weakens as humidity increases because moist air has a higher specific heat capacity. (3) The temperature inversion shows a bimodal distribution with changes in wind speed, possibly due to the mechanism of inversion winds. (4) Strong temperature inversions usually arise with southwest winds, and this wind direction is the common wind direction, making up as high as 73.76%.
Based on the daily variation of the near-surface temperature inversion strength at the Muztagh-Ata site and its correlation with cloud coverage, we conclude that the formation of the nighttime near-surface inversion is mainly related to radiation.
Conclusions of this study can provide reference for the future construction of telescopes at the Muztagh-Ata site, particularly in determining the optimal height for telescope placement and scheduling ground-based optical astronomical observations.

Author Contributions

Conceptualization, W.-B.G. and A.E.; methodology, D.-P.Z. and W.-B.G.; software, D.-P.Z.; validation, D.-P.Z.; formal analysis, D.-P.Z., W.-B.G. and A.E.; investigation, D.-P.Z. and W.-B.G.; resources, A.E.; data curation, C.-H.B. and H.-B.N.; writing—original draft preparation, D.-P.Z.; writing—review and editing, W.-B.G., A.E., L.-Y.L. and J.-C.Z.; visualization, D.-P.Z.; supervision, A.E.; project administration, A.E.; funding acquisition, A.E. All authors have read and agreed to the published version of the manuscript.

Funding

This work was supported by the Tianshan Talent Training Program (Grant No. 2023TSYCLJ0053), the National Natural Science Foundation of China (Grant No. U2031209), the Chinese Academy of Science (CAS) “Light of West China” Program (Grant No. 2022XBONXZ014), the Central Guidance for Local Science and the Technology Development Fund (No. ZYYD2025QY27), and the Tianshan Innovation Team Program of Xinjiang Uygur Autonomous Region (No. 2024D14015).

Data Availability Statement

The data presented in this study are available on request from the corresponding author. The data are not publicly available due to privacy.

Acknowledgments

We sincerely appreciate the reviewer and the editor for their valuable suggestions, which have greatly improved the manuscript.

Conflicts of Interest

We hereby confirm that there are no conflicts of interest associated with this work.

References

  1. Lyman, R.; Cherubini, T.; Businger, S. Forecasting seeing for the Maunakea Observatories. Mon. Not. R. Astron. Soc. 2020, 496, 4734–4748. [Google Scholar] [CrossRef]
  2. Otarola, A.; De Breuck, C.; Travouillon, T.; Matsushita, S.; Nyman, L.Å.; Wootten, A.; Radford, S.J.E.; Sarazin, M.; Kerber, F.; Pérez-Beaupuits, J.P. Precipitable Water Vapor, Temperature, and Wind Statistics At Sites Suitable for mm and Submm Wavelength Astronomy in Northern Chile. Publ. Astron. Soc. Pac. 2019, 131, 045001. [Google Scholar] [CrossRef]
  3. Ma, B.; Shang, Z.; Hu, Y.; Hu, K.; Wang, Y.; Yang, X.; Ashley, M.C.B.; Hickson, P.; Jiang, P. Night-time measurements of astronomical seeing at Dome A in Antarctica. Nature 2020, 583, 771–774. [Google Scholar] [CrossRef] [PubMed]
  4. Zhu, L.; Zhang, H.; Zhang, L.; Duan, X.; Lu, X.; Liu, Y.; Li, X.; Sun, G.; Weng, N. Astronomical seeing and ground-level optical turbulence at Delingha observatory on the northern Tibetan Plateau. Mon. Not. R. Astron. Soc. 2023, 525, 3236–3247. [Google Scholar] [CrossRef]
  5. Roggemann, M.C.; Welsh, B.M.; Fugate, R.Q. Improving the resolution of ground-based telescopes. Rev. Mod. Phys. 1997, 69, 437–505. [Google Scholar] [CrossRef]
  6. Ji, H.; Li, J.; Dai, S.; Yu, H.; Zhang, S.; Chen, Y.; Pan, J.; Xu, Q.; Zhu, Y.; Hu, Z. A new spectrograph of bi-channel with ultrawide band and high flux for MOST (SCUTUM) telescope. In Ground-Based and Airborne Instrumentation for Astronomy X; Bryant, J.J., Motohara, K., Vernet, J.R.D., Eds.; Society of Photo-Optical Instrumentation Engineers (SPIE) Conference Series; SPIE: Bellingham, WA, USA, 2024; Volume 13096, pp. 562–576. [Google Scholar] [CrossRef]
  7. Rui, G.; Zheng, W.; He, Z.; Shu, Y.; Er, X.; Li, G.; Hu, B. Forecast of gravitationally lensed Type Ia supernovae time delay measurement by Muztage-Ata 1.93m Synergy Telescope. arXiv 2025, arXiv:2501.05303. [Google Scholar] [CrossRef]
  8. Xu, J.; Feng, G.J.; Pu, G.X.; Wang, L.T.; Cao, Z.H.; Ren, L.Q.; Zhang, X.; Ma, S.G.; Bai, C.H.; Esamdin, A.; et al. Site-testing at the Muztagh-ata Site V. Nighttime Cloud Amount during the Last Five Years. Res. Astron. Astrophys. 2023, 23, 045015. [Google Scholar] [CrossRef]
  9. Xu, J.; Esamdin, A.; Hao, J.X.; Bai, J.M.; Yang, J.; Zhou, X.; Yao, Y.Q.; Hou, J.L.; Pu, G.X.; Feng, G.J.; et al. Site testing at Muztagh-ata site II: Seeing statistics. Res. Astron. Astrophys. 2020, 20, 087. [Google Scholar] [CrossRef]
  10. Zhang, J.; Zhao, Y.; Esamdin, A.; Niu, H.; Gao, J.; Zibibula, R.; Bai, C.; Zhang, X.; Feng, G.; Lin, L.; et al. Astronomical seeing with DIMM and wind-speed distributions with ERA5 data at the Muztagh-Ata site on the Pamir Plateau. Mon. Not. R. Astron. Soc. 2025, 539, 2077–2087. [Google Scholar] [CrossRef]
  11. R. M. Young Company. Model 81000 Ultrasonic Anemometer Technical Manual; R. M. Young Company: Traverse City, MI, USA; Available online: https://www.youngusa.com/wp-content/uploads/2008/01/81000-9028I29.pdf (accessed on 26 June 2025).
  12. R. M. Young Company. Model 41342 Platinum Temperature Probe Instruction Manual; R. M. Young Company: Traverse City, MI, USA; Available online: https://www.youngusa.com/wp-content/uploads/2008/01/41342-9028c29.pdf (accessed on 26 June 2025).
  13. R. M. Young Company. Model 61302 Barometric Pressure Sensor Technical Manual; R. M. Young Company: Traverse City, MI, USA; Available online: https://www.fondriest.com/pdf/rm_young_61302_manual.pdf (accessed on 26 June 2025).
  14. R. M. Young Company. Model 41382VC Relative Humidity/Temperature Probe Instruction Manual; R. M. Young Company: Traverse City, MI, USA; Available online: https://www.youngusa.com/wp-content/uploads/2008/01/41382VC-9028F29.pdf (accessed on 26 June 2025).
  15. Pietroni, I.; Argentini, S.; Petenko, I. One Year of Surface-Based Temperature Inversions at Dome C, Antarctica. Bound.-Layer Meteorol. 2014, 150, 131–151. [Google Scholar] [CrossRef]
  16. Whiteman, C.D.; Bian, X.; Zhong, S. Wintertime evolution of the temperature inversion in the Colorado Plateau Basin. J. Appl. Meteorol. 1999, 38, 1103–1117. [Google Scholar] [CrossRef]
  17. Whiteman, C.D.; Pospichal, B.; Eisenbach, S.; Weihs, P.; Clements, C.B.; Steinacker, R.; Mursch-Radlgruber, E.; Dorninger, M. Inversion breakup in small Rocky Mountain and Alpine basins. J. Appl. Meteorol. 2004, 43, 1069–1082. [Google Scholar] [CrossRef]
  18. Huang, Q.; Chu, Y.; Li, Q. Climatology of low-level temperature inversions over China based on high-resolution radiosonde measurements. Theor. Appl. Climatol. 2021, 144, 415–429. [Google Scholar] [CrossRef]
  19. Seidel, D.J.; Ao, C.O.; Li, K. Estimating climatological planetary boundary layer heights from radiosonde observations: Comparison of methods and uncertainty analysis. J. Geophys. Res. 2010, 115, D16113. [Google Scholar] [CrossRef]
  20. Abdul-Wahab, S.A. Analysis of thermal inversions in the Khareef Salalah region in the Sultanate of Oman. J. Geophys. Res. 2003, 108, 4274. [Google Scholar] [CrossRef]
  21. Skidmore, W.; Schöck, M.; Magnier, E.; Walker, D.; Feldman, D.; Riddle, R.; Els, S.; Travouillon, T.; Bustos, E.; Seguel, J.; et al. Using All Sky Cameras to determine cloud statistics for the Thirty Meter Telescope candidate sites. Ground-Based Airborne Telesc. II 2008, 7012, 701224. [Google Scholar] [CrossRef]
  22. Gu, W.B.; Xu, J.; Feng, G.J.; Zhang, X.; Wang, L.T.; Wang, X.L.; Esamdin, A.; Shen, L.X. An Analysis of the Fragmentation of Observing Time At the Muztagh-Ata Site. Res. Astron. Astrophys. 2024, 24, 035003. [Google Scholar] [CrossRef]
  23. Sedlar, J.; Tjernström, M. Stratiform cloud–inversion characterization during the Arctic melt season. Bound.-Layer Meteorol. 2009, 132, 455–474. [Google Scholar] [CrossRef]
  24. Ruman, C.J.; Monahan, A.H.; Sushama, L. Climatology of Arctic temperature inversions in current and future climates. Theor. Appl. Climatol. 2022, 150, 121–134. [Google Scholar] [CrossRef]
  25. Stoy, P.C.; Roh, J.; Bromley, G.T. It’s the heat and the humidity: The complementary roles of temperature and specific humidity to recent changes in the energy content of the near-surface atmosphere. Geophys. Res. Lett. 2021, 48, e2021GL096628. [Google Scholar] [CrossRef]
  26. Hudson, S.R.; Brandt, R.E. A look at the surface-based temperature inversion on the Antarctic Plateau. J. Clim. 2005, 18, 1673–1696. [Google Scholar] [CrossRef]
  27. Mahrt, L.J.; Schwerdtfeger, W. Ekman spirals for exponential thermal wind. Bound.-Layer Meteorol. 1970, 1, 137–145. [Google Scholar] [CrossRef]
  28. Stiperski, I.; Holtslag, A.A.M.; Lehner, M.; Hoch, S.W.; Whiteman, C.D. On the turbulence structure of deep katabatic flows on a gentle mesoscale slope. Q. J. R. Meteorol. Soc. 2020, 146, 1206–1231. [Google Scholar] [CrossRef] [PubMed]
  29. Farina, S.; Zardi, D. Understanding Thermally Driven Slope Winds: Recent Advances and Open Questions. Bound.-Layer Meteorol. 2023, 189, 5–52. [Google Scholar] [CrossRef]
  30. Cao, G.; Giambelluca, T.W.; Stevens, D.E.; Schroeder, T.A. Inversion Variability in the Hawaiian Trade Wind Regime. J. Clim. 2007, 20, 1145–1160. [Google Scholar] [CrossRef]
  31. Cherubini, T.; Businger, S.; Lyman, R.; Chun, M. Modeling Optical Turbulence and Seeing over Mauna Kea. J. Appl. Meteorol. Climatol. 2008, 47, 1140–1155. [Google Scholar] [CrossRef]
  32. Steinbring, E.; Carlberg, R.; Croll, B.; Fahlman, G.; Hickson, P.; Ivanescu, L.; Leckie, B.; Pfrommer, T.; Schoeck, M. First Assessment of Mountains on Northwestern Ellesmere Island, Nunavut, as Potential Astronomical Observing Sites. Publ. Astron. Soc. Pac. 2010, 122, 1092. [Google Scholar] [CrossRef]
Figure 1. The 30 m meteorological tower and the monitoring equipment at each height level. The bottom right of the figure displays the instruments installed at each height level, on the left is the temperature sensor, and on the right is the ultrasonic anemometer.
Atmosphere 16 00897 g001
Figure 2. The daily distribution of temperature inversion strength at the Muztagh-Ata site. The x-axis represents the time in a day (UTC+8), and the y-axis represents the temperature inversion. The points represent the median of temperature inversion statistics within one hour range, and the associated vertical lines represent the temperature inversion strength ranging from 25% to 75%. Different colored lines correspond to data from different height ranges.
Atmosphere 16 00897 g002
Figure 3. Box plot of the monthly distribution of temperature inversion strength at the height range between 18 m and 6 m at the Muztagh-Ata site. The points inside every box are the median values; the horizontal lines are the mean values. Each box represents the values in the range of 25–75% and the associated vertical line signifies the values ranging from 10% to 90%. Black: day; red: night.
Atmosphere 16 00897 g003
Figure 4. Proportion pie chart of temperature inversion: the left figure represents daytime and the right one represents nighttime. The part of TI (blue) represents ( T 18 m T 6 m ) > 0 , and the part of red represents ( T 18 m T 6 m ) 0 .
Atmosphere 16 00897 g004
Figure 5. The correlation between temperature inversion strength and cloud coverage at nighttime. The x-axis represents cloud coverage, with values increasing left to right. The y-axis represents the temperature inversion strength. Each point represents the median temperature inversion for different specific height ranges corresponding to the given cloud coverage. The associated vertical lines represent the temperature inversion values ranging from 25% to 75%.
Atmosphere 16 00897 g005
Figure 6. The correlation between temperature inversion strength and relative humidity at nighttime. The x-axis represents relative humidity, and the y-axis represents temperature inversion. The plots inside each box represent the median of the temperature inversion at the height range from 18 m to 6 m for every 10% relative humidity range; the horizontal lines represent the mean values. Each box represents the values in the range of 25–75% and the associated vertical line signifies the values ranging from 10% to 90%.
Atmosphere 16 00897 g006
Figure 7. Upper figure: the correlation between temperature inversion and wind speed at night. The x-axis represents wind speed at 12 m, the y-axis represents the temperature inversion strength at the height range from 18 m to 6 m, the black line represents the median of temperature inversion, and the two dashed lines represent the values ranging from 10% to 90%. Below figure: the statistical distribution histogram and cumulative distribution curve of wind speed data. The x-axis is the same as in the upper figure, the y-axis represents the statistical count of wind speed data within this interval, and the black curve represents the cumulative distribution function.
Atmosphere 16 00897 g007
Figure 8. The nighttime wind rose diagram at 12 m height for the Muztagh-Ata site, where 0 degrees represents the true north direction, clockwise is the direction where angles increase, and the radial coordinate represents the statistical count of wind direction data for each 10-degree interval. The color of the sectors represents the wind speed (For details, see the legend on the right side of the picture).
Atmosphere 16 00897 g008
Figure 9. The scatter plot shows the distribution of seeing with respect to temperature inversion strength and wind speed. The x-axis represents wind speed, the y-axis represents temperature inversion, and the color of each data point corresponds to the seeing value (as indicated by the color bar above), purple and blue points represent good seeing, green points represent moderate seeing, while yellow and red points represents bad seeing.
Atmosphere 16 00897 g009
Figure 10. Upper image: Scatter plot of Richardson number ( R i ) versus temperature inversion strength and seeing. Points are colored by R i value, with the x-axis representing temperature inversion and y-axis representing seeing. The black line represents the median seeing value per 0.1 °C temperature inversion interval. Lower image: Line graph of median R i versus temperature inversion. The associated vertical lines represent the R i values ranging from 25% to 75%.
Atmosphere 16 00897 g010
Table 1. Main parameters of instruments on the 30 m meteorological tower.
TypeModelInstalled
Height (m)
ResolutionFrequency
(Hz)
Ultrasonic
Anemometer
Young 81000
[11]
6, 12,
18, 24, 30
0.01 m/s20
Temperature
Sensor
Young 41342
[12]
6, 12,
18, 24, 30
0.01 °C1/30
Barometric
Pressure Sensor
Young 61302v
[13]
20.2 hPa1/30
Relative
Humidity Sensor
Young 41382vc
[14]
60.1% RH1/30
Disclaimer/Publisher’s Note: The statements, opinions and data contained in all publications are solely those of the individual author(s) and contributor(s) and not of MDPI and/or the editor(s). MDPI and/or the editor(s) disclaim responsibility for any injury to people or property resulting from any ideas, methods, instructions or products referred to in the content.

