Article

Analysis of Weather Conditions and Synoptic Systems During Different Stages of Power Grid Icing in Northeastern Yunnan

1
Yunnan Power Grid Co., Ltd. Transmission Branch, Kunming 650033, China
2
Experimental Teaching Center of Atmospheric Science and Environmental Meteorology, Nanjing University of Information Science and Technology, Nanjing 210044, China
*
Author to whom correspondence should be addressed.
Atmosphere 2025, 16(7), 884; https://doi.org/10.3390/atmos16070884
Submission received: 27 May 2025 / Revised: 12 July 2025 / Accepted: 15 July 2025 / Published: 18 July 2025
(This article belongs to the Section Meteorology)

Abstract

Various data such as power grid sensors and manual observed icing, CMA (China Meteorological Administration) Land Surface Data Assimilation System (CLDAS) products, and the Fifth Generation Atmospheric Reanalysis of the Global Climate from Europe Center of Middle Range Weather Forecast (ERA5) are adopted to diagnose an icing process under a cold surge during 16–23 December 2023 in northeastern Yunnan Province. The results show that: (1) in the early stage of the process, mainly the freezing types, such as GG (temperature > 0 °C, relative humidity ≥ 75%) and DG (temperature < 0 °C, relative humidity ≥ 75%), occur. At the end of the process, an increase in icing type as GD (temperature > 0 °C, relative humidity < 75%) appears. (2) Significant differences exist in the elements during different stages of icing, and the atmospheric thermal, dynamic, and water vapor conditions are conducive to the occurrence of freezing rain during ice accretion. The main impact weather systems of this process include a strong high ridge in the mid to high latitudes of East Asia, transverse troughs in front of the high ridge south to Lake Baikal, low altitude troughs, and ground fronts. The transverse trough in front of the high ridge can cause cold air to accumulate and then move eastward and southward. The southerly flows, surface fronts, and other low-pressure systems can provide powerful thermodynamic and moisture conditions for ice accumulation.

1. Introduction

The freezing of supercooled water droplets on power transmission lines during winter can disrupt the normal operation of power systems. In severe cases, freezing may cause failures such as tower collapses, line breaks, insulator flashovers, and communication interruptions [1,2,3,4], posing threats to socioeconomic stability. For instance, the widespread freezing rain and ice accretion events in southern China during January–February 2008 paralyzed over 30% of the transmission lines in China Southern Power Grid [5]. Therefore, analyzing the synoptic conditions for ice accretion disasters is critical to mitigating economic losses in power, transportation, and other sectors caused by freezing rain.
Beyond extensive research on the microphysical mechanisms of ice accretion [6,7], numerous studies have investigated the circulation patterns and weather backgrounds of freezing events [8,9,10,11,12,13]. Meteorologically, freezing rain is categorized into two types: rime ice (formed via supercooled water deposition) and glaze ice (formed via ice accretion). Freezing rain is the primary contributor to secondary ice hazards and exacerbated disasters. Two mechanisms dominate freezing rain formation, including the ice-phase melting mechanism and the supercooled warm rain mechanism [14,15]. The ice-phase melting mechanism occurs when precipitation falls through a layer of sub-zero air near the surface after passing through a mid-level warm layer (>0 °C), and the mechanism is common in low-altitude plains. The supercooled warm rain mechanism occurs when precipitation remains liquid (supercooled) below 0 °C until freezing upon sub-zero surfaces, which prevails in high-altitude regions [14,16]. The temperature at the altitude of the transmission line is key to distinguishing ice types. Studies indicate that rime ice typically forms when temperatures drop below −5 °C [17]. In northern China, rime ice dominates due to colder climates [18], while in southern regions, particularly the Yunnan-Guizhou Plateau, experience mixed glaze + rime ice accretion [19,20].
The occurrence of freezing (including hard rime and soft rime) is associated with frontal precipitation. Whether warm fronts, cold fronts, or quasi-stationary fronts, at least one layer of temperature inversion appears in the atmosphere for freezing. Thus, the intensity and thickness of the temperature inversion layer are critical to the formation of freezing weather [21,22,23]. The 2008 ice disaster in southern China was related to low-level stationary frontogenesis induced by anomalous Eurasian atmospheric circulation [24]. Additionally, factors such as low-level Jet stream, atmospheric stability, topography, and moisture sources [25,26] influence freezing rain events significantly. The weather systems affecting freezing events include the upper-level subtropical jet frontal zone, the low-level Yunnan-Guizhou quasi-stationary front, and the mid-to-low-level southwest jet stream [27]. Under the influence of multiple upper- and lower-level weather systems, differences in temperature, wind fields, and moisture conditions determine the intensity and spatial distribution of low-temperature snow and rain events [28]. The southwestern region features higher terrain in the west and south, lower elevations in the east and north. In winter, cold air can climb to the Yunnan-Guizhou Plateau while warm air moves northward, leading to the convergence and confrontation of cold and warm air masses, forming the Yunnan-Guizhou quasi-stationary front. Influenced by this front, warm, moist air overlies the cold air, creating a “warm-over-cold” configuration conducive to the formation and persistence of winter freezing conditions [19,29,30]. The alternating dominance of cold and warm air near the quasi-stationary front is the primary cause of repeated ice accretion on power lines [31,32].
In addition to the influence of weather systems, the mechanisms of freezing rain are also associated with micro-terrain [33] and elevation [34,35]. Therefore, the meteorological conditions of disaster cases in specific terrains require targeted analysis. Yunnan is located in a low-latitude plateau region, where the vast terrain of the Tibetan Plateau blocks most strong cold air intrusions. However, due to the limited resistance of Yunnan’s infrastructure (e.g., communications and transportation systems) and tropical cash crops to extremely low temperatures, severe losses occur when strong cold air affects the region. Research on freezing weather in Yunnan remains relatively sparse. In recent years, however, Yunnan has frequently experienced severe cold air events [36,37,38,39]. This study thus investigates the synoptic causes of ice accretion on power lines in Yunnan.

2. Data and Methods

2.1. Datasets

Northeastern Yunnan Province is located in the northeastern part of the Yunnan-Guizhou Plateau, bordering Sichuan and Guizhou. Dominated by mountains and plateaus, its terrain slopes from higher elevations in the northwest to lower elevations in the southeast, featuring steep valleys and significant undulations. Climatically, this region lies in a transition zone between subtropical monsoon and temperate climates, with pronounced vertical variations due to topographic influences. During the winter half-year (November–April), Yunnan’s atmospheric circulation is primarily characterized by dominance of the dry, warm southerly branch of the westerlies, superimposed by intermittent cold air intrusions and localized effects driven by terrain, resulting in a “dry-season-dominated, cold-warm alternation” pattern. The southern branch trough serves as the main weather system for precipitation, and cold air masses confront the warm, moist southwesterly flows over the Yunnan-Guizhou Plateau, forming the north–south oriented Kunming quasi-stationary front. When cold air pushes the front westward, it leads to temperature drops in northeastern and central Yunnan, along with frost or snowfall events.
The data used in this study include: (1) Hourly meteorological data from China Meteorological Administration (CMA) Land Data Assimilation System (CLDAS) during 1 December 2023 to 28 December 2023, including temperature, precipitation, relative humidity, and wind speed, with a spatial resolution of 0.0625° × 0.0625°, which is mainly used for classifying the icing with/without precipitation under considering the consistent conditions with icing. (2) Manual ice observation records from the Yunnan power grid during 16–21 December 2023, which are mainly the icing cases of the power grid recorded in the process. Here, icing observations were made twice a day from 16–21 December 2023. And in the calculations concerning the number of cases of icing changes. All cases were used in determining the freezing type, and only ice increase and decrease events were used for examining the conditions favoring the icing accumulation. (3) ERA5 reanalysis data (0.25° × 0.25°) from the European Centre for Medium-Range Weather Forecasts (ECMWF), including geopotential height, temperature, horizontal wind, relative humidity, vertical velocity, and relative vorticity at various altitude levels [40]; the data is mainly used for multilevel element analysis. (4) Topographic data provided by the U.S. National Oceanic and Atmospheric Administration (NOAA) (download URL: https://www.ngdc.noaa.gov/mgg/global/relief/ETOPO2, accessed on 26 May 2024). Here, the data is used to remove the elements below the altitude of the observation station.

2.2. Methods

A composite analysis was employed to examine the differences in meteorological variables and their statistical significance across different stages of ice accretion. Composite analysis involves calculating the difference between the mean values of two sample groups and performing a Student’s t-test for significance. To test whether there is a significant difference between the means of two populations, the following test statistic was constructed:
t = x ¯ y ¯ ( n 1 1 ) s 1 2 + ( n 2 1 ) s 2 2 n 1 + n 2 2 1 n 1 + 1 n 2
This equation follows a distribution with degrees of freedom ν = n1 + n2 − 2. Here,  x ¯ , y ¯ , n1 and n2 represent the sample means and sample sizes of groups x and y, respectively, while s1 and s2 denote the variances in the two samples. After determining the significance level α, the critical t-value tα is obtained from the t distribution table based on the degrees of freedom ν = n 1 + n 2 2 . If ∣t∣ ≥ tα, the null hypothesis is rejected, indicating a statistically significant difference.

3. Results

3.1. Brief Description of Icing in the Process

During 16–23 December 2023, the precipitation within the affected area was relatively low, with stations recording precipitation exceeding 5 mm primarily concentrated in eastern Yunnan (Figure 1a). The event was characterized by significant temperature drops, localized impacts, and minimal rain or snowfall. Observed ice accretion on power grids during the cold wave was mainly distributed in northeastern Yunnan and parts of western Guizhou. A total of 214 ice-covered power lines were recorded (Figure 1b) during the process, including ±500 kV (1 line), 500 kV (60 lines), 220 kV (24 lines), 110 kV (25 lines), 35 kV (43 lines), and 10 kV (61 lines). The ice accretion began to increase on December 16, peaking on 18 December with 51 transmission lines affected by icing. From 19 December to 20 December, temperatures stabilized in Zhaotong and Qujing, with ice accretion persisting in high-altitude areas of Zhaotong. By 23 December, rising temperatures in Zhaotong and Qujing led to gradual ice shedding on affected lines.

3.2. Freezing Type

Freezing disasters and their types are closely related to temperature. Generally, snow adhesion occurs at temperatures above 0 °C, glaze ice forms between −4 °C and 0 °C, and rime ice develops at temperatures below −10 °C [41]. For statistical purposes, ice accretion is classified into four categories based on observed temperature and humidity from power grids: DG type (temperature ≤ 0 °C, humidity > 75%), GD type (temperature > 0 °C, humidity < 75%), DD type (temperature ≤ 0 °C, humidity < 75%), GG type (temperature > 0 °C, humidity ≥ 75%). Ice thickness changes are defined as an increase, maintenance, or decrease if observed values rise, remain stable, or decline over two consecutive time intervals. For precipitation-related freezing events (74 cases), there are 2, 2, and 17 cases of increase, maintenance, and decrease for GD type, respectively. There are 13, 4, and 4 cases of increase, maintenance, and decrease for the GG type. No cases of DD type are observed. And 15, 10, and 6 cases of increase, maintenance, and decrease are observed for the DG type, respectively. For non-precipitation freezing events (109 cases), there are 11, 13, and 4 cases of increase, maintenance, and decrease for the GD type. There are 15 cases of increase, 1 maintenance, and 1 decrease for the GG type. There is 1 case of increase, maintenance, and decrease for the DD type, and 34 cases of increase, 19 maintenance, and 11 decrease (see Table 1) for the DG type.
During the icing accumulation stage with precipitation, three icing types (DG, GG, and GD) were observed, with DG being the most frequent and GD the least. In the maintenance stage with precipitation, DG, GG, and GD ices also coexisted, again with DG dominating and GD minimal. During the deicing stage with precipitation, DG, GG, and GD ices persisted, but GD became the most prevalent while GG was the least common. During both the icing accumulation and maintenance stages without precipitation, four icing types (DG, DD, GG, and GD) were present. DG remained dominant, while DD was the least frequent. Notably, GG decreased in the maintenance stage compared to the accumulation stage. In the deicing stage without precipitation, only DG, GG, and GD ices were observed. At the initial stage of cold air intrusion, the icing process occurs when temperatures are not yet very low, resulting in snow accumulation (i.e., GG is present). As temperatures continue to drop, the accumulated snow freezes or icing from freezing rain develops, with DG being the primary type. Since low humidity (<75%) suppresses the evaporative cooling effect, for the deicing stage at air temperatures above 0 °C, low humidity actually promotes “deicing” or suppresses ice formation. Although evaporation absorbs heat and cools the surface, if the ambient air temperature is significantly above 0 °C and precipitation intensity is low, the lowest temperature achievable by evaporative cooling is attained. However, under conditions where the temperature is slightly above 0°C (e.g., 0~3°C) but the humidity is low (below 75%), ice accretion may actually increase. Rapid evaporation carries away heat from the water droplets, but simultaneously causes the droplets themselves to evaporate and disappear more quickly, rather than accumulate. Therefore, when the stationary front retreats eastward, temperatures rise in the ice-covered areas of Yunnan with rainfall decrease, leading to rapid ice melt, especially in those regions with low humidity (i.e., GD). When the quasi-stationary front swings east–west, daytime melting and nighttime freezing will occur, leading to the coexistence of DG, GG, and GD icing processes. Hence, there are more GG in the icing accumulation stage and less in the deicing stage, but more GD in the deicing stage. From Table 1, the icing accretion (30/61) and decrease (27/16) cases with/without rainfall will be used for composite analysis in Section 3.3.

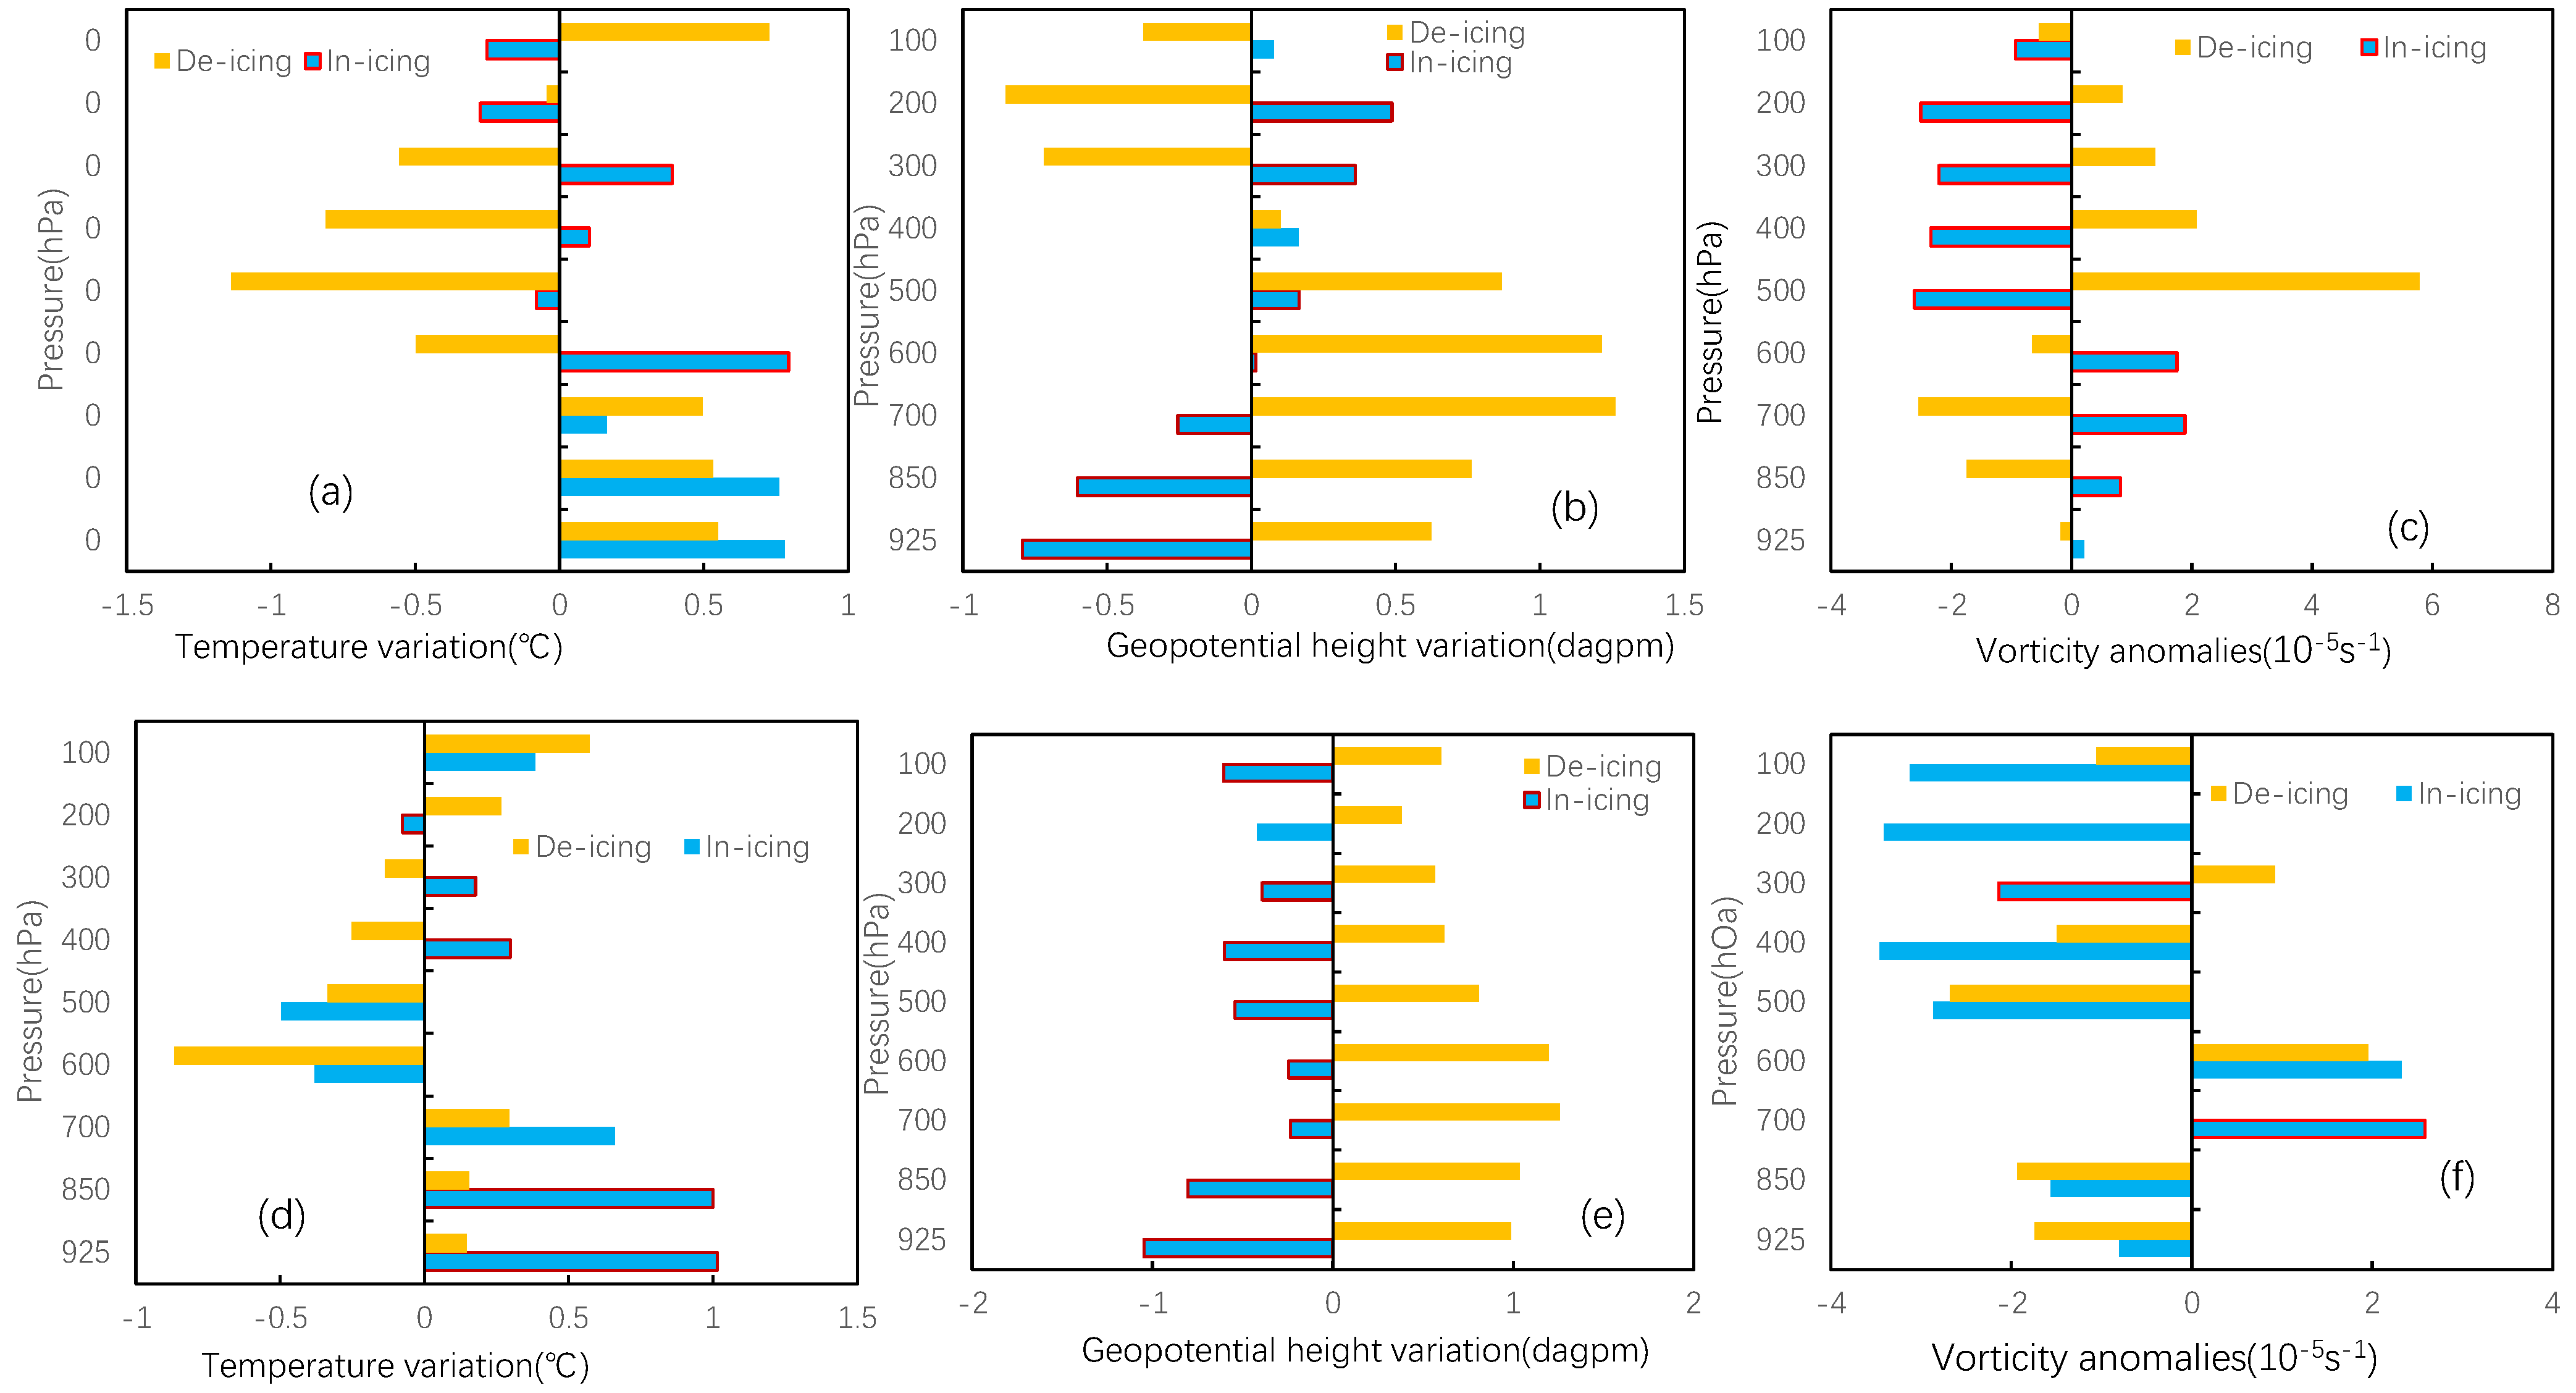
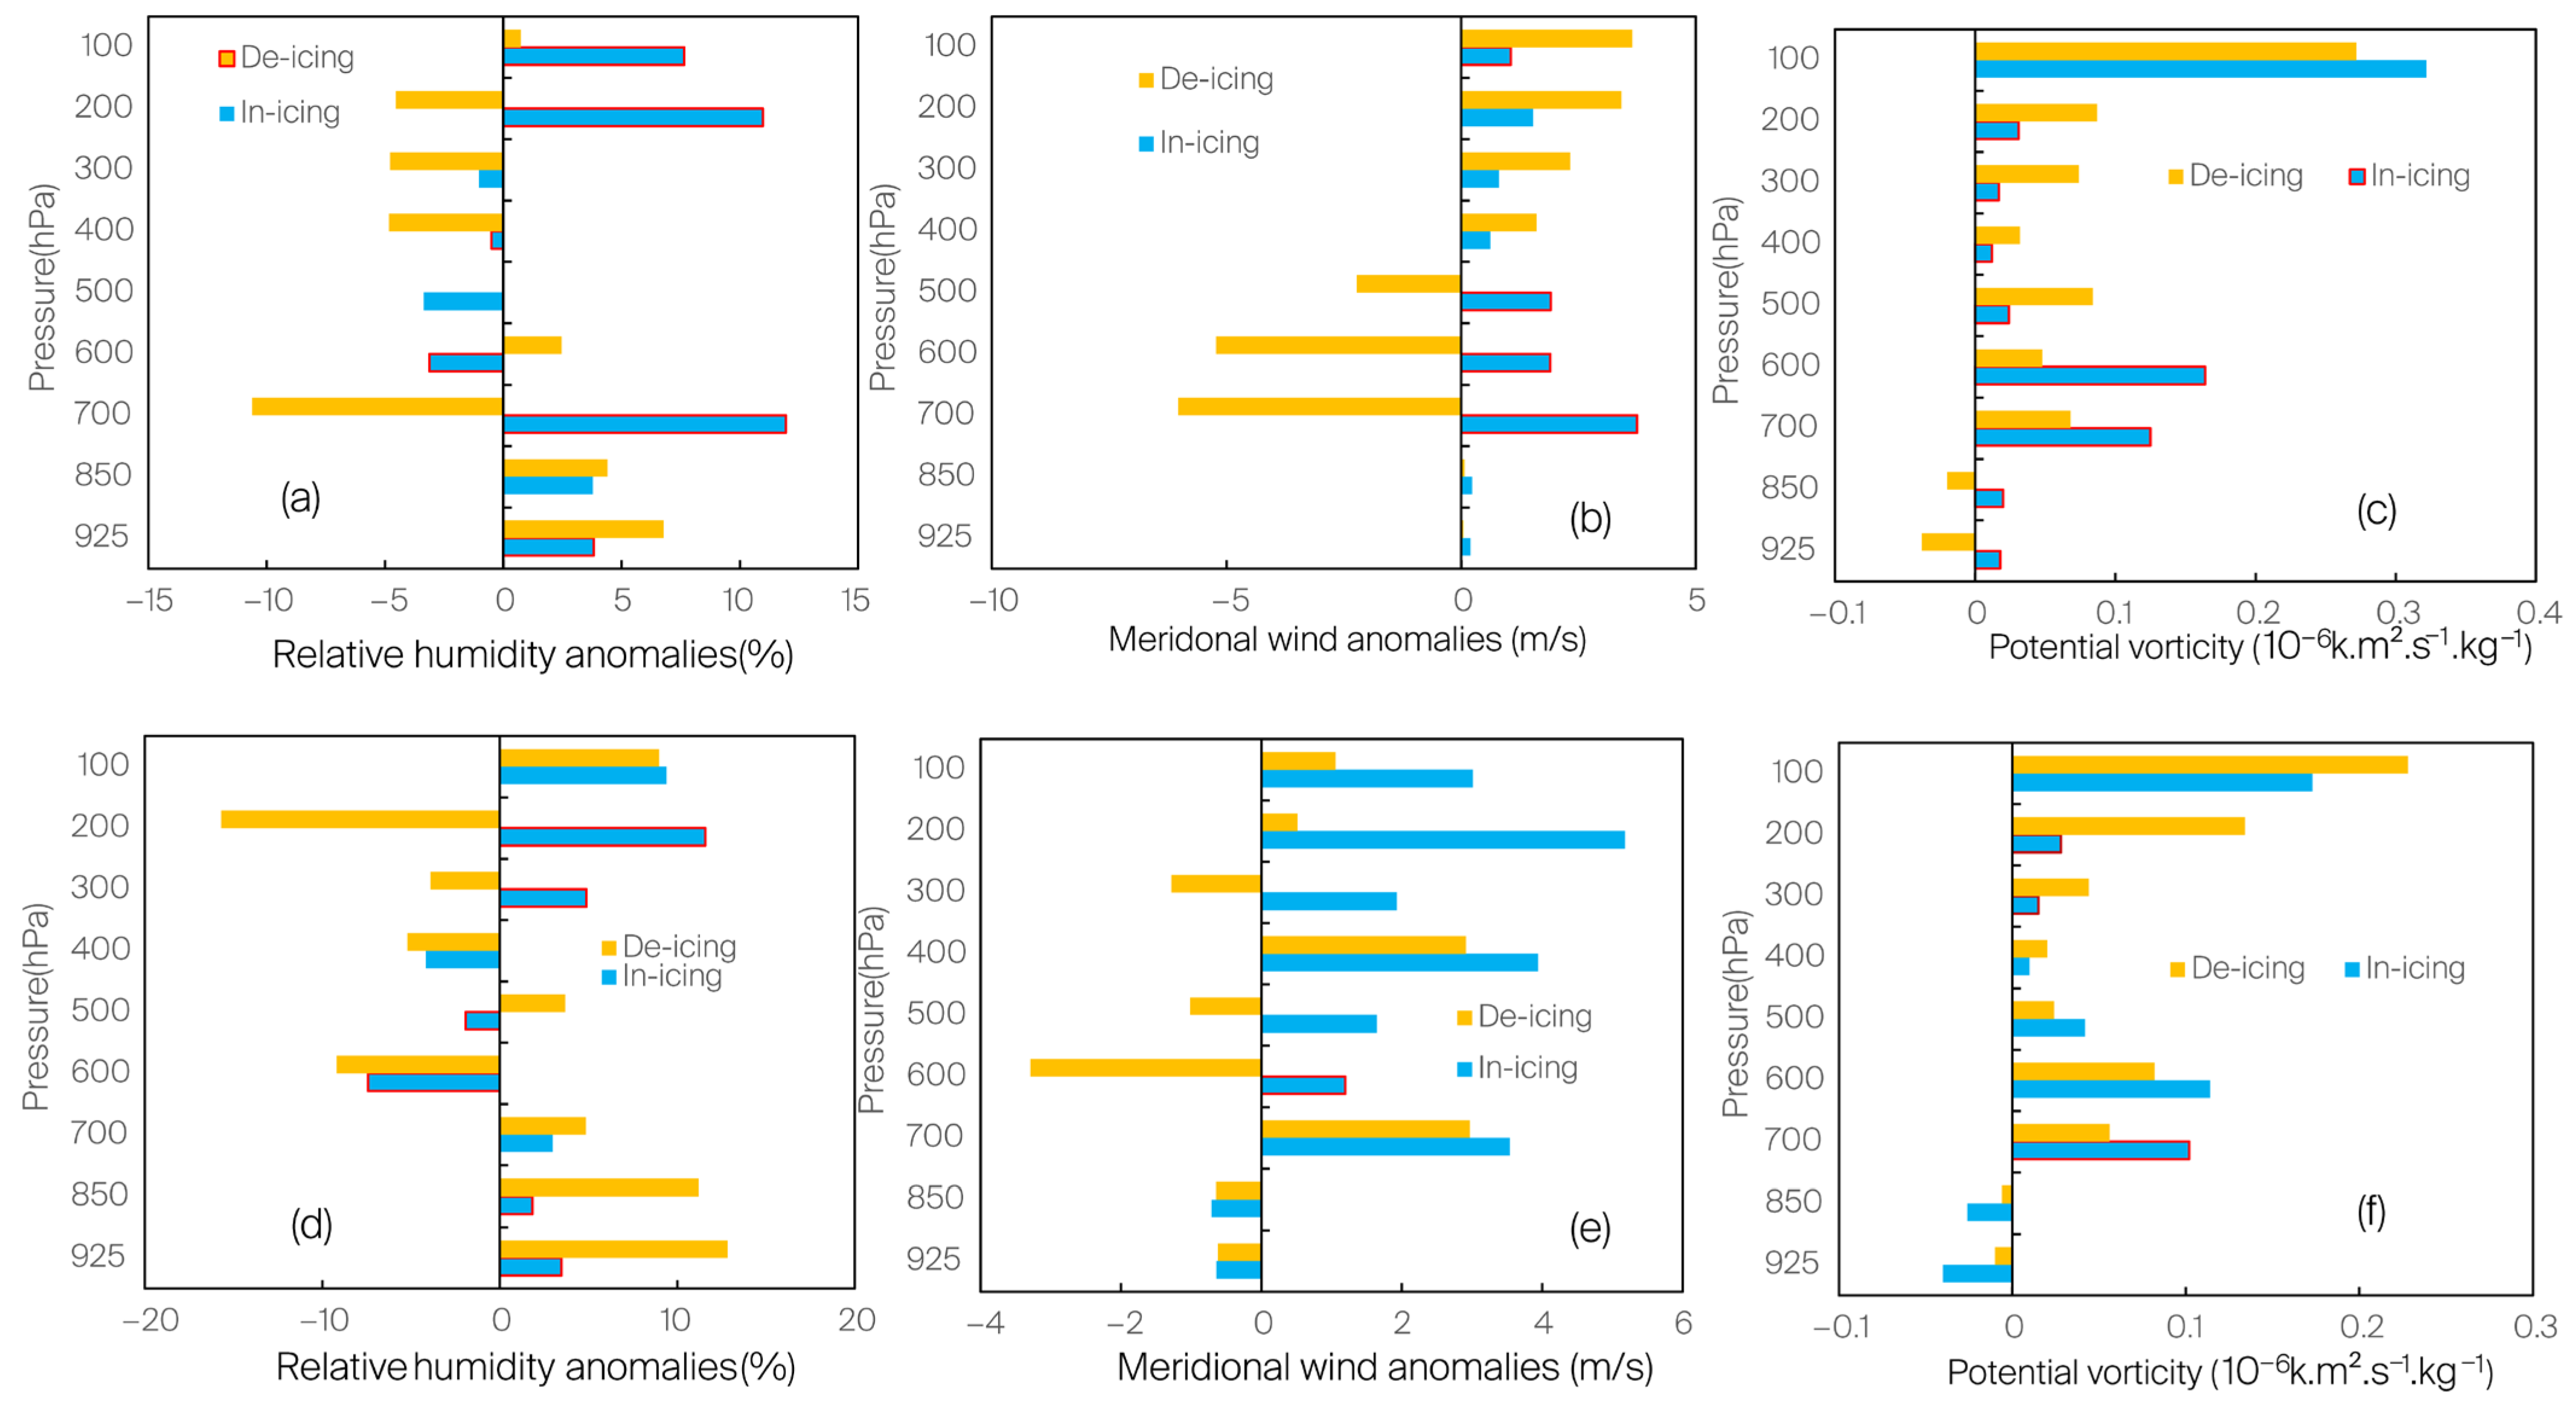
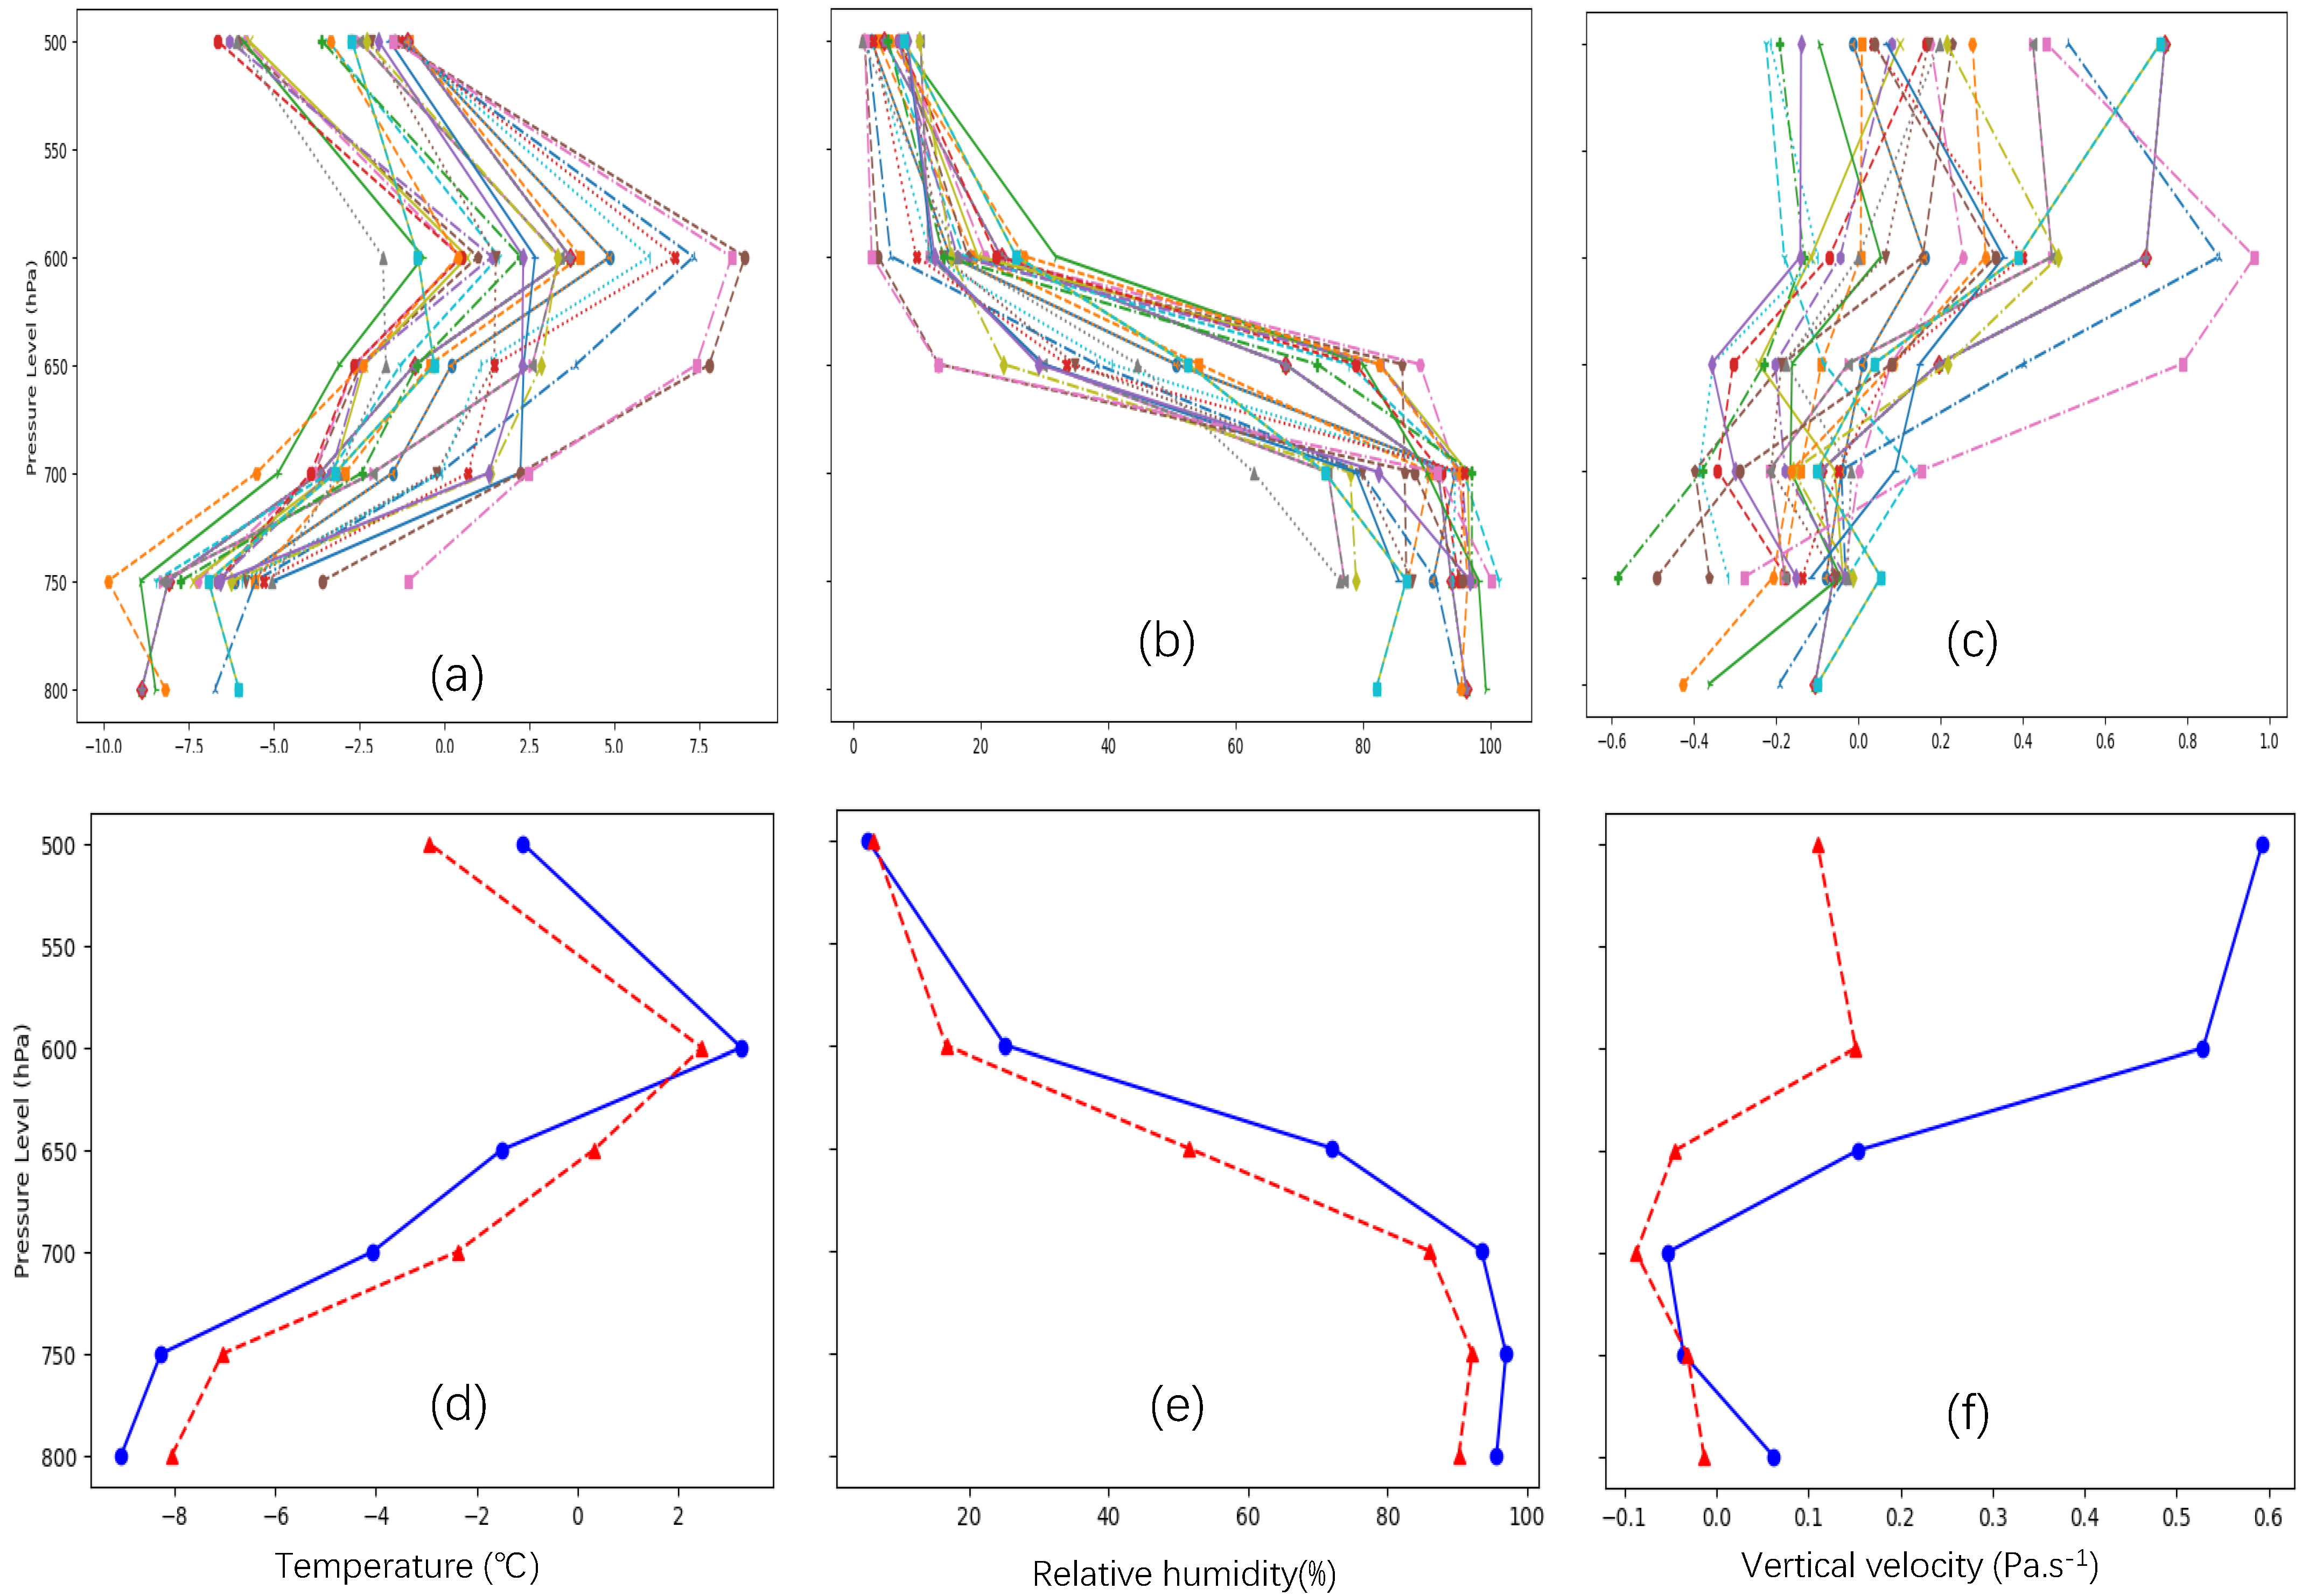
3.3. Multilevel Element Analysis

Since the differences in meteorological elements between the icing accretion and deicing stages are more pronounced, this section will analyze these differences between icing accumulation and deicing stages to address the icing accumulation conditions mainly (Figure 2 and Figure 3). For those with precipitation (Figure 2a–c), significant differences in 3-h air temperature variation are observed at and above 600 hPa. Specifically, temperatures increase at 600 hPa, corresponding to icing accumulation. Regional differences in 3-h height variations are also notable: Heights below 700 hPa decrease significantly, while those above 700 hPa increase markedly during icing accumulation. Relative vorticity anomalies at all levels differ significantly between the two stages. Icing accumulation is associated with positive relative vorticity anomalies at levels of 850–600 hPa and negative anomalies above. The mid-troposphere exhibits anomalous southerly winds, abnormally high relative humidity, and positive potential vorticity anomalies in the middle and lower troposphere in icing accumulation (Figure 3a–c). For icing accumulation/deicing without precipitation (Figure 2d–f), temperature changes at mid-tropospheric levels show insignificant differences between the two stages. Icing accumulation exhibits a height decrease in comparison with deicing. Relative vorticity differences between accumulation and deicing are only notable at 200 hPa and 700 hPa. During icing accumulation, positive relative vorticity anomalies occurred at low levels. Significant differences are also seen in relative humidity and meridional wind at 600 hPa. Icing accumulation is associated with higher relative humidity and anomalous southerly winds. Potential vorticity differences at 700 hPa are pronounced, with larger values during accumulation (Figure 3d–f).
As we know, icing accumulation with rainfall needs ascending motion and enough moisture. Here, the positive vorticity/potential vorticity at lower levels, while opposite at higher levels, prevails for ascending motion. The southerly wind anomalies with high relative humidity at the middle level are helpful for the moisture accumulation. The temperature increases obviously at 600 hPa with anomalous southwesterly winds, denoting a warm level aloft becoming stronger, which provides one of the most favorable conditions for ice accumulation. In icing accumulation without precipitation, the process involves rime ice or drizzle, accompanied by near-surface warming and moistening, negative relative vorticity/potential vorticity at low levels, indicating weaker moisture, and dynamic lifting conditions in comparison with those of precipitation-driven icing cases. The results show that most icing accumulation cases without rainfall are rime, not freezing drizzle. Since the formation of rime is greatly different from that of icing with rainfall, the rime-related cases of icing without rainfall for analysis in Figure 4 will be removed, then 23 icing accretion without precipitation cases are left.
The ice accretion with precipitation mostly corresponds to an intensifying warm layer at 600 hPa, southerly moisture transport at 700 hPa, negative relative vorticity above 500 hPa, and strengthening low pressure in the lower layers. The above analysis indicates that the atmospheric thermodynamic, dynamic, and moisture-related conditions are favorable for freezing rain formation during icing accumulation. Further analysis of accumulation cases (Figure 4) reveals that most samples exhibit an inversion layer (Figure 4a), primarily near 600 hPa. In some cases, temperatures aloft remain below 0 °C, indicating both freezing rain mechanisms coexist [14,15]. A humid layer with relative humidity exceeding 80% is present (Figure 4b), and positive vorticity/potential vorticity anomalies are observed at 700 hPa and 600 hPa (figures omitted), accompanied by vertical upward motion (Figure 4c). Notably, precipitation-driven accumulation exhibits stronger positive vorticity and potential vorticity anomalies than non-precipitation cases. This aligns with Chen et al.’s [32] findings, that is, the freezing rain regions feature a low-level inversion layer and a two-layer circulation pattern, where low-level ascent is suppressed by mid-level subsidence. The near-surface subsidence may relate to the influence of a high-pressure system after the stationary front passed. Further evidence confirms that thermodynamic, dynamic, and moisture conditions in precipitation-driven accumulation are more intense than those in non-precipitation cases (Figure 4d–f).

3.4. Circulation Pattern of Icing

The presence of temperature inversions, warm layers above 0 °C, humid layers with relative humidity exceeding 80%, and vertical upward motion in the regional atmosphere favors freezing rain formation. The maximum number of power line icing incidents during this event occurred on 18 December. Analyzing the synoptic systems on this day can not only reinforce the analysis of the synoptic conditions and weather systems responsible for icing, but also diagnose the specific weather patterns and system characteristics that led to the ice accretion. On the surface map (Figure 5a), the frontal line is positioned over eastern Yunnan. Since 2 m temperatures remain below 0 °C mainly over northeastern Yunnan, icing primarily occurred in the Northeastern high-altitude regions above 850 hPa, which can also be seen in Figure 4a, with most cases above 850 hPa. Figure 5b shows that cold advection from the north converges with warm advection from the south over northeastern Yunnan. Southerly winds reach jet-stream intensity, and relative humidity exceeds 80% across most of northwestern Yunnan at 750 hPa, with a positive relative vorticity center located over northwestern Yunnan at 700 hPa. Most regions experience upward motion, particularly in northeastern Yunnan (Figure 5c). At 600 hPa, most of Yunnan is controlled by a warm zone (>0 °C), with the isotherm line of 0 °C shifting slightly southward compared to the previous day (18:00 on 17 December 2023). This indicates a broader warm layer at 600 hPa during the peak icing period (Figure 5d). At 500 hPa, a high ridge is over central and western Eurasia, with a transverse trough over Mongolia south to Lake Baikal. The Western Pacific subtropical high ridge extends southward to the area of 20 °N. The northerly flow in front of the high ridge over the plateau facilitates the eastward and southward movement of cold air accumulated in the transverse trough, impacting Yunnan Province. The analysis confirms that the presence of temperature inversions, warm layers above 0 °C at 600 hPa, wet layers with relative humidity exceeding 80% at lower levels, and vertical upward motion with positive vorticity over the regional atmosphere favors freezing rain formation.

4. Summary and Discussion

Through using composite analysis to test the significance of differences in element variations across different stages, the features of multilevel elements of icing accumulation with/without precipitation over Northeastern Yunnan Province between different stages are analyzed separately. The main conclusions are as follows:
Icing types during different stages are different. During the initial stage of cold air intrusion, the icing process occurs when temperatures are not yet very low, resulting in snow accumulation (i.e., GG is present). As temperatures continue to drop, the accumulated snow freezes or icing from freezing rain develops, with DG being the primary type. When the stationary front retreats eastward, temperatures rise in the ice-covered areas of Northeastern Yunnan with rainfall decrease, leading to rapid ice melting, especially in those regions with low humidity (i.e., GD). When a quasi-stationary front swings east–west, daytime melting and nighttime freezing will occur, leading to the coexistence of DG, GG, and GD icing processes. Hence, the accumulation stage is dominated by DG and GG ice types. DG and GD ice types dominate in the deicing stage.
Distinct features of meteorological elements appear across icing stages. During icing accumulation, atmospheric thermodynamic, dynamic, and moisture conditions favor freezing rain formation. Key features include temperature inversion layers, an intensifying warm layer at 600 hPa, southerly moisture transportation at 700 hPa with relative humidity > 80%, positive relative vorticity and potential vorticity anomalies at low levels, and upward motion. This indicates that dynamic, thermal, and moisture conditions favor ice accretion under lower temperatures with precipitation. For ice accretion without precipitation, there are weaker moisture and dynamic lifting conditions in comparison with those of precipitation-driven icing cases.
Synoptic systems driving this process are a high ridge over the plateau and the transverse trough south of Lake Baikal, a low-pressure trough at low level, and a surface cold front. The transverse trough south of Lake Baikal facilitates cold air accumulating and then invading southward. The southerly wind in the middle and lower troposphere promotes the formation of a warm layer (above 0 °C) and a moist layer, while positive relative vorticity, potential vorticity, and surface frontal zones provide favorable dynamic lifting conditions.
The findings of this paper, on the one hand, provide an analytical approach for multiple meteorological elements and their evolution. At the same time, the classified freezing types and meteorological condition evolution characteristics during different stages based on the presence or absence of precipitation are examined. This study not only analyzes the characteristics of meteorological elements but also examines their evolution and vertical distribution of multiple elements. The results can serve as a basis for early warning and prediction of ice accretion, thereby preventing losses caused by disaster events.
The icing event involved all types of ice accumulation, characterized as a mixed icing regime combining freezing rain and fog-related processes, with two distinct freezing rain mechanisms present. The low surface-layer temperature with a warm layer aloft and supercool raindrops are the direct factors for freezing [5], but a warm layer at 600 hPa (for example) in the process might be one of the local conditions. The regional freezing rain circulation patterns exhibit localized features, being persistent for mid-to-high latitude high ridge accompanying inverse trough patterns. Therefore, understanding the synoptic-scale circulation patterns associated with regional freezing rain events can enhance predictive capabilities and improve response with effective mitigation strategies. Eastern and Northern Yunnan serve as critical pathways for Siberian cold air intrusions into Northeastern Yunnan Province [36,37]. During winter and spring, the oscillating Kunming stationary front brings frequent overcast and rainy weather, leading to power line icing [33]. Moreover, situated on the Yunnan-Guizhou Plateau with complex terrain, Yunnan’s icing types and formation mechanisms are significantly influenced by the local topography and elevation variations, which have not been detected but have been shown to be easier for icing in this context. This complexity necessitates high-resolution spatiotemporal observational cases for further analysis.

Author Contributions

Conceptualization, H.W. and G.T.; methodology, G.T. and R.Z.; software, G.L. and G.T.; resources, H.W., R.Z. and G.T.; data curation, G.T. and G.L.; writing—original draft preparation, H.W. and G.T.; writing—review and editing, G.T.; funding acquisition, R.Z. All authors have read and agreed to the published version of the manuscript.

Funding

This research was funded by the National Natural Science Foundation of China (41775073; U1902209); the Science and Technology Project of Southern Power Grid (YNKJXM20222431); and the Shandong Provincial Department of Industry and Information Technology Project (202350100877).

Institutional Review Board Statement

Not applicable.

Informed Consent Statement

Not applicable.

Data Availability Statement

The original contributions presented in this study are included in the article. Further inquiries can be directed to the corresponding author.

Acknowledgments

This work was supported by scientific and technological program of China Southern Power Grid (YNKJXM20222431).

Conflicts of Interest

Authors Hongwu Wang, Ruidong Zheng and Gang Luo were employed by the company Yunnan Power Grid Co., Ltd. Transmission Branch. The remaining authors declare that the research was conducted in the absence of any commercial or financial relationships that could be construed as a potential conflict of interest.

References

  1. Farzaneh, M.A.; Volat, C.; Leblond, A. Atmospheric Icing of Power Networks; Springer: Berlin/Heidelberg, Germany, 2008. [Google Scholar]
  2. Zhou, Y.; Lv, J.; Gao, Z.; Zhou, L. Study on the macro and micro characteristics of large-scale freezing rain weather in Hubei Province. Torrential Rain Disasters 2024, 43, 458–468. (In Chinese) [Google Scholar]
  3. Wang, X.; Lu, Y.; Zhang, X.; Yang, L.; Wu, H. Research on risk forecast of transmission lines icing in northern Hebei Province. J. Arid. Meteorol. 2020, 38, 164–168. (In Chinese) [Google Scholar]
  4. Li, Q.; Meng, J.; Li, J.; Liu, Y.; Chang, Q.; Jiang, M.; Guo, D. Spatial distribution and division of wire icing thickness under different return periods in Shanxi Province. J. Arid Meteorol. 2022, 40, 156–165. (In Chinese) [Google Scholar]
  5. Zhao, L.; Ma, Q.; Yang, G.; Wang, X.; Zhao, L.; Yang, X.; Wu, H.; Wang, Z.; Kang, Z.; Mao, D. Disasters and its impact of a severe snow storm and freezing rain over southern China in January 2008. Clim. Environ. Res. 2008, 13, 556–566. (In Chinese) [Google Scholar]
  6. Niu, S.; Zhou, Y.; Jia, R.; Yang, J.; Lü, J.; Ke, Y.; Yang, Z. The microphysics of ice accumulation wires: Observations and simulations. Sci. China Earth Sci. 2012, 55, 428–431. [Google Scholar] [CrossRef]
  7. Wang, T.; Niu, S.; Lü, J.; Zhou, Y. Observational study on the supercooled fog droplet spectrum distribution and icing accumulation mechanism in Lushan, Southeast China. Adv. Atmos. Sci. 2019, 36, 29–40. (In Chinese) [Google Scholar] [CrossRef]
  8. McQueen, H.R.; Keith, H.C. The ice storm of January 7–10, 1956 over the northeastern United States. Mon. Weather Rev. 1956, 84, 35–45. [Google Scholar] [CrossRef]
  9. Wagner, J.A. Mean temperature from 1000 MB to 500 MB as a predictor of precipitation type. Bull. Am. Meteorol. Soc. 1957, 38, 584–590. [Google Scholar] [CrossRef]
  10. Zhao, S.; Sun, J. Multi-scale systems and conceptual model on freezing rain and snow storm over southern China during January–February 2008. Clim. Environ. Res. 2008, 13, 351–367. (In Chinese) [Google Scholar]
  11. Wu, H.; Zhang, J.; Zhao, Z. Spatial-temporal distribution characteristic elements causing ice disaster in transmission wires in Hebei province. J. Arid. Meteorol. 2017, 35, 991–997. (In Chinese) [Google Scholar]
  12. Ren, M.; Li, Z.; Wang, B.; Tan, Y.; Wang, S. Analysis on the causes of freezing stage characteristics in Guizhou in winter of 2021/2022. Arid Meteorol. 2023, 41, 744–752. (In Chinese) [Google Scholar]
  13. Chu, Y.; Guo, F.; Gao, F.; Hu, P.; Zheng, L.; Liu, Y.; Lu, Y. Comparative analysis of two different types of severe convective processes under the influence of cold vortex. J. Arid. Meteorol. 2023, 41, 279–289. (In Chinese) [Google Scholar] [CrossRef]
  14. Young, W.R. Freezing Precipitation in the Southeastern United States. Master’s Thesis, Texas A&M University, College Station, TX, USA, 1978. [Google Scholar]
  15. Huffman, G.J.; Norman, G.A. The supercooled warm rain process and the specification of freezing precipitation. Mon. Weather Rev. 1988, 117, 2172–2182. [Google Scholar] [CrossRef]
  16. Rauber, R.M.; Olthoff, L.S.; Ramamurthy, M.K.; Kunkle, K.E. The relative importance of warm rain and melting processes in freezing precipitation events. J. Appl. Meteorol. 2000, 39, 1185–1195. [Google Scholar] [CrossRef]
  17. Zhuang, W.; Zhang, H.; Zhao, H.; Wu, S.; Wan, M. Review of the research for powerline icing prediction. Adv. Meteorol. Sci. Technol. 2017, 7, 6–12+19. (In Chinese) [Google Scholar]
  18. You, Q.; Jia, X.; Qu, X.; Zhao, Z.; Wang, J.; Yang, L. Simulation and diagnosis of a continuous icing event on ultra-high voltage transmission lines in Hebei Province. Meteorol. Technol. 2023, 6, 888–897. (In Chinese) [Google Scholar]
  19. Yan, X.; Wu, Z.; Gu, S. Analyses on the space-time distribution characteristics and their influencing factors of freezing rain in Guizhou Province. Plateau Meteorol. 2009, 28, 694–701. (In Chinese) [Google Scholar]
  20. Kong, F.; Fang, J.; Qiao, F.; Wang, R. Temporal and spatial variation characteristics of intensity and frequency of hourly extreme precipitation in China from 1961 to 2013. Resour. Environ. Yangtze Basin 2019, 28, 3051–3067. (In Chinese) [Google Scholar]
  21. Tao, Y.; Li, H.; Liu, W. Characteristics of atmospheric stratification and cloud physics of different types of freezing rain over southern China. Plateau Meteorol. 2013, 32, 501–518. (In Chinese) [Google Scholar]
  22. Zong, Z.; Ma, J.; Zhang, H.; Hua, C. Analysis on the spatial-temporal characteristics of freezing rain in recent decades. Meteorology 2013, 39, 813–820. (In Chinese) [Google Scholar]
  23. Stewart, R.E.; Theriault, J.M.; Henson, W. On the characteristics of and processes producing winter precipitation types near 0 °C. Bull. Am. Meteorol. Soc. 2015, 96, 623–639. [Google Scholar] [CrossRef]
  24. Tao, S.Y.; Wei, J. Severe snow and freezing-rain in January 2008 in southern China. Clim. Environ. Res. 2008, 13, 337–350. (In Chinese) [Google Scholar]
  25. Coleman, H.; Marwitz, J. Thermodynamic and kinematic structure of a snowband and freezing rain event during STORM-FEST. Weather Forecast. 2022, 17, 27–46. [Google Scholar] [CrossRef]
  26. Bernstein, B.C. Regional and local influences on freezing drizzle, freezing rain, and ice pellet events. Weather. Forecast. 2000, 15, 485–508. [Google Scholar] [CrossRef]
  27. Gao, S.; Zhang, X.; Wang, J.; Du, X.; Deng, D. The environmental field and ensemble forecast method for the formation of freezing rain over Guizhou Province. Chin. J. Atmos. Sci. 2014, 38, 645–655. (In Chinese) [Google Scholar]
  28. Du, X.; Gao, S.; Peng, F. Study of the 2011 freezing rain and snow storm in Guizhou. Chin. J. Atmos. Sci. 2014, 38, 61–72. (In Chinese) [Google Scholar]
  29. Du, X.; Peng, F.; Wu, W. Distribution and cause on frequent freezing rain zone in Guizhou. Meteorol. Monogr. 2010, 36, 92–97. (In Chinese) [Google Scholar]
  30. Deng, D.; Gao, S.; Du, X.; Wu, W. A diagnostic study of freezing rain over Guizhou, China, in January 2011. Q. J. R. Meteorol. Soc. 2012, 138, 1233–1244. [Google Scholar] [CrossRef]
  31. Wang, Q.; Zhang, H.; Zong, L.; Su, H.; Yang, Y.; Gao, Z. Synoptic cause of a continuous conductor icing event on ultra-high-voltage transmission lines in northern Guangxi in 2015. J. Trop. Meteorol. 2021, 37, 579–589. (In Chinese) [Google Scholar]
  32. Chen, Y.; Zhou, Y.; Yang, S.; Ran, L.; Yan, L. Analysis of circulation characteristics and precipitation phase difference during an extreme freezing rain and snow weather event in Southwest China. Chin. J. Atmos. Sci. 2024, 48, 417–430. (In Chinese) [Google Scholar]
  33. Li, L.; Xi, X.; Li, Z.; Wang, X.; Weng, Q.; Li, Q.; Zhou, K.; Liu, Y.; Yao, J. Micro-meteorological analysis and prediction technology for transmission lines in micro-terrain environments. China Electr. Power 2023, 53, 76–83. (In Chinese) [Google Scholar]
  34. Liu, C.; Han, Y.; Wang, J.; Zhang, Z. Studies on statistics and formation mechanism of freezing rain. J. Catastrophol. 2015, 30, 219–222. (In Chinese) [Google Scholar]
  35. Yan, H.; Wang, L.; Zhu, Y.; Liang, H.; Huang, W. Cause Analyses of Severe Cold and Snowy Weather Formation in Yunnan in Early 2008. Plateau Meteorol. 2009, 28, 870–879. (In Chinese) [Google Scholar]
  36. Yan, H.; Kong, X.; Zi, Y.; Shu, K. Analysis of extreme cold event in 1924 February 2022 in Yunnan Province. Meteorol. Monogr. 2023, 49, 1029–1044. (In Chinese) [Google Scholar]
  37. Yan, H.; Li, G.; Yuan, Y.; Yao, Y. Atmospheric circulation difference between warm in early winter and cold in late winter of 2021/2022 over East Asia continent and its causes. Chin. J. Geophys. 2023, 66, 4026–4044. (In Chinese) [Google Scholar]
  38. Yan, H.; Wang, L.; Jin, Y.; Ma, S.; Li, W.; Wan, Y. Dominant patterns of winter temperature variation in Yunnan and key circulation factors affecting them. Plateau Meteorol. 2023, 42, 386–402. (In Chinese) [Google Scholar] [CrossRef]
  39. Liu, H.; Li, Z.; Tang, L.; Tang, J.; Su, T.; Yao, R. Circulation characteristics and causes of extreme low temperature and blizzard in Hunan in December 2018. Torrential Rain Disasters 2020, 39, 487–495. (In Chinese) [Google Scholar]
  40. Hersbach, H.; Bell, B.; Berrisford, P.; Hirahara, S.; Horányi, A.; Muñoz-Sabater, J.; Nicolas, J.; Peubey, C.; Radu, R.; Schepers, D.; et al. The ERA5 global reanalysis. Q. J. R. Meteorol. Soc. 2020, 146, 1999–2049. [Google Scholar] [CrossRef]
  41. Chen, B.; Yang, F.; Peng, F. Characteristics of the freezing disaster and its weather causes. J. Nat. Disasters 2020, 10, 88–95. (In Chinese) [Google Scholar]
Figure 1. Overview of the process. (a) Precipitation, units: mm. (b) Freezing power lines in Yunnan during 16–23 December 2023.
Atmosphere 16 00884 g001
Figure 2. Composite multilevel temperature and geopotential height variation in the past 3 h and relative vorticity anomalies during ice accumulation/decreasing phases under the condition of freezing with (ac)/without (df) precipitation. (Bars with solid borders denote t-test values with confidence level exceeding 95%).
Atmosphere 16 00884 g002
Figure 3. Composite multilevel relative humidity, meridional wind, and potential vorticity during ice accumulation/decreasing phases under the condition of freezing with (ac)/without (df) precipitation. (Bars with solid borders denote t-test values with confidence level exceeding 95%).
Atmosphere 16 00884 g003
Figure 4. Vertical distribution of elements for ice-accumulation events. (ac) Temperature, relative humidity, and vertical wind speed. (df) The composite temperature, relative humidity, and vertical wind speed for the cases with (real lines) and without (dashed lines) precipitation.
Atmosphere 16 00884 g004
Figure 5. Circulation fields of 18 December 2023. (a) Sea level pressure (real lines, units: mb) and 2 m temperature (dashed lines, units: °C); (b) winds at 700 hPa (vectors, units: m/s) and relative humidity (shaded, units: %) at 750 hPa; (c) relative vorticity (real lines, units: 10−5 s−1) and vertical wind speeds (shaded, units: 10−2 Pas−1) at 700 hPa; (d) geopotential heights at 500 hPa (real lines, units: dgpm) and temperature at 600 hPa (shaded areas denote those values larger than 0 °C, the dashed line of 0 °C is of the temperature the day before at 17 December).
Atmosphere 16 00884 g005
Table 1. Number of freezing-type events in northeastern Yunnan during 16–23 December 2023.
Ice IncreaseIce MaintenanceIce Decrease
With precipitationGG1344
GD2217
DD000
DG15106
without precipitationGG1511
GD11134
DD110
DG341911
Disclaimer/Publisher’s Note: The statements, opinions and data contained in all publications are solely those of the individual author(s) and contributor(s) and not of MDPI and/or the editor(s). MDPI and/or the editor(s) disclaim responsibility for any injury to people or property resulting from any ideas, methods, instructions or products referred to in the content.

