Article

Ozone Pollution Impairs Athletic Performance in Female Football Players: A Gender-Specific Analysis

1
Division of Sports Science and Physical Education, Tsinghua University, Beijing 100084, China
2
Department of Building Environment and Energy Engineering, School of Civil and Resources Engineering, University of Science and Technology Beijing, Beijing 100083, China
3
National Institute of Sports Medicine, Beijing 100061, China
*
Authors to whom correspondence should be addressed.
These authors contributed equally to this work.
Atmosphere 2025, 16(7), 834; https://doi.org/10.3390/atmos16070834
Submission received: 22 May 2025 / Revised: 23 June 2025 / Accepted: 6 July 2025 / Published: 9 July 2025
(This article belongs to the Section Air Quality and Health)

Abstract

There have been some studies investigating the effects of air pollutants on male football players, but few have examined the gender-specific impact of air pollution on the athletic performance of female football players. This research gap limits the development of tailored training and competition strategies. Here, generalized mixed modeling was employed to assess the effects of main ambient air pollutants, i.e., particulate matter less than 2.5 μm (PM2.5), ozone (O3), sulfur dioxide (SO2), nitrogen dioxide (NO2), and carbon monoxide (CO), on athletic performance indicators (total movement distance (TMD), jogging distance (JD), and walking distance (WD)) among 14 female football players during 16 matches in the 2020 season of the Chinese Football Association Women’s Super League. Our findings indicate a significant negative association between the O3 concentration and athletic performance, with fixed effect coefficients of −22.426 ± 8.889 for TMD, −10.817 ± 3.697 for JD, and −6.943 ± 3.265 for WD. The NO2 concentration was significantly correlated with both TMD and JD, while PM2.5, SO2, and CO concentrations had minimal or negligible effects. Additionally, aerobic fitness was reduced as the O3 concentration increased. These results provide valuable insights for optimizing gender-specific training and competition strategies under varying air quality conditions, offering a basis for more targeted health and performance interventions in professional female football players.

1. Introduction

Over the past few decades, rapid urbanization and economic development have significantly contributed to the deterioration of ambient air quality, especially in developing countries like China. Increased motor vehicle usage and fossil fuel combustion have intensified air pollution levels, posing a serious threat to environmental sustainability and public health [1,2,3,4]. According to a report by the World Health Organization (WHO), more than 80% of urban residents are exposed to harmful air pollutants [5], posing significant challenges to public health [6]. Existing research has demonstrated that short-term exposure to air pollutants can elevate the likelihood of various respiratory conditions, including Chronic Obstructive Pulmonary Disease (COPD), respiratory difficulties, Respiratory Tract Infections (RTIs), persistent coughing, and acute asthma exacerbations [5,6,7,8]. For instance, in well-trained endurance athletes, ozone exposure limits cardiopulmonary function during maximal cycling exercise [9]. Although an ozone concentration exceeding 60 ppb is generally considered a threshold for potential respiratory system damage in healthy adults [10,11,12], the literature presents conflicting evidence regarding the health risks associated with ozone exposure. Some epidemiological studies have identified adverse impacts on lung function when ozone concentrations exceed 60 ppb [13,14,15]. According to the WHO, over 80% of urban residents worldwide are exposed to air quality levels that exceed the recommended safety limits. In response to emerging evidence, the WHO updated its Global Air Quality Guidelines in 2021, lowering the 8 h average ozone (O3) concentration threshold to 100 μg/m3 [16]. In contrast, China’s National Ambient Air Quality Standards (GB 3095–2012) still set a more lenient limit of 200 μg/m3 for a 1 h average O3 concentration [17]. However, there remains a lack of universally accepted air quality thresholds, highlighting an urgent need for standardized recommendations.
Athletes, particularly those participating in high-intensity outdoor sports like football, are uniquely vulnerable to the adverse effects of air pollution [18,19]. During exercise, increased pulmonary ventilation leads to the greater inhalation of airborne pollutants, which can exacerbate oxidative stress, reduce oxygen uptake, and impair both cardiovascular and respiratory function [20,21,22,23,24,25]. Several studies have investigated the influences of air pollutants on performance among football players. Elevated concentrations of PM10 and O3 were significantly associated with total running distance (p < 0.0001) in elite teenage football players on the national U19 team during the 2018–2019 season. Additionally, increased levels of O3 and NO2 were shown to induce abnormal increases in heart rate (p < 0.05) [18]. Furthermore, a study evaluating the athletic performance of 799 professional players from the German Bundesliga between 2016 and 2022 revealed a negative correlation between technical performance (including decreased sprint time, difficulty in changing direction, and deterioration in velocity and accuracy) and levels of PM10 and O3 [26]. In line with these findings, inhalable particulate matter pollutants have been found to adversely affect the cardiopulmonary and respiratory systems of outdoor soccer players [27]. Moreover, research examining the direct effects of air pollution on athletic performance in football players demonstrated that for every 1% increase in air pollutant concentration, the number of successful passes during a match decreased by 0.101% [28]. In addition to the impact of ambient air quality on the physical performance of football athletes, a recent study highlighted a significant decline in cognitive skills, such as passing accuracy and foul frequency, due to air pollution [29].
Despite growing interest in this field, existing research has primarily focused on male athletes or mixed-gender cohorts. To date, very few studies have specifically addressed how female football players may respond to air pollution exposure. This is a critical knowledge gap, considering well-documented physiological differences such as smaller lung volumes, lower hemoglobin levels, and distinct hormonal profiles that could modulate the impact of pollutants [30]. On average, males have larger absolute lung volumes than females, with male athletes often exhibiting lung volumes exceeding 6 L, compared to approximately 4 to 5 L in females [31]. Additionally, testosterone levels, which promote muscle mass and strength, are typically 20 to 30 times higher in males than in females [32]. These physiological disparities may result in distinct responses to air pollution’s effects on athletic performance. Understanding these differences is crucial for developing gender-specific health and performance strategies. However, there exists a lack of publicly available databases documenting match-by-match performance metrics of professional female players in relation to environmental exposure, making research in this area both necessary and challenging.
To address this gap in research, we conducted a correlation analysis based on the athletic performance of 14 professional female football players during 16 matches in the 2020 season of the Chinese Football Association Women’s Super League, examining the relationship between ambient air pollutants, environmental factors, and performance outcomes. Our findings contribute important preliminary evidence for developing gender-sensitive environmental health strategies in sports and highlight the need for establishing air quality thresholds for training and competition tailored to female athletes.

2. Materials and Methods
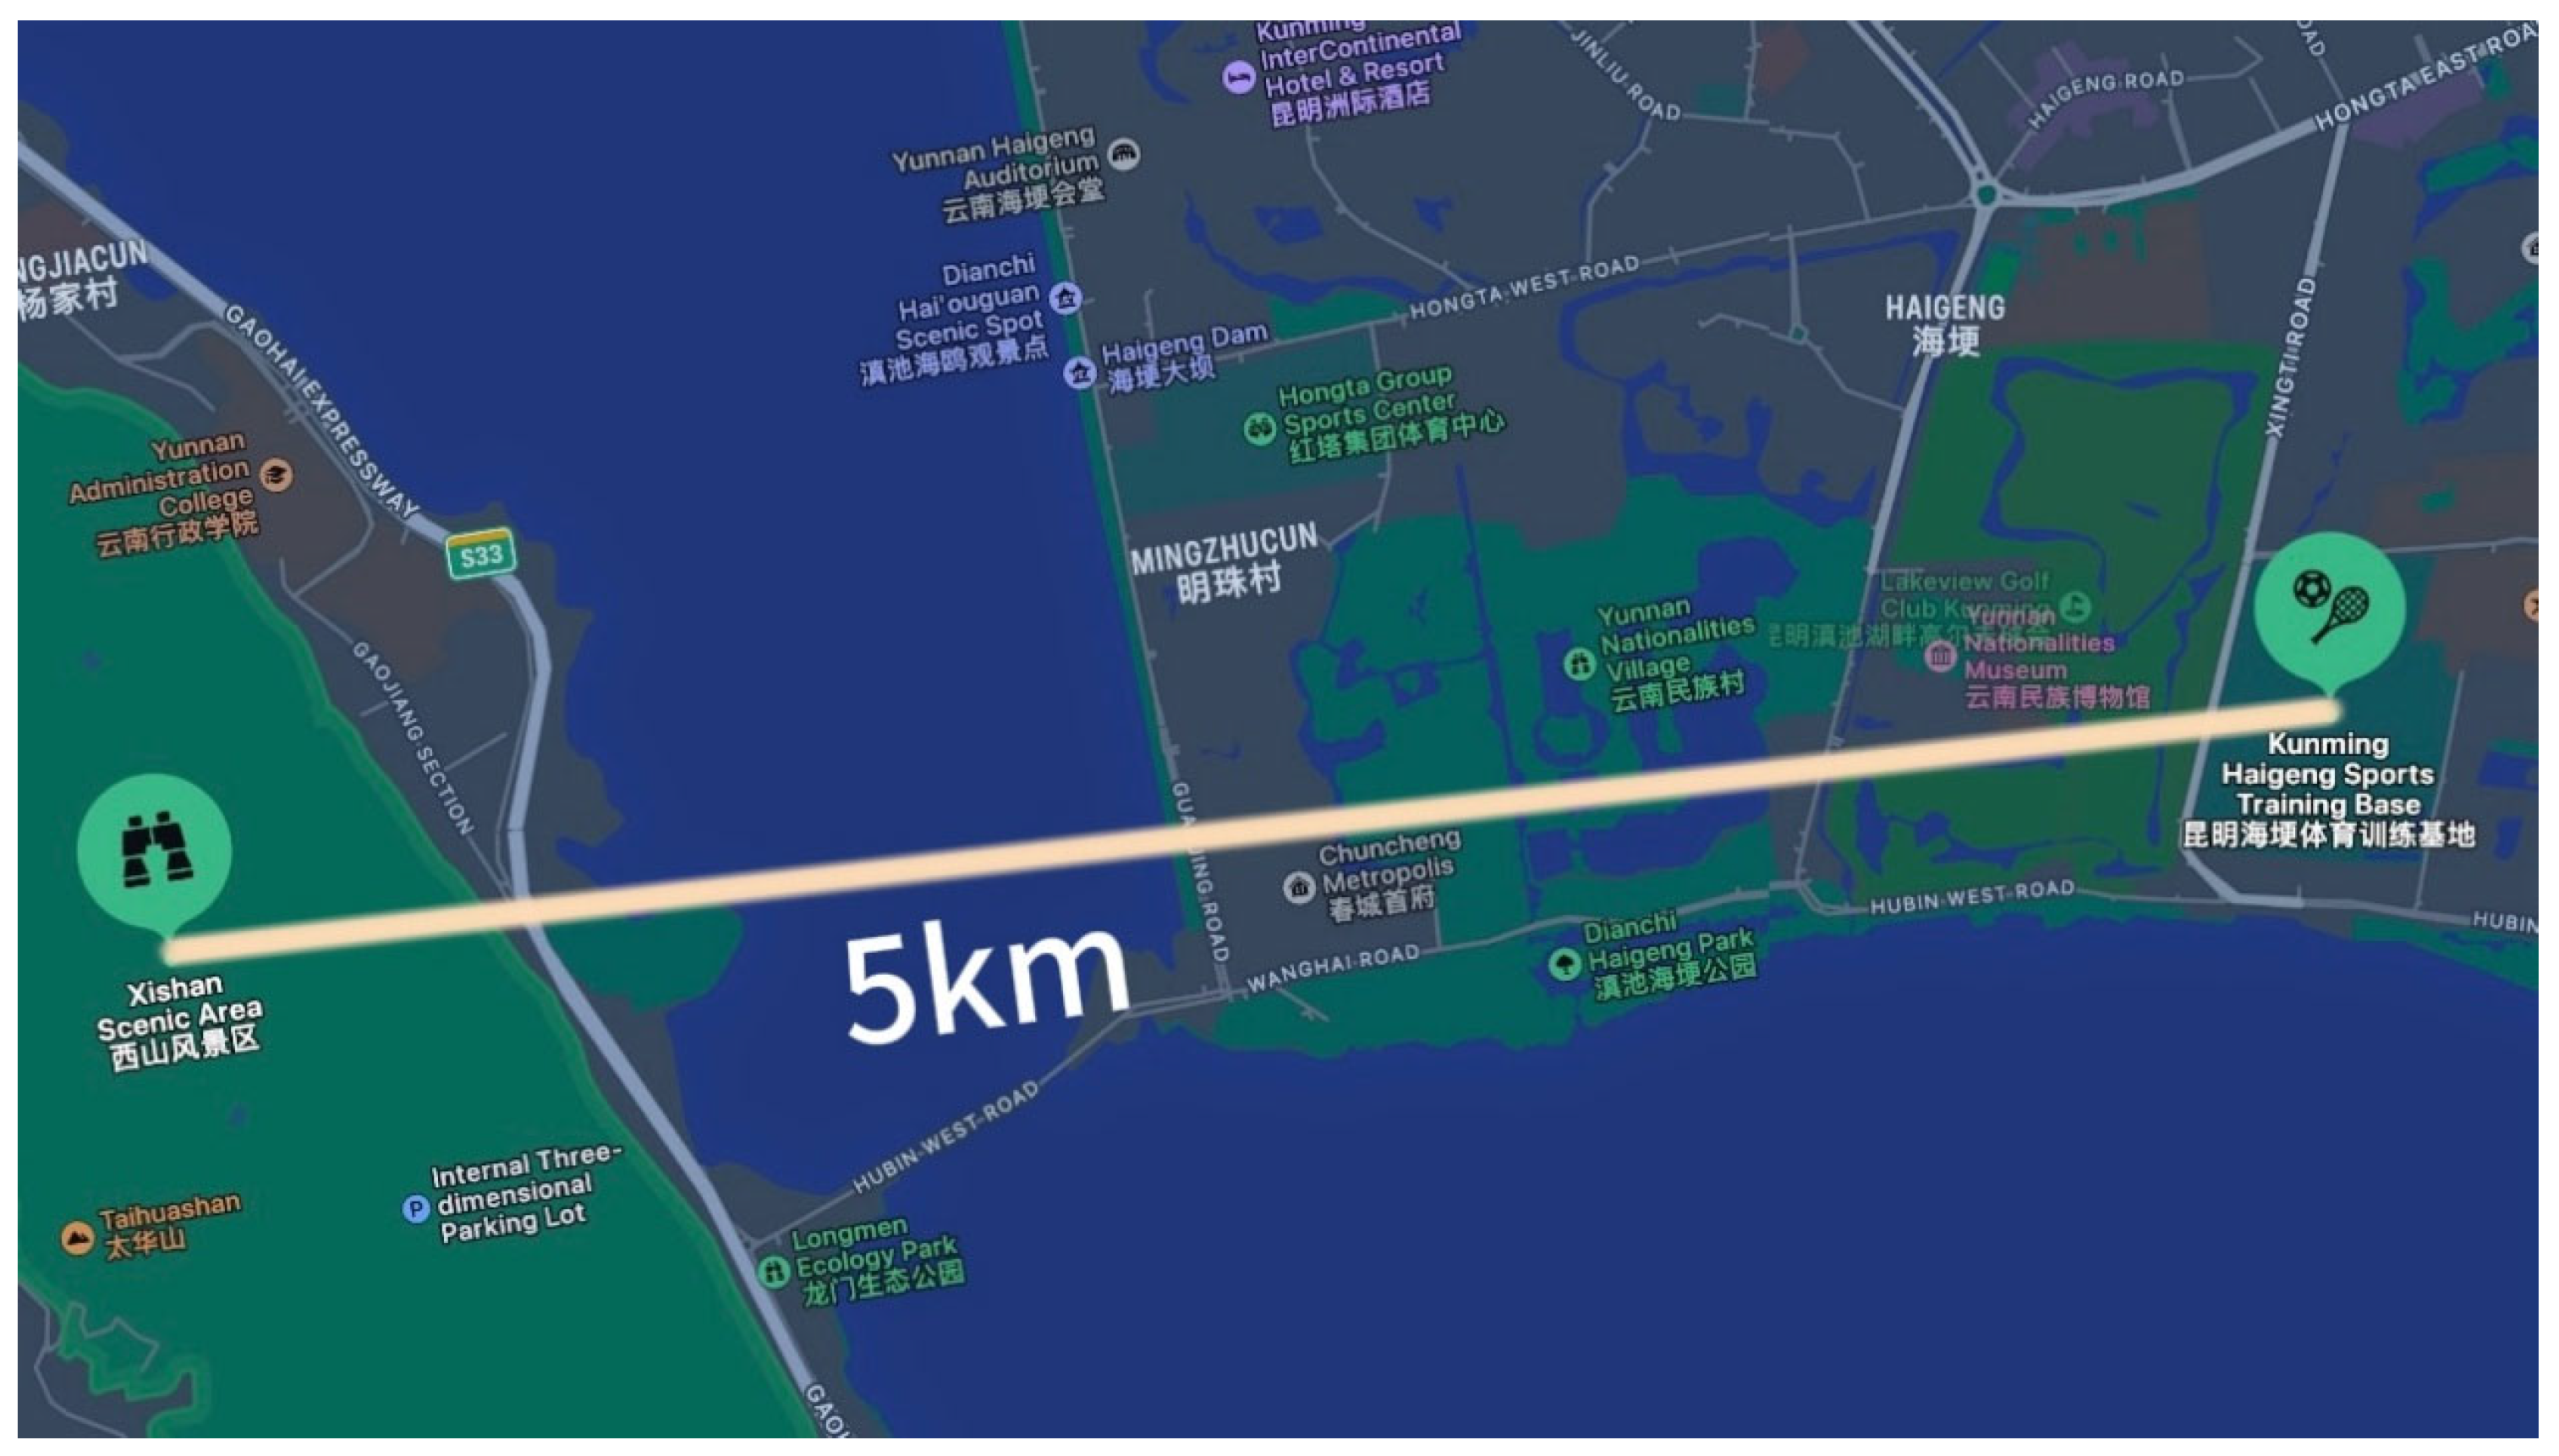
The match performance statistics of 14 female football players who participated in 16 matches during the 2020 season of the Chinese Football Association Women’s Super League were analyzed. The original data included information on the date, daily meteorological parameters, daily air quality data (the concentration of PM2.5, O3, SO2, NO2, and CO), basic athlete information, and daily sports performance data (total movement distance, jogging distance, and walking distance). The monitoring period spanned from 29 July 2020 to 11 October 2020. To assess the presence of lag effects, a correlation analysis was conducted between meteorological parameters and air pollutant concentrations on the first, second, and third days prior to match day, and athletic performance data during the competition.

2.1. Study Setting

To investigate the relationship between air pollution and sports performance, athletic data were collected from 14 female football players on the same team (goalkeepers were excluded), all of whom trained and competed outdoors. Detailed competition data were obtained based on the coach’s arrangement of player substitutions.

2.2. Data Collection

Air quality data for the match day of interest were extracted from the monitoring sites of the China National Environmental Monitoring Center (https://quotsoft.net/air/ (accsessed on 12 December, 2023)), which publishes public real-time data on the weather and air conditions. Environmental data from the monitoring station located at the shortest distance from the competition site were selected for analysis. A geographical view of the competition site and monitoring station is presented in Figure 1, with a straight line distance of less than 5 km between them. Additionally, mean values of environmental factors during the monitoring period were calculated for correlation analysis, including temperature, dew point, and concentration of PM2.5, O3, SO2, NO2, and CO.
Data regarding athletic physical condition, including height, weight, and body fat percentage, were collected and are listed in Supplementary Table S1.
Real-time athletic performance data, including total movement distance, jogging distance, and walking distance, were collected for each player on match days. Performance data were captured and recorded via multi-camera setups (Catapult S6, Catapult Sports, Melbourne, Australia). The system includes a compact, lightweight vest that comfortably holds a small device equipped with a high-precision GPS sensor and accelerometer to measure key metrics including acceleration, deceleration, total distance covered, and movement patterns. The GPS signal sampling rate was set at 10 Hz, with a positioning accuracy of ≤2 m. The three-axis accelerometer had a sampling frequency of 100 Hz, with a measurement range of ±16 G. The three-axis gyroscope measured angular velocity with a range of ±2000 degrees per second. The three-axis magnetometer operated at a frequency of 100 Hz. The optical heart rate sensor sampled at 1 Hz. Thresholds were set to differentiate between movement patterns, namely walking (≤6 km/h) and jogging (6 to 12 km/h), according to the Football Match Running Intensity Zones released by the Fédération Internationale de Football Association (FIFA). Detailed athletic performance statistics are provided in Supplementary Table S2. Competition data were sourced from the 2020 season of the Chinese Football Association Women’s Super League, as well as from friendly matches held near official matches at the Kunming Haigeng Sports Training Base in Yunnan Province, China. Information on the matches is listed in Supplementary Table S3. We performed a correlation analysis between 138 data points of athletic performance during the competition and the corresponding concentrations of air pollutants.
To investigate the potential lag effects of air quality on athletic performance, we collected environmental data and air pollutant concentrations from the monitoring stations of the China National Environmental Monitoring Center (CNEMC) for the first, second, and third days preceding each match. Detailed information on meteorological parameters and pollutant concentrations is presented in Supplementary Table S4. A correlation analysis was subsequently performed to evaluate these relationships.

2.3. Correlation Analysis

The Generalized Linear Mixed Model (GLMM) is a combination of the Generalized Linear Model (GLM) and the Random Effects Model, serving as an extension for modeling non-normally distributed data [33,34,35,36]. It links linear and nonlinear functions and thus is applicable to various types of response variables, including binomial and Poisson distributions. Its basic form can be expressed as follows:
Y = 1 i X i β i + Z b + ε
where Y represents the dependent variable, i represents the identifier for each fixed effect, X denotes the fixed effects, β indicates the parameters of the fixed effect factors, Z represents the design matrix of random effect factors, b denotes the parameters of the random effect factors, and ε represents the error term.
In this study, we adopted athletic performance (total movement distance, jogging distance, and walking distance) as dependent variable Y , taking meteorological parameters, air quality data, and basic athletic data as fixed effects X . Based on the exercise data from 14 athletes, a correlation analysis was conducted as the basis for repeated comparisons. Each data point includes the following parameters: athlete’s name, basic physical fitness information, competition date, meteorological conditions on the day of the competition, pollutant concentration levels, and athletic performance parameters. Ten fixed effect parameters were considered, each corresponding to a specific performance aspect. A total of 138 data points were collected for each type of performance. Three correlation analyses were performed using TMD, JD, and WD as dependent variables ( Y ). A Generalized Linear Mixed Model was applied to fit the 138 data points, yielding the estimated values ( β ) for the ten fixed effect parameters ( X ). Additionally, the analysis of correlation includes an assessment of whether each fixed effect coefficient is statistically significant (p < 0.05), to investigate the impact of each fixed effect on physical performance. The results of all correlation analyses are presented in Table 1.

2.4. Statistical Analysis

All variables were checked to verify their conformity with a normal distribution. Arithmetic means and standard deviation were calculated. ANOVA was used to compare mean values for the examined variables that follow normal distribution. The Mann–Whitney test was incorporated to analyze variables that do not follow normal distribution. A p-value of less than 0.05 is considered to be statistically significant (exact value is depicted in the figures). All statistical analyses were performed using the Origin 2024b software (OriginLab Corporation, Northampton, MA, USA).

3. Results

3.1. The Impact of Ambient Air Pollutants on the Athletic Performance

The analysis of the fixed effect coefficients for three types of athletic performance revealed that NO2 and O3 were statistically significant across different ambient air pollution paradigms. Figure 2 illustrates the effects of NO2 and O3 concentrations on performance-related variables. As depicted in the figure, the parameter of the fixed effect factors regarding O3 concentration is negative, indicating a detrimental correlation with athletic performance, which was considered irrelevant in previous studies [19]. Notably, our findings align with prior research suggesting that ozone is significantly associated with cardiovascular dysfunction [37], which may contribute to reduced athletic performance.
Most researchers identified ozone as the air pollutant with the most significant impact on athletic performance among various types of air pollutants [22]. Ozone has been shown to adversely affect the respiratory, nervous, and cardiac systems [31], thereby impairing athletic performance. A decrease in respiratory function among amateur male bicyclists after 75 min of high intensity training is correlated with ozone exposure, although coughing and eye irritation during exercise were found to be unrelated to the ozone concentration [23]. Similarly, another study focused on the fitness training of American lifeguards found that elevated concentrations of O3 and PM2.5 had profound adverse effects on respiratory function, particularly among females [24]. However, other studies have argued that there is minimal gender difference in lung function under the same exercise load and air pollutant concentrations [32]. As for professional athletes, psychological and subjective symptoms showed a significant decline in competitive endurance and respiratory function among high-level endurance athletes during simulated endurance competitions in a low-concentration O3 environment. This observation aligns with our findings that the ozone concentration is negatively associated with athletic performance (TMD, JD and WD) under a low-concentration level of O3 (81.039 ± 39.514 μg/m3), which is below the guidelines established by the WHO in 2021.
On the contrary, the NO2 concentration was found to be positively correlated with TMD and JD, but had no insignificant impact on WD. Notably, previous studies have reported that short-term exposure to normal levels of NO2 does not significantly impair respiratory function. However, a previous study reported that higher ambient concentrations of nitrogen dioxide can diminish athletic performance [30]. In our study, the air concentration of NO2 during the competition period (29 July 2020 to 11 October 2020) was 7.085 ± 2.255 μg/m3, much lower than the air quality standard set by China in 2012, which is 200 μg/m3 per hour. Table 2 provides a detailed description of the classification of pollutant concentrations in this paper according to the latest official guidance documents. For the minimal amount of nitrogen dioxide compared with the national standard, a positive correlation between athletic performance and the NO2 concentration was observed. However, the long-term effects of a low concentration of NO2 cannot be neglected as cumulative exposure, as low-level NO2 exposure could lead to subtle effects on respiratory efficiency [23], which may impact the physical performance of athletes. Therefore, future research could focus on examining the relationship between varying NO2 concentrations and athletic performance over different timescales.

3.2. Comparisons Between the Fixed Effects

Furthermore, as shown in Figure 3, we compared 10 fixed effects of environmental factors on three types of athletic performance. As for TMD and JD, temperature and NO2 and O3 concentration were found to be statistically significant. Meanwhile, WD was significantly influenced by temperature, body weight, fat percentage, and O3 concentration. Interestingly, among the performance variables significantly affected by the O3 concentration and temperature, a similar trend was observed, where the athletic performance of female football players was negatively associated with temperature. This finding aligns with previous reports [38], which suggest that elevated temperatures can increase O3 concentrations, thus impacting athletic performance, as observed in our study. Apart from environmental factors, body weight and fat percentage also significantly impacted athletic performance. Notably, a substantial reduction in performance was observed with an increase in body fat percentage. Consistent with our findings, other studies have reported that body weight and fat percentage can negatively affect endurance and reaction abilities, such as power output, acceleration, and change in direction in athletes [39,40].
However, the concentrations of PM2.5, SO2, and CO did not exhibit a significant impact on athletic performance, as shown in Figure 3. This finding contradicts previous studies [41,42,43], which may be attributed to the relatively good air quality and the relatively low concentration of corresponding air pollutants in the classification shown in Table 2. Consequently, the correlation analysis suggests that air pollutants at low concentration levels exert a limited effect on athletic performance.

3.3. Lag Effect

Furthermore, as shown in Figure 3, to investigate the lag effect, we conducted a correlation analysis between environmental factors (including air pollutants, i.e., NO2 and O3, for which the fixed effect coefficients are statistically significant.) on the match day, as well as one, two, and three days prior to the match, with the corresponding athletic performance. Statistically significant fixed effects are highlighted in color, as shown in Figure 4. For TMD and JD, both the NO2 and O3 concentrations demonstrated a statistically significant influence on athletic performance on the competition day. However, no similar trend was observed in the correlation analysis for the one, two, and three days preceding the match, suggesting the absence of a lag effect in the impact of air pollutants on athletic performance.

4. Discussion

Although several studies have focused on estimating the impacts of air pollution on male outdoor football players, limited research has incorporated female football players in such analyses. This gap has hindered the development of gender-specific training strategies and performance matching techniques. Our study addresses this gap by conducting a detailed analysis of the association between ambient air quality and the performance of professional female football players.
Our findings indicate that O3 is negatively correlated with athletic performance, while low-level increases in NO2 concentration can enhance total movement distance and jogging distance. These results suggest that physical match preparation—such as selecting optimal locations and time periods—could be strategically scheduled based on predictions of ambient air quality to maximize performance and minimize health risks for female football players.
Due to the relatively small pool of registered female football players in China, which includes only 6000 to 7000 registered female players under the age of 12, in stark contrast to over 2.2 million female youth football players in major developed countries such as the United States and Canada, the sample sizes in this study were relatively limited. However, to the best of our knowledge, there is currently a lack of published research that specifically examines the relationship between ambient air quality and athletic performance in professional female football players. While previous studies have investigated the impact of air pollution on general physical activity or endurance sports—such as running or cycling—these studies have primarily focused on male athletes or mixed-gender populations, and have rarely addressed sport-specific performance in female athletes. Athletic performance changes due to air pollution among female athletes, especially those who engage in antagonistic sports such as football, and this may vary compared with male athletes due to ventilation capability, as well as hormone level differences. Our study represents a pioneering effort to fill this critical gap by analyzing the association between short-term air pollutant exposure and match performance among professional female football players. This work not only contributes new evidence to the field of sports and environmental health, but also provides a methodological and conceptual foundation for future research involving female athletes across various levels and regions. In addition, pollutant emissions from sports fields may vary with soil type, vegetation type, and geographic location. Although prior studies indicate that these factors can influence pollutant levels, our study did not assess such variations due to limitations in sample size, funding, and competition regulations. The direct measurement of individual athletes’ exposure was also not feasible. Future research will address these gaps by including more diverse sites and real-time exposure assessments. Future studies with larger and detailed datasets, utilizing similar analytical methods, could further validate and expand upon these findings, enhancing their generalizability and comprehensiveness.

5. Conclusions

This study utilized official competition data from the 2020 season of the Chinese Football Association Women’s Super League to explore the relationship between ambient air pollutants and athletic performance in professional female football players. The key findings are summarized as follows:
(1)
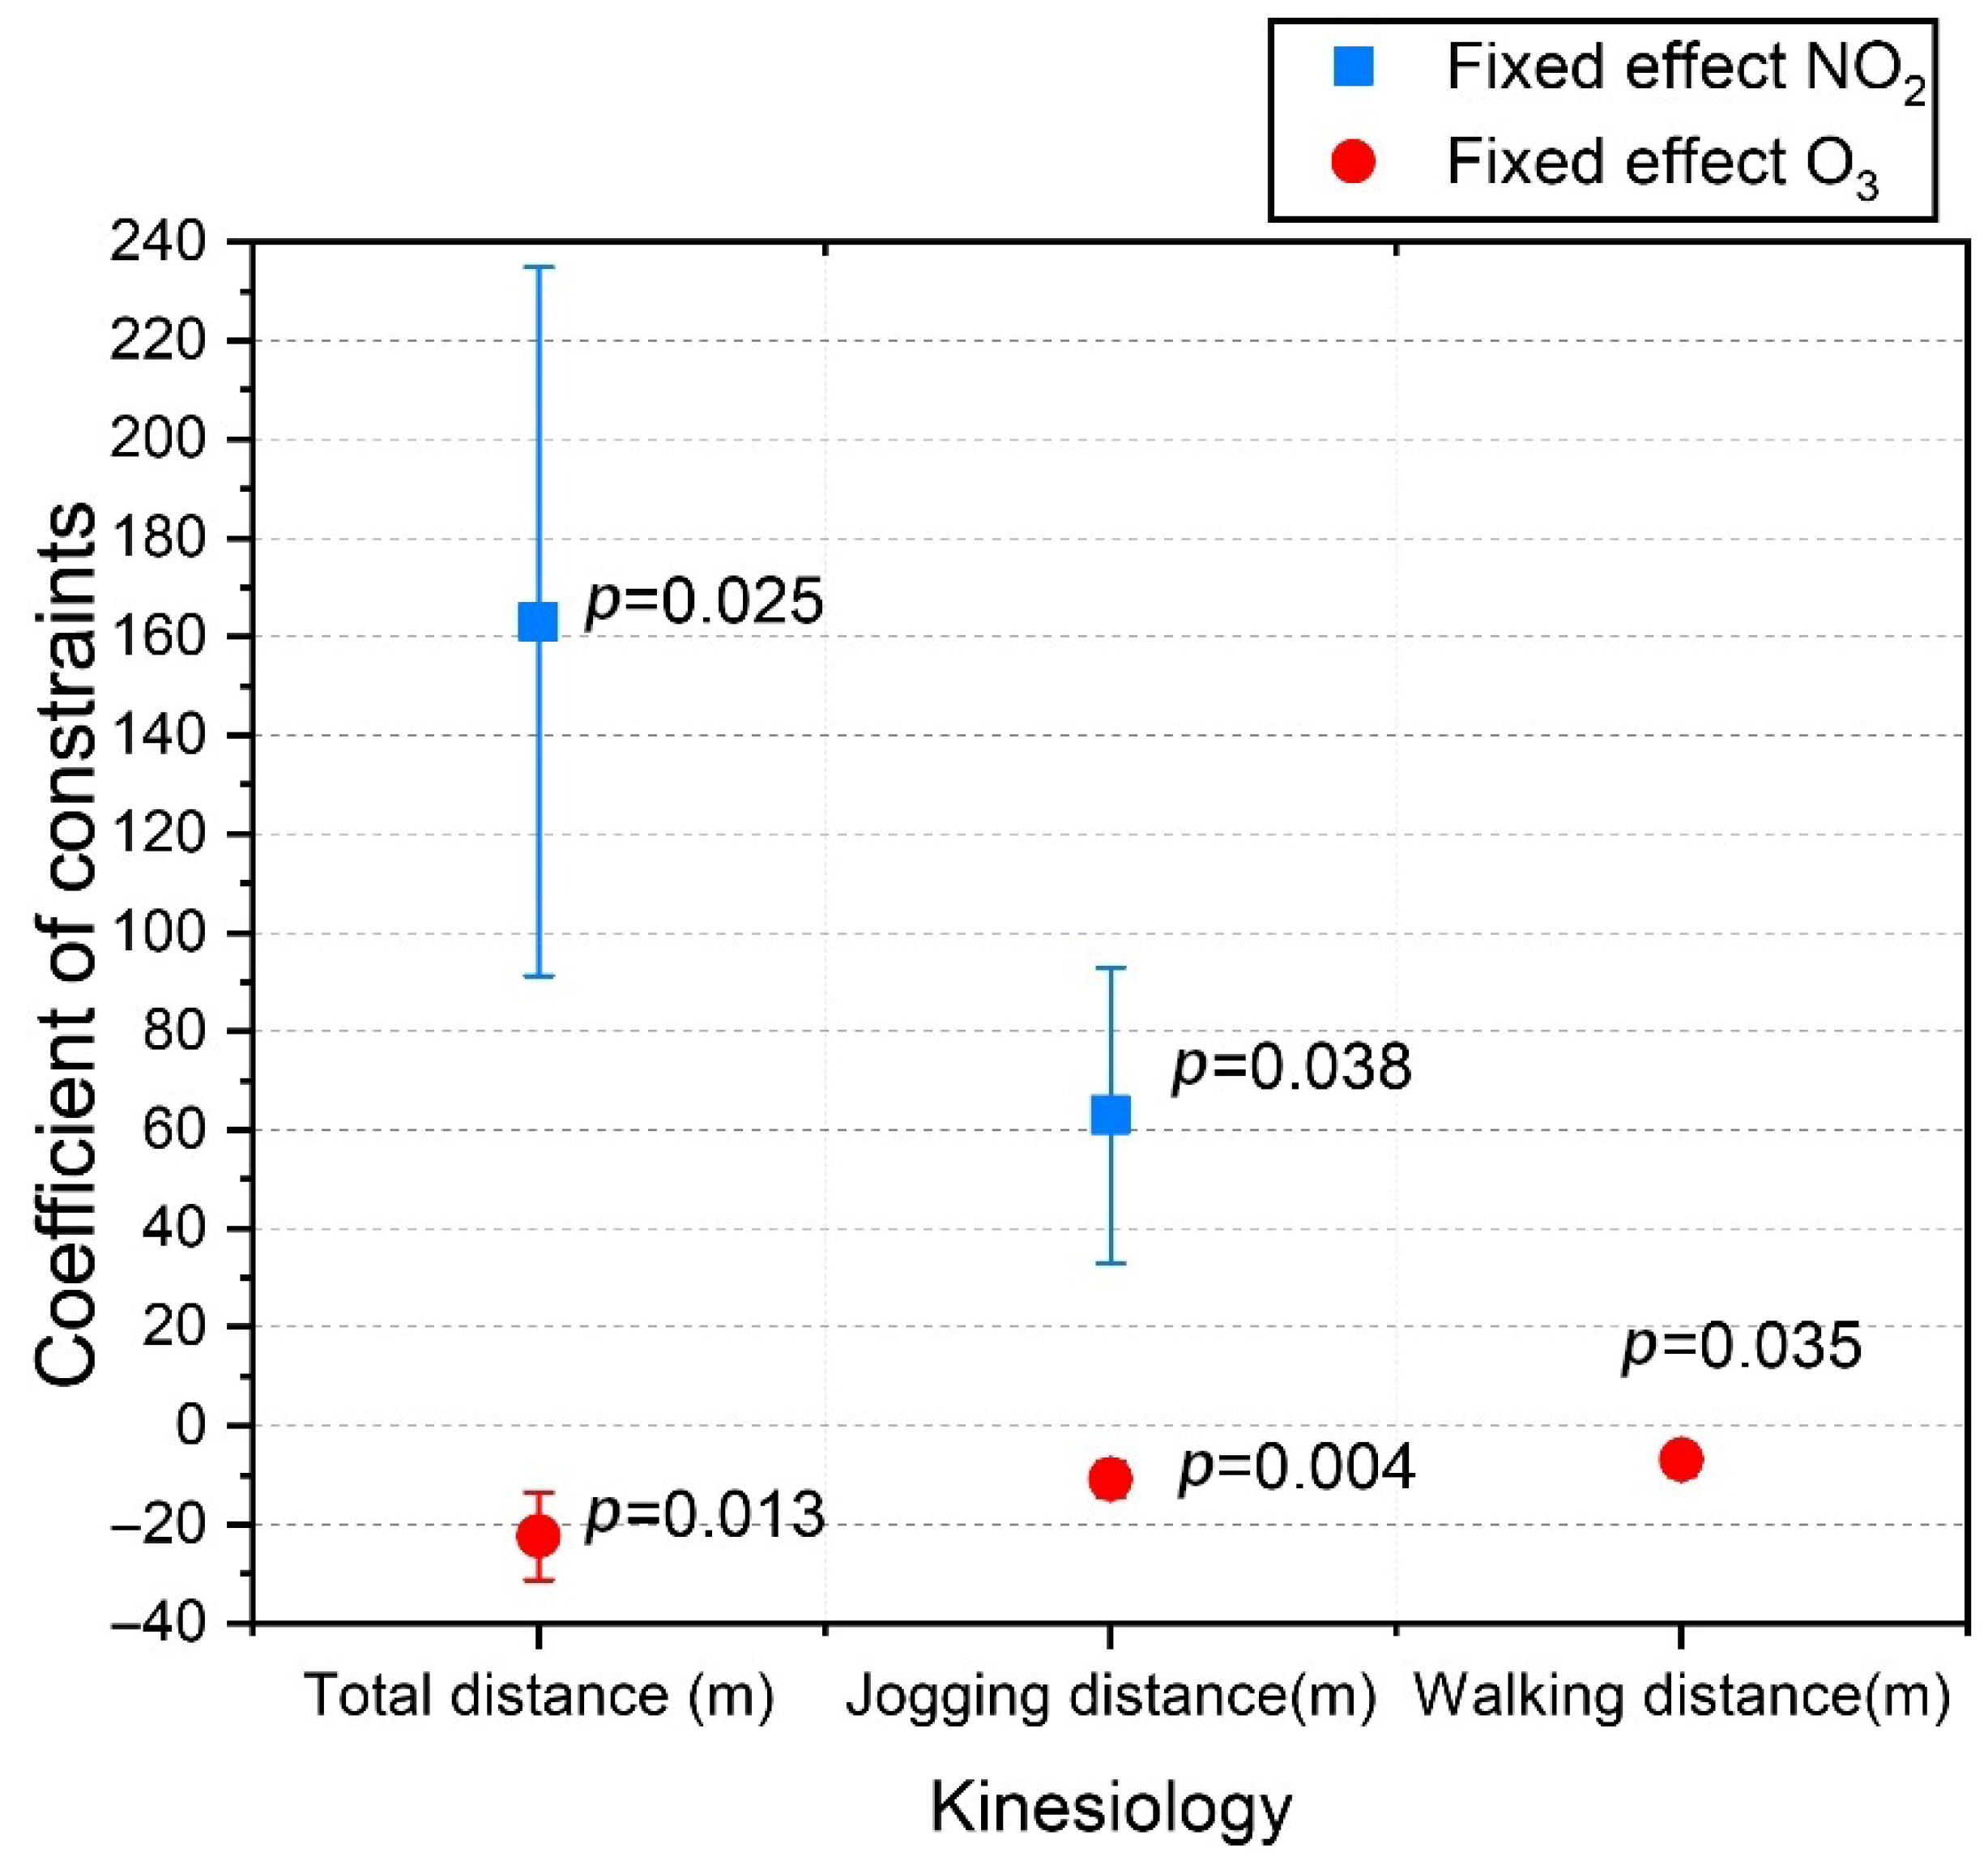
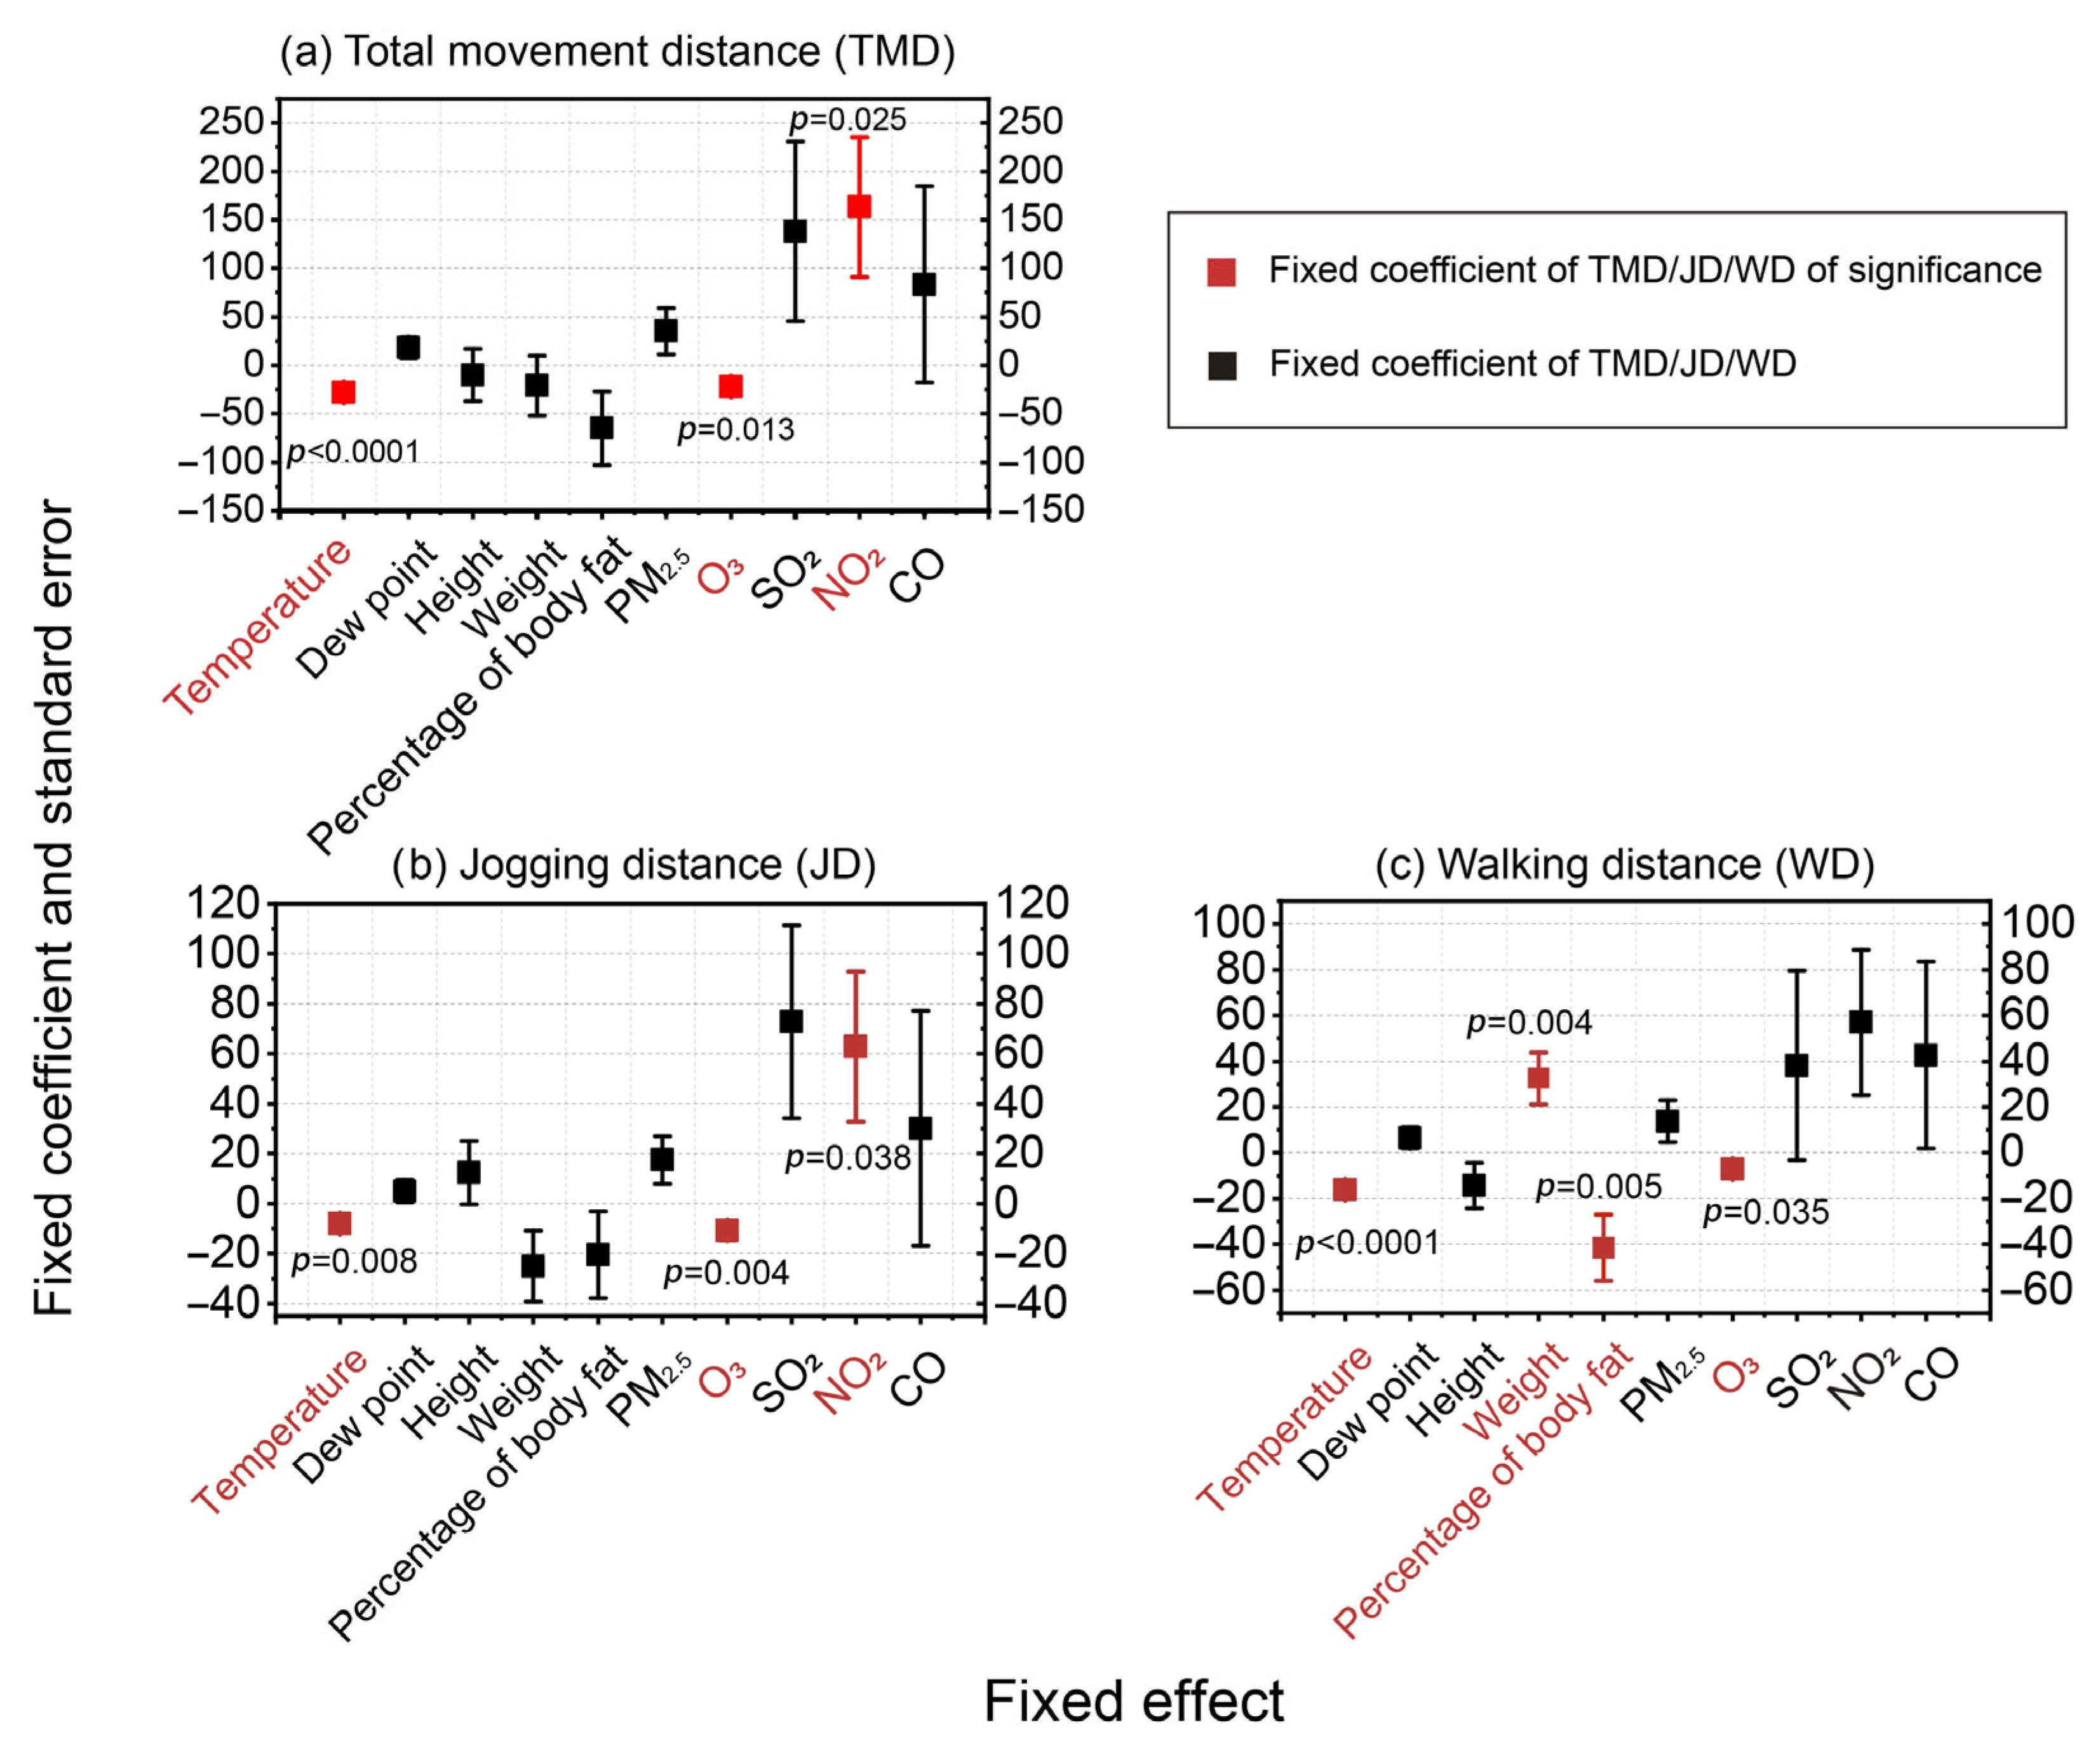
A strong negative association was observed between the O3 concentration and long-term endurance. The fixed effect coefficients for O3 on total movement distance, jogging distance, and walking distance were −22.426 ± 8.889, −10.817 ± 3.697, and −6.943 ± 3.265, respectively;
(2)
No significant correlation was found between the PM2.5, SO2, and CO concentrations and athletic performance. This may be attributed to the relatively low levels of these pollutants compared with the threshold value for air quality during the match period, which likely had a limited impact on the athletes;
(3)
No lag effect was observed in the impact of air pollutants on athletic performance;
(4)
During the monitored match period, the temperature was negatively correlated with athletic performance.

Supplementary Materials

The following supporting information can be downloaded at: https://www.mdpi.com/article/10.3390/atmos16070834/s1. Table S1: Physical fitness data sheet; Table S2: Athletic performance of women football players; Table S3: Official venue information; Table S4: Meteorological parameters and pollutant concentrations.

Author Contributions

W.X. and W.Z. designed the research. Y.W. and Y.X. conducted the analysis. W.X. and Y.W. led the drafting of the manuscript. W.X., Y.X. and W.Z. interpreted the results. All authors contributed significantly to the final writing of the article. All authors have read and agreed to the published version of the manuscript.

Funding

This research was funded by the National Key Research and Development Plan from the Ministry of Science and Technology of China through Grant No. 2022YFC3702604.

Institutional Review Board Statement

Not applicable.

Informed Consent Statement

Informed consent was obtained from all subjects involved in the study.

Data Availability Statement

The original contributions presented in this study are included in the article/Supplementary Materials. Further inquiries can be directed to the corresponding authors.

Acknowledgments

We acknowledge the support provided by Bin Zhao and Yudi Niu for their suggestions during the drafting and revision of this manuscript. During the preparation of this manuscript, the authors used GPT-4 for the purposes of proofreading. The authors have reviewed and edited the output and take full responsibility for the content of this publication.

Conflicts of Interest

The authors declare no conflicts of interest.

Abbreviations

The following abbreviations are used in this manuscript:
PM2.5Particulate matter with aerodynamic diameter less than 2.5 μm
O3Ozone
SO2Sulfur dioxide
NONitrogen dioxide
COCarbon monoxide
TMDTotal movement distance
JDJogging distance
WDWalking distance
WHOWorld Health Organization
COPDChronic Obstructive Pulmonary Disease
RTIRespiratory Tract Infections
FIFAFédération Internationale de Football Association
CNEMCChina National Environmental Monitoring Center
GLMMGeneralized Linear Mixed Model
GLMGeneralized Linear Model

References

  1. Song, C.; Wu, L.; Xie, Y.; He, J.; Chen, X.; Wang, T.; Lin, Y.; Jin, T.; Wang, A.; Liu, Y.; et al. Air pollution in China: Status and spatiotemporal variations. Environ. Pollut. 2017, 227, 334–347. [Google Scholar] [PubMed]
  2. Bai, Y.; Zhao, T.; Zhou, Y.; Kong, S.; Hu, W.; Xiong, J.; Liu, L.; Zheng, H.; Meng, K. Aggravation effect of regional transport on wintertime PM2.5 over the middle reaches of the Yangtze River under China’s air pollutant emission reduction process. Atmos. Pollut. Res. 2021, 12, 101111. [Google Scholar]
  3. Wang, T.; Xue, L.; Brimblecombe, P.; Lam, Y.F.; Li, L.; Zhang, L. Ozone pollution in China: A review of concentrations, meteorological influences, chemical precursors, and effects. Sci. Total Environ. 2017, 575, 1582–1596. [Google Scholar] [PubMed]
  4. Wang, X.; Cheng, S.; Zhou, Y.; Zhang, H.; Guan, P.; Zhang, Z.; Bai, W.; Dai, W. A review of the technology and applications of methods for evaluating the transport of air pollutants. J. Environ. Sci. 2023, 123, 341–349. [Google Scholar]
  5. Ucheje, O.O.; Ikebude, C.F. An Evaluation of Environmental Contamination on Public Health: A Review of Air Pollution in Nigeria. J. Eng. Res. Rep. 2024, 26, 81–92. [Google Scholar]
  6. Soriano, J.B.; Kendrick, P.J.; Paulson, K.R.; Gupta, V.; Abrams, E.M.; Adedoyin, R.A.; Adhikari, T.B.; Advani, S.M.; Agrawal, A.; Ahmadian, E.; et al. Prevalence and attributable health burden of chronic respiratory diseases, 1990–2017: A systematic analysis for the Global Burden of Disease Study 2017. Lancet Respir. Med. 2020, 8, 585–596. [Google Scholar]
  7. Apte, J.S.; Marshall, J.D.; Cohen, A.J.; Brauer, M. Addressing Global Mortality from Ambient PM2.5. Environ. Sci. Technol. 2015, 49, 8057–8066. [Google Scholar]
  8. Wu, X.; Braun, D.; Schwartz, J.; Kioumourtzoglou, M.A.; Dominici, F. Evaluating the impact of long-term exposure to fine particulate matter on mortality among the elderly. Sci. Adv. 2020, 6, eaba5692. [Google Scholar]
  9. Harris, O.D.; Goncalves, P.E.O.; Hung, A.; Stothers, B.; Bougault, V.; Sheel, A.W.; Koehle, M.S. Ozone exposure limits cardiorespiratory function during maximal cycling exercise in endurance athletes. J. Appl. Physiol. 2024, 136, 1507–1515. [Google Scholar]
  10. Adams, W.C. Comparison of Chamber 6.6-h Exposures to 0.04–0.08 PPM Ozone via Square-wave and Triangular Profiles on Pulmonary Responses. Inhal. Toxicol. 2008, 18, 127–136. [Google Scholar]
  11. Kim, C.S.; Alexis, N.E.; Rappold, A.G.; Kehrl, H.; Hazucha, M.J.; Lay, J.C.; Schmitt, M.T.; Case, M.; Devlin, R.B.; Peden, D.B.; et al. Lung Function and Inflammatory Responses in Healthy Young Adults Exposed to 0.06 ppm Ozone for 6.6 Hours. Am. J. Respir. Crit. Care Med. 2011, 183, 1215–1221. [Google Scholar] [PubMed]
  12. Schelegle, E.S.; Morales, C.A.; Walby, W.F.; Marion, S.; Allen, R.P. 6.6-Hour Inhalation of Ozone Concentrations from 60 to 87 Parts per Billion in Healthy Humans. Am. J. Respir. Crit. Care Med. 2009, 180, 265–272. [Google Scholar] [PubMed]
  13. Bell, M.L.; Peng, R.D.; Dominici, F. The Exposure–Response Curve for Ozone and Risk of Mortality and the Adequacy of Current Ozone Regulations. Environ. Health Perspect. 2006, 114, 532–536. [Google Scholar] [PubMed]
  14. Gryparis, A.; Forsberg, B.; Katsouyanni, K.; Analitis, A.; Touloumi, G.; Schwartz, J.; Samoli, E.; Medina, S.; Anderson, H.R.; Niciu, E.M.; et al. Acute Effects of Ozone on Mortality from the “Air Pollution and Health A European Approach” Project. Am. J. Respir. Crit. Care Med. 2004, 170, 1080–1087. [Google Scholar]
  15. Wang, M.; Aaron, C.P.; Madrigano, J.; Hoffman, E.A.; Angelini, E.; Yang, J.; Laine, A.; Vetterli, T.M.; Kinney, P.L.; Sampson, P.D.; et al. Association Between Long-term Exposure to Ambient Air Pollution and Change in Quantitatively Assessed Emphysema and Lung Function. JAMA 2019, 322, 546–556. [Google Scholar]
  16. World Health Organization. WHO Global Air Quality Guidelines: Particulate Matter (PM2.5 and PM10), Ozone, Nitrogen Dioxide, Sulfur Dioxide and Carbon Monoxide; World Health Organization: Geneva, Switzerland, 2021. [Google Scholar]
  17. GB 3095–2012; Ambient Air Quality Standards. China Environmental Science Press: Beijing, China, 2012.
  18. Beavan, A.; Hartel, S.; Spielmann, J.; Koehle, M. Air pollution and elite adolescent soccer players’ performance and well-being; an observational study. Environ. Int. 2023, 175, 107943. [Google Scholar]
  19. Zacharko, M.; Cichowicz, R.; Andrzejewski, M.; Chmura, P.; Kowalczuk, E.; Chmura, J.; Konefal, M. Air Pollutants Reduce the Physical Activity of Professional Soccer Players. Int. J. Environ. Res. Public Health 2021, 18, 12928. [Google Scholar]
  20. Cakmak, S.; Dales, R.; Leech, J.; Liu, L. The influence of air pollution on cardiovascular and pulmonary function and exercise capacity: Canadian Health Measures Survey (CHMS). Environ. Res. 2011, 111, 1309–1312. [Google Scholar]
  21. Adams, W.C. Effects of Ozone Exposure at Ambient Air Pollution Episode Levels on Exercise Performance. Sports Med. 1987, 4, 395–424. [Google Scholar]
  22. Rundell, W.K.; Caviston, R. Ultrafine and fine particulate matter inhalation decreases exercise performance in healthy subjects. J. Strength Cond. Res. 2008, 22, 2–5. [Google Scholar]
  23. Carlisle, A.J.; Sharp, N.C.C. Exercise and outdoor ambient air pollution. Br. J. Sports Med. 2001, 35, 214–222. [Google Scholar] [PubMed]
  24. Elliott, L.; Loomis, D. Respiratory effects of road pollution in recreational cyclists: A pilot study. Arch. Environ. Occup. Health 2020, 76, 94–102. [Google Scholar] [PubMed]
  25. Thaller, E.I.; Petronella, S.A.; Hochman, D.; Howard, S.; Chhikara, R.S.; Brooks, E.G. Moderate increases in ambient PM2.5 and ozone are associated with lung function decreases in beach lifeguards. J. Occup. Environ. Med. 2008, 50, 202–211. [Google Scholar] [PubMed]
  26. Beavan, A.; Härtel, S.; Spielmann, J.; Koehle, M. Air pollution, a worthy opponent? How pollution levels impair athlete performance across physical, technical, and cognitive domains. Sci. Total Environ. 2023, 900, 165707. [Google Scholar]
  27. Liu, Z.; Tang, Z.; Zhang, C. Distribution characteristics of inhalable particulate pollutants and their effects on cardiopulmonary respiratory system of outdoor football players in a smart healthcare system. Soft Comput. 2024, 28, 2683–2700. [Google Scholar]
  28. Li, J.; Sun, S.; Ho, M.S. Immediate Impacts of Air Pollution on the Performance of Football Players. J. Sports Econ. 2024, 25, 753–776. [Google Scholar]
  29. Kubayi, A. Evaluation of match-running distances covered by soccer players during the UEFA EURO 2016. S. Afr. J. Sports Med. 2019, 31, v31i31a6127. [Google Scholar]
  30. Cusick, M.; Rowland, S.T.; DeFelice, N. Impact of air pollution on running performance. Sci. Rep. 2023, 13, 1832. [Google Scholar]
  31. Mazic, S.; Lazovic, B.; Djelic, M.; Suzic-Lazic, J.; Djordjevic-Saranovic, S.; Durmic, T.; Soldatovic, I.; Zikic, D.; Gluvic, Z.; Zugic, V. Respiratory parameters in elite athletes—Does sport have an influence? Rev. Port. Pneumol. 2015, 21, 192–197. [Google Scholar]
  32. Bezuglov, E.; Ahmetov, I.I.; Lazarev, A.; Mskhalaya, G.; Talibov, O.; Ustinov, V.; Shoshorina, M.; Bogachko, E.; Azimi, V.; Morgans, R.; et al. The relationship of testosterone levels with sprint performance in young professional track and field athletes. Physiol. Behav. 2023, 271, 114344. [Google Scholar]
  33. Schweiger, V.; Villagrossi, L.; Taus, F.; Gottin, L.; Bonora, E.; Anderloni, M.; Varrassi, G.; Polati, L.; Nizzero, M.; Martini, A.; et al. Acetyl-L-Carnitine as an Add-On Treatment in Fibromyalgia Syndrome: A Retrospective Analysis on 183 Patients, According to the Generalized Linear Mixed Model for Longitudinal Data. Biomedicines 2025, 13, 820. [Google Scholar]
  34. Oluwadare, J.R.; Adesina, O.S.; Adedotun, A.F.; Odetunmibi, O.A. Estimation Techniques for Generalized Linear Mixed Models with Binary Outcomes: Application in Medicine. Int. J. Comput. Methods Exp. Meas. 2024, 12, 323–331. [Google Scholar]
  35. Bolker, B.M.; Brooks, M.E.; Clark, C.J.; Geange, S.W.; Poulsen, J.R.; Stevens, M.H.; White, J.S. Generalized linear mixed models: A practical guide for ecology and evolution. Trends Ecol. Evol. 2009, 24, 127–135. [Google Scholar] [PubMed]
  36. Wang, W.; Li, C.; Sun, G.; Qiu, C.; Mao, Z.; Wu, Z.; Fan, J.; Jin, Y.; Liu, K.; Sun, P.; et al. Beyond addiction: Exploring the factors behind suicidal thoughts among methamphetamine users in Guangdong, China. BMC Public Health 2025, 25, 1631. [Google Scholar]
  37. Zhang, Y.; Huang, W.; London, S.J.; Song, G.; Chen, G.; Jiang, L.; Zhao, N.; Chen, B.; Kan, H. Ozone and daily mortality in Shanghai, China. Environ. Health Perspect. 2006, 114, 1227–1232. [Google Scholar] [CrossRef]
  38. Marr, L.C.; Ely, M.R. Effect of air pollution on marathon running performance. Med. Sci. Sports Exerc. 2010, 42, 585–591. [Google Scholar]
  39. Hogstrom, G.M.; Pietila, T.; Nordstrom, P.; Nordstrom, A. Body composition and performance: Influence of sport and gender among adolescents. J. Strength Cond. Res. 2012, 26, 1799–1804. [Google Scholar]
  40. Urdampilleta Otegui, A.; Roche Collado, E. Intermittent hypoxia in sport nutrition, performance, health status and body composition. Nutr. Hosp. 2024, 41, 224–229. [Google Scholar]
  41. Haiyan, J.; Simei, Z.; Xuecheng, Y.; Lin, M.; Yaoyao, L.; Fanjia, G.; Dandan, Y.; Mingjuan, J.; Jianbing, W.; Mengling, T.; et al. Does physical activity attenuate the association between ambient PM2.5 and physical function? Sci. Total Environ. 2023, 874, 162501. [Google Scholar]
  42. Wagner, D.R.; Brandley, D.C. Exercise in Thermal Inversions: PM 2.5 Air Pollution Effects on Pulmonary Function and Aerobic Performance. Wilderness Environ. Med. 2020, 31, 16–22. [Google Scholar]
  43. Lin, Y.; Zou, J.; Yang, W.; Li, C.-Q. A Review of Recent Advances in Research on PM2.5 in China. Int. J. Environ. Res. Public Health 2018, 15, 438. [Google Scholar]
Figure 1. Geographical view of competition site (Kunming Haigeng Sports Training Base, Yunnan Province, China) and monitoring station (Xishan Scenic Area, Yunnan province, China).
Atmosphere 16 00834 g001
Figure 2. Comparison between fixed coefficients and standard errors for the correlation analysis of O3 and NO2 with athletic performance across athletic performance.
Atmosphere 16 00834 g002
Figure 3. Fixed effect analysis of three types of athletic performance indicators and standard deviation (coefficients with statistical significance are marked in red; black represents fixed coefficients that are not statistically significant.).
Atmosphere 16 00834 g003
Figure 4. Analysis of the lag effect of NO2 and O3 concentrations on athletic performance.
Atmosphere 16 00834 g004
Table 1. The fitting results of the estimated fixed effect parameters for three types of athletic performance.
ParametersTotal Movement Distance (TMD)Jogging Distance (JD)Walking Distance (WD)
Estimated Value (EV)Standard Error (SE)EVSEEVSE
Fixed effect parametersIntercept12,926.13982.82466.71865.36191.61525.6
Ambient temperature−28.1 ***6.7−8.1 **3.0−16.1 ***2.6
Dew point18.210.85.0354.66.64.7
Height−9.827.012.49012.7−14.49.9
Weight−20.831.0−25.04914.232.4 **11.2
Percentage of body fat−64.938.0−20.37317.4−41.4 **14.4
PM2.535.323.817.5929.513.89.2
O3−22.4 *8.9−10.817 **3.7−6.9 *3.3
SO2138.092.972.91238.638.141.4
NO2163.1 *72.062.922 *30.156.931.8
CO83.199101.31230.09647.06042.62740.8
Note: *** indicates that statistical significance of estimated factors is below 0.05, i.e., p < 0.001; ** denotes p < 0.01 and * represents p < 0.05.
Table 2. Comparison between the concentration of air pollutants and the officially released limits, and air quality classification.
Air PollutantMean Value (μg/m3)Standard Deviation (μg/m3)2021 WHO Guideline (μg/m3) [16]Classification2012 China Air Quality Threshold Value (μg/m3) [17]Classification
PM2.517.715.715 (24 h)Below Interim target 475 (24 h)Excellent
O381.039.5100 (8 h)Below AQG levels200 (1 h)Excellent
SO27.42.540 (24 h)Below AQG levels500 (1 h)Excellent
NO27.12.325 (24 h)Below AQG levels200 (1 h)Excellent
CO794.01273.04000 (24 h)Below AQG levels10,000 (1 h)Excellent
Note: In the WHO global air quality guidelines, according to the pollutant concentration from good to poor, it is divided into AQG level, Interim target 4, Interim target 3, Interim target 2, and Interim target 1. In the Technical Regulations of China’s Ambient Air Quality Index (AQI), according to the air quality levels corresponding to the pollutant concentration, it is divided into six levels from good to poor. Among them, the first level of air quality is excellent.
Disclaimer/Publisher’s Note: The statements, opinions and data contained in all publications are solely those of the individual author(s) and contributor(s) and not of MDPI and/or the editor(s). MDPI and/or the editor(s) disclaim responsibility for any injury to people or property resulting from any ideas, methods, instructions or products referred to in the content.

