Abstract
In a warming climate, rising temperature are expected to influence atmospheric humidity. This study examined the spatio-temporal dynamics of temperature (TEMP) and relative humidity (RH) across Equatorial Africa from 1980 to 2020. The analysis used RH data from European Centre of Medium-range Weather Forecasts Reanalysis v.5 (ERA5) reanalysis, TEMP and precipitation (PRE) from Climate Research Unit (CRU), and soil moisture (SM) and evapotranspiration (ET) from the Global Land Evaporation Amsterdam Model (GLEAM). In addition, four teleconnection indices were considered: El Niño-Southern Oscillation (ENSO), Indian Ocean Dipole (IOD), North Atlantic Oscillation (NAO), and Pacific Decadal Oscillation (PDO). This study used the Mann–Kendall test and Sen’s slope estimator to analyze trends, alongside multiple linear regression to investigate the relationships between TEMP, RH, and key climatic variables—namely evapotranspiration (ET), soil moisture (SM), and precipitation (PRE)—as well as large-scale teleconnection indices (e.g., IOD, ENSO, PDO, and NAO) on annual and seasonal scales. The key findings are as follows: (1) mean annual TEMP exceeding 30 °C and RH less than 30% were concentrated in arid regions of the Sahelian–Sudano belt in West Africa (WAF), Central Africa (CAF) and North East Africa (NEAF). Semi-arid regions in the Sahelian–Guinean belt recorded moderate TEMP (25–30 °C) and RH (30–60%), while the Guinean coastal belt and Congo Basin experienced cooler, more humid conditions (TEMP < 20 °C, RH (60–90%). (2) Trend analysis using Mann–Kendal and Sen slope estimator analysis revealed spatial heterogeneity, with increasing TEMP and deceasing RH trends varying by region and season. (3) The warming rate was higher in arid and semi-arid areas, with seasonal rates exceeding annual averages (0.18 °C decade−1). Winter (0.27 °C decade−1) and spring (0.20 °C decade−1) exhibited the strongest warming, followed by autumn (0.18 °C decade−1) and summer (0.10 °C decade−1). (4) RH trends showed stronger seasonal decline compared to annual changes, with reduction ranging from 5 to 10% per decade in certain seasons, and about 2% per decade annually. (5) Pearson correlation analysis demonstrated a strong negative relationship between TEMP and RH with a correlation coefficient of r = − 0.60. (6) Significant associations were also observed between TEMP/RH and both climatic variables (ET, SM, PRE) and large scale-teleconnection indices (ENSO, IOD, PDO, NAO), indicating that surface conditions may reflect a combination of local response and remote climate influences. However, further analysis is needed to distinguish the extent to which local variability is independently driven versus being a response to large-scale forcing. Overall, this research highlights the physical mechanism linking TEMP and RH trends and their climatic drivers, offering insights into how these changes may impact different ecological and socio-economic sectors.
1. Introduction
As the climate continues to warm, the global water and energy cycle has intensified with time, resulting in changes in climatic factors such as temperature (TEMP) and relative humidity (RH) [1,2,3]. While global warming is expected to proceed with relatively stable relative humidity, the latest Intergovernmental Panel for Climate Change (IPCC) report underscores the persistent uncertainty surrounding the extent and underlying causes of observed changes in RH [4]. These changes in both TEMP and RH have vast practical implications, including, influencing climate and weather patterns [5,6], thermal comfort and physiological stress [7,8], human health [9], agricultural productivity [10,11], building durability [12,13], and energy consumption [14,15], and ecosystem dynamics [16,17]. Thus, quantifying regional changes in RH and TEMP patterns, trends and attribution is essential for developing coping mechanisms and adaptive strategies for developing countries with poor socioeconomic conditions, high population and low adaptive capacity regions that are particularly vulnerable to our changing climate [18,19].
The recent literature has increasingly focused on how TEMP changes influence RH in warming climate. Changes in TEMP can influence RH both directly alter surface–air TEMP and modify atmospheric moisture content. In dry regions, limited soil moisture can amplify surface TEMPs [20]. This warming tends to decrease RH unless accompanied by a corresponding rise in atmospheric moisture [20]. In contrast, humid regions—characterized by higher baseline moisture availability—may experience more stable RH levels despite rising temperatures, as the air remains closer to saturation [21]. Additionally, radiative forcing from greenhouse gases such as carbon dioxide (CO2) and methane (CH4) is particularly effective in the lower atmosphere, where most climate feedbacks occur. This forcing is amplified in dry conditions due to reduced spectral overlap with water vapor, enhancing the radiative impact of CO2 [22]. Together, these thermodynamic and radiative mechanisms govern the differential RH responses to warming across arid and humid regions.
Relative humidity (RH) is the ratio of actual water vapor in the air to the maximum it can hold at a given temperature. RH (expressed as a percentage), plays a key role in climate studies [23]. RH measurements provide valuable insights into both atmospheric and land-based humidity conditions over a region. There are various methods for measuring relative humidity (RH), each offering distinct advantages depending on the context. These include direct observations from meteorological stations [24,25], satellite-based measurements [26,27], reanalysis data [28,29], climate models [30,31,32] and paleoclimate reconstructions [33,34]. All these studies have provided a comprehensive understanding of RH dynamics under global warming [23]. Previous studies have shown that rising temperature should impact the trends of relative humidity, however, trend dynamics remains inconclusive [23,35]. For example, in a global analysis of RH changes, some studies demonstrated that global RH trends remained stationary and non-significant [29,30], while others studies demonstrated slight changes in trend are limited to tropical regions, and Northern Hemisphere (NH) despite the long-term trend remains non-significant [26,27] under rising temperatures. Few studies have also shown inconsistencies in RH trends over Europe and tropical regions [36,37]. Similarly, several local studies have contributed and provided a comprehensive overview of how relative humidity and temperatures interacts in various ecosystems, for example, in India [28], Bangladesh [38,39], China [40], Thailand [24], Iran [41], South Korea [42], and the Himalayan region [43]. These studies suggested that air temperature changes and subsequent response of relative humidity are in tandem as the climate warms. This documentary evidence indicates that RH is influenced by essential climate variables such as precipitation (PRE), TEMP, etc. However, despite these numerous studies on temperature and RH climatological trends and influencing factors across Europe, and Asia (particularly, over China, India, Thailand, Bangladesh, the Himalayas, Korea, etc.), the climatological trends and relationship between these two essential climate variables remains understudied in Africa tropics. Most published literature largely infers these trends from global analysis.
Interannual climate variability has also been shown to be influenced by large-scale ocean-atmosphere phenomena including El Niño-Southern Oscillation (ENSO, Indian Ocean Dipole (IOD), North Atlantic Oscillation (NAO), and Pacific Decadal Oscillation (PDO) variations. Previous studies were restricted to their influential role in large-scale interactions on precipitation variability. For example, Jiang et al. [44] examined the role of IOD and found its impact on central Equatorial African rainfall anomalies. Nooni et al. [45] investigated the role of eight teleconnections drivers impacts long-term precipitation patterns across Africa. MacLeod et al. [46] observed an increasing impact of IOD variability on seasonal and extreme precipitation dynamics over East Africa. Berihu et al. [47] investigated IOD and ENSO effects on East African moisture transport anomalies. Ludecke et al. [48] used correlation analysis to demonstrate that rainfall in Equatorial Africa (i.e., Sahel, East and Central Africa) aligns with ENSO, IOD, PDO and NAO on interannual timescales. Palmer et al. [49] established that East African rainfall variability is linked to ENSO events. Park et al. [50] evaluated the influence of recent ENSO events on East Africa drought patterns. Nicholson [51] demonstrated that ENSO phases affect rainfall and temperature anomalies across eastern Africa. Black et al. [52] established that IOD modulates East Africa’s short rains. Hurrell et al. [53] showed that NAO impacts the climate of the Sahel and West Africa. However, most of these documented studies of regional climate dynamics were achieved by integrating quantitative teleconnection analysis (e.g., correlation, multivariate regression, composites, and partial correlations). However, surface air temperature and relative humidity dynamics have not been fully explored across Equatorial Africa. This region is widely regarded as a climate change hotspot, with severe implications for food and water security that threaten key sectors essential to the continent’s economic development [4]. Recent studies showed that Equatorial Africa faces increasing drying trends and heightened vulnerability to extreme weather due to high climate variability, threatening livelihoods and economic growth [54,55].
Developing adaptation strategies to mitigate the impacts of current and future climate extremes is critically important. Yet, research on long-term trends in temperature and relative humidity remains scarce, with most existing studies emphasizing temperature variability [56]. Thus, conducting an assessment of long-term trends and relationship provides a more insights into the drivers behind observed spatiotemporal changes. This study seeks to address this gap by exploring the spatial–temporal variability of temperature and RH, along with their influencing factors, in Equatorial Africa. This study introduces two key elements that offer additional insights compared to previous research. First, this region-specific analysis linking temperature and RH would improve our understanding of how these two variables co-evolve under global warming. Do the climatological trends of these two essential variables differ compared to other tropical regions like China, the USA, and Australia? Second, during the past four decades, many studies of climate change impacts on hydrology and water resources in the Africa tropics have only investigated changes in temperature and precipitation.
This research aims to address spatiotemporal variability in these two essential climate variables using different statistical methods and multiple dataset sources (observations, reanalysis and remote sensing data) for the period from 1980 to 2020. This study’s objectives are as follows: (1) to investigate the interannual and seasonal variability of temperature and relative humidity across the Equatorial Africa region; (2) to assess long-term trends in temperature and relative humidity; and (3) to examine the relationships of this temperature and relative humidity to other climate variables (precipitation, evapotranspiration and soil moisture). The focus on the Equatorial Africa regions will improve our understanding of the moisture–temperature relationship, which is critical to several sectors of society in this water-stressed region.
2. Materials and Methods
2.1. Study Area
The study area is located within the tropical climate zone, and its geographical extent lies between latitudes 0° to 18° N and longitudes 18° W and 54° E (Figure 1), covering an approximate area of 15,730,000 km2. The region includes diverse ecosystems such as deserts, savannas and tropical forest. The district climate of wet and dry seasons is influenced by the seasonal shifts of the intertropical convergence zone (ITCZ) and topography, with significant variations ranging from 500 to over 2000 m above sea level [57] (Figure 1). The region experiences higher temperatures (25 to above 40 °C) in the low-land basins and desert regions and lower temperatures (0 °C to 10 °C) in the high-altitude mountains and plateaus. Annual precipitation levels increase in tropical forest areas (>1500 mm), Savanna (>800), Sahel (>500 mm) and arid areas that receive < 100 mm [58,59,60]. The climate of the region according to Koppen Geiger is classified as tropical, dry, temperate, continental and polar, where each specific sub-type reflects distinct seasonal and geographical characteristics [61].
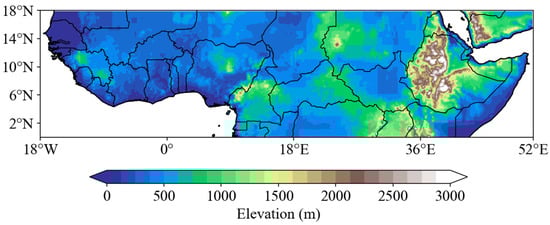
Figure 1.
The location of tropical Africa showing the digital elevation model (DEM) of the region.
2.2. Gridded Climate Data
This study used the European Centre of Medium-range Weather Forecasts Reanalysis v.5 (ERA5) global reanalysis. ERA5 is part of the Copernicus Climate Change Service (C3S) and provides high-resolution essential climate variables. This study downloaded relative humidity (at 950 hPa) from the global ERA5 database (https://cds.climate.copernicus.eu/datasets) (accessed on 2 August 2024) to investigate the spatiotemporal variations and trends in the study area. ERA5 has undergone decades of model physics, core dynamics and data assimilation improvement to enhance the quality of reanalysis over a given period. Details of ERA5 documentation and performance, as well as quality evaluation, have been provided in the literature [62,63,64].
The precipitation and temperature (minimum and maximum) dataset used in this study is provided by the Climate Research Unit (CRU) website (http://www.cru.uea.ac.uk) (accessed on 2 August 2024). The CRU TS 4.08 gridded dataset is derived from global daily observations at over 4000–5000 meteorological stations from 1901 to 2023. The CRU TS 4.08 gridded dataset uses an optimal interpolation method to generate its gridded datasets at temporal and spatial resolution of monthly and 0.5° × 0.5°, respectively. The dataset has undergone rigorous quality control to effectively capture the spatial and temporal distribution characteristics of precipitation and temperature [58,65]. It has been widely used to evaluate and validate the quality of other precipitation and temperature products in different regions of the world such as Central Asia [66,67], United States [68], China [69], etc.
Soil moisture and actual evapotranspiration data available at a high spatial resolution of 0.25° by 0.25° were obtained from the Global Land Evaporation Amsterdam Model (GLEAM) website (www.gleam.eu, accessed on 2 August 2024). These datasets provide monthly data on changes in soil moisture (surface) and total actual ET [70,71,72].
CHIRPS v3 (Climate Hazards Group InfraRed Precipitation with Station data) was downloaded from the https://www.chc.ucsb.edu/data/chirps3 (accessed on 25 June 2025). The dataset spans from 1981 to the present with a spatial resolution of 0.05°. A detailed description of the this product is outlined in Funk et al. [73]. We also obtained the CPC (Climate Prediction Center) temperature dataset, which was downloaded from their webpage (Climate Prediction Center—Global Temperature Time Series) (accessed on 25 June 2025). The CPC provides high-resolution, gridded estimates of surface temperature based on satellite observations and in situ measurements. This dataset spans from 1979 to the present and offers a spatial resolution of 0.5°.
The NCEP/NCAR (National Centers for Environmental Prediction/National Center for Atmospheric Research) relative humidity (at 920 hPa) dataset is a widely used reanalysis product. NCEP/NCAR reanalysis data, typically from 1948 to the present, offers daily and monthly time series of relative humidity at multiple vertical levels. The data is available at a spatial resolution of 2.5° × 2.5° and was downloaded from the website (https://psl.noaa.gov/site_index.html) (accessed on 25 June 2025). The following teleconnection indices values such as the El Niño-Southern Oscillation (ENSO, Niño 3.4) [74], and the Dipole Mode Index (DMI, representing the Indian Ocean Dipole—IOD), Pacific Decadal Oscillation (PDO) [75], and North Atlantic Oscillation (NAO) [53] were downloaded from the National Oceanic and Atmospheric Administration (NOAA) National Climatic Data Center (NCDC) website (https://www.ncdc.noaa.gov/teleconnections/ accessed on 2 August 2024). The datasets were downloaded at a horizontal resolution of 0.5° × 0.5° from 1980 to 2020.
This study used bilinear interpolation, which estimates the value at a new point using the weighted average of four diagonally adjacent known grid points, with weights determined by the distances between the sample point and each surrounding pixel [76,77]. Resampling was performed using climate data operators (CDO, Version 2.2.1) [78]. The target grid was defined based on the ERA5 reanalysis resolution (0.25° × 0.25°), and the CRU TS, CHIRPS, CPC and NCEP datasets (originally at 0.5° × 0.5°) were resampled accordingly using bilinear interpolation. Both the ERA5 reanalysis and GLEAM datasets natively have a uniform spatial resolution of 0.25° × 0.25°. The study analyses were estimated on annual and seasonal scales.
2.3. Methods
To identify the distribution of RH over the study area, we computed the mean RH across both space and time, expressed as a percentage (%).
where is the actual vapor pressure and is the saturation vapor pressure. An RH of 100% indicates that air is saturated, and 0% indicates that the air holds no water vapor. Table 1 presents the classification of RH under four typical conditions based on their implication for climate and human comfort [13,79,80].

Table 1.
Relative humidity (RH) conditions in tropical regions and their implication for climate and human health.
Taylor diagrams [81] were used to assess dataset performance for temperature (CPC, ERA5, CRU), relative humidity (ERA5, NCEP), and precipitation (CHIRPS, ERA5, CRU) across Equatorial Africa. These diagrams display key performance metrics, such as the correlation coefficient (r), normalized root-mean-square difference (RMSD), and standard deviation. For the metric interpretation, higher correlation values, along with lower RMSD and standard deviation, indicate stronger agreement with the reference dataset.
The trends in climate variables in the study area were estimated using the Mann–Kendall (MK) trend test and the Sen’s slope. Both the MK and Sen’s slope estimator are nonparametric techniques. The Sen’s slope estimator measures the rate of change over time [82] while MK test assesses both the significance and direction of trends [83,84]. Note that these methods have been used in several hydro-meteorological studies across the different regions of the globe, including Ethiopia [85], Yangtze River Valley [86], India [87], and Pakistan [88].
Also, the Pearson correlation was used to assess the relationship between climatic variables [89,90,91,92]. We performed the correlation between four climate variables (i.e., temperature, precipitation, soil moisture and evapotranspiration). The correlation between two variables, x and y, can be estimated as
where and are individual data points in x and y; and denote the means of x and y, respectively.
In addition, we performed a multi-linear regression (MLR) following Sarpong et al. [93] and Loua [94] to identify the relationship between the studied time-series (TEMP and RH) and climate indices such as ENSO, IOD, NAO and PDO. The MLR model is based on the formula below.
where , is the dependent variable, represents the independent variables, ,… are the coefficients and represents the residual terms of the model.
3. Result
3.1. Evaluation of Climate Datasets
To validate the reliability of temperature (TEMP), relative humidity (RH), and precipitation (PRE) trends, we compared different gridded datasets. For temperature, we used ERA5, CPC, and CRU as the reference dataset. For RH, ERA5 was used as the reference, with NCEP reanalysis data for comparison. For precipitation, we validated the trend against satellite-based CHIRPS, ERA5, and CRU, with CRU as the reference dataset. Figure 2a presents precipitation trends, comparing satellite-based CHIRPS, and reanalysis-based ERA5 against CRU, as the reference dataset. We observed a strong correlation with the reference datasets, particularly for ERA5 (r = 0.90) and lower for CHIRPS (r = 0.20). The normalized root mean square difference (RMSD) and standard deviation (SD) were lowest for ERA5 (RMSD = 1.9 mm, SD = 2.5 mm), indicating better agreement with the observed precipitation patterns.
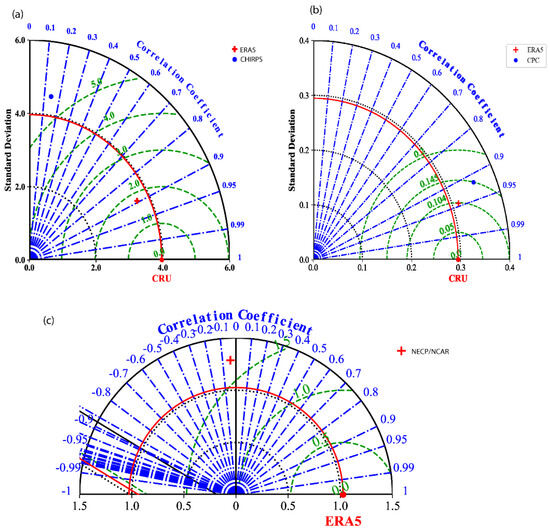
Figure 2.
Taylor diagram comparing different gridded datasets from 1980 to 2020 across Equatorial Africa. (a) Precipitation (CHIRPS, ERA5, and CRU) (b) temperature (CPC, ERA5 and CRU) and (c) NECP/NCAR and ERA5).
For temperature, both ERA5 (r = 0.94, RMSD = 0.104, SD = 0.09) and CPC (r = 0.95, RMSD = 0.145, SD = 0.12) exhibited strong annual correlation with CRU, with ERA5 demonstrating slightly better agreement overall (Figure 2b). Regarding RH, NCEP RH (r = 0.10, RMSD = 0.155, SD = 0.05) showed weak correlation with the reference ERA5 RH data, indicating that NCEP RH performed poorly in terms of both correlation (r) and RMSD (Figure 2c).
3.2. Spatial Variability
Figure 3 presents the spatial distribution of temperature (TEMP) in panels a1–a5 and relative humidity (RH) in panels b1–b5, respectively. In Figure 3(a1), the interannual variations in TEMP ranges from 15 to over 30 °C. Regions along the Guinean Coast of West Africa (WAF), Central Africa (CAF) and Somalia, northeastern Kenya experience temperatures in the range of 20 to 28 °C. temperatures higher than 30 °C are located in northern WAF (10–18° N and low temperature lower than 20 °C in CAF and interior of Ethiopia Highlands. Seasonal temperature patterns vary over the period 1980 to 2020. However, there is striking similarity in spatial patterns between autumn (Figure 3(a3)) and annual (Figure 3(a1)), respectively. During summer, regions with high temperatures of over 30 °C are concentrated above 16° N, while moderate temperatures between 25 and 30 °C are concentrated along the Sahelian belt (10–18° N, 15° W–36° E), and low temperatures less than 20 °C are found along the Guinean Coast, CAF and interior of Ethiopian Highlands (Figure 3(a2)). In wintertime, temperatures below 25 °C are concentrated in the north of WAF, CAF and North East Africa (NEAF). Moderate temperature between 25 °C and 35 °C occurs along the Guinean Coast of Cote d’Ivoire to Nigeria, South Sudan, and the border of Kenya and Somalia, respectively (Figure 3(a4)). Spring season showed high spatial variability across the region with very high temperatures in central WAF (i.e., tripoint of Mauritania, Senegal and Mali, tripoint of Mali, Burkina Faso and Niger and central Chad) exceeding 35 °C (Figure 3(a5)). Moderate springtime temperatures are concentrated mostly in WAF, north of CAF and Sudan, while temperatures below 20 °C are located in Senegal, Ethiopia, Djibouti and south of CAF in the Congo Basin (Figure 3(a5)).
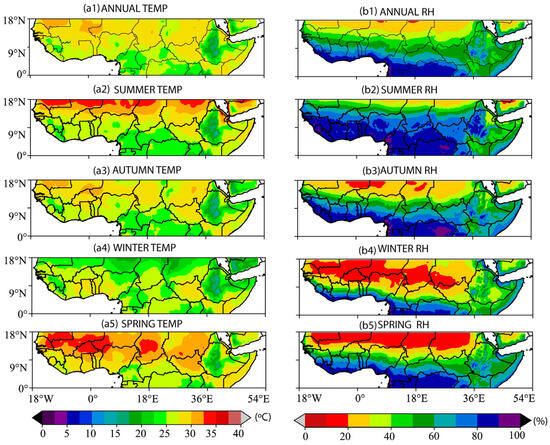
Figure 3.
Spatial pattern in mean TEMP (left panel, (a1–a5)), RH (b1–b5) from 1980 to 2020. Annual (a1,b1), summer (a2,b2), autumn (a3,b3), winter (a4,b4), and spring (a5,b5). Units: TEMP (°C) and RH (%).
In Figure 3(b1), the interannual pattern of RH values range from <30% (low RH) along the northern WAF (15–18° N, 15° W–35° E), between 30 to 60% (moderate RH) concentrated in the NEAF and along central WAF (10–12° N), and between 60 and 80% (high RH) concentrated in CAF and along the Guinean Coast of WAF. High RH (60–90%) was mostly found in WAF and CAF during summer (Figure 3(b2)). A similarity in spatial patterns between autumn (Figure 3(b3)) and spring (Figure 3(b5)) was identified; however, spring presents a more pronounced lower RH in the north of WAF and CAF. Winter RH presents high RH (60–90%) in the Guinean Coast of WAF, southern CAF and parts of NEAF. Moderate RH is found along the Sahelian belt of WAF, and CAF, while low RH appears predominantly in northern WAF and CAF (Figure 3(b4)).
Figure 4a displays the seasonal variability of TEMP peaks in April, reaching its highest value around 28.5 °C. It plateaus to May, and then steadily decreases to August. Then, it gently rises in September before a sharp decrease to December, reaching its lowest value around January (24 °C). Figure 4b shows the seasonal variability in RH peaks in September, reaching its highest value around 74%, indicative of increased likelihood of precipitation or discomfort in hot conditions. It then decreases during the winter months (December to February), reaching its lowest value around February (60%), and gradually increases from spring months (March to May), to summer months (June to August) to autumn months (September to November).
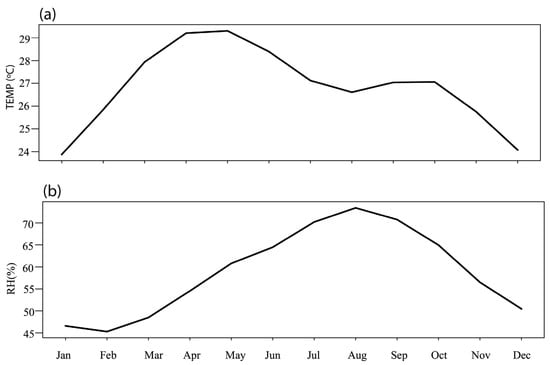
Figure 4.
Climatological annual cycle of (a) air temperature and (b) relative humidity the period 1980 to 2020 across Equatorial Africa. Units: TEMP (°C) and RH (%).
3.3. Spatial and Temporal Trends
Figure 5 presents TEMP spatial trends using MK test (left panel) and Sen slope (right panel) for direction of trends at different timescales. At an interannual scale in Figure 5(a1) indicates a positive trend with a pattern of significant trend in CAF, NEAF and the Guinean Coast of WAF (i.e., Côte d’Ivoire, Ghana and southern Nigeria). However, some regions showed non-significant or low trend values in southern Cote d’Ivoire, Ghana, Togo and Benin. Regions showing negative trends were concentrated in southern Nigeria, Cameroon, border of Angola and Congo DRC, but were not statistically significant. Figure 5(a2) displays an increasing or warming trend in the CAF, the NEAF and the Guinean Coast (of Côte d’Ivoire, Ghana and Nigeria) at a magnitude of increasing rate of 0.2 to 0.4 °C per decade. In contrast, regions in CAF and WAF show a slower warming trend with a rate of 0.1 4 °C per decade. Notably, the summertime spatial TEMP map (Figure 5(b1)) trend map is strikingly similar to the annual trend TEMP map (Figure 5(a1)), with the strongest increasing rate (exceeding 0.3 °C) occurring in Ethiopia, Eritrea, Sudan, northwestern and central WAF, border of Nigeria and Niger, northern CAF (Figure 5(b2)). In autumn, positive trends in WAF, NEAF, and negative trends in southern CAF resemble trends in summer with exceptions of slight changes in trends in Sudan, border of Nigeria and Cameroon, Chad, borders of Kenya and Somalia (Figure 5(c1)) with a less pronounced increasing trend exceeding 0.1 °C per decade than in summer (Figure 5(c2)). In wintertime, except for Sudan, Chad and Niger, other regions showed a significant moderate positive trend while non-significant negative and no trends in the interior of Ethiopia, Côte d’Ivoire, Ghana, southern Nigeria, Senegal, and Guinea (Figure 5(d1)). However, the entire regions are showing warming faster rates (exceeding 0.3 °C per decade) (Figure 5(d2)). The spring RH shows a weak negative and no trends, as few regions present patches of a moderate significant positive trend in the border of Mali and Mauritania and negative trends in Congo Basin (Figure 5(e1)). However, these low trends are increasing at a faster rate, exceeding 0.2 °C per decade (Figure 5(e2)).
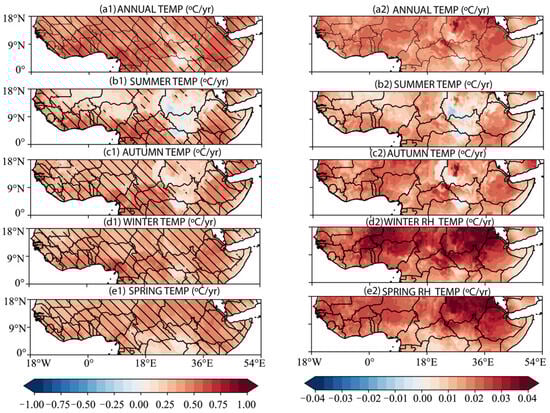
Figure 5.
Spatial distribution of temperature trends (°C per decade) over Equatorial Africa from 1980 to 2020. Left and right panels indicate MK and Sen slope estimator analysis, respectively: Hatching indicates areas where trends are statistically significant at the 0.05 level, based on the MK test. (a1,a2) annual, (b1,b2) summer, (c1,c2) autumn, (d1,d2) winter, (e1,e2) spring.
We analyzed spatial trends of RH using MK test (Figure 6(a1,b1,c1,d1,e1), left panel) and direction of trends using Sen slope estimator (Figure 6(a2,b2,c2,d2,e2), right panel) from 1980 to 2020. Statistically significant regions (p < 0.05) are predominantly located in CAF, NEAF and the Guinean Coast (of Côte d’Ivoire, Ghana and Nigeria) in WAF. Some regions in western and central Sahelian regions of WAF showed no significant trends (Figure 6(a1)). In Figure 6(a2), the spatial map displays both the positive (increasing) and negative (decreasing) trends in RH. The magnitude of decreasing trend ranges from 0.50 to 2.0% per decade in the CAF, NEAF and the Guinean Coast, while some regions with mixed trends of non-significant trends or low negative trends were observed.
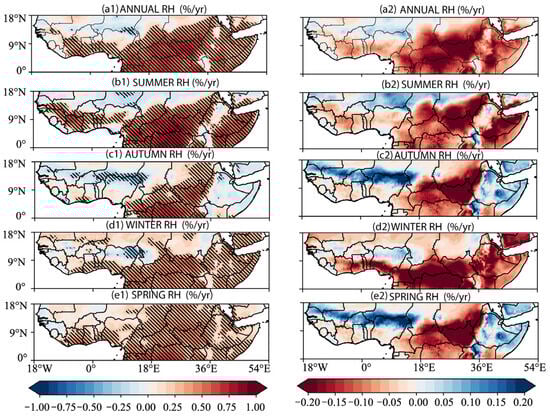
Figure 6.
Spatial distribution of RH trends (% per decade) over Equatorial Africa from 1980 to 2020. Left and right panels indicate MK and Sen slope estimator analysis, respectively. Hatching indicates areas where trends are statistically significant at the 0.05 level, based on the MK test. (a1,a2) annual, (b1,b2) summer, (c1,c2) autumn, (d1,d2) winter, (e1,e2) spring.
Summer (Figure 6(b1)) exhibits a more pronounced downward trend corresponding to a decreasing rate of 1.5% per decade (Figure 6(b2)). Notably, the spatial map of summer resembles that of an annual spatial map. For the transition seasons, RH’s downward trends in autumn in the interior of CAF (Figure 6(c1)) decreased at a rate of by 2.0% per decade while slightly increasing in central Sahel (by 0.50% per decade) (Figure 6(c2)). Conversely, springtime downward trends (Figure 6(e1)) displayed a significant decreasing rate corresponding to 1.0–2.0% per decade, which were more pronounced in CAF, NEAF and Guinean Coast (Figure 6(e2)). In winter, RH’s downward trend was exhibited in CAF, NEAF, and along the Guinean Coast (of southern Cote d’Ivoire, Ghana, Togo, Benin and Nigeria) (Figure 6(d1)). However, the decreasing rate of 1.0% per decade was slower than in summer (Figure 6(d2)). In contrast, small patches along the tripoint of Nigerian, Cameroon and Chad showed an increasing rate of 0.50% per decade (Figure 6(d1,d2)).
Figure 7 presents the temporal trends for TEMP (left panel) and RH (right panel) in the regions’ different timescales. The TEMP linear trends displayed a significant increasing trend at interannual (Figure 7(a1)) and seasonal (Figure 7(b1,c1,d1,e1)) scales from 1980 to 2020, respectively. The magnitude of the interannual linear trend was 0.18 °C per decade, and all the seasonal trends showed varied increasing trend values. Winter (Figure 7(d1)) and spring (Figure 7(e1)) showed similar increasing linear trends of 0.20 °C per decade followed by summer (Figure 7(b1)) and autumn (Figure 7(c1)) at 0.10 °C per decade, respectively. The long-term annual and seasonal RH trends are shown in Figure 7(a2,b2,c2,d2,e2), demonstrating a consistent decline under all timescales. Figure 7(a2) shows a significant annual decline at a rate of 0.65% per decade. The magnitude of the rate of decline varied seasonally, with higher values in spring (r = 0.95% per decade) than in winter (r = 0.82% per decade), summer (r = 0.50% per decade) and autumn (r = 0.24% per decade).
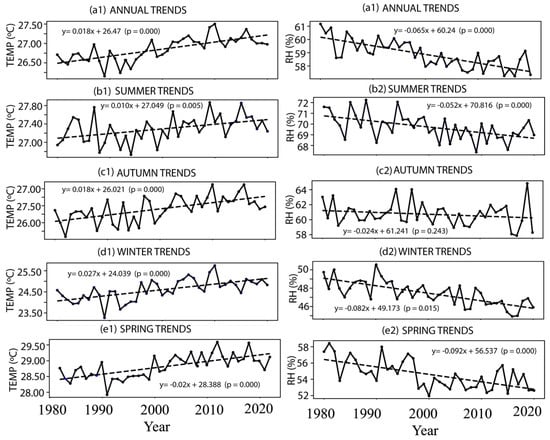
Figure 7.
Temporal distribution of the trends in annual mean TEMP (°C/decade left panel) and RH (%/decade, right panel) over Equatorial Africa from 1980 to 2020. (a1,a2) annual, (b1,b2) summer, (c1,c2) autumn, (d1,d2) winter, (e1,e2) spring.
3.4. Statistical Analysis
Figure 8 displays the interannual and seasonal correlations of RH and TEMP, with values ranging from −0.9 to 0.9. TEMP and RH showed a significant negative correlation, mostly in CAF, NEAF, the Guinea Coast (i.e., Côte d’Ivoire, Ghana and southern Nigeria), and at the boundary of Mali and Mauritania (15–18° N, 10° W–0°) in WAF, with remaining areas showing non-significant low correlation (Figure 8a).
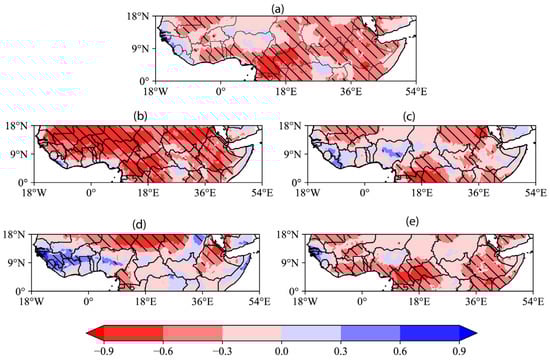
Figure 8.
Spatial distribution of the correlation between RH and TEMP over Equatorial Africa from 1980–2020. Annual (a), summer (b), autumn (c), winter (d), spring (e). Hatching indicates areas where trends are statistically significant at the 0.05 level, based on the Pearson correlation analysis.
Notably, summer displayed a strong negative correlation pronounced over the entire region with patches of non-significant correlation (Figure 8b). The autumn season displayed mostly a moderate significant negative in Mali, northern Sudan, at the borders of Cameroon and Central Africa Republic and tripoint of Ethiopia, Kenya and Somalia, with negative correlation coefficient exceeding 0.60 in Congo Basin and Eritrea (Figure 8c).
In spring, the correlation map resembles the annual map, but the negative correlation values were less pronounced, while the remaining regions displayed non-significant low correlation (Figure 8e). In winter, a mixed correlation of positive and negative coefficients were displayed, with native correlation coefficient exceeding 0.5 in northern Ethiopia and central Sahel (15–18° N, 0–25° E) and positive correlation ranging between 0.30 and 0.8 concentrated in western and central WAF (Figure 8d).
Figure 9 shows the annual and seasonal correlation between the temperature and climate variables (i.e., soil moisture (SM), evapotranspiration (ET) and precipitation (PRE) correlation range between −0.90 and +0.90. The annual correlation is a strong significant negative correlation, with coefficient values exceeding 0.60 in specific areas of Cameroon and in small pockets such as the Ghana–Côte d’Ivoire border, CAR–South Sudan, and Ethiopian Highlands (Figure 9(a1)). Seasonally, the winter trend is similar to the annual pattern (Figure 9(a1,a4)), while spring and autumn show similar correlation patterns (Figure 9(a3,a5)). Summer presents more pronounced negative trends across the whole study area (Figure 9(a2)).
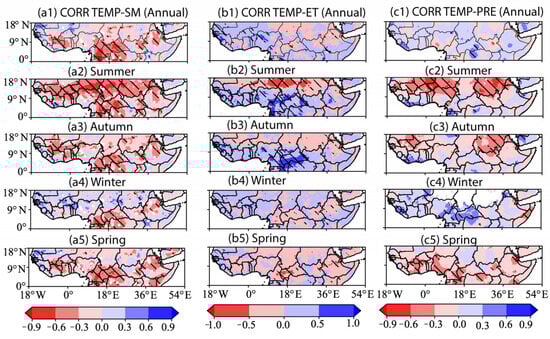
Figure 9.
Spatial distribution of the correlation between TEMP and three climate variables over Equatorial Africa from 1980 to 2020. (a1–a5) TEMP and soil moisture, (b1–b5) TEMP and evapotranspiration and (c1–c5) TEMP ad precipitation. Hatching indicates areas where trends are statistically significant at the 0.05 level, based on the Pearson correlation analysis.
The spatial correlation trends exhibited a high degree of similarity of no significant annual or seasonal correlation between temperature and evapotranspiration in many parts of the region. In summer, significant strong negative correlations appear at the arid region of the Niger–Chad border, and strong positive correlations are observed in the humid areas of Central African Republic (CAR) and Congo (Figure 9(b2)). Autumn (spring) shows mixed trends, with a positive (negative) correlation at the CAR–Congo border (Figure 9(b3,b5)). The non-significant trends of winter (Figure 9(b5)) closely mirrored those in annual data (Figure 9(b1)).
Annually, temperature and precipitation show that only patches of moderate positive correlation are limited to humid areas bordering CAF–Congo (Figure 9(c1)). Summer seasons present a strong negative correlation in the arid region of Central Sahel and Sudan, while moderate positive correlation is limited to humid areas along the borders of Côte d’Ivoire and Liberia, as well as Angola and Gabon (Figure 9(c2)). Autumn shows trends similar to but weaker than summer (Figure 9(c3)). In winter, areas of WAF and CAF present weak positive correlations with significant negative correlation at the tip of Somalia (Figure 9(c4)). Spring shows negative correlations along the humid zones of the Guinean coastal belt, CAF, and parts of NEAF (Figure 9(c5)).
The spatial correlation of temperature and relative humidity with key climate indices (such as Indian Ocean Dipole (IOD), El Niño–Southern Oscillation (ENSO), North Atlantic Oscillation (NAO) and Pacific Decadal Oscillation (PDO)) in the study area, reflecting both positive and negative correlations, is illustrated in Figure 10 and Figure 11. Generally, both spatial patterns of positive and negative correlations trends vary by region and season.
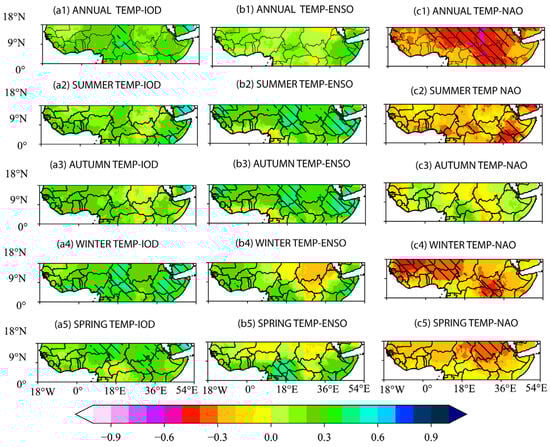
Figure 10.
Spatial distribution of the correlation between TEMP and three teleconnections over Equatorial Africa from 1980 to 2020. (a1–a5) TEMP and IOD, (b1–b5) TEMP and ENSO and (c1–c5). TEMP-NAO Hatching indicates areas where trends are statistically significant at the 0.05 level, based on the Pearson correlation analysis.
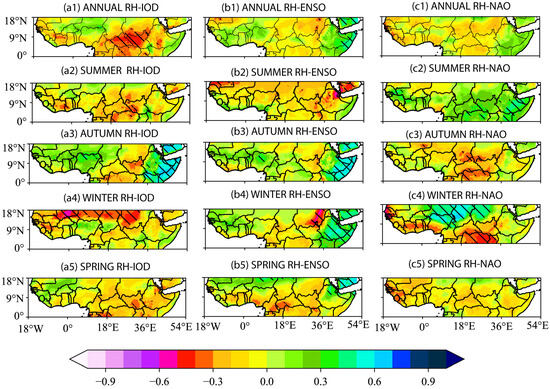
Figure 11.
Spatial distribution of the correlation between RH and three teleconnections over Equatorial Africa from 1980 to 2020. RH and IOD (a1–a5), RH and ENSO (b1–b5) and RH-NAO (c1–c5). Hatching indicates areas where trends are statistically significant at the 0.05 level, based on Pearson correlation analysis.
The positive phase of the IOD is significant and moderately associated with higher annual temperatures in Chad, CAR, and the borders of Nigeria–Cameroon, Ghana–Côte d’Ivoire and Kenya–Somalia (Figure 10(a1)), while the positive phase of ENSO (during El Nino) is limited to Ethiopia–Somalia (Figure 10(b1)). Seasonally, the significant positive phase of the IOD is associated with higher summer temperatures in the coast of Kenya–Somalia (Figure 10(a2)). Regions such as Chad, CAR, Ethiopia–Somalia, Western Sahel (i.e., Senegal–Mauritania–Mali) are significantly associated with higher temperatures during positive phases of ENSO in summer (Figure 10(b2)), autumn (Figure 10(b3)), and mirror IOD in winter (Figure 10(a4)). Positive phases during ENSO in winter mirror spring (Figure 10(b4,b5)) in Ethiopia–Somali except in western CAF (Camerron, CAR and DRC) (Figure 10(b5)).
In contrast, the negative phase of NAO is significantly associated (r > 0.50) with annual higher temperatures in central to eastern Sahelian–Sudano belt (Figure 10(c1)). Seasonally, in Ghana–Cote d’Ivoire, Nigeria–Cameroon and Kenya–Ethiopia–Somalia (Figure 10(c2)), lower summer temperatures (r > 0.50) are associated with negative phases of NAO. Negative phases of NAO are associated with significant lower winter temperatures in arid regions of western and central Sahel and borders of South Sudan–Uganda (Figure 10(c4)), while lower spring temperatures are concentrated in Sudan–Ethiopia–South Sudan, Ethiopia and Eritrea (Figure 10(c5)). However, no significant correlation patterns are observed during autumn NAO, and similar results were found for PDO (Figure S1).
Figure 11 shows that the spatial correlation of relative humidity (RH) with IOD, ENSO, NAO, and PDO. For example, the RH is negatively correlated with IOD in South Sudan and CAR interannually (Figure 11(a1)), and during winter in central Sahel (southern Mali–Niger–Chad and eastern Sudan) (Figure 11(a4)). However, a significant positive correlation during autumn in Ethiopia and Somalia is found (Figure 11(a3)). Similarly, a positive significant correlation of ENSO and RH is confined to Ethiopia–Somalia during the interannual scale (Figure 11(b1)), autumn (Figure 11(b3)), and winter (Figure 11(b4)) seasons, respectively. During the summer season, the positive significant correlation of NAO and RH is more pronounced in Ethiopia–Somalia and CAR–DRC–Uganda (Figure 11(c2)). During the winter season, mixed results of NAO and RH (Figure 11(c4)) are found, with significant positive correlation in central Sahel (Nigeria–Niger–Chad–Sudan) and in CAR and DRC (Figure 11(c4)).
Figure 12 presents a heatmap analysis of varied correlation strength and directions between temperature (TEMP), relative humidity (RH), soil moisture (SM), evapotranspiration (ET) and precipitation (PRE). In Figure 12, we observe that RH showed a varied strength of negative correlation with TEMP (r = −0.65), SM (r = −0.37), ET (r = −0.86), and PRE (r = −0.31) on the annual scale. TEMP exhibited positive correlation with ET (r = 0.79) and PRE (r = 0.43) and negative correlation with SM (r = −0.37). Further, the seasonal trends highlighted similar patterns. Summer and winter RH trends showed similar correlation values (strength and directions) on an annual basis with all climate variables, indicating a comparable pattern of variations. Similarly, the autumn season trends for TEMP with all climate variables closely mirror those for spring relating to direction, despite varied strength. In contrast, RH shows that for transition seasons, the correlation results were mixed (Figure 12).
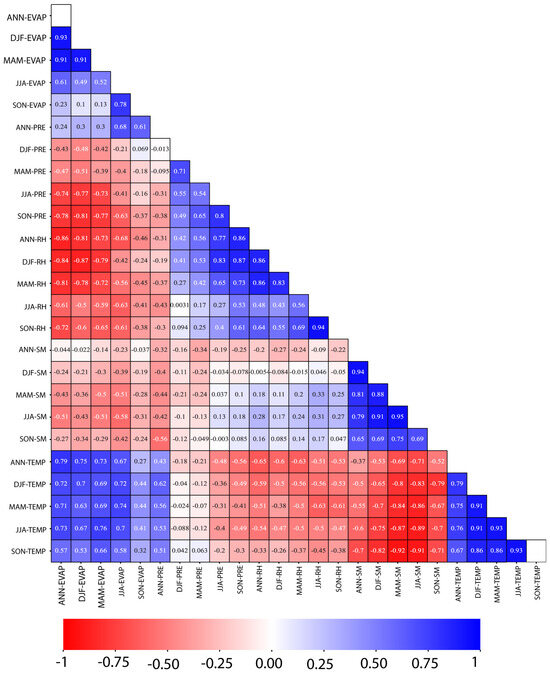
Figure 12.
Interannual and seasonal Pearson correlation coefficients computed over the period 1980–2020. Five (5) essential climate variables such as TEMP, RH, ET, SM and PRE. Significant correlations were achieved when p-value < 0.05.
Multiple linear regression (MLR) was conducted to further investigate the relationships between relative humidity, temperature, with explanatory variables (ENSO. IOD, NAO and PDO). The regression coefficient (β) was used to quantify the magnitude and direction of the relationship between each teleconnection index (e.g., ENSO, IOD, NAO, PDO) and the dependent variable (i.e., TEMP or RH). The coefficient of determination (R2) was used to evaluate the overall explanatory power and goodness-of-fit of the multiple linear regression model. The results presented in Table 2 and Table 3 demonstrate the relationship between annual temperature, relative humidity and predictor variables (ENSO. IOD, NAO and PDO). In Table 2, the overall model explains approximately 28.9% of the variance (R2 = 0.289), and the model was statistically significant (p = 0.0133). NAO also exhibited a significant negative but weak association, with β = −0.260, p = 0.003, suggesting that increases in NAO are associated with a corresponding decrease in the temperature. The remaining individual predictors (ENSO, IOD, NAO and PDO) were not statistically significant (Table 2).
Table 2.
Multiple linear regression (MLR) model examining the influence of large-scale climate indices—ENSO, IOD, NAO, and PDO—on annual temperature (TEMP).
Table 3.
Multiple linear regression (MLR) model examining the influence of large-scale climate indices—ENSO, IOD, NAO, and PDO—on annual relative humidity (RH).
In contrast, the MLR model explains approximately 11.2% of the variance in annual RH. The p-value in Table 3 showed that none of the individual predictors (i.e., ENSO, IOD, NAO and PDO). The overall model explains 11.2% of the variance (R2 = 0.112), and attained statistical significance at the 0.05 level. However, we observed that PDO exhibited a strong non-significant negative association with PDO (β = −0.958, p = 0.232), suggesting potential relevance worth further exploration in future models.
The seasonal multiple linear regression models for TEMP (Table S1) and RH (Table S2) revealed low explanatory power across all seasons (R2 < 0.30). However, TEMP showed relatively stronger seasonal sensitivity to PDO (Table S1, β = 0.958, p < 0.007) and weaker association with NAO (Table S1, β = 0.034, p < 0.007), particularly during winter with overall R2 = 0.294, while RH displayed modest associations with IOD in winter with overall R2 = 0.192 (Table S2, β = 0.673, p < 0.039). Although most of these individual teleconnection indices (ENSO, IOD, PDO, NAO) were not statistically significant, their seasonal variability suggests potential underlying climate signal influences. Further analysis with expanded datasets and multivariate frameworks could clarify these interactions and improve attribution.
4. Discussion
This study investigated long-term changes in air temperature and relative humidity dynamics (i.e., climatology, trends and the relationships) with other climatic variables (precipitation, evapotranspiration, and soil moisture) over Equatorial Africa from 1980 to 2020 using multiple statistical techniques. Validation was carried out to evaluate the performance of various gridded datasets over Equatorial Africa on an annual timescale. The comparison of validation metrics (r, RMSD, and SD) highlighted the performance differences between the datasets. The results confirm that the ERA5 and CRU datasets used in this study are reliable, supporting their use for climate trend analysis in the region, consistent with previous studies [62,65,73].
The spatial patterns revealed the spatial heterogeneity of mean temperatures (Figure 3(a1–a5)) and mean relative humidity (Figure 3(b1–b5)). Generally, the Sahelian–Sudano belt and equatorial coastal East Africa (i.e., southern and central coast of Kenya, northern and central coastal region of Tanzania and the southern coastline of Somalia), which occupies semi-arid and arid conditions, exhibited higher mean temperatures, consistent with previous studies that found temperatures above 30 °C in those regions [95,96]. In contrast, areas within the humid equatorial belt, such as the Guinean coastal belt, the Congo Basin and highly elevated regions such as the Ethiopian Highlands, showed lower mean temperatures, consistent with previous studies [96].
During this same period, the relative humidity displayed spatial heterogeneity with distinct latitudinal difference (Figure 3(b1–b5)). This spatial pattern of relative humidity values varied in terms of region and seasons, aligning with Dia [29]. In terms of regional difference, very high relative humidity in the humid tropical regions of Central Africa (75–80%) and West Africa (70–80%), due to the monsoon dynamics, dense forest canopy and the intertropical convergence zone (ITCZ) in the region [97] coupled with temperature variability (Figure 3(a1–a5)), increases atmospheric moisture via high evapotranspiration rate [98,99]. It is interesting but not surprising to note that the relative humidity patterns found in this study resemble the precipitation and evapotranspiration patterns in the regions found in [98,100]. Similarly, the very high values in highly elevated regions such as the Ethiopian Highlands outside the ITCZ belt are related to temperature variability, seasonal rains, altitudes, and monsoon patterns [29,101,102]. In contrast, the lower relative humidity in the Sahelian–Sudano belt and the equatorial coastal East Africa, may be explained by the higher temperatures (Figure 3(a1)) coupled with sparse vegetation covers, and low precipitation patterns to limit evaporative cooling consistent with previous studies [57,99].
The main causes of the seasonal behavior of relative humidity distribution are explored. The high relative humidity is maintained in the humid equatorial belt across the four seasons (Figure 3(b1–b5)). The main cause for this seasonality varied for regions within the ITCZ belt (i.e., West Africa and Central Africa) and regions outside the ITCZ belt (i.e., East Africa). For example, seasonally, Central Africa’s relative humidity is due to the dense rainforest and high evapotranspiration, West Africa’s is due to ITCZ movement and monsoon dynamics, and East Africa’s is due to seasonal rains and monsoon patterns, consistent with previous studies [29,101,103,104,105]. The transition seasons (i.e., autumn and spring) maintain high residual moisture due to monsoon dynamics, and ITCZ retreats southwards (northwards) [97,106,107]. During the winter season (Figure 3(b4)), the dry season in the Sahelian–Sudano regions (low precipitation and temperature variability) explains the lower relative humidity values [29,108,109].
Our spatial distribution of linear trends varied greatly, where most regions exhibited different trend values depending on the scale (annual or seasonal) (Figure 5(a1,b1,c1,d1,e1)).
The seasonal warming rates observed across the Sahelian–Sudano belt and equatorial East Africa exhibit notable spatial heterogeneity, with winter (0.27 °C decade−1) and spring (0.20 °C decade−1) warming exceeding annual and summer rates (Figure 7(a1,b1,c1,d1,e1)). This aligns with prior findings by Oueslati et al. [110] and Collins [96], and corroborates regional trends reported in [110,111]. In addition, the warming trends identified in this study are consistent with other previous findings across Africa. For instance, Loua et al. [94] reported a 0.21 °C per decade increase in Conakry between 1960 and 2016, indicating sustained warming in West Africa. Similarly, Demissie and Gebrechorkos [112] observed average annual TEMP increases of up to 0.6 °C per decade, while Nicholson et al. [113] estimated a continent-wide rise of approximately 0.5 °C, underscoring a coherent warming signal across diverse African regions. Warming in arid and semi-arid zones, particularly in the western and central Sudano–Sahelian belt (>0.2 °C decade−1), is consistent with established land–atmosphere feedbacks. Specifically, limited soil moisture reduces latent heat flux and increases sensible heating, amplifying surface temperature rise [20]. In drier regions, this effect is compounded by enhanced greenhouse gas radiative forcing due to reduced spectral overlap with water vapor [22]. Conversely, humid regions may be linked to key regional drivers such as seasonal migration of ITCZ, while changes in vegetation phenology and its associated evapotranspiration patterns contribute to these spatial patterns [20,114].
Relative humidity exhibited high spatial heterogeneity of trends, where the majority of areas experience a strong negative trend, exhibiting rates exceeding 2% per decade in the eastern Sudano–Sahelian belt, the Guinea coastal belt of WAF, the Congo Basin of CAF and the NEAF, with enhanced evaporation or more complex land–atmosphere interaction [20,115]. Mixed trends of positive and negative relative humidity values in western and central Sudano–Sahelian belt, with pockets of significant positive seasonal trends larger than that of annual trend along the boundary of Nigeria, and Niger [116,117]. In contrast, the eastern Sudano–Sahelian belt showed a strong significant negative trend in M-K and Sen slope terms. Generally, warming increases atmospheric moisture demand in arid and semi-arid regions. Thus, it is plausible that moisture supply (i.e., precipitation and evapotranspiration) increases proportionally to offset faster warming in western and central relative to the eastern Sudano–Sahelian belt, where rising temperatures enhances evapotranspiration, which further reduces surface and near-surface moisture, which contributes to lower RH [21,118]. The sharp contrast between the western and eastern Sudano–Sahelian belt underscores the regional specificity of atmospheric drying, consistent with previous studies [21,118]. This implies that these subregions respond differently to continuous warming and hydrological stress [116]. The seasonal variability observed in temporal trend analysis showed declining relative humidity trends were most pronounced during seasons with exhibiting intensified warming (Figure 7), consistent with previous studies [21,118].
This study’s analysis of the correlations between temperature and relative humidity, and with other climate variables (precipitation, evapotranspiration, and soil moisture). Generally, strong negative correlations between relative humidity and temperature across the entire region suggest a tight coupling between thermal and moisture conditions [116]. In addition, correlation analysis of temperature showed negative correlations with soil moisture, evapotranspiration and precipitations (Figure 9). However, generally, the areas with significant changes in correlational analysis at the annual scale do not always experience consistent changes depending on the season, largely supporting the spatial correlation analysis in Figure 9. For example, the strong negative correlation between TEMP and SM, mostly in the Congo Basin region, indicates that warming is closely associated with moisture depletion (Figure 9(a1–a5)) at the land surface, primarily through enhanced evaporative demand (Figure 9(b1–b5)), which aligns with past studies [21,118]. This surface drying contributes directly to the strong negative correlation observed between TEMP and RH in the region, as reduced soil moisture limits evapotranspiration and near-surface moisture availability [119]. However, positive correlation between temperature, evapotranspiration, and precipitation in Congo Basin likely reflects convective feedback in the region, where warming enhances moisture fluxes but cannot fully offset soil drying under sustained heat stress [21,118]. In NEAF, the strong negative correlation is likely due to thermodynamic effects—warmer air increases moisture-holding capacity without a proportional rise in actual vapor content as the correlation analysis between temperature with evapotranspiration Figure 9(b1–b5) and precipitation (Figure 9(c1–c5)) showed mixed signal to no clear trends, suggesting weak coupling between surface conditions and atmospheric moisture [97]. In contrast, western Africa exhibits more complex land–atmosphere interactions. The mixed correlations are a result of temperature with soil moisture, evapotranspiration, and precipitation, especially in monsoon-affected southern areas, indicating rising temperatures that often coincide with increased rainfall and moisture input, helping sustain surface moisture and atmospheric humidity. Consequently, the concurrent association of climate indices (such as IOD, ENSO, NAO and PDO) with temperature and relative humidity was assessed, based on their significant effects on West and East African monsoon rainfall and moisture availability [97]. Further multivariant analysis of temperature and relative humidity with teleconnection indices (ENSO, IOD, NAO, and PDO) revealed some seasonal variability. Generally, annual temperature variance was explained by 28.9% (R2 = 0.289). NAO showed a strong negative association with temperature, with a regression coefficient of β = −0.96 (p = 0.003), indicating a statistically significant inverse effect, while other indices (ENSO, IOD, PDO) were not significant. For annual RH, only 11.2% of variance was explained (R2 = 0.112), with PDO exhibiting a non-significant negative relationship (β-0.960, p = 0.232). Seasonal models showed low explanatory power (R2 < 0.030), with temperature more sensitive to PDO in winter (β = 0.958, p < 0.007) and RH modestly significantly associated with IOD (β = 0.673, p < 0.039). These results suggest the need for further investigation with expanded datasets to clarify seasonal climate variability. In a nutshell, these analyses bring out the increasing role of the phases of the climate indices in influencing rainfall patterns and subsequent moisture availability (relative humidity) in the study region, consistent with previous studies [120,121,122]. Largely, the temperature–relative humidity dynamics are explained by these climate indices based on their correlation analysis, and the interactions are complex in seasonal monsoonal influence by sustaining moisture levels [74], playing an important role in regional precipitation patterns.
The observed trends and correlations in this study have significant ecological and socio-economic implications, particularly in the context of agriculture, water resources, and thermal stress exposure in the study region. A simultaneous occurrence of high temperature and large RH affects human health negatively and leads to higher mortality [37]. In areas with humid climate, the prevailing high RH delays the drying of building materials and shortens the service life of structures exposed to weather [123]. This study’s analysis provides crucial insights into the dynamic interactions between climate and vegetation in the region. All these results demonstrate the value of integrating multiple statistical methods (i.e., monotonic trend detections, slope estimation, seasonal cycle analysis, spatial diagnostic, change-point detection, and climate correlations) to characterize both gradual and abrupt shifts in temperature and relative humidity regimes. This comprehensive approach provides a robust basis for interpreting climate driven land surface transformation and supports developing targeted strategies in tropical regions.
5. Conclusions
This study investigated the dynamics of temperature and relative humidity in Equatorial Africa using various statistical methods and data sources, including observational temperature and precipitation (TEMP, PRE) data from CRU, reanalysis-based relative humidity (RH) from ERA5, and satellite-derived evapotranspiration (ET) and soil moisture (SM) from GLEAM, covering the period from 1980 to 2020. The validation results confirm that the ERA5 and CRU datasets provide reliable performance for climate trend analysis over Equatorial Africa, showing strong agreement with other gridded datasets.
The analysis revealed spatial heterogeneity in temperature and relative humidity trends, with notable differences between annual and seasonal patterns, particularly in the arid and semi-arid regions of the Sahelian–Sudano belt and Northeast Africa (NEAF). In the Guinean coastal belt of West Africa (WAF) and the Congo Basin in Central Africa (CAF), relative humidity exhibited decreasing trends during autumn and spring, while increasing in summer and winter, contributing to significant changes at the annual scale. Temperature trends were more widespread than relative humidity trends, with warming observed in arid and semi-arid regions, including the Sahelian–Sudano belt and NEAF (e.g., Horn of Africa), which aligned with negative trends in relative humidity, with the largest decreases occurring in these regions.
Correlation analysis showed a strong negative relationship between temperature and relative humidity (r > 0.60), with varying associations with evapotranspiration, soil moisture, and precipitation across regions and scales (annual and seasonal). Significant spatial correlations were concentrated in the arid regions of the Sahelian–Sudano belt, parts of NEAF, and humid regions like the Guinean coastal belt and the Congo Basin. Some regions showing significant annual changes did not exhibit consistent seasonal variations. The spatial correlation between temperature and climate indices (e.g., IOD, ENSO, NAO, and PDO) showed positive regional relationships, while the correlation of relative humidity displayed both positive and negative associations, affecting regional moisture patterns. These findings suggest that the effects of climatic indices on temperature and relative humidity vary significantly by region and season. The MLR results indicate that while the teleconnection indices (ENSO, IOD, NAO, and PDO) show some seasonal variability, their overall contribution to explaining temperature and relative humidity trends is limited. However, certain seasonal relationships, particularly with PDO, suggest potential influences on regional climate dynamics, warranting further investigation.
The observed trends and correlations have significant ecological and socio-economic implications, particularly for agriculture, water resources, and thermal stress exposure in the region. This study identifies the physical mechanisms behind the observed temperature and relative humidity variability, offering a comprehensive understanding of how these variables and their related indices impact climate dynamics. However, as correlation does not imply causality, future research should focus on establishing causal mechanisms to better understand these climatic interactions.
Supplementary Materials
The following supporting information can be downloaded at: https://www.mdpi.com/article/10.3390/atmos16070828/s1, Figure S1: Spatial distribution of the correlation between TEMP and teleconnections from 1980 to 2020. TEMP and PDO (a1–e5), and TEMP and NAO (b1–b5). Hatched lines denote significance level (p < 005). Figure S2: Same as Figure S1 but for RH and IOD (a1–e5), and RH and ENSO (b1–b5). Figure S3: Same as Figure S1 but for RH and PDO (a1–e5), and RH and NAO (b1–b5); Table S1: MLR results for seasonal TEMP anomalies (dependent variable) as influenced by ENSO, IOD, NAO, and PDO (independent variables). Table S2: MLR results for winter seasonal RH anomalies (dependent variable) as influenced by ENSO, IOD, NAO, and PDO (independent variables).
Author Contributions
Conceptualization, I.K.N.; methodology, I.K.N., F.K.O. and N.A.P.; formal analysis, I.K.N., F.K.O. and N.A.P.; Data curation, I.K.N., F.K.O. and A.A.S.C.; Visualization, F.K.O., N.A.P., S.K.F., T.A.-D. and A.A.S.C.; writing—original draft preparation, I.K.N.; writing—review and editing, F.K.O., N.A.P., S.K.F., T.A.-D., and A.A.S.C. All authors have read and agreed to the published version of the manuscript.
Funding
This research received no external funding.
Institutional Review Board Statement
Not applicable.
Informed Consent Statement
Not applicable.
Data Availability Statement
The original contributions presented in this study are included in the article/Supplementary Material. Further inquiries can be directed to the corresponding author(s).
Acknowledgments
The data used in this study is public, and the access links to the original data set are the ECMWF database (https://cds.climate.copernicus.eu/datasets) (accessed on 2 August 2024), Climate Research Unit (CRU) website (http://www.cru.uea.ac.uk) (accessed on 2 August 2024), GLEAM website (www.gleam.eu, accessed on 2 August 2024) and NOAA National Climatic Data Center (NCDC) website (https://www.ncdc.noaa.gov/teleconnections/ accessed on 2 August 2024).
Conflicts of Interest
The authors declare no conflicts of interest.
References
- Douville, H.; Raghavan, K.; Renwick, J.; Allan, R.P.; Arias, P.A.; Barlow, M.; Cerezo-Mota, R.; Cherchi, A.; Gan, T.Y.; Gergis, J.; et al. Water Cycle Changes. In Climate Change 2021: The Physical Science Basis; Contribution of Working Group I to the Sixth Assessment Report of the Intergovernmental Panel on Climate Change; Cambridge University Press: Cambridge, UK, 2021; Chapter 8; Available online: https://centaur.reading.ac.uk/101319/1/101319.pdf (accessed on 2 April 2025).
- O’Gorman, P.A.; Muller, C.J. How closely do changes in surface and column water vapor follow Clausius–Clapeyron scaling in climate change simulations? Environ. Res. Lett. 2010, 5, 025207. [Google Scholar] [CrossRef]
- Orlowsky, B.; Seneviratne, S.I. Global changes in extreme events: Regional and seasonal dimension. Clim. Change 2012, 110, 669–696. [Google Scholar] [CrossRef]
- IPCC. Climate Change 2021: The Physical Science Basis; Contribution of Working Group I to the Sixth Assessment Report of the Intergovernmental Panel on Climate Change; IPCC: Geneva, Switzerland, 2021. [Google Scholar]
- Seneviratne, S.I.; Lüthi, D.; Litschi, M.; Schär, C. Land–atmosphere coupling and climate change in Europe. Nature 2006, 443, 205–209. [Google Scholar] [CrossRef] [PubMed]
- Tran, T.-N.-D.; Lakshmi, V. Enhancing human resilience against climate change: Assessment of hydroclimatic extremes and sea level rise impacts on the Eastern Shore of Virginia, United States. Sci. Total Environ. 2024, 947, 174289. [Google Scholar] [CrossRef] [PubMed]
- Ekra, A.T.; Hamed, M.M.; Ali, Z.; Muhammad, M.K.I.B.; Khan, M.M.H.; Kamruzzaman, M.; Shahid, S. Changes in human heat discomfort and its drivers in Bangladesh. Urban Clim. 2024, 55, 101884. [Google Scholar] [CrossRef]
- Ganesh, G.A.; Sinha, S.L.; Verma, T.N.; Dewangan, S.K. Investigation of indoor environment quality and factors affecting human comfort: A critical review. Build. Environ. 2021, 204, 108146. [Google Scholar] [CrossRef]
- Baldwin, J.W.; Benmarhnia, T.; Ebi, K.L.; Jay, O.; Lutsko, N.J.; Vanos, J.K. Humidity’s role in heat-related health outcomes: A heated debate. Environ. Health Perspect. 2023, 131, 055001. [Google Scholar] [CrossRef]
- Dwamena, H.A.; Tawiah, K.; Akuoko Kodua, A.S. The effect of rainfall, temperature, and relative humidity on the yield of cassava, yam, and maize in the Ashanti region of Ghana. Int. J. Agron. 2022, 2022, 9077383. [Google Scholar] [CrossRef]
- Do, S.K.; Nguyen, B.Q.; Tran, V.N.; Grodzka-Łukaszewska, M.; Sinicyn, G.; Lakshmi, V. Investigating the future flood and drought shifts in the transboundary srepok river basin using CMIP6 projections. IEEE J. Sel. Top. Appl. Earth Obs. Remote Sens. 2024. [Google Scholar]
- Wang, Y.; Liu, K.; Liu, Y.; Wang, D.; Liu, J. The impact of temperature and relative humidity dependent thermal conductivity of insulation materials on heat transfer through the building envelope. J. Build. Eng. 2022, 46, 103700. [Google Scholar] [CrossRef]
- Zhang, S.; Lin, Z. Effective Moisture Temperature: Ventilation performance index accounting for effects of air temperature and relative humidity on thermal comfort. Build. Environ. 2023, 10, 110625. [Google Scholar] [CrossRef]
- Xu, X.; Yu, H.; Sun, Q.; Tam, V.W. A critical review of occupant energy consumption behavior in buildings: How we got here, where we are, and where we are headed. Renew. Sustain. Energy Rev. 2023, 182, 113396. [Google Scholar] [CrossRef]
- Ahmed, O.; Sezer, N.; Ouf, M.; Wang, L.L.; Hassan, I.G. State-of-the-art review of occupant behavior modeling and implementation in building performance simulation. Renew. Sustain. Energy Rev. 2023, 185, 113558. [Google Scholar] [CrossRef]
- Chenoweth, D.A.; Schlaepfer, D.R.; Chambers, J.C.; Brown, J.L.; Urza, A.K.; Hanberry, B.; Board, D.; Crist, M.; Bradford, J.B. Ecologically relevant moisture and temperature metrics for assessing dryland ecosystem dynamics. Ecohydrology 2023, 16, e2509. [Google Scholar] [CrossRef]
- Tapas, M.R.; Etheridge, R.; Finlay, C.G.; Peralta, A.L.; Bell, N.; Xu, Y.; Lakshmi, V. A methodological framework for assessing sea level rise impacts on nitrate loading in coastal agricultural watersheds using SWAT+: A case study of the Tar-Pamlico River basin, North Carolina, USA. Sci. Total Environ. 2024, 951, 175523. [Google Scholar] [CrossRef]
- Nohrstedt, D.; Hileman, J.; Mazzoleni, M.; Di Baldassarre, G.; Parker, C.F. Exploring disaster impacts on adaptation actions in 549 cities worldwide. Nat. Commun. 2022, 13, 3360. [Google Scholar] [CrossRef] [PubMed]
- Guardaro, M.; Hondula, D.M.; Ortiz, J.; Redman, C. Adaptive capacity to extreme urban heat: The dynamics of differing narratives. Clim. Risk Manag. 2022, 35, 100415. [Google Scholar] [CrossRef]
- Seneviratne, S.I.; Corti, T.; Davin, E.L.; Hirschi, M.; Jaeger, E.B.; Lehner, I.; Orlowsky, B.; Teuling, A.J. Investigating soil moisture–climate interactions in a changing climate: A review. Earth Sci. Rev. 2010, 99, 125–161. [Google Scholar] [CrossRef]
- Seneviratne, S.I.; Nicholls, N.; Easterling, D.; Goodess, C.M.; Kanae, S.; Kossin, J.; Luo, Y.; Marengo, J.; McInnes, K.; Rahimi, M.; et al. Changes in climate extremes and their impacts on the natural physical environment. In Managing the Risks of Extreme Events and Disasters to Advance Climate Change Adaptation. A Special Report of Working Groups I and II of the Intergovernmental Panel on Climate Change (IPCC); Field, C.B., Barros, V., Stocker, T.F., Qin, D., Dokken, D.J., Ebi, K.L., Mastrandrea, M.D., Mach, K.J., Plattner, G.K., Allen, E.A., Eds.; Cambridge University Press: Cambridge, UK; New York, NY, USA, 2012; pp. 109–230. [Google Scholar]
- Ramanathan, V.; Collins, W. Thermodynamic regulation of ocean warming by cirrus clouds deduced from observations of the 1987 El Niño. Nature 1991, 351, 27–32. [Google Scholar] [CrossRef]
- Douville, H.; Qasmi, S.; Ribes, A.; Bock, O. Global warming at near-constant tropospheric relative humidity is supported by observations. Commun. Earth Environ. 2022, 3, 237. [Google Scholar] [CrossRef]
- Kliengchuay, W.; Mingkhwan, R.; Kiangkoo, N.; Suwanmanee, S.; Sahanavin, N.; Kongpran, J.; Aung, H.W.; Tantrakarnapa, K. Analyzing temperature, humidity, and precipitation trends in six regions of Thailand using innovative trend analysis. Sci. Rep. 2024, 14, 7800. [Google Scholar] [CrossRef] [PubMed]
- Li, L.; Zha, Y. Mapping relative humidity, average and extreme temperature in hot summer over China. Sci. Total Environ. 2018, 615, 875–881. [Google Scholar] [CrossRef] [PubMed]
- Du, J.; Cooper, F.; Fueglistaler, S. Statistical analysis of global variations of atmospheric relative humidity as observed by AIRS. J. Geophys. Res. Atmos. 2012, 117, D12315. [Google Scholar] [CrossRef]
- Moradi, I.; Arkin, P.; Ferraro, R.; Eriksson, P.; Fetzer, E. Diurnal variation of tropospheric relative humidity in tropical regions. Atmos. Chem. Phys. 2016, 16, 6913–6929. [Google Scholar] [CrossRef]
- Putatunda, I. Multiscale temporal analysis and trends of relative humidity over India and Indian Ocean. J. Atmos. Sol.-Terr. Phys. 2021, 218, 105551. [Google Scholar] [CrossRef]
- Dai, A. Recent Climatology, Variability, and Trends in Global Surface Humidity. J. Clim. 2006, 19, 3589–3606. [Google Scholar] [CrossRef]
- Willett, K.; Jones, P.; Thorne, P.; Gillett, N. A comparison of large scale changes in surface humidity over land in observations and CMIP3 GCMS. Environ. Res. Lett. 2010, 5, 025210. [Google Scholar] [CrossRef]
- Willett, K.M.; Gillett, N.P.; Jones, P.D.; Thorne, P.W. Attribution of observed surface humidity changes to human influence. Nature 2007, 449, 710–712. [Google Scholar] [CrossRef]
- Willett, K.M.; Jones, P.D.; Gillett, N.P.; Thorne, P.W. Recent changes in surface humidity: Development of the HadCRUH dataset. J. Clim. 2008, 21, 5364–5383. [Google Scholar] [CrossRef]
- Yang, Y.; Zhang, Y.; Zhang, H.; Huang, X. Quantitative reconstruction of the relative humidity by a coupled δ18O-δ2H approach during the Younger Dryas in central China. Quat. Sci. Rev. 2023, 299, 107879. [Google Scholar] [CrossRef]
- Tsuji, H.; Nakatsuka, T.; Yamazaki, K.; Takagi, K. Summer relative humidity in northern Japan inferred from δ18O values of the tree ring in (1776–2002 A.D.): Influence of the paleoclimate indices of atmospheric circulation. J. Geophys. Res. Atmos. 2008, 113, D18103. [Google Scholar] [CrossRef]
- Davis, R.E.; McGregor, G.R.; Enfield, K.B. Humidity: A review and primer on atmospheric moisture and human health. Environ. Res. 2016, 144, 106–116. [Google Scholar] [CrossRef]
- Fasullo, J.T. Robust land–ocean contrast in energy and water cycle feedbacks. J. Clim. 2010, 23, 4677–4693. [Google Scholar] [CrossRef]
- Fischer, E.M.; Schär, C. Consistent geographical patterns of changes in high-impact European heatwaves. Nat. Geosci. 2010, 3, 398–403. [Google Scholar] [CrossRef]
- Mortuza, M.R.; Selmi, S.; Khudri, M.M.; Ankur, A.K.; Rahman, M.M. Evaluation of temporal and spatial trends in relative humidity and dew point temperature in Bangladesh. Arab. J. Geosci. 2014, 7, 5037–5050. [Google Scholar] [CrossRef]
- Fattah, M.A.; Gupta, S.D.; Farouque, M.Z.; Ghosh, B.; Morshed, S.R.; Chakraborty, T.; Kafy, A.A.; Rahman, M.T. Spatiotemporal characterization of relative humidity trends and influence of climatic factors in Bangladesh. Heliyon 2023, 9, e19991. [Google Scholar] [CrossRef]
- Xie, B.; Zhang, Q.; Ying, Y. Trends in Precipitable Water and Relative Humidity in China: 1979–2005. J. Appl. Meteorol. Climatol. 2011, 50, 1985–1994. [Google Scholar] [CrossRef]
- Asadi, M.; Karami, M. Modeling of relative humidity trends in Iran. Model. Earth Syst. Environ. 2022, 8, 1035–1045. [Google Scholar] [CrossRef]
- Um, M.-J.; Kim, Y. Spatial analysis of relative humidity during ungauged periods in a mountainous region. Theor. Appl. Climatol. 2017, 129, 1157–1166. [Google Scholar] [CrossRef]
- Farooq, Z.; Kumar, R. Spatial and temporal trend analysis of relative humidity in the Himalayan region: A case study. Arab. J. Geosci. 2021, 14, 2237. [Google Scholar] [CrossRef]
- Jiang, Y.; Zhou, L.; Roundy, P.E.; Hua, W.; Raghavendra, A. Increasing influence of Indian Ocean dipole on precipitation over central equatorial Africa. Geophys. Res. Lett. 2021, 48, e2020GL092370. [Google Scholar] [CrossRef]
- Nooni, I.; Ogou, F.; Saidou Chaibou, A.A.; Prempeh, N.; Atta-Darkwa, T.; Paing, K.; Fianko, S.K.; Jin, Z.; Yu, X. Links Between Teleconnection Patterns and Mean Precipitation in Africa and the Arabian Peninsula from 1903 to 2023. Int. J. Climatol. 2025, e70001. [Google Scholar] [CrossRef]
- MacLeod, D.; Kolstad, E.W.; Michaelides, K.; Singer, M.B. Sensitivity of rainfall extremes to unprecedented Indian Ocean Dipole events. Geophys. Res. Lett. 2024, 51, e2023GL105258. [Google Scholar] [CrossRef]
- Berihu, T.; Chen, W.; Wang, L. Unravelling atmospheric factors associated with long rain precipitation variability in East Africa. Clim. Dyn. 2025, 63, 111. [Google Scholar] [CrossRef]
- Lüdecke, H.-J.; Müller-Plath, G.; Wallace, M.G.; Lüning, S. Decadal and multidecadal natural variability of African rainfall. J. Hydrol. Reg. Stud. 2021, 34, 100795. [Google Scholar] [CrossRef]
- Palmer, P.I.; Wainwright, C.M.; Dong, B.; Maidment, R.I.; Wheeler, K.G.; Gedney, N.; Hickman, J.E.; Madani, N.; Folwell, S.S.; Abdo, G.; et al. Drivers and impacts of Eastern African rainfall variability. Nat. Rev. Earth Environ. 2023, 4, 254–270. [Google Scholar] [CrossRef]
- Park, S.; Kang, D.; Yoo, C.; Im, J.; Lee, M.I. Recent ENSO Influence on East African Drought during Rainy Seasons through the Synergistic Use of Satellite and Reanalysis Data. ISPRS J. Photogramm. Remote Sens. 2020, 162, 17–26. [Google Scholar] [CrossRef]
- Nicholson, S.E. Climate and climatic variability of rainfall over eastern Africa. Rev. Geophys. 2017, 55, 590–635. [Google Scholar] [CrossRef]
- Black, E.; Slingo, J.; Sperber, K. An Observational Study of the Relationship between Excessively Strong Short Rains in Coastal East Africa and Indian Ocean SST. Mon. Weather Rev. 2003, 131, 74–94. [Google Scholar] [CrossRef]
- Hurrell, J.W.; Kushnir, Y.; Ottersen, G.; Visbeck, M. An overview of the North Atlantic oscillation. Geophys. Monogr.-Am. Geophys. Union 2003, 134, 1–36. [Google Scholar]
- Adamu, M.; Gallant, A.; McGregor, S. Decadal-scale variations in extreme precipitation and implications for seasonal scale drought. Clim. Dyn. 2022, 58, 1–16. [Google Scholar] [CrossRef]
- Adamu, M.; McGregor, S.; Gallant, A. Sea surface temperature driven modulation of decadal co-variability in mean and extreme precipitation. Environ. Res. Lett. 2024, 19, 034045. [Google Scholar] [CrossRef]
- Alexander, L.V. Global observed long-term changes in temperature and precipitation extremes: A review of progress and limitations in IPCC assessments and beyond. Weather. Clim. Extrem. 2016, 11, 4–16. [Google Scholar] [CrossRef]
- Sultan, B.; Janicot, S. Abrupt shift of the ITCZ over West Africa and intra-seasonal variability. Geophys. Res. Lett. 2000, 27, 3353–3356. [Google Scholar] [CrossRef]
- Harris, I.; Jones, P.D.; Osborn, T.J.; Lister, D.H. Updated high-resolution grids of monthly climatic observations—The CRU TS3.10 Dataset. Int. J. Climatol. 2014, 34, 623–642. [Google Scholar] [CrossRef]
- Funk, C.; Hoell, A.; Shukla, S.; Husak, G.; Michaelsen, J. The East African monsoon system: Seasonal climatologies and recent variations. In The Monsoons and Climate Change: Observations and Modeling; Springer: Cham, Switzerland, 2016; pp. 163–185. [Google Scholar]
- Nooni, I.K.; Ogou, F.K.; Hagan, D.F.T.; Saidou Chaibou, A.A.; Prempeh, N.A.; Nakoty, F.M.; Jin, Z.; Lu, J. The Relationship between Changes in Hydro-Climate Factors and Maize Crop Production in the Equatorial African Region from 1980 to 2021. Atmosphere 2024, 15, 542. [Google Scholar] [CrossRef]
- Beck, H.E.; McVicar, T.R.; Vergopolan, N.; Berg, A.; Lutsko, N.J.; Dufour, A.; Zeng, Z.; Jiang, X.; van Dijk, A.I.; Miralles, D.G. High-resolution (1 km) Köppen-Geiger maps for 1901–2099 based on constrained CMIP6 projections. Sci. Data 2023, 10, 724. [Google Scholar] [CrossRef]
- Hersbach, H.; Bell, B.; Berrisford, P.; Hirahara, S.; Horányi, A.; Muñoz-Sabater, J.; Nicolas, J.; Peubey, C.; Radu, R.; Schepers, D.; et al. The ERA5 global reanalysis. Q. J. R. Meteorol. Soc. 2020, 146, 1999–2049. [Google Scholar] [CrossRef]
- Bell, B.; Hersbach, H.; Simmons, A.; Berrisford, P.; Dahlgren, P.; Horányi, A.; Muñoz-Sabater, J.; Nicolas, J.; Radu, R.; Schepers, D. The ERA5 global reanalysis: Preliminary extension to 1950. Q. J. R. Meteorol. Soc. 2021, 147, 4186–4227. [Google Scholar] [CrossRef]
- Soci, C.; Hersbach, H.; Simmons, A.; Poli, P.; Bell, B.; Berrisford, P.; Horányi, A.; Muñoz-Sabater, J.; Nicolas, J.; Radu, R.; et al. The ERA5 global reanalysis from 1940 to 2022. Q. J. R. Meteorol. Soc. 2024, 150, 4014–4048. [Google Scholar] [CrossRef]
- Harris, I.; Osborn, T.J.; Jones, P.; Lister, D. Version 4 of the CRU TS monthly high-resolution gridded multivariate climate dataset. Sci. Data 2020, 7, 109. [Google Scholar] [CrossRef] [PubMed]
- Malsy, M.; aus der Beek, T.; Flörke, M. Evaluation of large-scale precipitation data sets for water resources modelling in Central Asia. Environ. Earth Sci. 2015, 73, 787–799. [Google Scholar] [CrossRef]
- Gulakhmadov, A.; Chen, X.; Gulakhmadov, M.; Kobuliev, Z.; Gulahmadov, N.; Peng, J.; Li, Z.; Liu, T. Evaluation of the CRU TS3.1, APHRODITE_V1101, and CFSR Datasets in Assessing Water Balance Components in the Upper Vakhsh River Basin in Central Asia. Atmosphere 2021, 12, 1334. [Google Scholar] [CrossRef]
- Vaghefi, S.A.; Abbaspour, N.; Kamali, B.; Abbaspour, K.C. A toolkit for climate change analysis and pattern recognition for extreme weather conditions–Case study: California-Baja California Peninsula. Environ. Model. Softw. 2017, 96, 181–198. [Google Scholar] [CrossRef]
- Touseef, M.; Chen, L.; Yang, K.; Chen, Y. Long-Term Rainfall Trends and Future Projections over Xijiang River Basin, China. Adv. Meteorol. 2020, 2020, 6852148. [Google Scholar] [CrossRef]
- Martens, B.; Miralles, D.G.; Lievens, H.; Van Der Schalie, R.; De Jeu, R.A.; Fernández-Prieto, D.; Beck, H.E.; Dorigo, W.A.; Verhoest, N.E. GLEAM v3: Satellite-based land evaporation and root-zone soil moisture. Geosci. Model Dev. 2017, 10, 1903–1925. [Google Scholar] [CrossRef]
- Miralles, D.; De Jeu, R.; Gash, J.; Holmes, T.; Dolman, A. Magnitude and variability of land evaporation and its components at the global scale. Hydrol. Earth Syst. Sci. 2011, 15, 967–981. [Google Scholar] [CrossRef]
- Miralles, D.G.; Holmes, T.R.H.; De Jeu, R.A.M.; Gash, J.H.; Meesters, A.G.C.A.; Dolman, A.J. Global land-surface evaporation estimated from satellite-based observations. Hydrol. Earth Syst. Sci. 2011, 15, 453–469. [Google Scholar] [CrossRef]
- Funk, C.; Peterson, P.; Landsfeld, M.; Pedreros, D.; Verdin, J.; Shukla, S.; Husak, G.; Rowland, J.; Harrison, L.; Hoell, A. The climate hazards infrared precipitation with stations—A new environmental record for monitoring extremes. Sci. Data 2015, 2, 150066. [Google Scholar] [CrossRef]
- Diaz, H.F.; Markgraf, V. El Niño and the Southern Oscillation: Multiscale Variability and Global and Regional Impacts; Cambridge University Press: Cambridge, UK, 2000. [Google Scholar]
- Mantua, N.J.; Hare, S.R.; Zhang, Y.; Wallace, J.M.; Francis, R.C. A Pacific interdecadal climate oscillation with impacts on salmon production. Bull. Am. Meteorol. Soc. 1997, 78, 1069–1080. [Google Scholar] [CrossRef]
- Bayen, A.M.; Siauw, T. An Introduction to MATLAB® Programming and Numerical Methods for Engineers; Academic Press: Boston, MA, USA, 2015. [Google Scholar]
- Sein, Z.M.M.; Zhi, X.; Ogou, F.K.; Nooni, I.K.; Paing, K.H. Evaluation of coupled model intercomparison project phase 6 models in simulating precipitation and its possible relationship with sea surface temperature over Myanmar. Front. Environ. Sci. 2022, 10, 993802. [Google Scholar] [CrossRef]
- Schulzweida, U. CDO User Guide (Version 2.2.1); Max Planck Institute for Meteorology: Hamburg, Germany, 2023. [Google Scholar]
- Zuo, C.; Luo, L.; Liu, W. Effects of increased humidity on physiological responses, thermal comfort, perceived air quality, and Sick Building Syndrome symptoms at elevated indoor temperatures for subjects in a hot-humid climate. Indoor Air 2021, 31, 524–540. [Google Scholar] [CrossRef]
- Yu, Y.J.; Tan, J.G.; Wang, H.; Lin, C.C. The Effect of Relative Humidity on Physiological Equivalent Temperature in Hot Environment. Adv. Mater. Res. 2013, 779–780, 1266–1271. [Google Scholar] [CrossRef]
- Taylor, K.E. Summarizing multiple aspects of model performance in a single diagram. J. Geophys. Res. 2001, 106, 7183–7192. [Google Scholar] [CrossRef]
- Sen, P.K. Estimates of the regression coefficient based on Kendall’s tau. J. Am. Stat. Assoc. 1968, 63, 1379–1389. [Google Scholar] [CrossRef]
- Kendall, M.G. Rank Correlation Methods; Charles Griffin: London, UK, 1948. [Google Scholar]
- Mann, H.B. Nonparametric tests against trend. Econom. J. Econom. Soc. 1945, 13, 245–259. [Google Scholar] [CrossRef]
- Jiqin, H.; Gelata, F.T.; Chaka Gemeda, S. Application of MK trend and test of Sen’s slope estimator to measure impact of climate change on the adoption of conservation agriculture in Ethiopia. J. Water Clim. Change 2023, 14, 977–988. [Google Scholar] [CrossRef]
- Lu, J.; Wang, G.; Gong, T.; Hagan, D.F.T.; Wang, Y.; Jiang, T.; Su, B. Changes of actual evapotranspiration and its components in the Yangtze River valley during 1980–2014 from satellite assimilation product. Theor. Appl. Climatol. 2019, 138, 1493–1510. [Google Scholar] [CrossRef]
- Agarwal, S.; Suchithra, A.S.; Gurjar, S.P. Analysis and Interpretation of Rainfall Trend using Mann- Kendall’s and Sen’s Slope Method. Indian J. Ecol. 2021, 48, 453–457. [Google Scholar]
- Rebi, A.; Hussain, A.; Hussain, I.; Cao, J.; Ullah, W.; Abbas, H.; Ullah, S.; Zhou, J. Spatiotemporal Precipitation Trends and Associated Large-Scale Teleconnections in Northern Pakistan. Atmosphere 2023, 14, 871. [Google Scholar] [CrossRef]
- Griffith, D.A.; Griffith, D.A. Spatial Filtering; Springer: Berlin/Heidelberg, Germany, 2003; pp. 91–130. [Google Scholar]
- Hauke, J.; Kossowski, T. Comparison of values of Pearson’s and Spearman’s correlation coefficients on the same sets of data. Quaest. Geogr. 2011, 30, 87–93. [Google Scholar] [CrossRef]
- Pearson, K. Notes on the history of correlation. Biometrika 1920, 13, 25–45. [Google Scholar] [CrossRef]
- Pearson, K. VII. Mathematical contributions to the theory of evolution.—III. Regression, heredity, and panmixia. In Philosophical Transactions of the Royal Society of London. Series A, Containing Papers of a Mathematical or Physical Character; The Royal Society: Lonon, UK, 1896; pp. 253–318. [Google Scholar]
- Sarpong, L.; Li, Y.; Cheng, Y.; Nooni, I.K. Temporal characteristics and trends of nitrogen loadings in lake Taihu, China and its influencing mechanism at multiple timescales. J. Environ. Manag. 2023, 344, 118406. [Google Scholar] [CrossRef]
- Loua, R.T.; Bencherif, H.; Mbatha, N.; Bègue, N.; Hauchecorne, A.; Bamba, Z.; Sivakumar, V. Study on temporal variations of surface temperature and rainfall at conakry airport, Guinea: 1960–2016. Climate 2019, 7, 93. [Google Scholar] [CrossRef]
- Funk, C.; Michaelsen, J.; Marshall, M.T. Mapping recent decadal climate variations in precipitation and temperature across Eastern Africa and the Sahel. In Remote Sensing of Drought; CRC Press: Boca Raton, FL, USA, 2012. [Google Scholar]
- Collins, J.M. Temperature Variability over Africa. J. Clim. 2011, 24, 3649–3666. [Google Scholar] [CrossRef]
- Nicholson, S.E. The ITCZ and the seasonal cycle over equatorial Africa. Bull. Am. Meteorol. Soc. 2018, 99, 337–348. [Google Scholar] [CrossRef]
- Nooni, I.K.; Hagan, D.F.T.; Wang, G.; Ullah, W.; Li, S.; Lu, J.; Bhatti, A.S.; Shi, X.; Lou, D.; Prempeh, N.A. Spatiotemporal characteristics and trend analysis of two evapotranspiration-based drought products and their mechanisms in sub-Saharan Africa. Remote Sens. 2021, 13, 533. [Google Scholar] [CrossRef]
- Onyutha, C. Trends and variability of temperature and evaporation over the African continent: Relationships with precipitation. Atmósfera 2021, 34, 267–287. [Google Scholar] [CrossRef]
- Nooni, I.K.; Ogou, F.K.; Chaibou, A.A.S.; Nakoty, F.M.; Gnitou, G.T.; Lu, J. Evaluating CMIP6 Historical Mean Precipitation over Africa and the Arabian Peninsula against Satellite-Based Observation. Atmosphere 2023, 14, 607. [Google Scholar] [CrossRef]
- Nicholson, S.E. A revised picture of the structure of the “monsoon” and land ITCZ over West Africa. Clim. Dyn. 2009, 32, 1155–1171. [Google Scholar] [CrossRef]
- Nicholson, S.E.; Funk, C.; Fink, A.H. Rainfall over the African continent from the 19th through the 21st century. Glob. Planet. Change 2018, 165, 114–127. [Google Scholar] [CrossRef]
- Ayoade, J. Introduction to Climatology for the Tropics; Wiley: Chichester, UK, 1983. [Google Scholar]
- Suzuki, T. Seasonal variation of the ITCZ and its characteristics over central Africa. Theor. Appl. Climatol. 2011, 103, 39–60. [Google Scholar] [CrossRef]
- Mamalakis, A.; Randerson, J.T.; Yu, J.-Y.; Pritchard, M.S.; Magnusdottir, G.; Smyth, P.; Levine, P.A.; Yu, S.; Foufoula-Georgiou, E. Zonally contrasting shifts of the tropical rain belt in response to climate change. Nat. Clim. Change 2021, 11, 143–151. [Google Scholar] [CrossRef]
- Longandjo, G.-N.T.; Rouault, M. Revisiting the Seasonal Cycle of Rainfall over Central Africa. J. Clim. 2024, 37, 1015–1032. [Google Scholar] [CrossRef]
- Schneider, T.; Bischoff, T.; Haug, G.H. Migrations and dynamics of the intertropical convergence zone. Nature 2014, 513, 45–53. [Google Scholar] [CrossRef]
- Dai, A. Drought under global warming: A review. Wiley Interdiscip. Rev. Clim. Change 2011, 2, 45–65. [Google Scholar] [CrossRef]
- Pierrehumbert, R.T.; Brogniez, H.; Roca, R. Chapter 6 On the Relative Humidity of the Atmosphere. In The Global Circulation of the Atmosphere; Tapio, S., Adam, H.S., Eds.; Princeton University Press: Princeton, NJ, USA, 2008; pp. 143–185. [Google Scholar]
- Oueslati, B.; Camberlin, P.; Zoungrana, J.; Roucou, P.; Diallo, S. Variability and trends of wet season temperature in the Sudano-Sahelian zone and relationships with precipitation. Clim. Dyn. 2018, 50, 1067–1090. [Google Scholar] [CrossRef]
- Sambou, M.-J.G.; Pohl, B.; Janicot, S.; Landry Famien, A.M.; Roucou, P.; Badiane, D.; Gaye, A.T. Heat waves in spring from Senegal to Sahel: Evolution under climate change. Int. J. Climatol. 2021, 41, 6238–6253. [Google Scholar] [CrossRef]
- Demissie, T.; Gebrechorkos, S.H. Spatio-Temporal Trends in Precipitation, Temperature, and Extremes: A Study of Malawi and Zambia (1981–2021). Sustainability 2024, 16, 3885. [Google Scholar] [CrossRef]
- Nicholson, S.E.; Nash, D.J.; Chase, B.M.; Grab, S.W.; Shanahan, T.M.; Verschuren, D.; Asrat, A.; Lézine, A.-M.; Umer, M. Temperature variability over Africa during the last 2000 years. Holocene 2013, 23, 1085–1094. [Google Scholar] [CrossRef]
- Lorenz, R.; Davin, E.L.; Seneviratne, S.I. Modeling land-climate coupling in Europe: Impact of land surface representation on climate variability and extremes. J. Geophys. Res. Atmos. 2012, 117, D20109. [Google Scholar] [CrossRef]
- Avissar, R. Recent advances in the representation of land-atmosphere interactions in general circulation models. Rev. Geophys. 1995, 33, 1005–1010. [Google Scholar] [CrossRef]
- Eludoyin, O.M.; Adelekan, I.O.; Webster, R.; Eludoyin, A.O. Air temperature, relative humidity, climate regionalization and thermal comfort of Nigeria. Int. J. Climatol. 2013, 34, 2000–2018. [Google Scholar] [CrossRef]
- Saley, I.A.; Salack, S.; Sanda, I.S.; Moussa, M.S.; Bonkaney, A.L.; Ly, M.; Fodé, M. The possible role of the Sahel Greenbelt on the occurrence of climate extremes over the West African Sahel. Atmos. Sci. Lett. 2019, 20, e927. [Google Scholar] [CrossRef]
- Sherwood, S.C.; Ingram, W.; Tsushima, Y.; Satoh, M.; Roberts, M.; Vidale, P.L.; O’Gorman, P.A. Relative humidity changes in a warmer climate. J. Geophys. Res. Atmos. 2010, 115, D09104. [Google Scholar] [CrossRef]
- Cho, J.; Lee, Y.-W.; Lee, H.-S. The effect of precipitation and air temperature on land-cover change in the Sahel. Water Environ. J. 2015, 29, 439–445. [Google Scholar] [CrossRef]
- Ghil, M.; Lucarini, V. The physics of climate variability and climate change. Rev. Mod. Phys. 2020, 92, 035002. [Google Scholar] [CrossRef]
- Trenberth, K.E. The definition of el nino. Bull. Am. Meteorol. Soc. 1997, 78, 2771–2778. [Google Scholar] [CrossRef]
- Alexander, L.V.; Uotila, P.; Nicholls, N.; Lynch, A. Influence of ENSO on global temperature and precipitation extremes. Geophys. Res. Lett. 2010, 37, L16810. [Google Scholar] [CrossRef]
- Viitanen, H.; Toratti, T.; Makkonen, L. Development of service life model for wooden structures. In Proceedings of the 12th International Conference on Durability of Building Materials and Components, XII DBMC, Porto, Portugal, 12–15 April 2011; pp. 495–502. [Google Scholar]
Disclaimer/Publisher’s Note: The statements, opinions and data contained in all publications are solely those of the individual author(s) and contributor(s) and not of MDPI and/or the editor(s). MDPI and/or the editor(s) disclaim responsibility for any injury to people or property resulting from any ideas, methods, instructions or products referred to in the content. |
© 2025 by the authors. Licensee MDPI, Basel, Switzerland. This article is an open access article distributed under the terms and conditions of the Creative Commons Attribution (CC BY) license (https://creativecommons.org/licenses/by/4.0/).