Article

Developing a Composite Drought Indicator Using PCA Integration of CHIRPS Rainfall, Temperature, and Vegetation Health Products for Agricultural Drought Monitoring in New Mexico

School of Civil, Environmental and Infrastructure Engineering, Southern Illinois University, Carbondale, IL 62901, USA
*
Author to whom correspondence should be addressed.
Atmosphere 2025, 16(7), 818; https://doi.org/10.3390/atmos16070818
Submission received: 14 May 2025 / Revised: 30 June 2025 / Accepted: 1 July 2025 / Published: 4 July 2025

Abstract

Drought indices are important resources for monitoring and warning of drought impacts. However, regions like New Mexico, which are highly vulnerable to drought, as identified by the United States Drought Monitor (USDM), lack a comprehensive drought monitoring system that integrates multiple agrometeorological variables into a single indicator. The purpose of this study is to create a Combined Drought Indicator for New Mexico (CDI-NM) as an indicator tool for use in monitoring historical drought events and measuring its extent across the New Mexico. The CDI-NM was constructed using four key variables: the Vegetation Condition Index (VCI), temperature, Smoothed Normalized Difference Vegetation Index (SMN), and gridded rainfall data. A quantitative approach was used to assign weights to these variables employing Principal Component Analysis (PCA) to produce the CDI-NM. Unlike conventional indices, CDI-NM assigns weights to each variable based on their statistical contributions, allowing the index to adapt to local spatial and temporal drought dynamics. The performance of CDI-NM was evaluated against gridded rainfall data using the 3-month Standardized Precipitation Index (SPI3) over a 17-year period (2003–2019). The results revealed that CDI-NM reliably detected moderate and severe droughts with a strong correlation (R2 > 0.8 and RMSE = 0.10) between both indices for the entire period of analysis. CDI-NM showed negative correlation (r < 0) with crop yield. While promising, the method assumes linear relationships among variables and consistent spatial resolution in the input datasets, which may affect its accuracy under certain local conditions. Based on the results, the CDI-NM stands out as a promising instrument that brings us closer to improved decision-making by stakeholders in the fight against agricultural droughts throughout New Mexico.

1. Introduction

Drought is a complicated natural disaster marked by extended periods of water scarcity that disturbs hydrological cycles, agricultural output, and ecological stability. Unlike many other natural disasters, drought develops gradually and has far-reaching socio-economic impacts [1]. These impacts are worsened by global climate change, which has led to more frequent, longer, and more intense droughts around the globe [2]. In New Mexico, recent climate assessments and state-level drought reports have also documented increasing drought frequency and severity over the past two decades, particularly affecting agricultural operations and water resource availability [3]. Agricultural drought, especially, directly threatens food security by reducing crop yields and harming plant health. This highlights the importance of comprehensive monitoring systems considering both climatic and ecological factors.
Agricultural drought results from complex interactions among meteorological, hydrological, and ecological factors, requiring comprehensive monitoring methods that capture these interdependencies. Traditional drought indices, such as the Standardized Precipitation Index (SPI) and Standardized Precipitation Evapotranspiration Index (SPEI), have been widely used to assess meteorological drought [3]. While these indices provide useful information about precipitation deficits and account temperature anomalies, they frequently fall short of understanding the complex interactions between climate, vegetation, and soil moisture that define agricultural drought [4]. The increasing availability of high-resolution satellite datasets has allowed for the integration of various datasets to better characterize drought conditions [5]. However, synthesizing this diverse information into a coherent and interpretable framework remains a challenge.
Principal Component Analysis (PCA) offers a robust statistical framework for reducing the dimensionality of complex datasets by identifying patterns and extracting the most significant components [6]. This makes it possible to construct indices whose fluctuations are dependent on the activity of various factors, thus being particularly suitable for developing composite drought indices [7]. Although PCA is helpful in environmental sciences [8], its application for drought monitoring has been rather partial, more so in the US. Globally, PCA has been used in some regions to develop composite drought indices [7,9,10], but in New Mexico and other arid regions, it is almost nonexistent. The almost non-application of PCA suggests a research gap, particularly if one considers the fact that the methodology can perform multivariate analyses by recalculating the weights of indicators according to their statistical importance [11]. This property of PCA makes it possible to effectively analyze drought’s temporal and spatial variabilities in various climatic and geographical regions.
To address the limitations of using a single drought index for monitoring the complex process of drought stress, remote-sensing drought indices have been developed that integrate multiple perspectives to capture the various influencing factors of droughts better. Remote sensing data like CHIRPS (Climate Hazards Group InfraRed Precipitation with Station Data) rainfall data [12,13], Land Surface Temperature (LST) [4,14], the Smoothed Normalized Difference Vegetation Index (SMN) [15,16], and the Vegetation Condition Index (VCI) [17,18] has been used in drought monitoring in recent years. Prior studies have also applied PCA to develop composite drought indicators using subsets of these variables in regions such as India [12] and Ethiopia [19]. However, combining this specific set of four variables into a single PCA-based drought index tailored for New Mexico has not been previously reported. In this study, the PCA-based Composite Drought Indicator for New Mexico (CDI-NM) was developed by integrating these multiple remote sensing variables to capture the multidimensional nature of agricultural drought. Details about each input variable are mentioned in the Materials and Methods section.
In summary, this study introduces the PCA-based Composite Drought Indicator for New Mexico (CDI-NM), which integrates a range of remote sensing variables to comprehensively represent the multifaceted nature of agricultural drought. Utilizing Principal Component Analysis (PCA) as the core analytical framework, this research seeks to
  • Illustrate the utility of PCA in developing a composite drought indicator;
  • Analyze the temporal patterns of agricultural drought across New Mexico;
  • Promote the integration of diverse remote sensing datasets into cohesive drought monitoring systems.
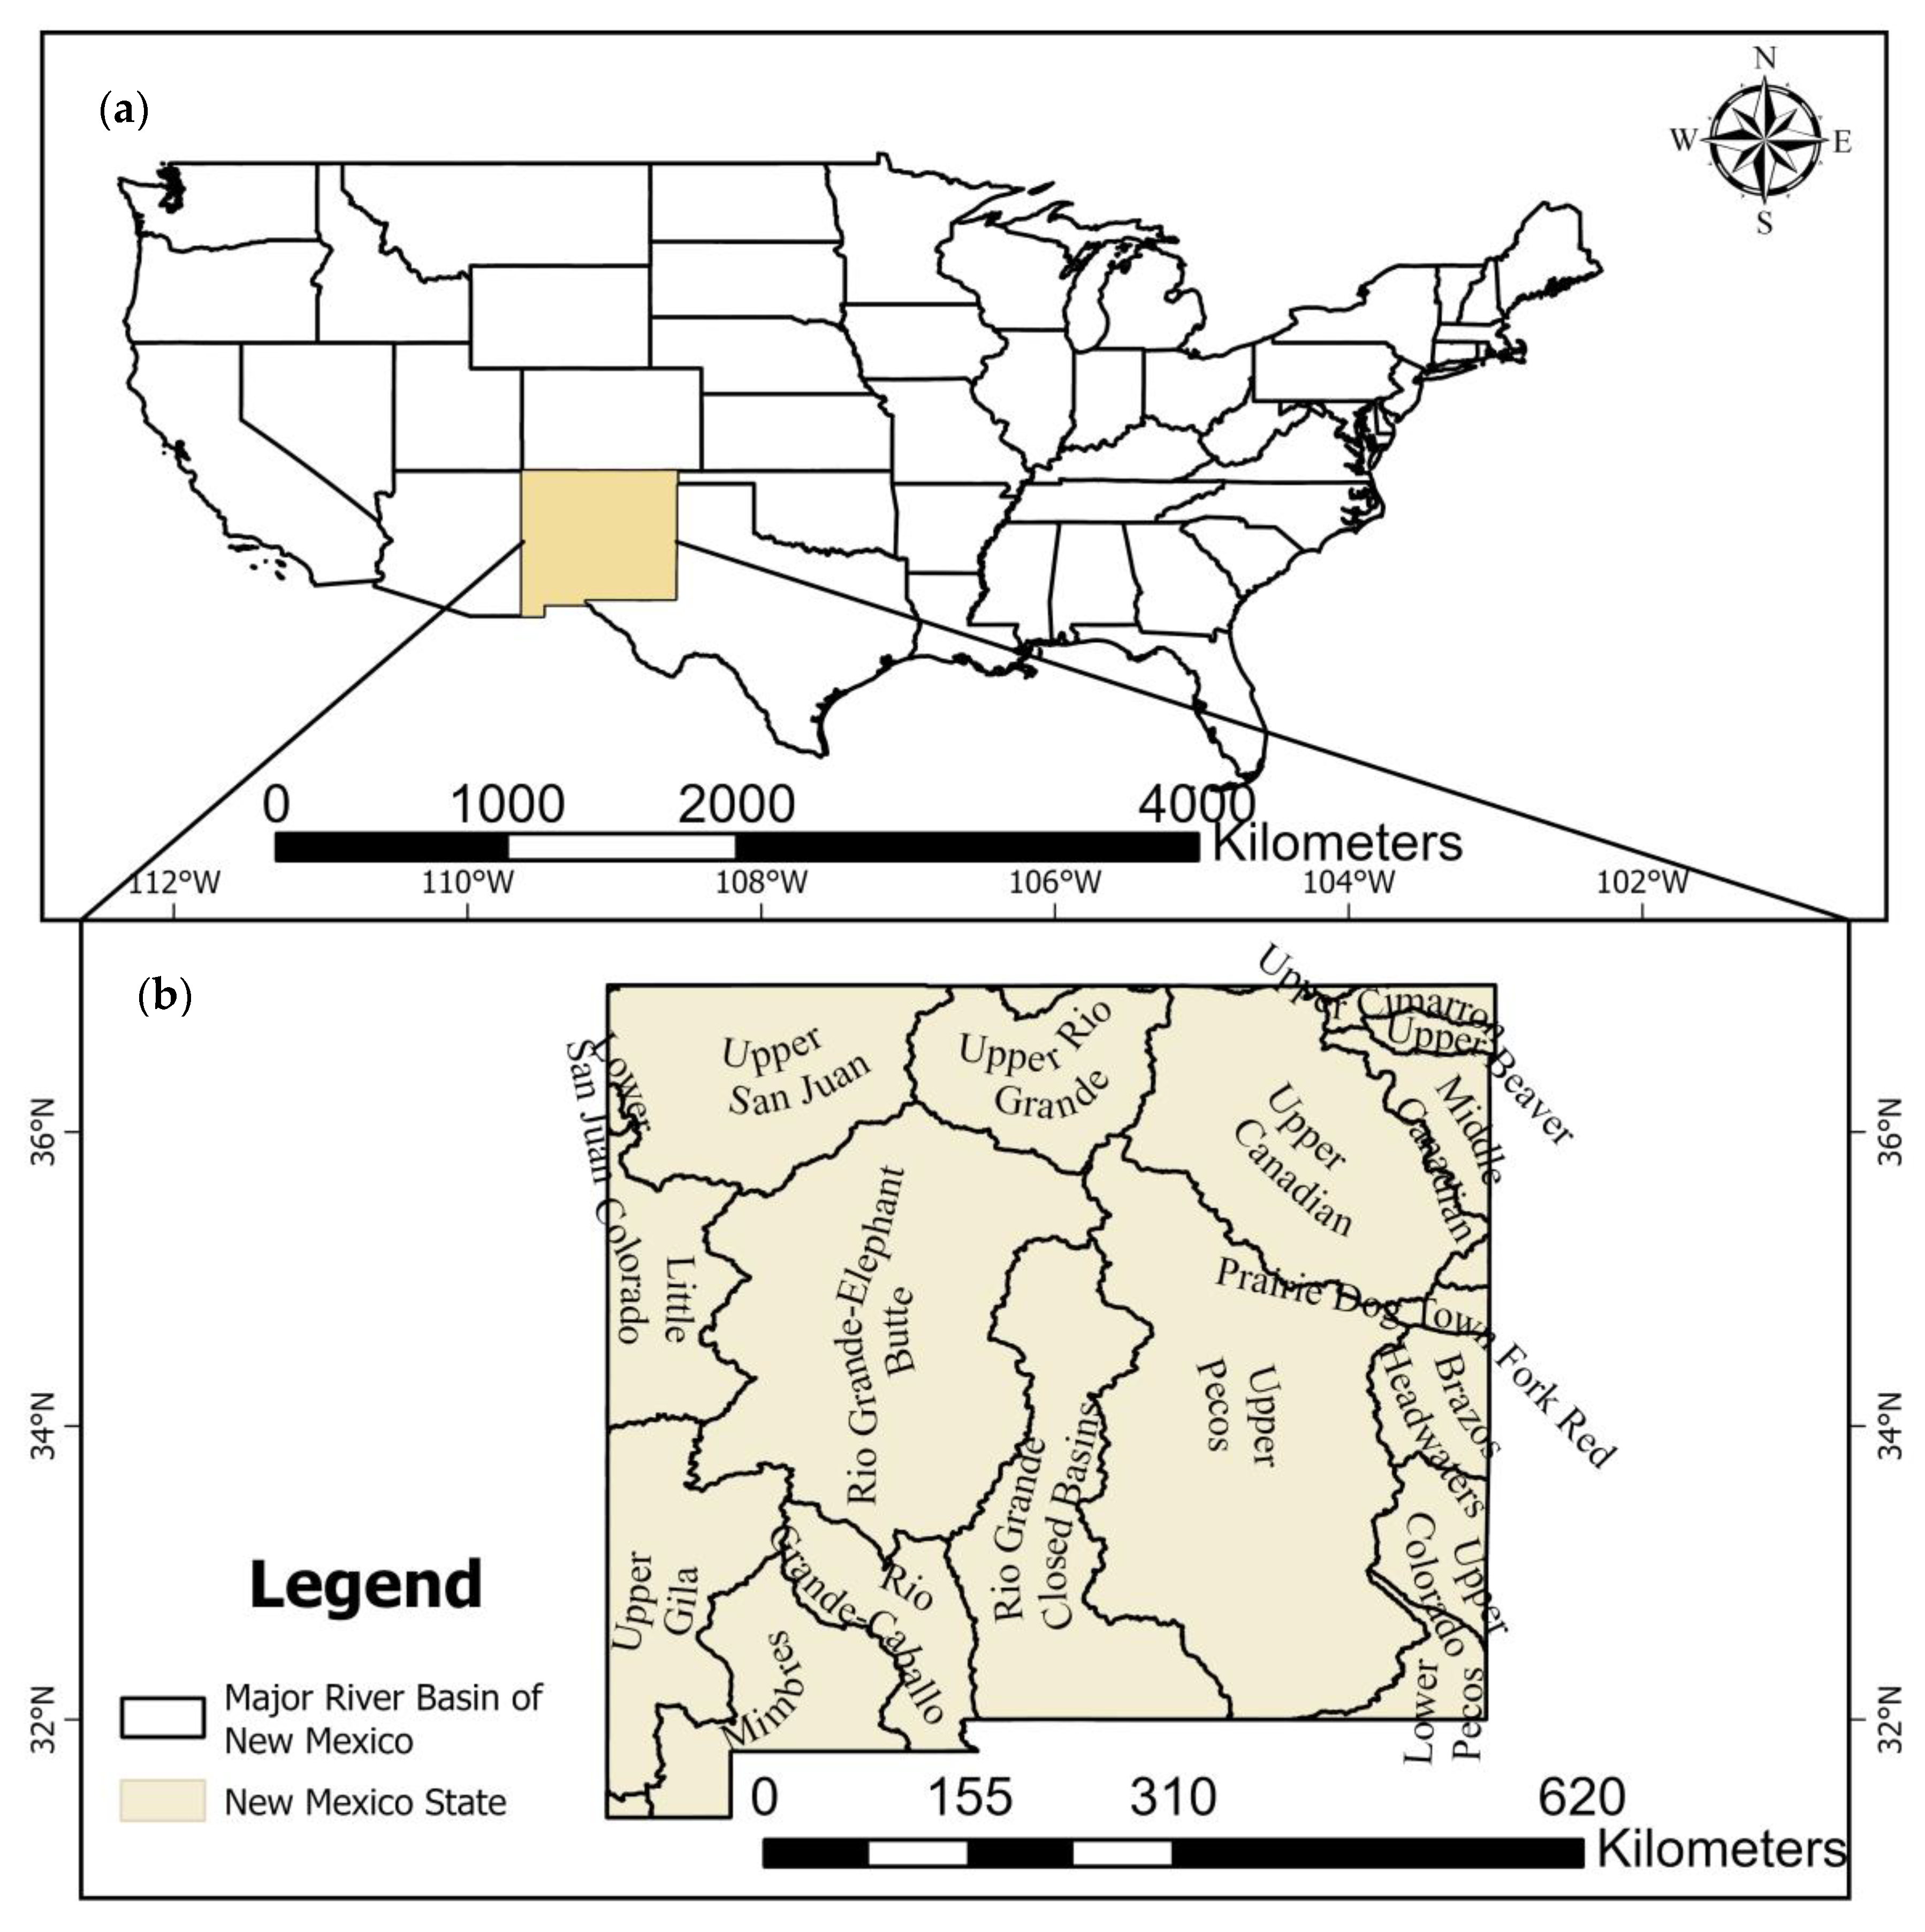
By establishing a robust methodological foundation for the use of PCA in drought studies, this work contributes to a deeper understanding of drought behavior and aims to support strategic decision-making for enhancing climate resilience.

2. Study Area

New Mexico is the fifth-largest state in the United States, encompassing a total area of 314,915 km2, of which only 757 km2 (0.24%) is water. The state spans latitudes from 31°20’ N to 37° N and longitudes from 103°W to 109°3’ W. The climate across much of New Mexico is predominantly semi-arid. In the southern regions, summer temperatures can exceed 100 °F (37.8 °C), with lows often remaining above 70 °F (21.1 °C). In contrast, the northern part of the state occasionally experiences snowfall during the winter, while the southern region remains drier with rare occurrences of snow. New Mexico is typically influenced by the North American monsoon from mid-June to late September. According to the United States Department of Agriculture National Agricultural Statistics Service (USDA-NASS), New Mexico utilized 158,232 km2 of land for farming operations and was the leading state in chili pepper production in 2022. Agriculture in New Mexico is shaped by a combination of semi-arid climate, elevation, and water availability. The eastern plains, characterized by sandy loam soils, support rainfed crops such as wheat, corn, and peanuts, while the Rio Grande Valley and southern regions like Doña Ana and Luna counties grow cotton and chili peppers under irrigated systems. According to the USDA-NASS, over 75% of harvested cropland lies in these areas, with cropping calendars closely aligned to summer monsoon rainfall. Soils range from fine-textured alluvium in valley regions to coarser upland soils, affecting water retention and drought sensitivity. These spatial differences underscore the need for a drought index that combines meteorological inputs (e.g., CHIRPS rainfall, LST) with vegetation-based indicators (VCI, SMN) to reflect varied agricultural responses to drought. Figure 1 presents the major river basin of New Mexico State.

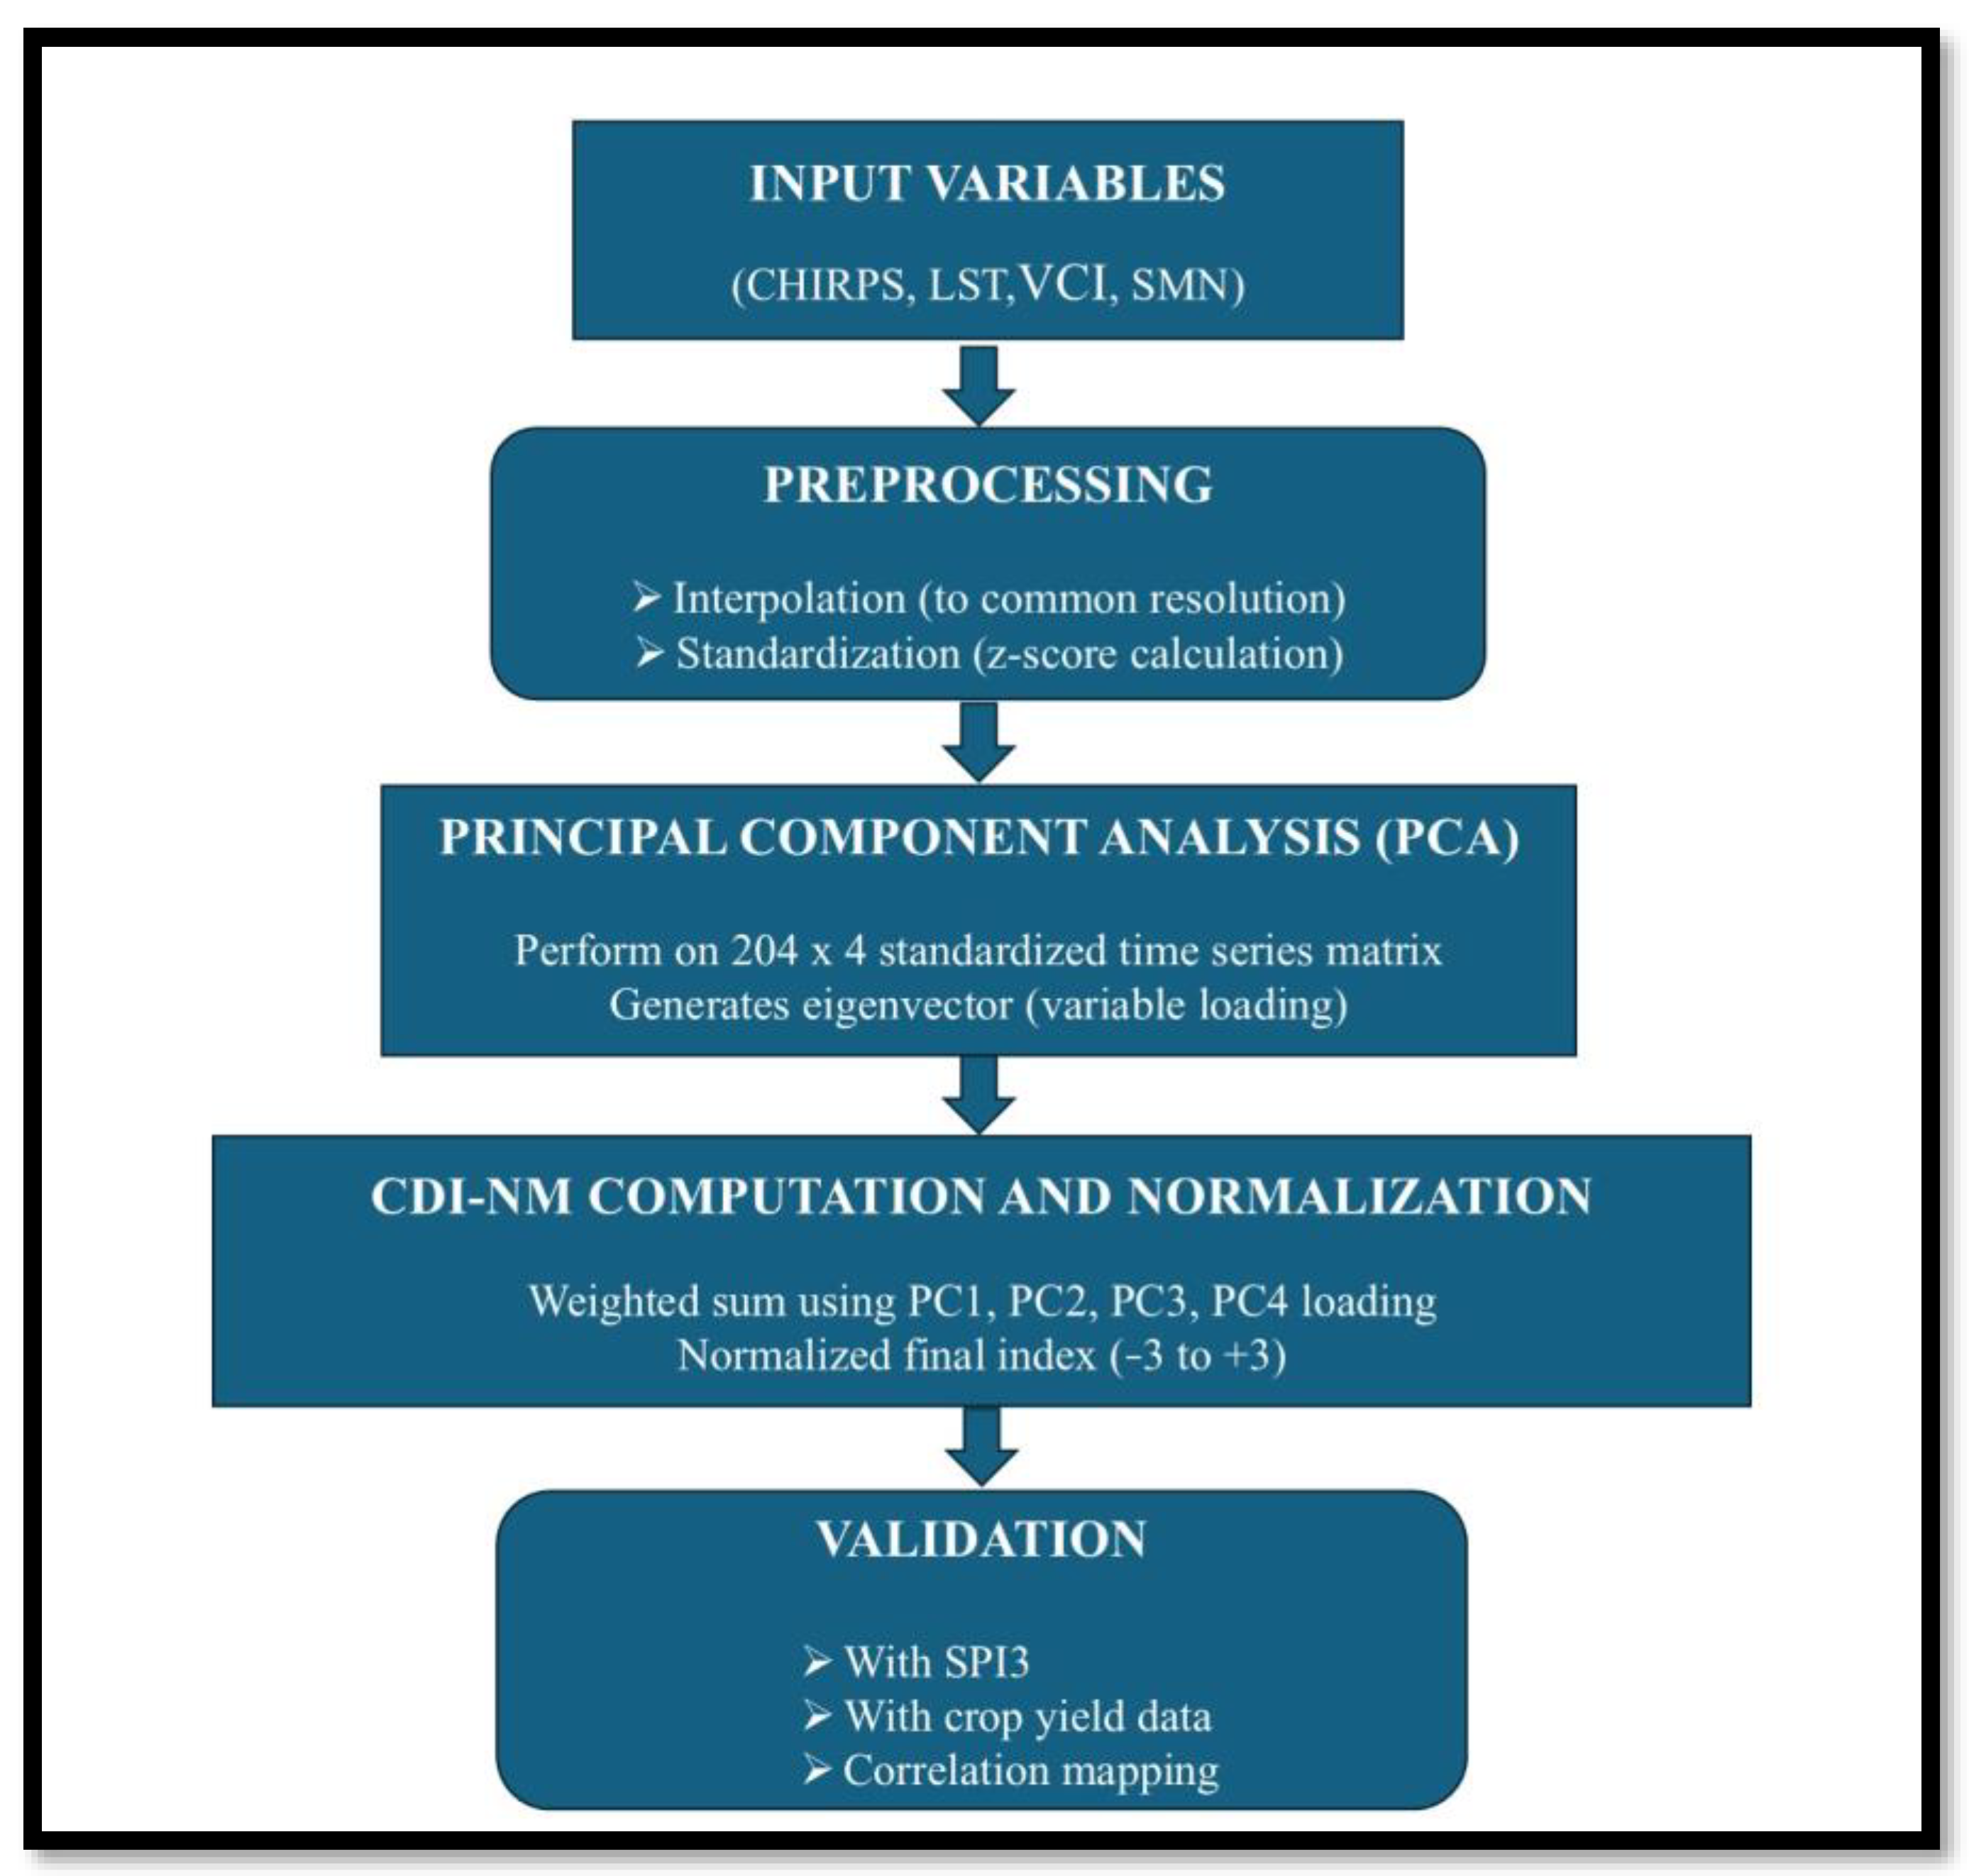
3. Materials and Methods

Four input parameters were used to develop an objective-based CDI-NM. These parameters were Climate Hazards Group InfraRed Precipitation with Station data (CHIRPS) rainfall, land surface temperature (LST), the No Noise Normalized Difference Vegetation Index (SMN) and the Vegetation Condition Index (VCI). The subsequent section provides a description of each dataset.

3.1. CHIRPS Rainfall

The CHIRPS satellite rainfall product is utilized to represent the meteorological components of drought. Developed by the U.S. Geological Survey (USGS) in collaboration with the Climate Hazards Group at the University of California, Santa Barbara (UCSB), CHIRPS is a blended product that combines pentadal precipitation climatology with quasi-global geostationary thermal infrared (TIR) satellite observations from the Climate Prediction Center and the National Climate Forecast System version 2 (CFSv2) [20]. Different studies have successfully applied CHIRPS data for drought monitoring [21] and hydrological analysis [22]. In this study, CHIRPS was selected due to its higher spatial resolution and extended period of records. The monthly CHIRPS rainfall time series data for the period 2003–2019 were extracted and converted from gridded data to time series format using Python 3.13.

3.2. Land Surface Temperature (LST)

LST is a crucial factor in the interaction between the earth’s surface and the atmosphere. It plays a vital role in controlling evaporation and influencing extreme events like drought. Integrating LST data into drought monitoring provides valuable information for better understanding, monitoring, and characterizing drought events [23]. The Land Surface Temperature (LST) data utilized in this study were sourced from NASA’s Earth Observation System Data and Information System (EOSDIS) via the Land Processes Distributed Active Archive Center (LP DAAC). The study made use of the Moderate Resolution Imaging Spectroradiometer (MODIS) level 3 product (MOD11C3 version 6), featuring a spatial resolution of approximately 0.05° (5.6 km), a daily temporal resolution, and a map projection in sinusoidal format, with the data being stored in HDF file format. The MOD11C3 product is generated by compositing daily LST observations (MOD11A1) and averaging them across each month, which significantly reduces cloud contamination—a common issue in thermal remote sensing. No additional cloud-masking was applied, as the monthly aggregation inherently addresses most missing data problems due to cloud cover [24]. Subsequently, a conversion to monthly time series data was conducted using a combination of ArcGIS Pro 3.5 and Python 3.13 programming.

3.3. Smoothed Normalized Difference Vegetation Index (SMN)

The Normalized Difference Vegetation Index (NDVI) is a measure used to monitor the health of vegetation by assessing the density of chlorophyll content in the vegetation cover [25]. For this study, noise-free NDVI data was obtained from the National Oceanic and Atmospheric Administration (NOAA) distributed by National Environmental Satellite, Data, and Information Service (NESDIS) as a Vegetation Health Product (VHP). The data had a spatial resolution of 4 km × 4 km and was collected on a weekly basis. To analyze the NDVI time series, we used QGIS 3.36.1 software to get monthly data in the NetCDF file format.

3.4. Vegetation Condition Index (VCI)

The VCI is a specialized metric adjusted to account for land climate, ecology, and weather conditions. This index serves to identify abnormal conditions impacting vegetation and to quantify the timing, intensity, duration, and repercussions of these conditions. The VCI algorithm has undergone development and testing in diverse global regions characterized by varying environmental and economic resources [26,27]. The range of values extends from 0 to 100 [28]. A value of zero signifies extremely unfavorable conditions, while a value of one hundred signifies optimal conditions. In this study, the VCI was derived from NOAA/NESDIS in 4 km × 4 km spatial resolution and weekly temporal scale. It was derived from the radiance observed by Advanced Very High-Resolution Radiometer (AVHRR) onboard afternoon polar-orbiting satellites. Although the SMN and VCI are both derived from NDVI, they represent distinct aspects of vegetation behavior: the SMN reflects long-term greenness trends, while the VCI emphasizes short-term anomalies relative to historical norms. Both were included for their complementary roles in capturing vegetation response to drought. Their correlation is moderate, as discussed later in the manuscript, suggesting limited risk of redundancy.
In this study, four remote sensing input variables (CHIRPS rainfall, LST, SMN, and VCI) were used to develop PCA based CDI-NM from 2003 to 2019. Each parameter had a different spatial resolution, and, during pre-processing of data, each variable was converted into the same pixel size using Kriging interpolation techniques in ArcGIS Pro. Kriging is a widely used interpolation technique that provides a more accurate representation of spatial variability, particularly over heterogeneous terrain, by accounting for both the distance and spatial correlation between data points [29]. In this study, Ordinary Kriging was applied using ArcGIS Pro’s Geostatistical Analyst to harmonize the spatial resolution of input datasets. A spherical semivariogram model was selected, consistent with prior applications in environmental data analysis. Empirical semivariograms were generated to confirm the presence of spatial autocorrelation before applying Kriging, satisfying its statistical assumption. These variables represent the components of meteorological factors (precipitation and LST) and agricultural indicators (SMN and VCI). Rainfed agriculture is affected by seasonal changes in climate, so using various variables that represent different climates, and agricultural elements can provide valuable insights. This approach offers a more comprehensive view of drought conditions, which can improve agricultural drought monitoring and early warning systems [30].

3.5. Relevancy of Input Parameters (Kaiser–Meyer–Olkin (KMO) and Bartlett’s Test of Sphericity

To assess the validity of the interpretation derived from the PCA, two pre-PCA tests were conducted: the Kaiser–Meyer–Olkin (KMO) test and Bartlett’s test. The results are presented in Table 1. High KMO values, approaching 1.0, typically indicate that PCA is beneficial for the dataset. If the KMO value is less than 0.5, the PCA results would not be considered valid [31]. For this dataset, the KMO value is 0.786, which is greater than 0.5, suggesting that the PCA results can be deemed valid. Additionally, if the significance value is less than 0.05, the null hypothesis is rejected, indicating that PCA is appropriate for the data [32]. In this case, the significance value is 0.00013 < 0.05, confirming that the data is suitable for PCA analysis. These tests were applied to a dataset of 204 monthly observations from 2003 to 2019 across four variables. The results confirm adequate sampling and statistically significant correlation structure, validating the use of PCA for constructing the CDI-NM.

3.6. Formulating CDI-NM Using PCA

The PCA method was used to determine the contribution of each input parameter to the development of CDI-NM. The PCA method is widely used in different regions to establish a CDI-based drought monitoring system [7,19,33,34]. Figure 2 represents the systematic procedure for the formulation of CDI-NM.
The computation of principal components involves the construction of a symmetric correlation coefficient matrix of dimensions p × p, where p represents the number of input parameters. In this study, a 4 × 4 correlation coefficient matrix was developed using standardized time-series data from four input parameters for each of the grids. This matrix was subsequently used to calculate the eigenvectors, which were employed to transform the input variables into orthogonal principal components (PCs), equivalent in number to the input parameters: four, in this case. The eigenvectors, which are unit vectors, define the relationship between the principal components and the original variables. As the PCs are orthogonal vectors, they remain uncorrelated and cannot be combined into a single vector using simple mathematical operations [35].
The eigenvector corresponding to the first principal component served as the basis for calculating the percentage contributions, which were used as weights to combine the four variables into a single composite index. The percentage contribution of each variable was determined by squaring the eigenvector values and applying these as weights to construct the CDI-NM. These weights vary across each grid cell and each month, reflecting the historical values of each input variable at each grid. PCA was applied independently for each month using standardized statewide time-series data from 2003 to 2019. A 4 × 4 correlation matrix was generated for each month based on the four input variables (CHIRPS rainfall, LST, SMN, and VCI), and PCA was conducted on this monthly dataset. The resulting eigenvectors were used to derive weights for each variable in that month, ensuring that the CDI-NM reflects monthly drought dynamics across the study period. Additionally, one randomly selected month was used to generate a spatial correlation map to visualize how CDI-NM corresponds with crop yield. This spatial mapping was performed only for illustrative purposes and not as part of the PCA computation. The primary benefit of using percentage contributions is to reduce extreme or spike values that may arise during the development of CDI-NM. While PCA is a widely used method for dimensionality reduction and weighting in environmental data analysis, it relies on several key assumptions. These include the assumption of linear relationships among variables, sensitivity to the relative scaling and variance of inputs, and the assumption of stationarity in the underlying data over time. In this study, all input variables were standardized prior to analysis to mitigate issues arising from differences in scale and variance. However, we acknowledge that full temporal stationarity may not hold across the 17-year dataset (2003–2019), which could influence the stability of the principal components and associated weights. Despite these limitations, PCA remains appropriate for identifying dominant patterns in multivariate drought data and has been successfully applied in similar environmental studies [36]. The relationship between the principal components and the original data can be represented by Equation (1).
Z = XE
where:
  • Z represents the matrix (n × p) of principal components (or transformed data).
  • X represents the matrix (n × p) of standardized input data (observations).
  • E represents the matrix (p × p) of eigenvectors (or loadings or percentage contributions).
Equation (1) can also be represented as Equation (2), where the weight of each parameter is used to combine the standardized values of the four input variables for each grid.
CDI y, m = w p, m × P y, m + w lst, m × LST y, m + w smn, m × SMN y, m + w vci, m × VCI y, m
where y and m represent the year (2003 to 2019) and the month (January to December), respectively.
  • CDIy,m is the combined drought indicator for a particular year and month.
  • wp,m, wlst,m, wsmn,m, wvci,m are the weights (percentage contributions) derived based on the Z-score values of precipitation (P), LST, SMN, and VCI, respectively.
  • Py,m represents the Z-score of precipitation for year y and month m.
  • LSTy,m represents the Z-score of temperature for year y and month m.
  • SMNy,m represents the Z-score of SMN for year y and month m.
  • VCIy,m represents the Z-score of vegetation condition index for year y and month m.
The CDI-NM ranges were determined based on the McKee classification of SPI drought categories from 1993, as shown in Table 2.
The x-axis in Figure 3 represents the full range of CDI-NM values, while the y-axis shows the corresponding percentile ranks across the study period (2003–2019). This cumulative distribution curve allows us to determine the frequency of occurrence for each CDI-NM value. By referencing the SPI-based drought percentile thresholds, we identified cutoff points on the CDI-NM scale that correspond to different drought severity classes. According to McKee, extreme drought occurs around 2.3% of the time, severe drought occurs around 4.4% of the time, moderate drought occurs around 9.2% of the time, and mild drought occurs 24% of the time. The classification and percentile of time occurrence vary from one climatic region to another. For example, in a study of Arizona drought, Gregory B. Goodrich used the following intervals for percentile of time: exceptional <2%, extreme 3–5%, severe 6–10%, moderate 11–20%, and abnormally dry 21–30%. In our study, we created a percentile ranking by analyzing the time series of CDI-NM across New Mexico, as presented in Figure 3. The percentile for the corresponding drought categories of CD-NM is displayed in Table 2

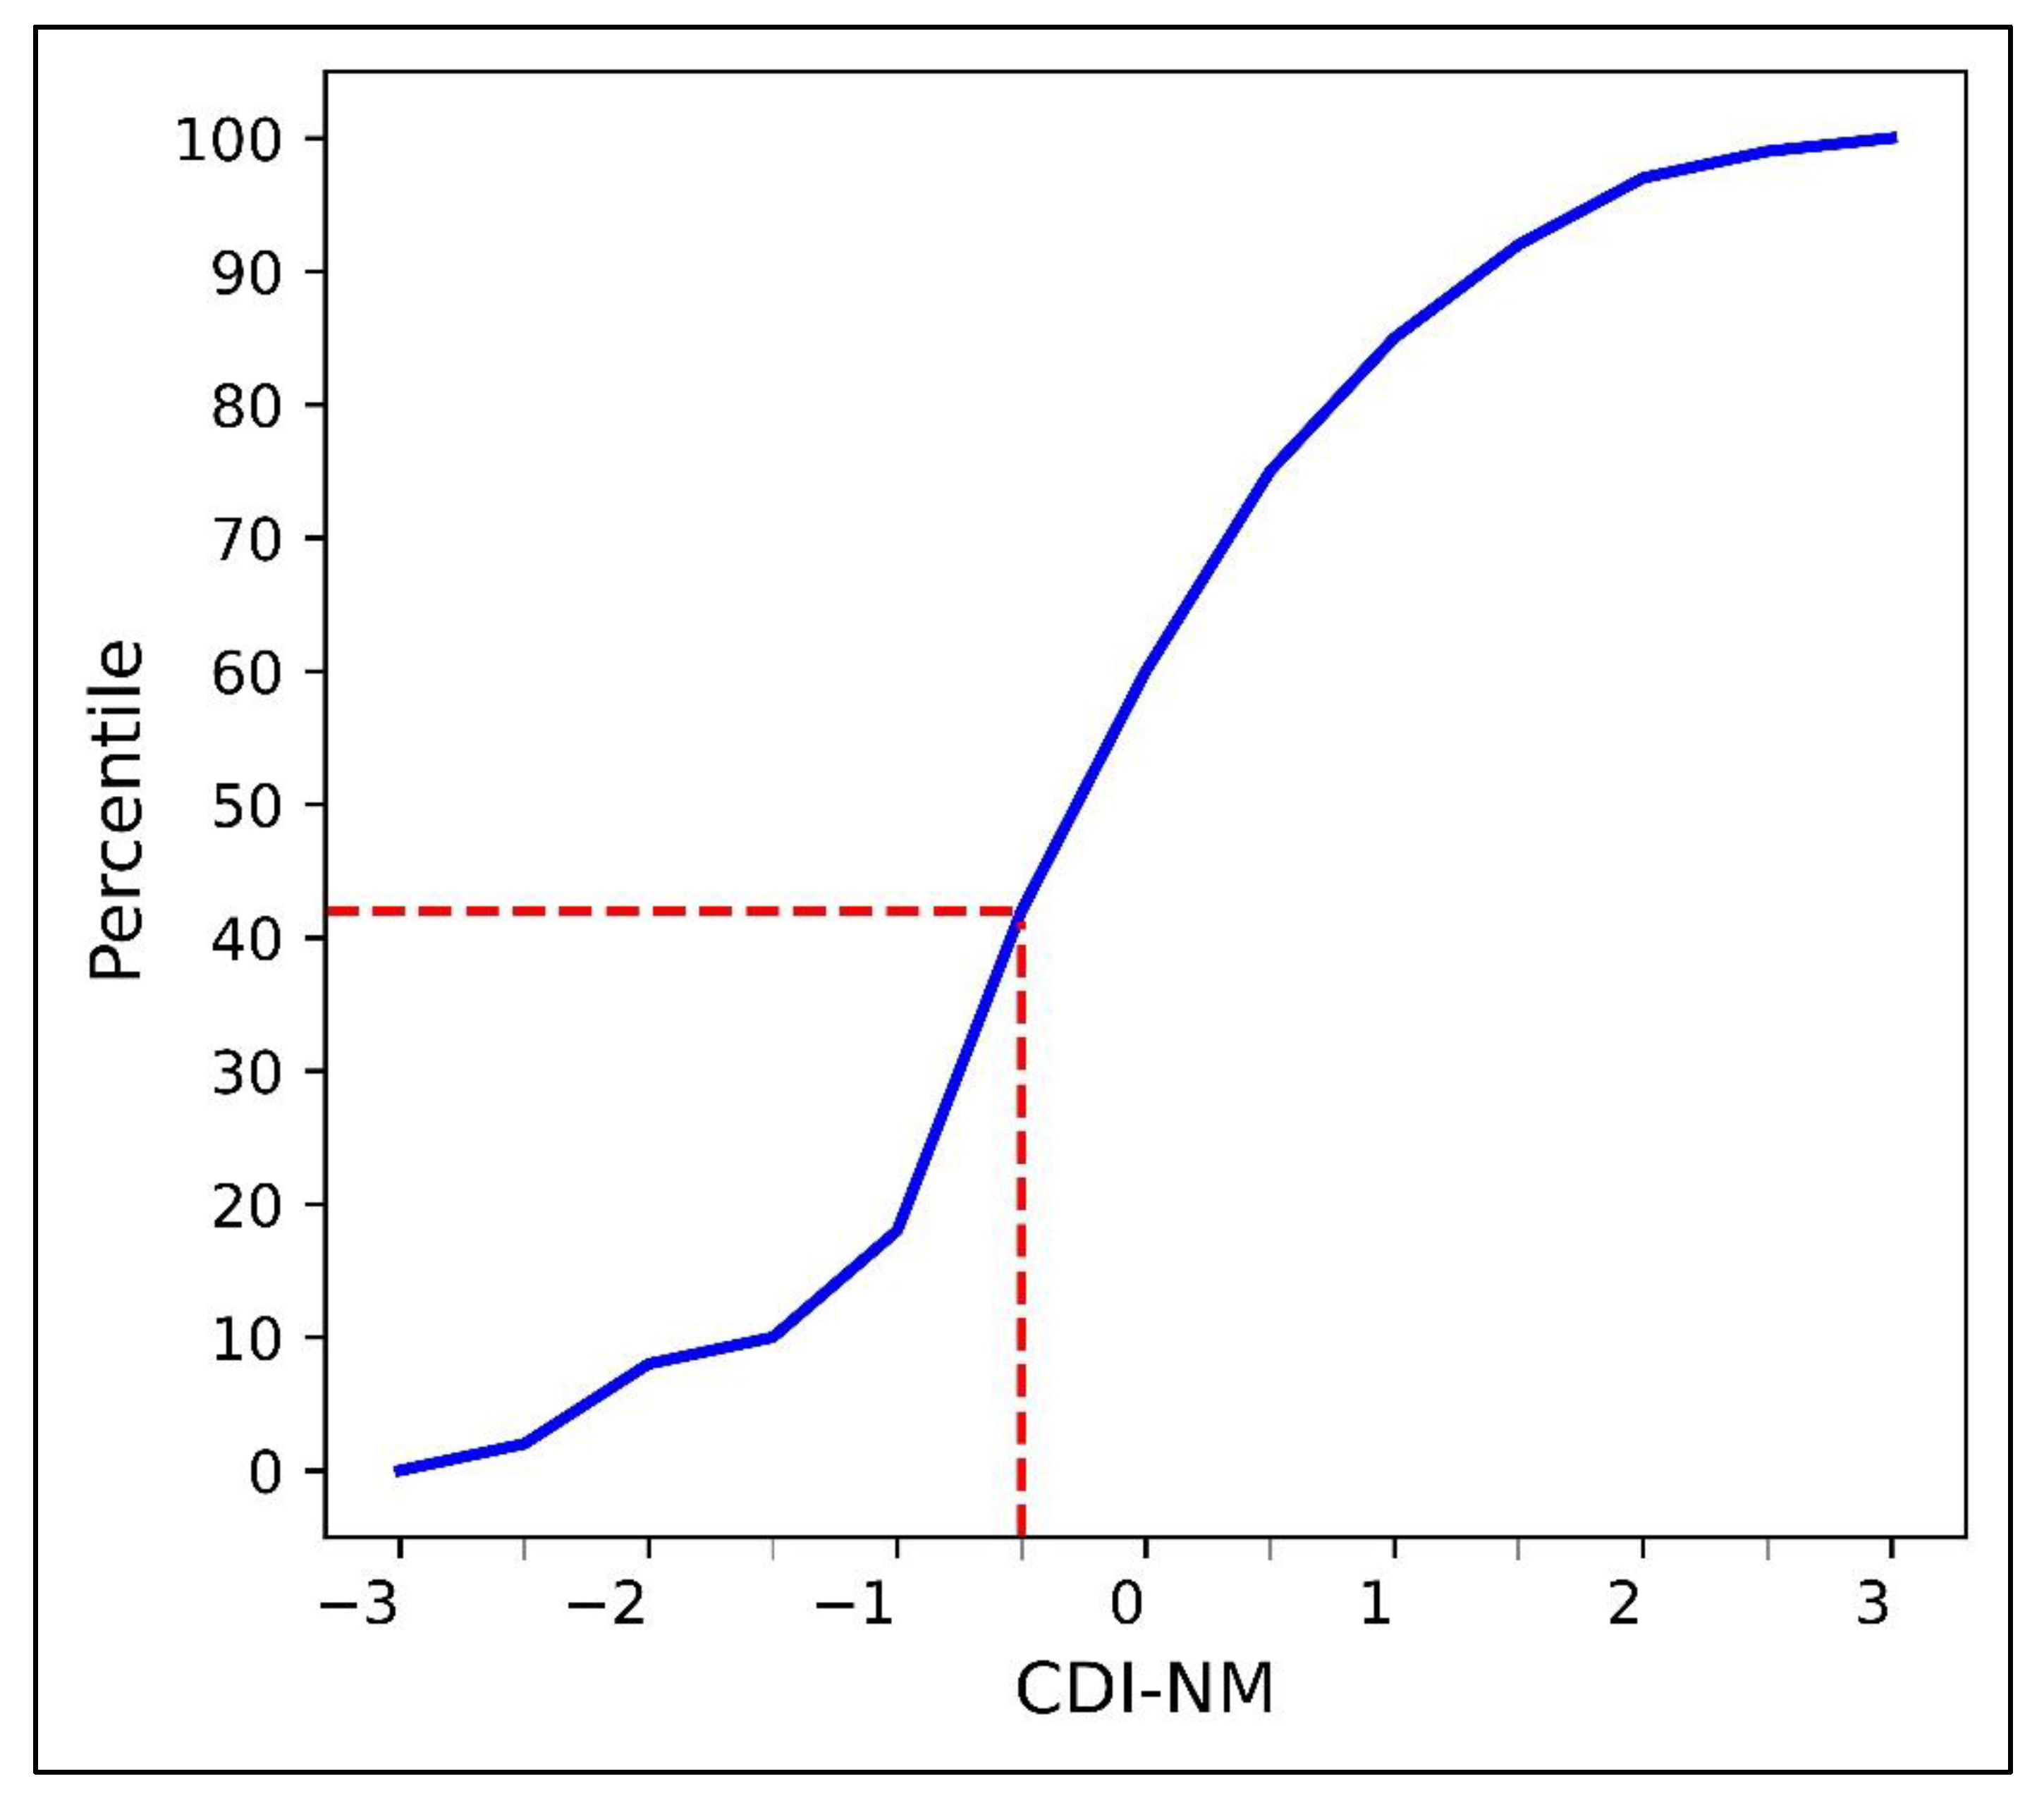
3.7. Geographical and Historical Evaluation of the Drought

The PCA outcomes were normalized and transformed into CDI-NM time-series data to determine the index’s potential to reflect the temporal patterns of agricultural drought in New Mexico. McKee, Doesken, and Klest’s drought categorizations were utilized to classify CDI-NM into four drought groups (Table 2) that correspond to different ranges of percentiles. For the spatial drought pattern, the entire region was evaluated based on the crop yield and rainfall pattern of the area. The temporal pattern was compared with the SPI3 derived from the Council Monitoring and Assessment Program (CMAP) rainfall data from NOAA for the period of the study.

4. Results and Discussion

This section explains the results of correlation analysis, principal component analysis, and reliability of CDI-NM for drought categorization based on correlation with SPI-3 and crop yield data.

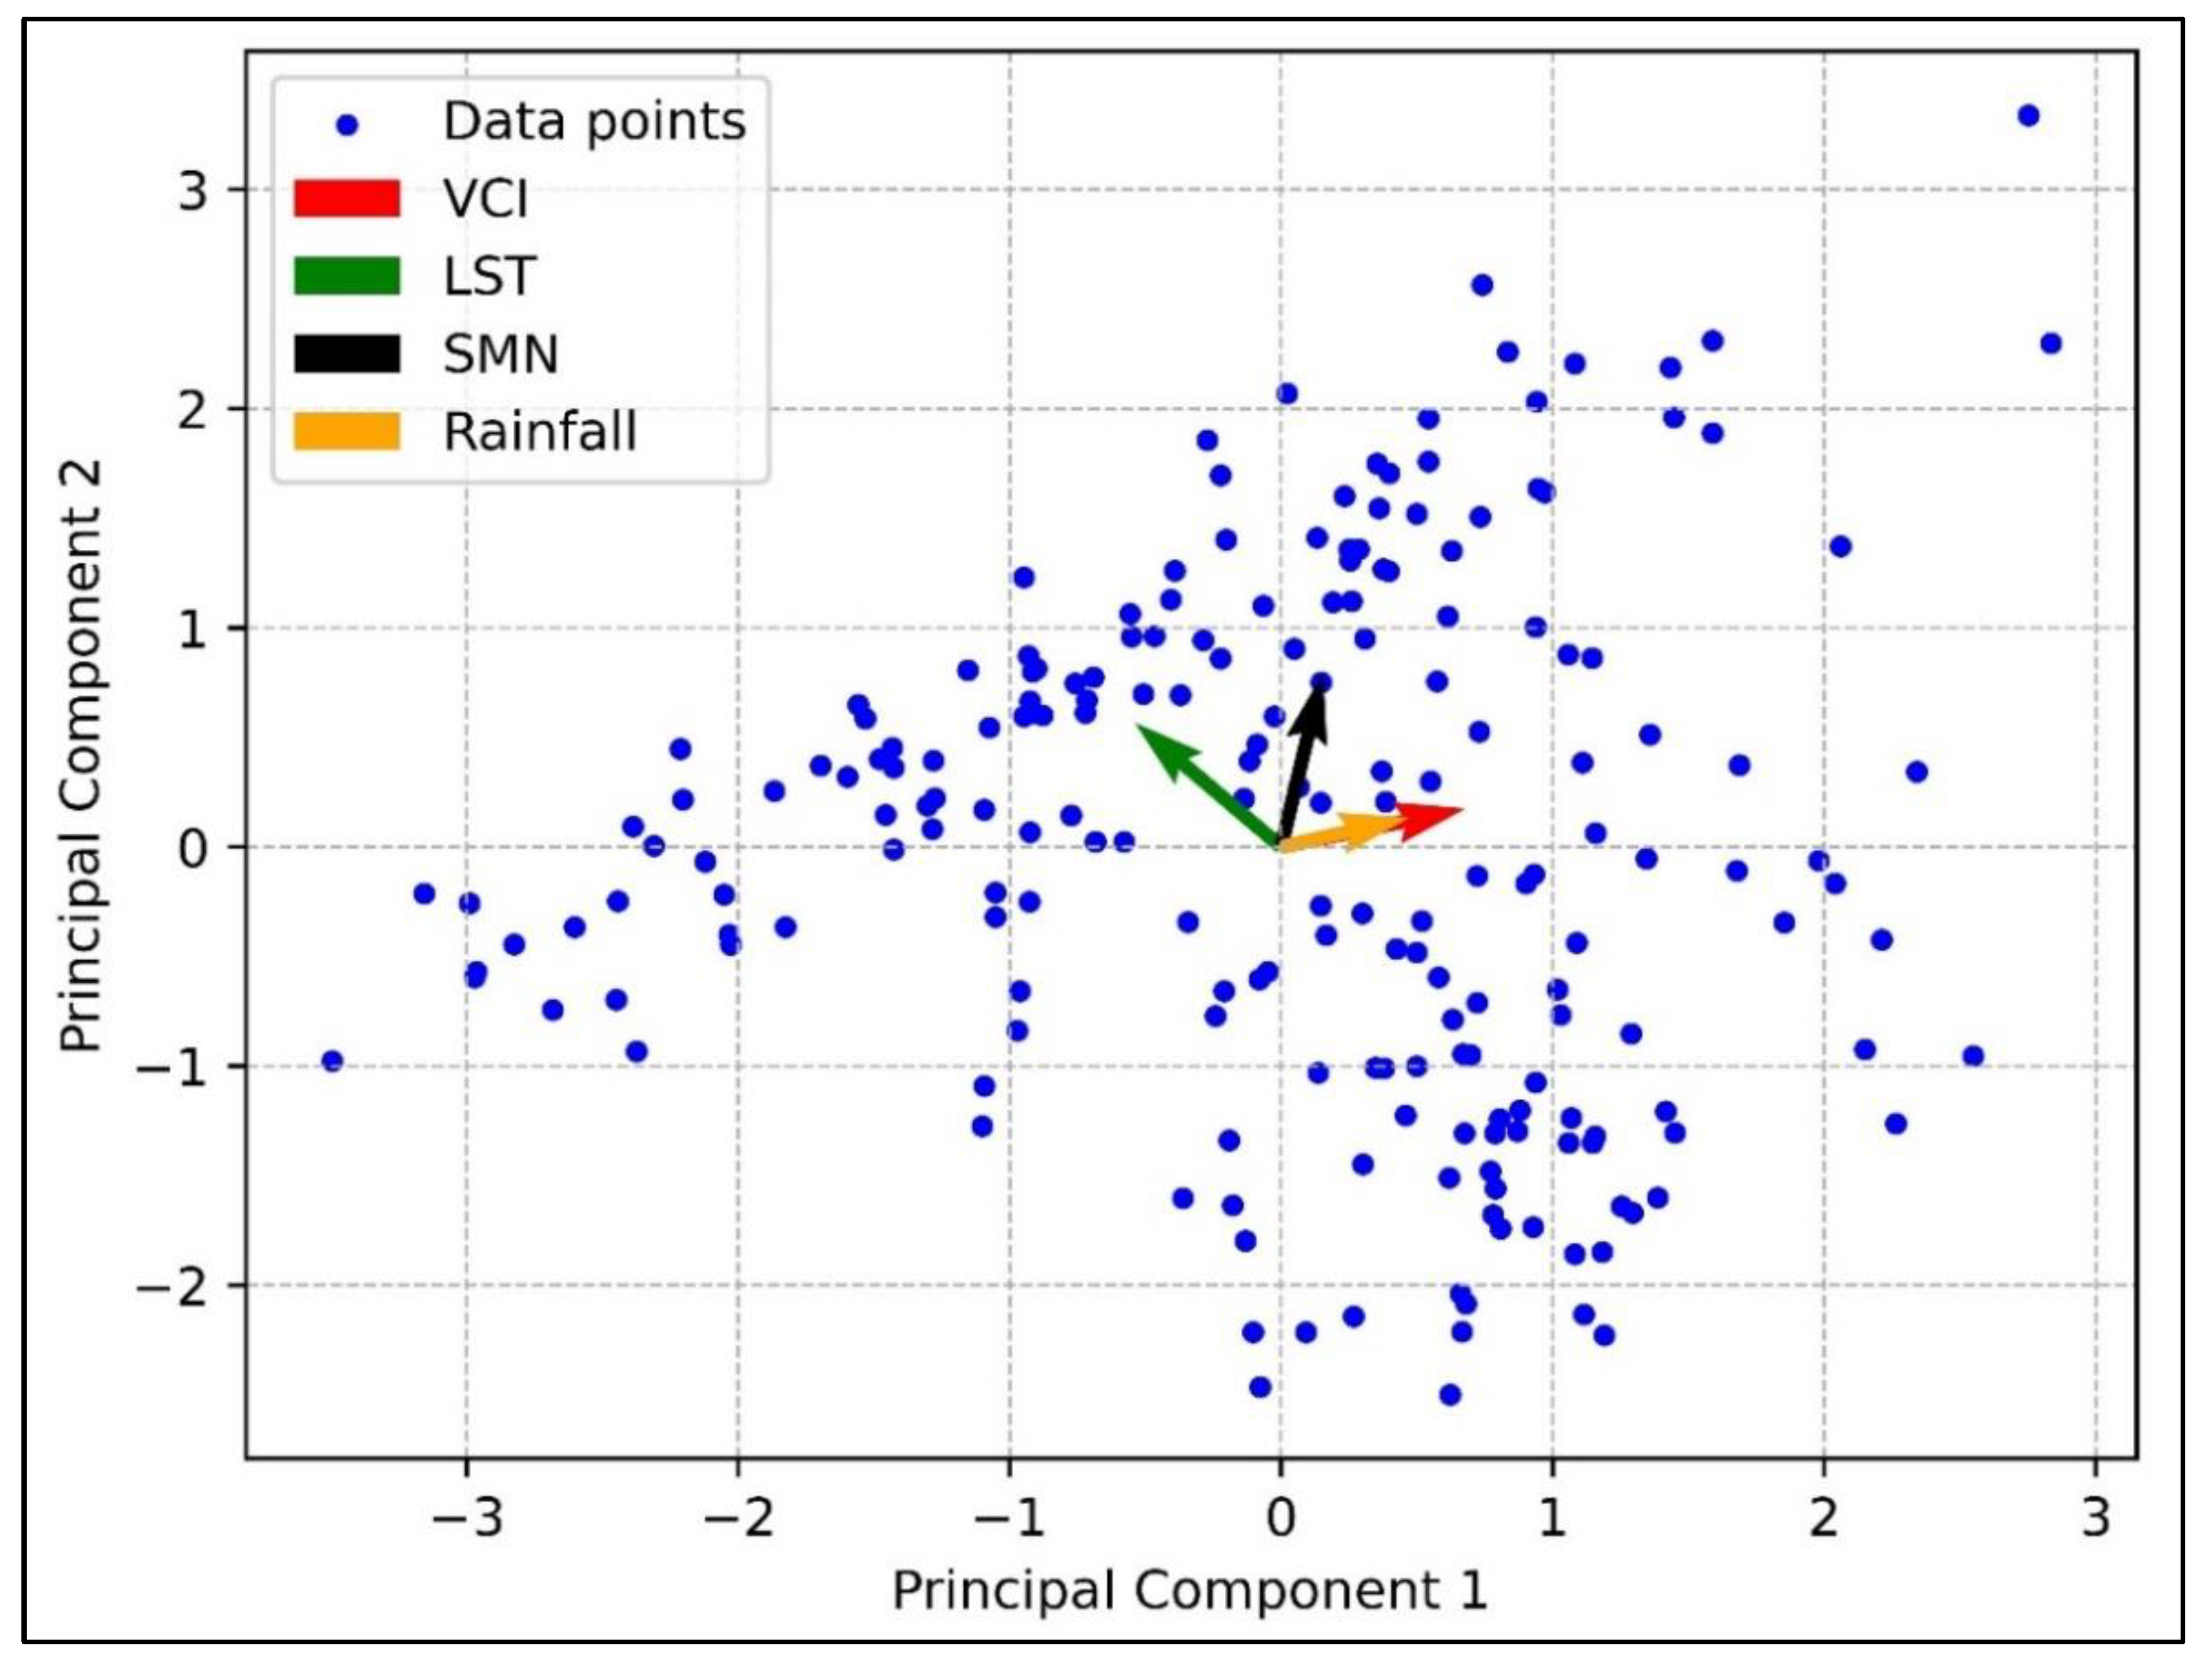
4.1. Correlation Analysis and Principal Component Analysis

4.1.1. Correlation Matrix of Drought Variables

Before conducting Principal Component Analysis, correlations among the drought-related variables were examined. Table 3 presents the correlation matrix for the four variables: VCI, LST, SMN, and Rainfall.
The correlation matrix reveals several notable relationships among the variables, consistent with findings in previous studies [37,38]. The VCI shows a strong positive correlation with Rainfall (0.78), indicating that increased precipitation is strongly associated with improved vegetation health, as also reported by Quiring and Ganesh (2010) [39]. Conversely, the VCI has a moderate negative correlation with LST (−0.43), reflecting the detrimental effects of higher temperatures on vegetation condition, which aligns with findings by Bento et al. (2018) [40]. Rainfall shows a negative correlation with LST, which reflects the impact of rainfall lowering the surface temperature, as suggested by Garai et al. (2022) [41]. All correlation coefficients in the above table are statistically significant at p < 0.05, confirming sufficient linear association for PCA suitability. These correlations offer valuable insight into the interplay among various drought-related factors, laying the groundwork for a more comprehensive analysis using PCA.

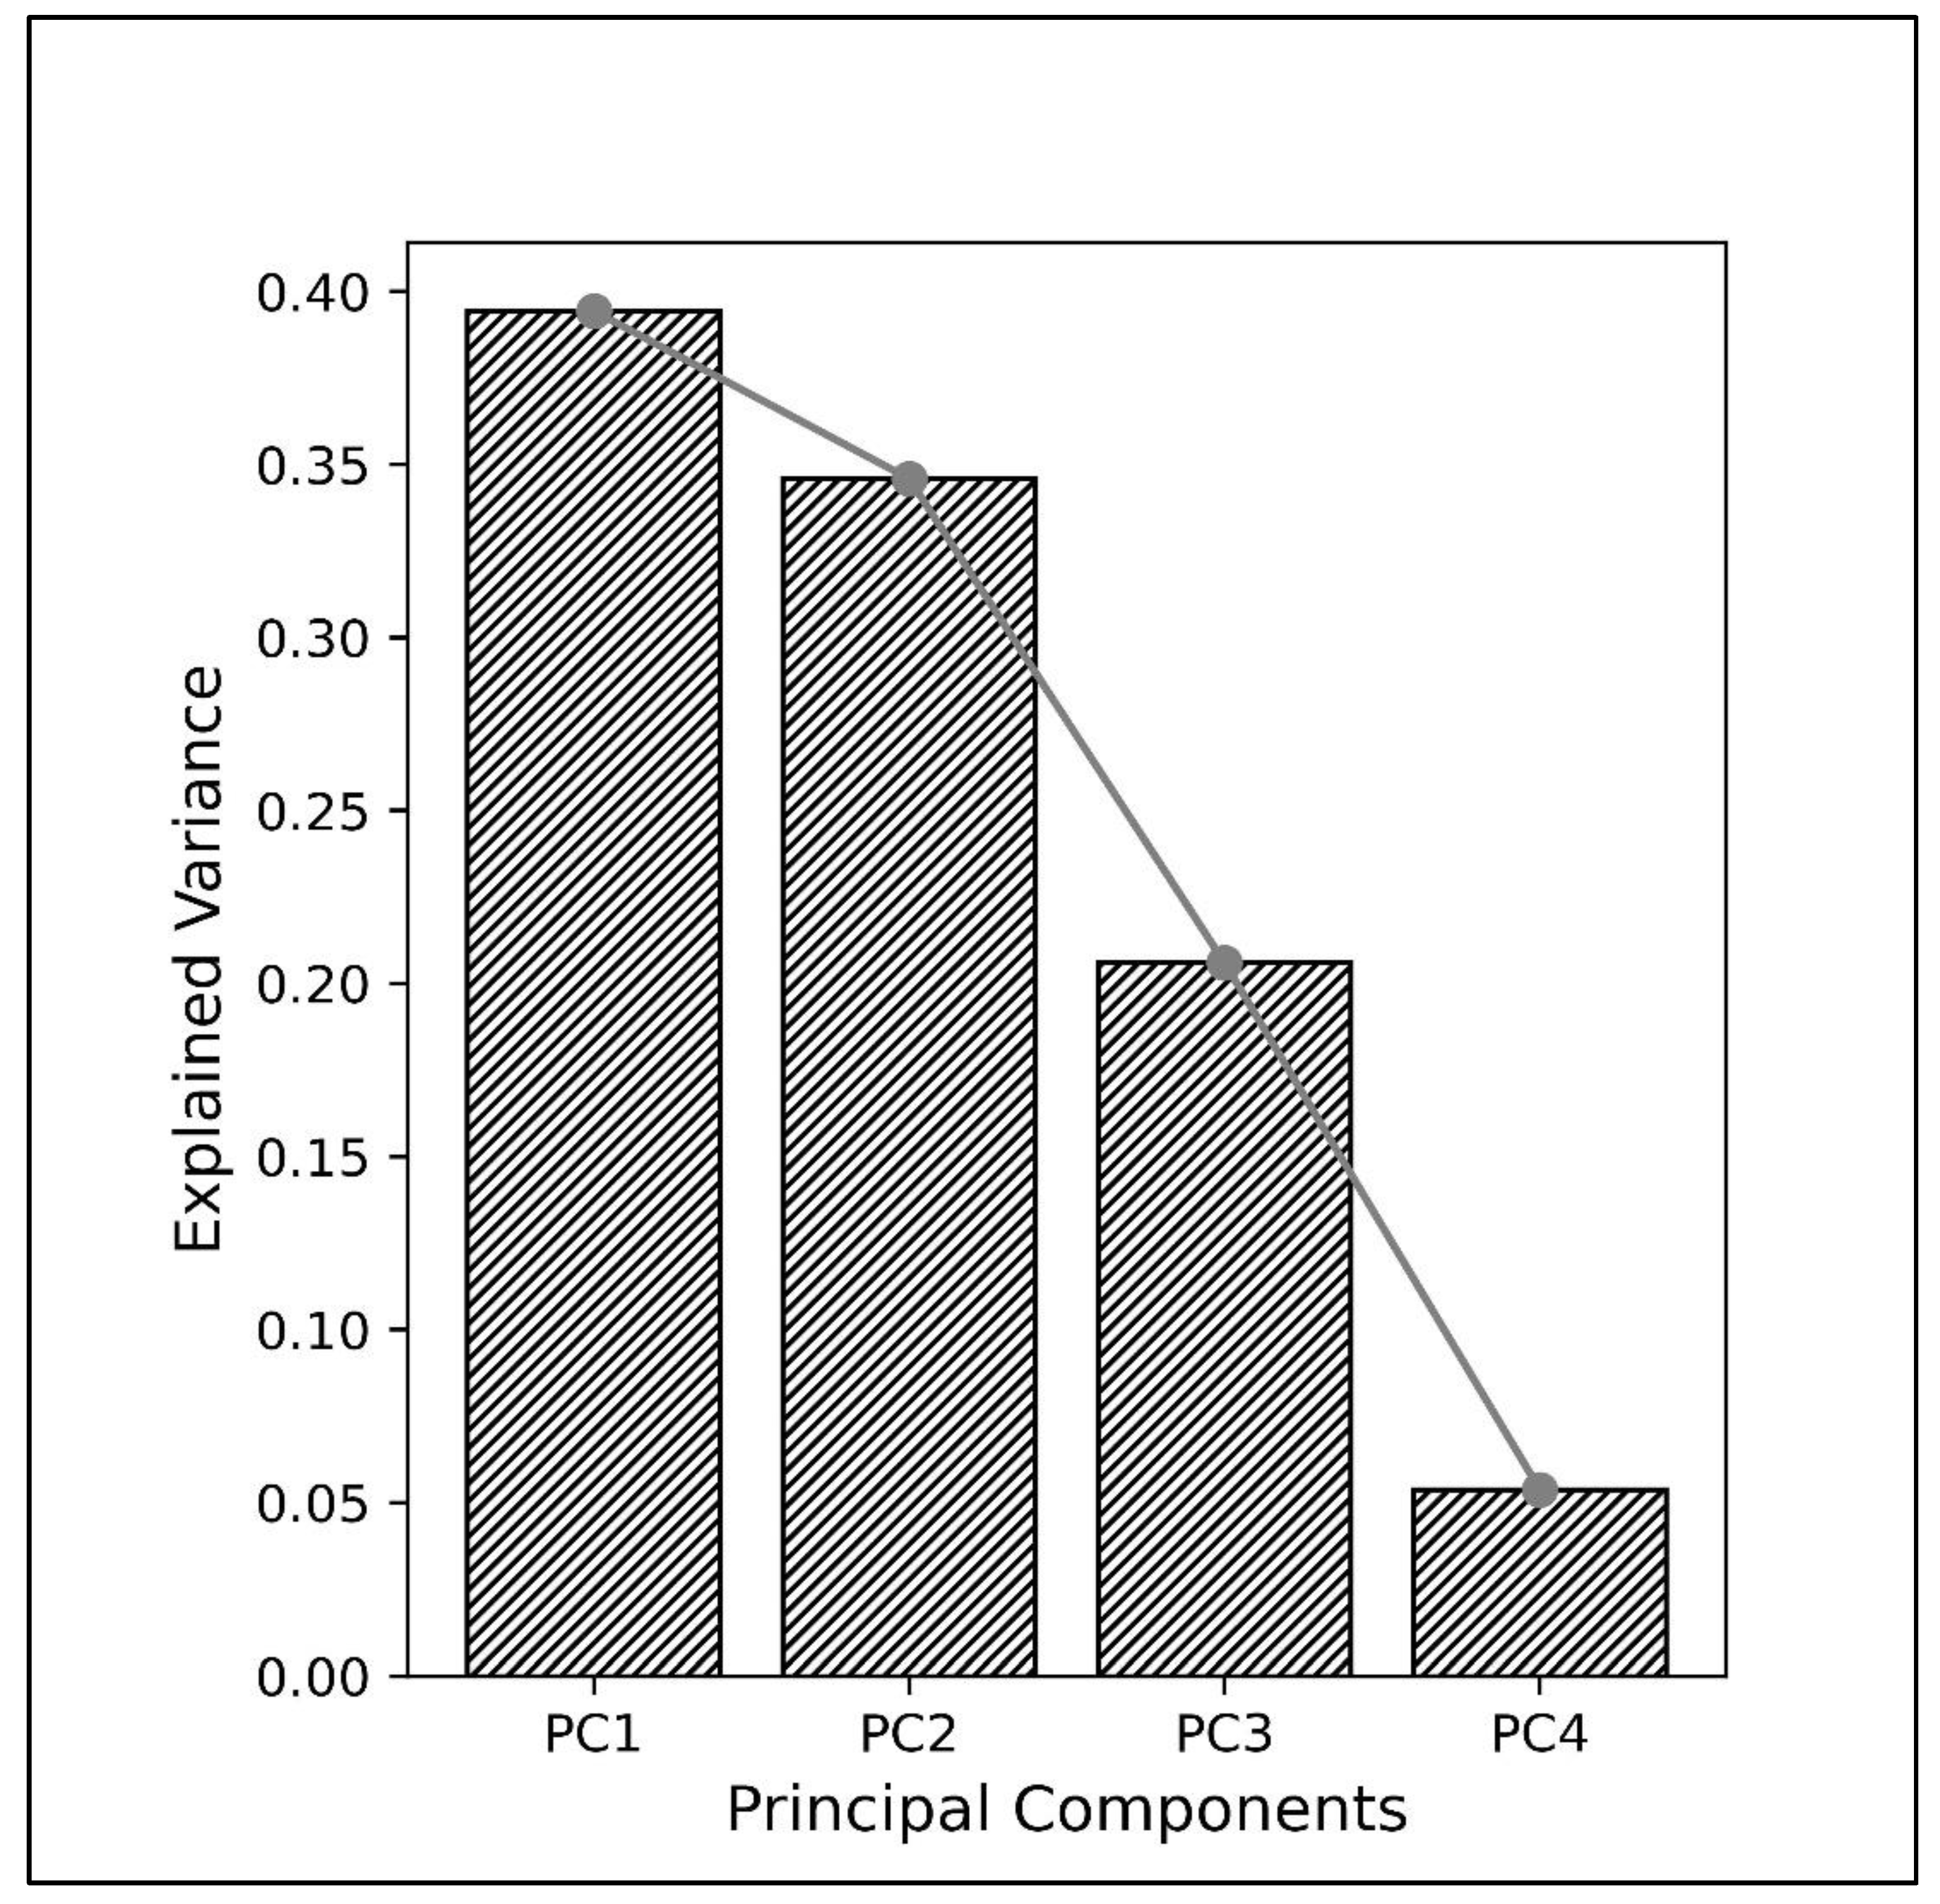
4.1.2. Principal Component Analysis: Variance Explanation and Variable Contributions

The PCA was performed to identify underlying patterns in the dataset and reduce its dimensionality while retaining significant information. The scree plot (Figure 4) provides an overview of the explained variance by each principal component. PC1 accounts for 39.44% of the variance, while PC2 contributes around 34.59%, and PC3 accounts for 20.6%, indicating that these three components collectively capture nearly 95% of the total variability. The subsequent component PC4 contributes minimally, as evidenced by the steep decline in the explained variance after PC3. This result underscores the adequacy of using the first three components for further analysis, simplifying the dataset without substantial loss of information [42,43].
To clarify the relationships among variables and their contributions to each principal component, the eigenmatrix obtained from the PCA was analyzed in Table 4. The eigenmatrix reveals the complex interrelationships among the drought-related variables. PC1 is primarily characterized by a strong positive loading from the VCI (0.68) and a substantial negative loading from LST (−0.5386), with a moderate positive contribution from Rainfall (0.4733). This suggests that PC1 captures the inverse relationship between vegetation health and thermal stress, modulated by precipitation. PC2 is dominated by SMN (0.79) and LST (0.57), indicating its focus on soil water content and surface temperature dynamics. PC3 is heavily influenced by Rainfall (0.87), with a moderate negative loading from the VCI (−0.44), potentially representing the complex interplay between precipitation events and vegetation response.
To understand the influence of individual variables on the principal components, a biplot is presented in Figure 5. The biplot illustrates the distribution of observations in the reduced two-dimensional PCA space alongside the contributions of the original variables: VCI, LST, SMN, and Rainfall. The directions and magnitudes of the vectors indicate the strength and nature of the relationship between the variables and the principal components [44]. Specifically, the angle between vectors reflects the correlation between variables (smaller angles indicate stronger positive correlation, orthogonal vectors suggest no correlation), while the length of a vector signifies the variable’s contribution to the principal components. For instance, VCI and Rainfall align strongly with PC1, suggesting that this component predominantly represents vegetation health and precipitation dynamics. In contrast, LST and SMN contribute more significantly to PC2, indicating its potential association with thermal and soil moisture-related drought characteristics [45].
The distribution of observations in the PCA space highlights the variability in drought conditions. Observations with higher values of VCI and Rainfall align positively along PC1, corresponding to lower drought severity. Conversely, higher contributions of LST and SMN are evident along PC2, suggesting the influence of soil moisture deficits and elevated land surface temperatures on drought dynamics [46]. These findings demonstrate the effectiveness of PCA in capturing complex, multidimensional relationships, providing a simplified yet robust framework for analyzing drought variability [47].
The PCA results demonstrate that the selected variables effectively capture the primary sources of variation in drought patterns. This approach aligns with recent studies that have successfully employed PCA to identify key drought indicators across various geographical regions [48,49]. The reduction from multiple variables to three principal components not only simplifies the analysis but also provides a more interpretable representation of drought dynamics. This dimensionality reduction is crucial for developing effective drought management strategies and improving our understanding of complex drought–vegetation interactions [30,36]. The retained components, explaining 95% of the total variance, offer a comprehensive yet concise representation of the drought-related variables, facilitating more targeted analyses and interventions in agricultural systems affected by drought. The CDI-NM represents a meaningful integration of multiple remote sensing products that individually reflect different dimensions of agricultural drought. CHIRPS provides precipitation variability, LST captures temperature-related stress, the SMN smooths NDVI fluctuations for consistent vegetation tracking, and the VCI contextualizes vegetation health relative to historical extremes. By combining these inputs using PCA, the index leverages the complementary strengths of each dataset to provide a more holistic picture of drought conditions. The high explanatory power of the first three principal components (cumulative variance >95%) further demonstrates the synergy among these variables, supporting the rationale behind objective 3.

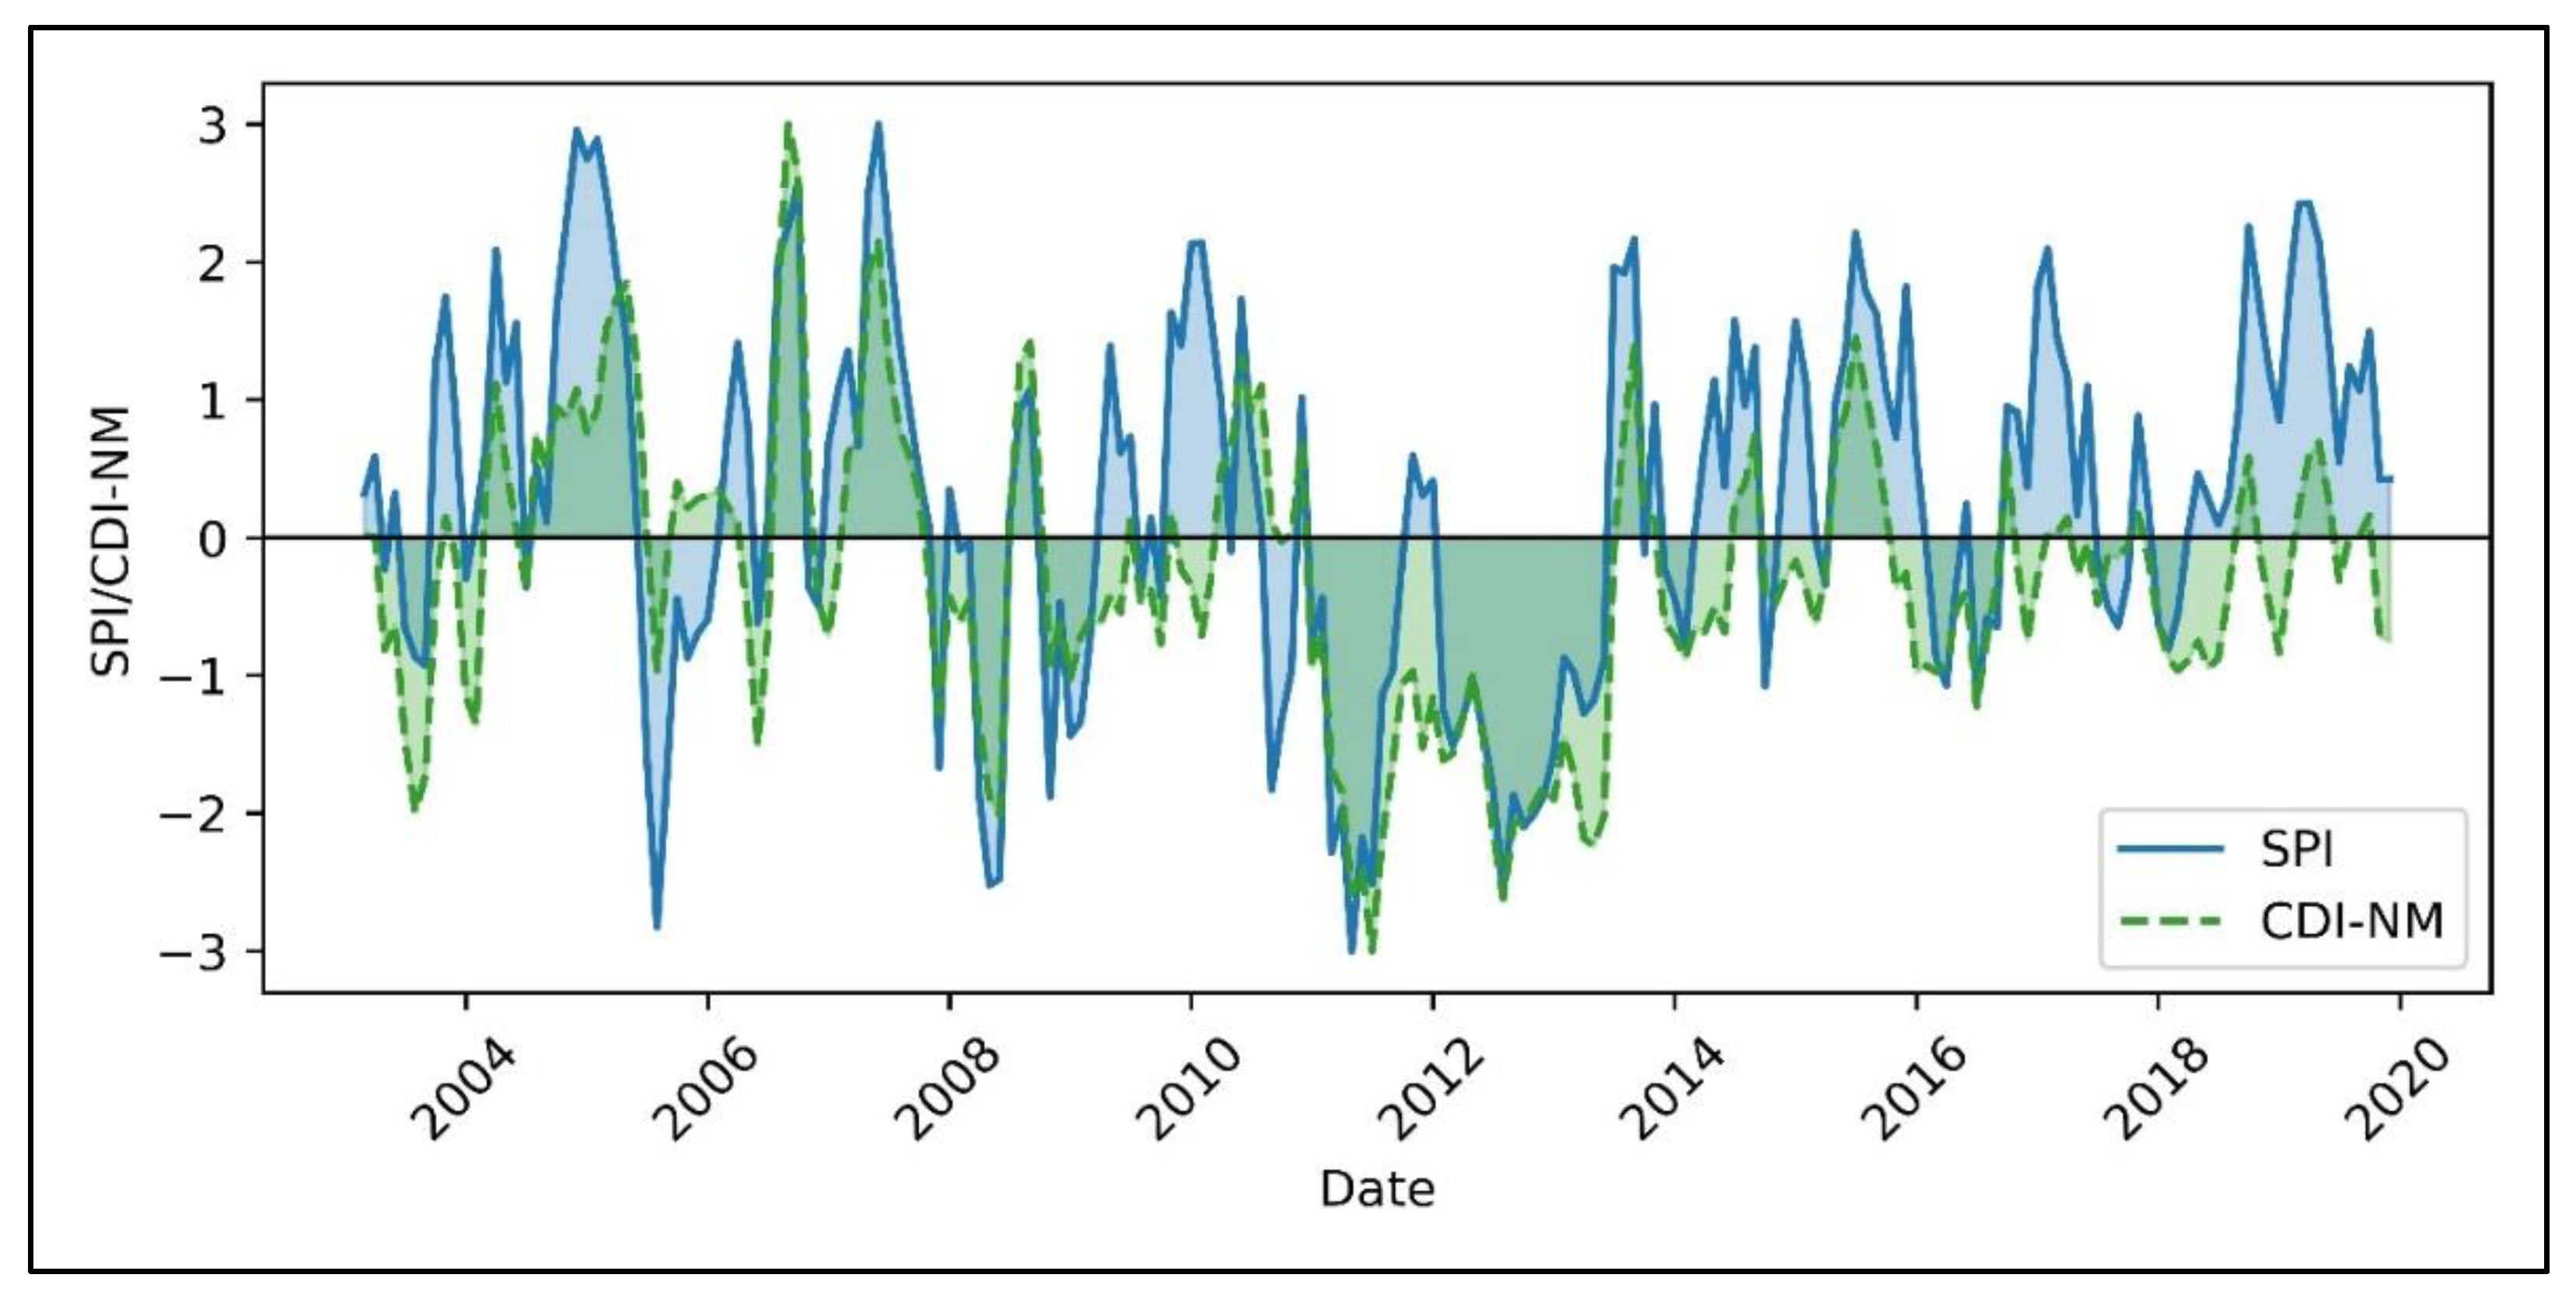
4.2. Temporal Variation of Drought Conditions in New Mexico (2003–2020)

The temporal variation of drought conditions in New Mexico from 2003 to 2020 is analyzed using the SPI and the Combined Drought Indicator for New Mexico (CDI-NM) in Figure 6. The SPI (solid blue line) is a widely used meteorological drought index that quantifies precipitation anomalies over specific time scales. In this study, the 3-month Standardized Precipitation Index (SPI-3) was selected for validation because it captures short-term to seasonal drought conditions, which are relevant for many of New Mexico’s key crops such as corn, peanuts, and wheat. These crops typically experience critical growth stages within a 3–4-month window, making SPI-3 suitable for detecting moisture stress during active growing periods. Additionally, SPI-3 is widely used in agricultural drought studies conducted in arid and semi-arid regions due to its sensitivity to short-term climatic variability [19]. In contrast, the CDI-NM (dashed green line) represents a composite drought metric derived through PCA, integrating precipitation, temperature, and vegetation health parameters to capture agricultural drought impacts. The time series graph highlights distinct periods of drought and wet conditions, reflecting the cyclical nature of New Mexico’s climate. Positive SPI values indicate wet periods, whereas negative values represent drought severity. Both indices exhibit synchronized trends, with significant drought events in 2003, 2011–2013, and 2018, characterized by notably negative values. Conversely, wet periods are evident around 2005 and 2015, with positive peaks in both indices. The strong correlation between SPI and CDI-NM (R2 = 0.82) [50] and RMSE = 0.1 [51] demonstrates the consistency between meteorological and agricultural drought assessments. While the CDI-NM closely follows SPI trends, it shows smoother variations due to its integration of broader agricultural impact factors such as soil moisture anomalies and vegetation health. For example, the severe drought from 2011 to 2012 is strongly reflected in both indices, aligning with historical records of extreme water scarcity and agricultural stress in New Mexico as stated by New Mexico Governor’s Drought Task Force’s monthly status report of September 2011 [3]. SPI3 was selected as a validation reference due to its established relevance in short-term agricultural drought assessment and its consistent availability across the study period. Nonetheless, future comparative evaluations involving SPEI or vegetation-based indices may provide additional perspectives on CDI-NM performance.
This event underscores the vulnerability of New Mexico’s water resources and agricultural systems to climatic variability. The combined use of SPI and CDI-NM provides a comprehensive understanding of drought dynamics by bridging meteorological and agricultural perspectives. This approach is critical for developing targeted drought mitigation strategies addressing water availability and agricultural resilience in arid and semi-arid regions.

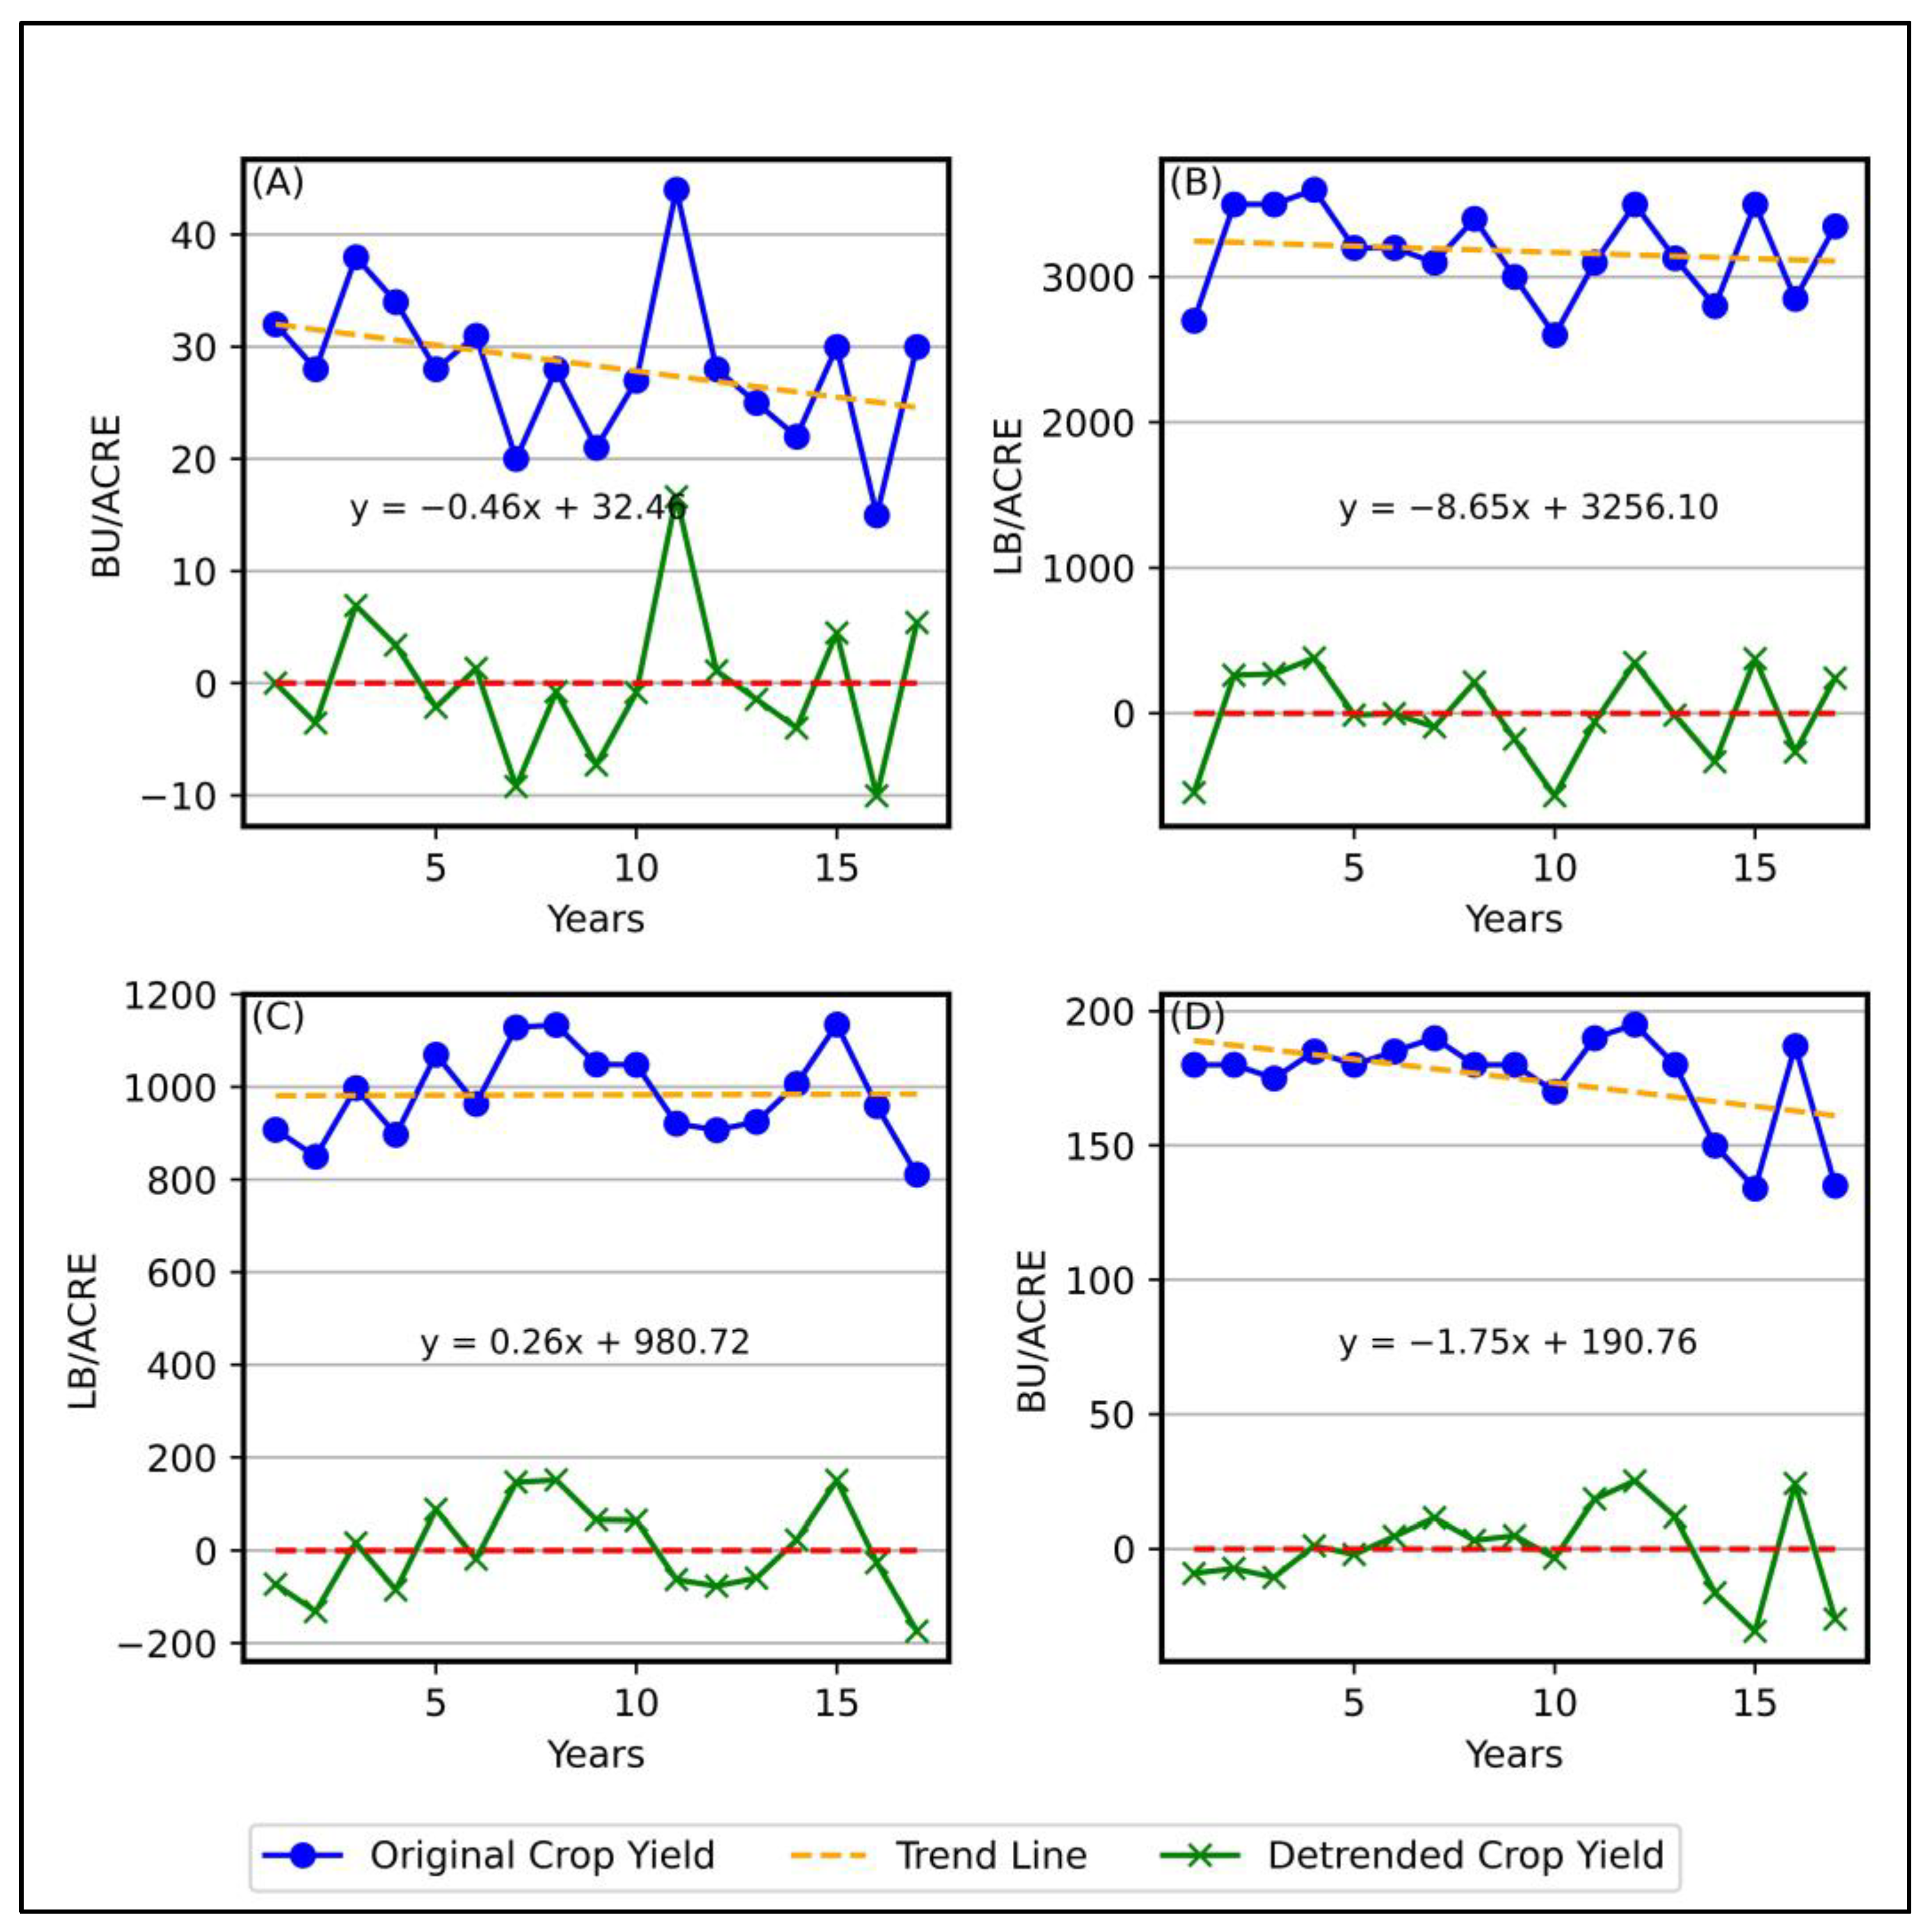
4.3. Validation of CDI-NM Using Crop Yield Data

The temporal relationship between detrended crop yield and CDI-NM was assessed using correlation coefficient analysis. Annual crop yield data for corn, wheat, peanuts, and cotton from 2003 to 2019 were obtained from the USDA National Agricultural Statistics Service (NASS) using the Quick Stats tool. All data were collected at the state level (New Mexico) to align with the spatial resolution of CDI-NM. To minimize the influence of long-term trends due to improvements in technology, irrigation, or crop management practices, each crop’s yield time series was detrended using a linear regression approach, and the residuals were used for correlation analysis. This approach is commonly used in agro-climatic studies to isolate inter-annual variability primarily attributable to climatic factors [52]. A year-to-year comparison was initially conducted to examine the relationship between crop yields and CDI-NM values across New Mexico. The analysis revealed a negative correlation (r < 0) for all comparisons, highlighting the effectiveness of CDI-NM as a drought indicator for the region. Figure 7 illustrates the trends in crop yield and detrended crop yield for New Mexico from 2003 to 2019. Among the major crops analyzed, wheat, peanuts, and corn exhibited a noticeable decline in yield under increasing drought conditions, as shown in Figure 7A,B,D. In contrast, cotton (Figure 7C) appeared to be less sensitive to drought stress, with its yield trend displaying a weaker correlation with CDI-NM. Similar findings were found in the other research articles [53,54,55]. The computed correlation coefficients further support these findings, with values of −0.63 for wheat, −0.54 for peanuts, −0.20 for cotton, and −0.68 for corn. The lower correlation with cotton suggests that it may be more drought-tolerant compared to other crops, possibly due to its physiological adaptation to dry conditions and ability to grow in semi-arid environments [56]. These results underscore the substantial impact of drought on agricultural productivity in the region.
All crop yield data were sourced from the USDA database, and the Quick Stats tool was utilized for data extraction. The findings emphasize the importance of integrating CDI-NM into drought impact assessments to enhance agricultural resilience and inform water resource management strategies in New Mexico.
While this study used annual detrended yield data, this approach has been widely applied in agroclimatic studies to capture drought impacts at broader temporal scales [19,57]. Future studies could improve the resolution by incorporating phenology-aware matching and accounting for irrigation status, where such data are available. The spatial relationship between crop yield and CDI-NM was analyzed using raster data in ArcGIS Pro. A random month was chosen to create the map shown in Figure 8, which displays the spatial correlation between CDI-NM and crop yield. In general, the results show a negative correlation, meaning that as drought conditions worsen, crop yields tend to decline. However, some crops, like cotton, appear to be less affected by drought. Although the correlation was negative, the values were not very high, staying below 0.8. This could be due to the limited years of available crop yield data. Further research is needed to improve the quality of crop yield data to better understand the relationship between drought and crop production. A longer period of analysis and better data accuracy could help to derive clearer results and provide useful insights for managing drought impacts on agriculture. It is important to note that the spatial correlation shown in Figure 8 is for a representative month and was included for illustrative purposes. Future work could expand this spatial analysis across multiple drought years to improve generalizability and statistical robustness. The map was intended as a representative example to illustrate potential spatial relationships between CDI-NM and crop yield. Comprehensive multi-temporal spatial validation was beyond the scope of this study but is recommended for future research to enhance robustness.

5. Conclusions

This research has successfully developed a combined drought indicator for New Mexico utilizing PCA using four key agrometeorological variables (CHIRPS, LST, SMN, and VCI) for temporal analysis of drought in the region. The CDI-NM effectively helped to capture the complex character of agricultural drought in the region, addressing the need for a comprehensive drought monitoring system in the area which is highly vulnerable to drought.
The statistical performance evaluation against the SPI-3 (R2 > 0.8 and RMSE = 0.1) and historical drought mirroring of the CDI confirms the reliability of the CDI-NM in detecting moderate and severe drought conditions. Integration of meteorological and vegetation health parameters helped for effective detection of moderate and severe drought and offered a smoother temporal variability compared to traditional indices. The negative correlation between CDI-NM and crop yield suggests that as drought worsens, crop yield tends to decrease and vice-versa. It suggests that the CDI-NM can capture underlying agricultural drought dynamics that may be overlooked by meteorological assessments alone.
Furthermore, this study highlights the practical application of using advanced statistical methods like PCA in drought monitoring. The study demonstrated the successful integration of multiple remote sensing datasets into a single, interpretable index using PCA. By assigning weights based on the statistical importance of each variable, the CDI-NM provides a flexible framework adaptable across different temporal scales. While this research demonstrates the potential of CDI-NM for integrated drought assessment in New Mexico, its use in real-time decision-making scenarios has not yet been tested. Future efforts could explore operational deployment in collaboration with hydrologists or agricultural agencies to assess its effectiveness in live monitoring and early warning contexts. While this study presents a robust and practical framework for drought assessment, some limitations merit brief acknowledgment. While the SMN and VCI serve different analytical purposes, their shared NDVI foundation may introduce some redundancy. Future studies may consider formal multicollinearity testing or dimensionality reduction to optimize variable selection. Additional factors such as potential NDVI saturation in densely vegetated areas, interpolation-related uncertainties in CHIRPS rainfall data, and the absence of a formal sensitivity analysis of PCA-derived weights may also influence the performance of CDI-NM. While these were not explored in detail here, they represent important directions for future refinement and uncertainty assessment of the index.
The 17-year study period, although adequate for capturing key trends, could be extended in future work to enhance temporal robustness. Additionally, while efforts were made to harmonize input datasets, minor scale mismatches and inherent uncertainties such as NDVI saturation, occasional cloud-related LST gaps, and interpolation variability in CHIRPS rainfall may influence some localized patterns. Nevertheless, the consistent validation results and agreement with historical drought and crop yield trends affirm that CDI-NM remains a reliable and effective tool for agricultural drought monitoring in New Mexico.

Author Contributions

Conceptualization, B.P. and A.K.; Methodology, B.P.; Formal analysis, S.S.; Data curation, D.D.; Investigation, S.S. and R.S.; Writing, B.P., D.D., S.S., R.S. and A.K.; Supervision, A.K. All authors have read and agreed to the published version of the manuscript.

Funding

This research received no external funding.

Institutional Review Board Statement

Not applicable.

Informed Consent Statement

Not applicable.

Data Availability Statement

The data presented in this study is available on request from the corresponding author.

Conflicts of Interest

The authors declare no conflicts of interest.

References

  1. Mani, Z.A.; Khorram-Manesh, A.; Goniewicz, K. Global Health Emergencies of Extreme Drought Events: Historical Impacts and Future Preparedness. Atmosphere 2024, 15, 1137. [Google Scholar] [CrossRef]
  2. Dai, A.; Zhao, T.; Chen, J. Climate Change and Drought: A Precipitation and Evaporation Perspective. Curr. Clim. Change Rep. 2018, 4, 301–312. [Google Scholar] [CrossRef]
  3. New Mexico Governor’s Drought Task Force. Available online: https://www.nmdrought.state.nm.us/dtf_workgroup.php#gsc.tab=0 (accessed on 23 December 2024).
  4. Lee, S.-J.; Kim, N.; Lee, Y. Development of Integrated Crop Drought Index by Combining Rainfall, Land Surface Temperature, Evapotranspiration, Soil Moisture, and Vegetation Index for Agricultural Drought Monitoring. Remote Sens. 2021, 13, 1778. [Google Scholar] [CrossRef]
  5. AghaKouchak, A.; Farahmand, A.; Melton, F.S.; Teixeira, J.; Anderson, M.C.; Wardlow, B.D.; Hain, C.R. Remote Sensing of Drought: Progress, Challenges and Opportunities. Rev. Geophys. 2015, 53, 452–480. [Google Scholar] [CrossRef]
  6. Gewers, F.L.; Ferreira, G.R.; Arruda, H.F.D.; Silva, F.N.; Comin, C.H.; Amancio, D.R.; Costa, L.D.F. Principal Component Analysis: A Natural Approach to Data Exploration. ACM Comput. Surv. 2021, 54, 70. [Google Scholar] [CrossRef]
  7. Pandya, P.; Gontia, N.K.; Parmar, H.V. Development of PCA-Based Composite Drought Index for Agricultural Drought Assessment Using Remote- Sensing. J. Agrometeorol. 2022, 24, 384–392. [Google Scholar] [CrossRef]
  8. Zhiyuan, W.; Dengfeng, W.; Huiping, Z.; Zhiping, Q. Assessment of Soil Heavy Metal Pollution with Principal Component Analysis and Geoaccumulation Index. Procedia Environ. Sci. 2011, 10, 1946–1952. [Google Scholar] [CrossRef]
  9. Gocic, M.; Trajkovic, S. Spatiotemporal Characteristics of Drought in Serbia. J. Hydrol. 2014, 510, 110–123. [Google Scholar] [CrossRef]
  10. Xia, J.; Yang, P.; Zhan, C.; Qiao, Y. Analysis of Changes in Drought and Terrestrial Water Storage in the Tarim River Basin Based on Principal Component Analysis. Hydrol. Res. 2019, 50, 761–777. [Google Scholar] [CrossRef]
  11. Libório, M.P.; da Silva Martinuci, O.; Machado, A.M.C.; Machado-Coelho, T.M.; Laudares, S.; Bernardes, P. Principal Component Analysis Applied to Multidimensional Social Indicators Longitudinal Studies: Limitations and Possibilities. GeoJournal 2022, 87, 1453–1468. [Google Scholar] [CrossRef]
  12. Tarate, S.B.; Patel, N.R.; Danodia, A. A Combined Drought Index for Monitoring and Assessment of Drought Severity over India by Integrating CHIRPS, MODIS and GRACE Data. Environ. Dev. Sustain. 2024. [Google Scholar] [CrossRef]
  13. Ghozat, A.; Sharafati, A.; Hosseini, S.A. Satellite-Based Monitoring of Meteorological Drought over Different Regions of Iran: Application of the CHIRPS Precipitation Product. Environ. Sci. Pollut. Res. 2022, 29, 36115–36132. [Google Scholar] [CrossRef] [PubMed]
  14. Son, N.T.; Chen, C.F.; Chen, C.R.; Chang, L.Y.; Minh, V.Q. Monitoring Agricultural Drought in the Lower Mekong Basin Using MODIS NDVI and Land Surface Temperature Data. Int. J. Appl. Earth Obs. Geoinf. 2012, 18, 417–427. [Google Scholar] [CrossRef]
  15. Jiang, R.; Liang, J.; Zhao, Y.; Wang, H.; Xie, J.; Lu, X.; Li, F. Assessment of Vegetation Growth and Drought Conditions Using Satellite-Based Vegetation Health Indices in Jing-Jin-Ji Region of China. Sci. Rep. 2021, 11, 13775. [Google Scholar] [CrossRef] [PubMed]
  16. Xu, Z.; Cao, L.; Zhong, S.; Liu, G.; Yang, Y.; Zhu, S.; Luo, X.; Di, L. Trends in Global Vegetative Drought From Long-Term Satellite Remote Sensing Data. IEEE J. Sel. Top. Appl. Earth Obs. Remote Sens. 2020, 13, 815–826. [Google Scholar] [CrossRef]
  17. Jiao, W.; Zhang, L.; Chang, Q.; Fu, D.; Cen, Y.; Tong, Q. Evaluating an Enhanced Vegetation Condition Index (VCI) Based on VIUPD for Drought Monitoring in the Continental United States. Remote Sens. 2016, 8, 224. [Google Scholar] [CrossRef]
  18. Bento, V.A.; Gouveia, C.M.; DaCamara, C.C.; Trigo, I.F. A Climatological Assessment of Drought Impact on Vegetation Health Index. Agric. For. Meteorol. 2018, 259, 286–295. [Google Scholar] [CrossRef]
  19. Bayissa, Y.A.; Tadesse, T.; Svoboda, M.; Wardlow, B.; Poulsen, C.; Swigart, J.; Van Andel, S.J. Developing a Satellite-Based Combined Drought Indicator to Monitor Agricultural Drought: A Case Study for Ethiopia. GIScience Remote Sens. 2019, 56, 718–748. [Google Scholar] [CrossRef]
  20. Funk, C.; Peterson, P.; Landsfeld, M.; Pedreros, D.; Verdin, J.; Shukla, S.; Husak, G.; Rowland, J.; Harrison, L.; Hoell, A.; et al. The Climate Hazards Infrared Precipitation with Stations—A New Environmental Record for Monitoring Extremes. Sci. Data 2015, 2, 150066. [Google Scholar] [CrossRef]
  21. Sandeep, P.; Obi Reddy, G.P.; Jegankumar, R.; Arun Kumar, K.C. Monitoring of Agricultural Drought in Semi-Arid Ecosystem of Peninsular India through Indices Derived from Time-Series CHIRPS and MODIS Datasets. Ecol. Indic. 2021, 121, 107033. [Google Scholar] [CrossRef]
  22. Du, H.; Tan, M.L.; Zhang, F.; Chun, K.P.; Li, L.; Kabir, M.H. Evaluating the Effectiveness of CHIRPS Data for Hydroclimatic Studies. Theor. Appl. Climatol. 2024, 155, 1519–1539. [Google Scholar] [CrossRef]
  23. Wan, Z.; Wang, P.; Li, X. Using MODIS Land Surface Temperature and Normalized Difference Vegetation Index Products for Monitoring Drought in the Southern Great Plains, USA. Int. J. Remote Sens. 2004, 25, 61–72. [Google Scholar] [CrossRef]
  24. Rani, S.; Mal, S. Trends in Land Surface Temperature and Its Drivers over the High Mountain Asia. Egypt. J. Remote Sens. Space Sci. 2022, 25, 717–729. [Google Scholar] [CrossRef]
  25. Mondal, S.; Jeganathan, C.; Amarnath, G.; Pani, P. Time-Series Cloud Noise Mapping and Reduction Algorithm for Improved Vegetation and Drought Monitoring. GIScience Remote Sens. 2017, 54, 202–229. [Google Scholar] [CrossRef]
  26. Domenikiotis, C.; Spiliotopoulos, M.; Tsiros, E.; Dalezios, N. Application of NOAA/AVHRR VCI for Drought Monitoring in Thessaly. In Proceedings of the 6th International Conference of Protection and Restoration of the Environment, Skiathos, Greece, 1–5 July 2002. [Google Scholar]
  27. Kogan, F.N. Droughts of the Late 1980s in the United States as Derived from NOAA Polar-Orbiting Satellite Data. Bull. Am. Meteorol. Soc. 1995, 76, 655–668. [Google Scholar] [CrossRef]
  28. Kogan, F.N. Global Drought Watch from Space. Bull. Am. Meteorol. Soc. 1997, 78, 621–636. [Google Scholar] [CrossRef]
  29. Bahmani, S.; Naganna, S.R.; Ghorbani, M.A.; Shahabi, M.; Asadi, E.; Shahid, S. Geographically Weighted Regression Hybridized with Kriging Model for Delineation of Drought-Prone Areas. Environ. Model. Assess. 2021, 26, 803–821. [Google Scholar] [CrossRef]
  30. Rajsekhar, D.; Singh, V.P.; Mishra, A.K. Multivariate Drought Index: An Information Theory Based Approach for Integrated Drought Assessment. J. Hydrol. 2015, 526, 164–182. [Google Scholar] [CrossRef]
  31. Shim, I.; Kim, H.; Hong, B.; An, J.; Hwang, T. Drought Vulnerability Assessment and Cluster Analysis of Island Areas Taking Korean Island Areas at Eup (Town) and Myeon (Subcounty) Levels as Study Targets. Water 2021, 13, 3657. [Google Scholar] [CrossRef]
  32. Zhu, Z.; Li, Y.; Liu, T.; Shi, R.; Xu, X.; Song, Z.; Wang, Y. Comparison of the Differences in Tolerance to Drought Stress across Five Clematis Species Based on Seed Germination and Seedling Growth. Horticulturae 2024, 10, 288. [Google Scholar] [CrossRef]
  33. Kim, J.E.; Yu, J.; Ryu, J.-H.; Lee, J.-H.; Kim, T.-W. Assessment of Regional Drought Vulnerability and Risk Using Principal Component Analysis and a Gaussian Mixture Model. Nat. Hazards 2021, 109, 707–724. [Google Scholar] [CrossRef]
  34. Kim, S.; Shao, W.; Kam, J. Spatiotemporal Patterns of US Drought Awareness. Palgrave Commun. 2019, 5, 107. [Google Scholar] [CrossRef]
  35. Wilks, D.S. Statistical Methods in the Atmospheric Sciences; Academic Press: Cambridge, MA, USA, 2011; ISBN 978-0-12-385023-2. [Google Scholar]
  36. Jolliffe, I.T.; Cadima, J. Principal Component Analysis: A Review and Recent Developments. Philos. Trans. R. Soc. A Math. Phys. Eng. Sci. 2016, 374, 20150202. [Google Scholar] [CrossRef] [PubMed]
  37. Zheng, Y.; Zhang, X.; Yu, J.; Xu, Y.; Wang, Q.; Li, C.; Yao, X. Assessing the Joint Impact of Climatic Variables on Meteorological Drought Using Machine Learning. Front. Earth Sci. 2022, 10, 835142. [Google Scholar] [CrossRef]
  38. Mahmoudi, M.R.; Zarei, A.R. Modified Version of the Cross-Correlation Function to Measure Drought Occurrence Time-Delay Correlation. J. Water Clim. Change 2023, 14, 454–476. [Google Scholar] [CrossRef]
  39. Quiring, S.M.; Ganesh, S. Evaluating the Utility of the Vegetation Condition Index (VCI) for Monitoring Meteorological Drought in Texas. Agric. For. Meteorol. 2010, 150, 330–339. [Google Scholar] [CrossRef]
  40. Bento, V.A.; Trigo, I.F.; Gouveia, C.M.; DaCamara, C.C. Contribution of Land Surface Temperature (TCI) to Vegetation Health Index: A Comparative Study Using Clear Sky and All-Weather Climate Data Records. Remote Sens. 2018, 10, 1324. [Google Scholar] [CrossRef]
  41. Garai, S.; Khatun, M.; Singh, R.; Sharma, J.; Pradhan, M.; Ranjan, A.; Rahaman, S.M.; Khan, M.L.; Tiwari, S. Assessing Correlation between Rainfall, Normalized Difference Vegetation Index (NDVI) and Land Surface Temperature (LST) in Eastern India. Saf. Extrem. Environ. 2022, 4, 119–127. [Google Scholar] [CrossRef]
  42. Sun, F.; Chen, Q.; Chen, Q.; Jiang, M.; Gao, W.; Qu, Y. Screening of Key Drought Tolerance Indices for Cotton at the Flowering and Boll Setting Stage Using the Dimension Reduction Method. Front. Plant Sci. 2021, 12, 619926. [Google Scholar] [CrossRef]
  43. Tadić, L.; Brleković, T.; Potočki, K.; Leko-Kos, M. Application of Principal Component Analysis to Drought Indicators of Three Representative Croatian Regions. Elektron. Časopis Građevinskog Fak. Osijek 2021, 12, 41–55. [Google Scholar] [CrossRef]
  44. Santos, R.; Carvalho, M.; Rosa, E.; Carnide, V.; Castro, I. Root and Agro-Morphological Traits Performance in Cowpea under Drought Stress. Agronomy 2020, 10, 1604. [Google Scholar] [CrossRef]
  45. Faiz, M.A.; Zhang, Y.; Zhang, X.; Ma, N.; Aryal, S.K.; Ha, T.T.V.; Baig, F.; Naz, F. A Composite Drought Index Developed for Detecting Large-Scale Drought Characteristics. J. Hydrol. 2022, 605, 127308. [Google Scholar] [CrossRef]
  46. Wang, R.; Peng, W.; Wang, R.; Peng, W. Principal Component Analysis and Comprehensive Evaluation on Drought Tolerance Difference of Canola Cultivars at Germination and Emergence Stages. Chil. J. Agric. Res. 2021, 81, 557–567. [Google Scholar] [CrossRef]
  47. Başakın, E.E.; Stoy, P.C.; Demirel, M.C.; Ozdogan, M.; Otkin, J.A. Combined Drought Index Using High-Resolution Hydrological Models and Explainable Artificial Intelligence Techniques in Türkiye. Remote Sens. 2024, 16, 3799. [Google Scholar] [CrossRef]
  48. Johnny Jesudhas, C.; C, J.T.; Roy, T. Remote Sensing-Based Drought Hazard Monitoring and Assessment in a Coastal Plain: A Principal Component Approach. Environ. Res. 2024, 243, 117757. [Google Scholar] [CrossRef] [PubMed]
  49. Kulkarni, S.S.; Wardlow, B.D.; Bayissa, Y.A.; Tadesse, T.; Svoboda, M.D.; Gedam, S.S. Developing a Remote Sensing-Based Combined Drought Indicator Approach for Agricultural Drought Monitoring over Marathwada, India. Remote Sens. 2020, 12, 2091. [Google Scholar] [CrossRef]
  50. Poudel, B.; Dahal, D.; Banjara, M.; Kalra, A. Assessing Meteorological Drought Patterns and Forecasting Accuracy with SPI and SPEI Using Machine Learning Models. Forecasting 2024, 6, 1026–1044. [Google Scholar] [CrossRef]
  51. Alawsi, M.A.; Zubaidi, S.L.; Al-Bdairi, N.S.S.; Al-Ansari, N.; Hashim, K. Drought Forecasting: A Review and Assessment of the Hybrid Techniques and Data Pre-Processing. Hydrology 2022, 9, 115. [Google Scholar] [CrossRef]
  52. Lu, J.; Carbone, G.J.; Gao, P. Detrending Crop Yield Data for Spatial Visualization of Drought Impacts in the United States, 1895–2014. Agric. For. Meteorol. 2017, 237–238, 196–208. [Google Scholar] [CrossRef]
  53. Ahmad, Z.; Waraich, E.A.; Akhtar, S.; Anjum, S.; Ahmad, T.; Mahboob, W.; Hafeez, O.B.A.; Tapera, T.; Labuschagne, M.; Rizwan, M. Physiological Responses of Wheat to Drought Stress and Its Mitigation Approaches. Acta Physiol. Plant 2018, 40, 80. [Google Scholar] [CrossRef]
  54. Potop, V. Evolution of Drought Severity and Its Impact on Corn in the Republic of Moldova. Theor. Appl. Climatol. 2011, 105, 469–483. [Google Scholar] [CrossRef]
  55. Tojo Soler, C.M.; Suleiman, A.; Anothai, J.; Flitcroft, I.; Hoogenboom, G. Scheduling Irrigation with a Dynamic Crop Growth Model and Determining the Relation between Simulated Drought Stress and Yield for Peanut. Irrig. Sci. 2013, 31, 889–901. [Google Scholar] [CrossRef]
  56. Zafar, M.M.; Chattha, W.S.; Khan, A.I.; Zafar, S.; Subhan, M.; Saleem, H.; Ali, A.; Ijaz, A.; Anwar, Z.; Qiao, F.; et al. Drought and Heat Stress on Cotton Genotypes Suggested Agro-Physiological and Biochemical Features for Climate Resilience. Front. Plant Sci. 2023, 14, 1265700. [Google Scholar] [CrossRef] [PubMed]
  57. Vogel, E.; Donat, M.G.; Alexander, L.V.; Meinshausen, M.; Ray, D.K.; Karoly, D.; Meinshausen, N.; Frieler, K. The Effects of Climate Extremes on Global Agricultural Yields. Environ. Res. Lett. 2019, 14, 054010. [Google Scholar] [CrossRef]
Figure 1. Study area maps of (a) United States and (b) New Mexico State.
Atmosphere 16 00818 g001
Figure 2. Flowchart of CDI formulation.
Atmosphere 16 00818 g002
Figure 3. Percentile ranking of drought based on the SPI.
Atmosphere 16 00818 g003
Figure 4. Scree plot showing the variance explained by each principal component.
Atmosphere 16 00818 g004
Figure 5. Biplot illustrating variable contributions to PC1 and PC2.
Atmosphere 16 00818 g005
Figure 6. Temporal variation of drought in New Mexico using SPI and CDI-NM.
Atmosphere 16 00818 g006
Figure 7. Crop yield pattern of (A) wheat, (B) peanuts, (C) cotton, and (D) corn.
Atmosphere 16 00818 g007
Figure 8. Correlation coefficient map between CDI-NM and crop yield.
Atmosphere 16 00818 g008
Table 1. Test scores.
TestValue
Kaiser–Meyer–Olkin (KMO)0.786
Bartlett’s Test of Sphericity
Approx. Chi-squared26.5
Degree of Freedom (DF)6
Significance (Sig.)0.00013
Table 2. CDI-NM classification based on SPI (McKee, Doesken, and Kleist (1993)).
CDI-NMPercentileDrought Category
0 to −0.9961.39%Mild drought
−1.00 to −1.4918.81%Moderate drought
−1.50 to −1.9912.87%Severe drought
≤−2.005.94%Extreme Drought
Table 3. Correlation matrix of drought variables.
Covariance MatrixVCILSTSMNRainfall
VCI1.00−0.430.350.78
LST−0.431.00−0.4−0.48
SMN0.35−0.41.000.56
Rainfall0.78−0.480.561.00
Table 4. Eigenvector loading for each principal component from PCA.
LoadingsPC1PC2PC3PC4
VCI0.680.18−0.440.56
LST−0.540.570.160.60
SMN0.150.79−0.16−0.57
Rainfall0.470.130.870.07
Disclaimer/Publisher’s Note: The statements, opinions and data contained in all publications are solely those of the individual author(s) and contributor(s) and not of MDPI and/or the editor(s). MDPI and/or the editor(s) disclaim responsibility for any injury to people or property resulting from any ideas, methods, instructions or products referred to in the content.

