1. Introduction
Dust aerosols, comprising solid particles ranging from nanometers to micrometers, are generated by natural processes such as wind erosion and dust storms or anthropogenic activities like land reclamation [
1]. As a major global aerosol type, dust aerosols significantly influence Earth’s radiative balance and climate system through direct effects (scattering or absorbing solar radiation) and indirect effects (acting as cloud condensation nuclei to modulate cloud formation and precipitation) [
2]. Their high reflectivity and low hygroscopicity result in complex roles in regional radiative forcing and climate regulation [
3]. Furthermore, fine particulate matter (PM
2.5) within dust aerosols poses significant risks to air quality and public health, being strongly associated with respiratory diseases, cardiovascular conditions, and premature mortality [
4].
Dust aerosols exhibit significant variability depending on their source regions, particle size distributions, and chemical compositions, which affect their optical properties and environmental impacts. For instance, pure dust from arid regions like the Taklimakan and Gobi Deserts typically consists of larger mineral particles with high reflectivity, affecting radiative forcing by scattering solar radiation. In contrast, polluted dust, often mixed with anthropogenic pollutants such as sulfates or black carbon, exhibits smaller particle sizes and enhanced absorption, altering cloud formation and precipitation patterns. These differences are critical for climate modeling and air quality assessment. Additionally, fine dust particles (PM2.5) penetrate deep into the lungs, posing severe health risks, particularly in dust-storm-prone regions like Northwest China, thus highlighting the need for accurate classification to inform mitigation strategies.
In arid and semi-arid regions, such as East and Central Asia, where dust storms are frequent, precise retrieval of the spatiotemporal distribution of dust aerosols is critical for improving climate modeling, informing environmental management, and mitigating health risks [
5,
6].
Satellite remote sensing, with its extensive coverage and high spatiotemporal resolution, has become a cornerstone for accurate dust aerosol retrieval [
7]. The Cloud-Aerosol Lidar and Infrared Pathfinder Satellite Observations (CALIPSO) mission, equipped with the Cloud-Aerosol Lidar with Orthogonal Polarization (CALIOP), provides vertical profiles and optical properties of aerosols using backscatter and polarization data at 532 nm and 1064 nm wavelengths [
8]. CALIPSO’s Level 2 products, including aerosol optical depth (AOD) and the Vertical Feature Mask (VFM), facilitate preliminary identification and retrieval of dust aerosols [
9]. However, traditional retrieval algorithms, which depend on predefined thresholds and empirical models, are vulnerable to signal noise, aerosol mixing, and complex surface reflectance, resulting in suboptimal accuracy [
10]. This is particularly pronounced in high-concentration regions where dust and polluted aerosols coexist, as traditional methods struggle to isolate dust signals, limiting the utility of CALIPSO data in regional climate and environmental studies [
11]. Consequently, developing high-precision, robust methods for dust aerosol retrieval is essential for quantifying their radiative effects, deposition patterns, and impacts on ecosystems and human health [
12].
Traditional retrieval methods, such as lookup tables or differential absorption spectroscopy, struggle to address the complex spatiotemporal variability of dust aerosols [
13]. In recent years, deep learning has emerged as a transformative tool for processing remote sensing data [
14]. Convolutional Neural Networks (CNNs), with their robust feature extraction capabilities, have been applied to retrieve aerosol optical properties and distributions [
15]. The U-Net architecture, with its encoder–decoder structure, excels at capturing both local and global features of aerosol signals, making it well-suited for processing CALIPSO’s vertical profile data [
10,
16]. Nonetheless, dust aerosol retrieval faces challenges such as class imbalance (disparities in sample sizes between dust and polluted dust) and complex mixing scenarios, which constrain the performance of traditional U-Net models in achieving high-precision retrieval [
17].
To achieve precise dust aerosol retrieval, this study proposes an enhanced one-dimensional U-Net model based on CALIPSO Level 1B and Level 2 data. The model integrates the following key components: (1) an Inception module to capture the spatial variability of dust aerosols through multi-scale convolutions [
18]; (2) a Convolutional Block Attention Module (CBAM) to enhance critical feature extraction via channel and spatial attention mechanisms [
19]; and (3) a Transformer module to model long-range dependencies, improving the understanding of complex aerosol mixing scenarios [
20]. To address class imbalance, a hybrid loss function combining focal loss and Dice loss is designed to enhance retrieval accuracy for rare categories, such as polluted dust [
21]. Additionally, an auxiliary classifier is introduced to optimize the separation of dust and polluted dust.
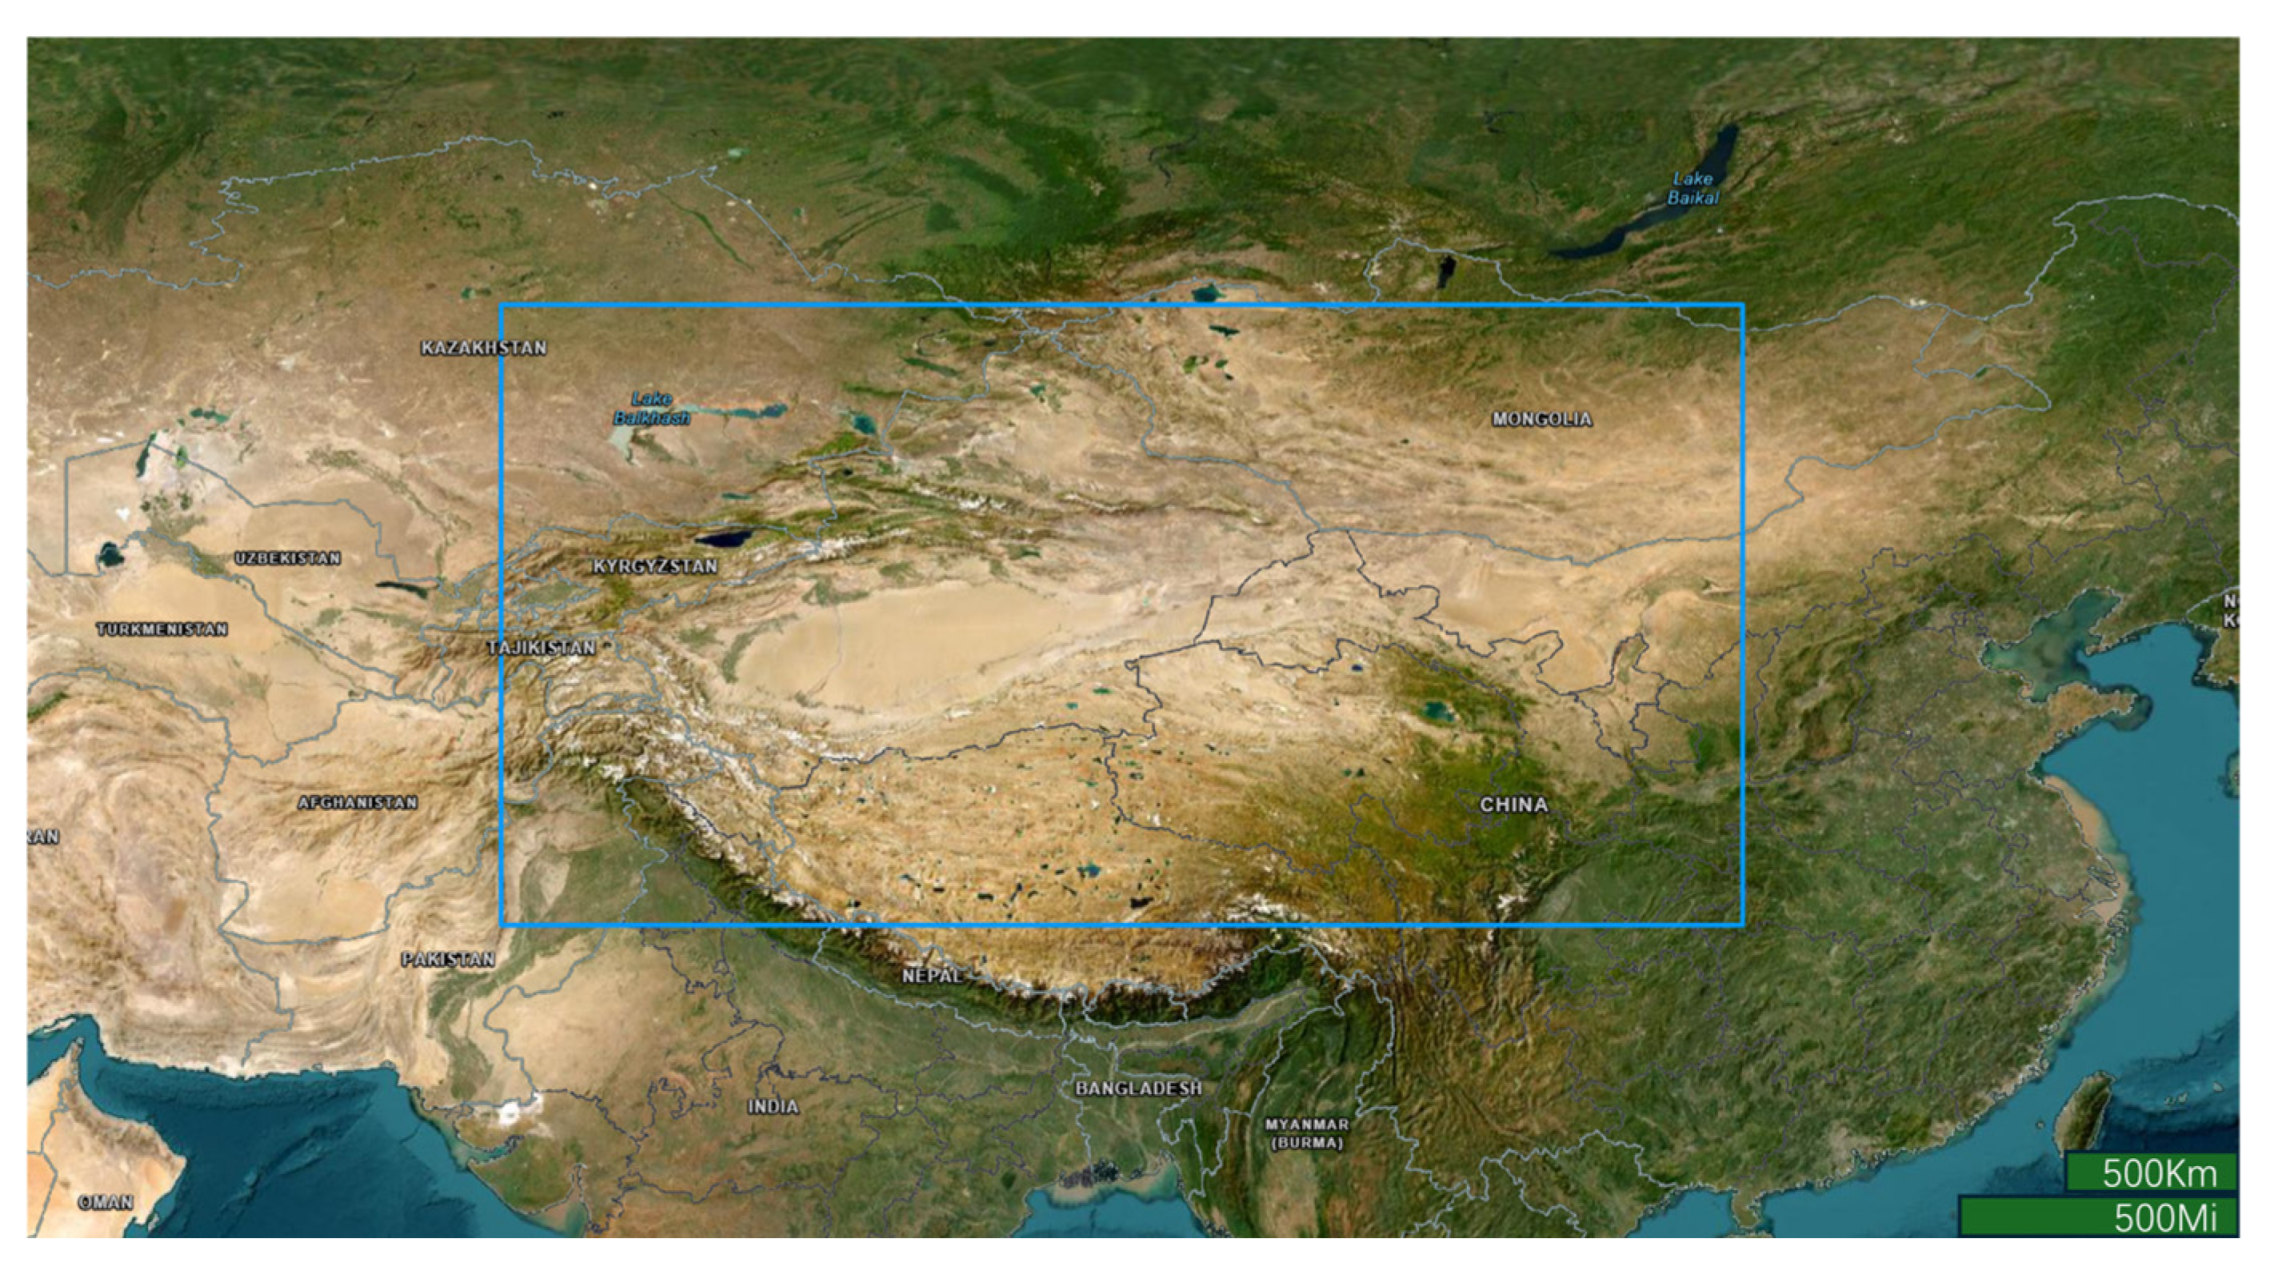
This study focuses on the region spanning 30–50° N and 70–110° E (
Figure 1), covering major dust source areas in East and Central Asia, such as the Taklimakan and Gobi Deserts, alongside urban and industrial zones. CALIPSO’s lidar observations, with high vertical (30 m) and horizontal (333 m) resolution, are well-suited for this vast region, effectively capturing aerosol profiles across diverse environments, from arid deserts to complex urban areas with mixed dust and anthropogenic emissions [
18]. This versatility ensures accurate dust aerosol retrieval despite varying atmospheric and surface conditions. By analyzing CALIPSO data, this study aims to achieve precise dust aerosol retrieval and elucidate their vertical distribution. The research objectives are (1) to develop and validate the enhanced U-Net model for accurate dust aerosol retrieval; (2) to evaluate the contributions of the Inception, CBAM, and Transformer modules to retrieval accuracy; and (3) to compare the performance of different model architectures in terms of retrieval accuracy and robustness. Precise dust aerosol retrieval will significantly enhance the accuracy of regional climate models and provide a scientific foundation for air quality management strategies [
17].
To ensure retrieval accuracy, this study employs systematic preprocessing of CALIPSO data, including geographic filtering, data alignment, and normalization. Weighted random sampling and data augmentation techniques are used to mitigate class imbalance and data sparsity. The training process leverages the AdamW optimizer and a cosine annealing learning rate schedule to improve model convergence and generalization. The paper is structured as follows:
Section 2 details the data processing workflow;
Section 3 describes the experimental methodology;
Section 4 analyzes model retrieval performance, limitations, and dust aerosol distribution characteristics; and
Section 5 summarizes this study’s contributions and outlines directions for future research.
2. Data
The Cloud-Aerosol Lidar and Infrared Pathfinder Satellite Observations (CALIPSO) mission, a joint effort by NASA and CNES, was launched on 28 April 2006 to study the effects of clouds and aerosols on Earth’s radiation budget, climate change, and air quality [
22]. As a component of the international “A-Train” satellite constellation, CALIPSO works in synergy with other satellites (e.g., CloudSat) to provide unprecedented three-dimensional data for analyzing the global climate system. Equipped with its core instrument, the Cloud-Aerosol Lidar with Orthogonal Polarization (CALIOP), which operates at dual wavelengths (532 nm and 1064 nm) with a horizontal resolution of 333 m and a vertical resolution of 30 m, along with the Imaging Infrared Radiometer (IIR) and Wide Field Camera (WFC), CALIPSO delivers detailed vertical profiles of clouds and aerosols. Designed for a three-year lifespan, the mission operated successfully for 17 years until its conclusion on 1 August 2023, amassing a wealth of profile data. Its primary objectives include elucidating the roles of clouds and aerosols in the radiation balance, enhancing understanding of cloud–aerosol interactions to improve climate models, and monitoring the global spatiotemporal distribution of aerosols.
CALIPSO generates a range of data products, with this study focusing on the Level 1B and Level 2 Vertical Feature Mask (VFM) products. Level 1B data provide calibrated backscatter signals (532 nm and 1064 nm), serving as the foundation for advanced data processing. The Level 2 VFM product, derived through sophisticated algorithms, offers spatial distribution and classification of clouds and aerosols (e.g., dust, ice clouds), supporting applications in climate research (e.g., studying stratospheric aerosol radiative effects [
23]), aerosol transport (e.g., tracking Taklamakan Desert dust storms [
24]), cloud physics (e.g., distinguishing cloud thermodynamic phases [
25]), and environmental monitoring (e.g., assessing volcanic ash impacts [
26]). This study utilizes CALIPSO data, specifically the Level 1B and Level 2 VFM products, to advance these research objectives.
This study employs Level 1B and Level 2 Vertical Feature Mask (VFM) data products from the CALIPSO mission to generate input features and labels for deep learning models using a systematic data processing workflow. The data processing begins by loading HDF-format Level 1B and Level 2 VFM files from a specified directory, with filenames adhering to CALIPSO’s standard naming conventions. A regular expression is employed to extract timestamps from filenames to pair corresponding files. The pyhdf library is used to read latitude, longitude, and Feature Classification Flags from Level 2 VFM files, as well as total attenuated backscatter coefficients at 532 nm (
) and 1064 nm (
) wavelengths, the 532 nm perpendicular backscatter coefficient (
), and quality control flags (QC_Flag and QC_Flag_2) from Level 1B files. To focus on the study region, data are filtered to the geographic bounds of 30–50° N latitude and 70–110° E longitude, ensuring that each 5 km resolution VFM profile corresponds to 15 Level 1B single-shot laser pulse profiles, all meeting the geographic constraints. Feature extraction involves applying a logarithmic transformation to the 532 nm and 1064 nm backscatter signals to stabilize their numerical range, followed by the calculation of color ratio (CR) and depolarization ratio (DR) based on Equations (1) and (2). A four-channel input is constructed comprising the 532 nm backscatter, 1064 nm backscatter, CR, and DR. Labels are derived by parsing feature types and subtypes from the VFM Feature Classification Flags, generating aerosol classification labels (0–7, with −1 indicating invalid values, clear air, or clouds). To ensure data and model reliability, comprehensive quality assurance and quality control (QA/QC) procedures are implemented throughout the workflow. During data preprocessing, Level 1B and Level 2 VFM files are rigorously checked for invalid values (e.g., NaN or infinite), with corrupted files logged for traceability. Quality control flags from Level 1B data are applied to exclude profiles that fail quality checks, ensuring only high-quality data are processed. Geographically filtered profiles (30–50° N, 70–110° E) are aligned to maintain consistency between Level 1B and Level 2 data. During model training, inputs and outputs are validated for data integrity at each epoch, and invalid batches are discarded using a custom collation function. These QA/QC measures ensure robust data quality and model performance, minimizing errors in aerosol classification.
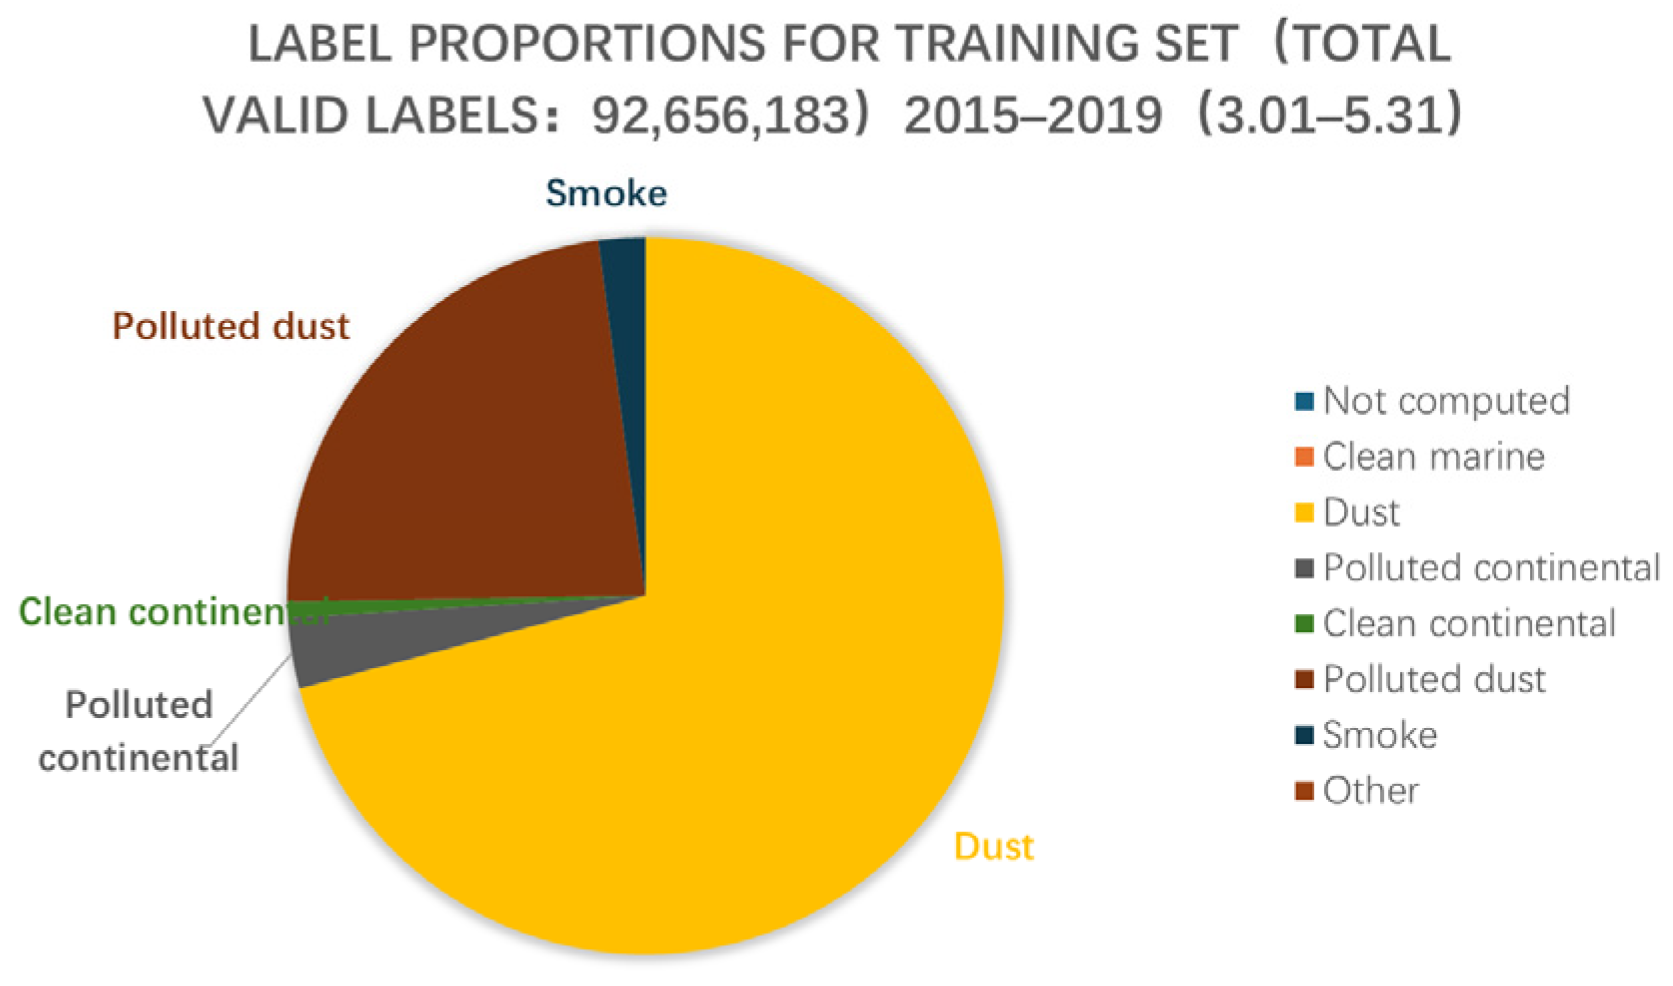
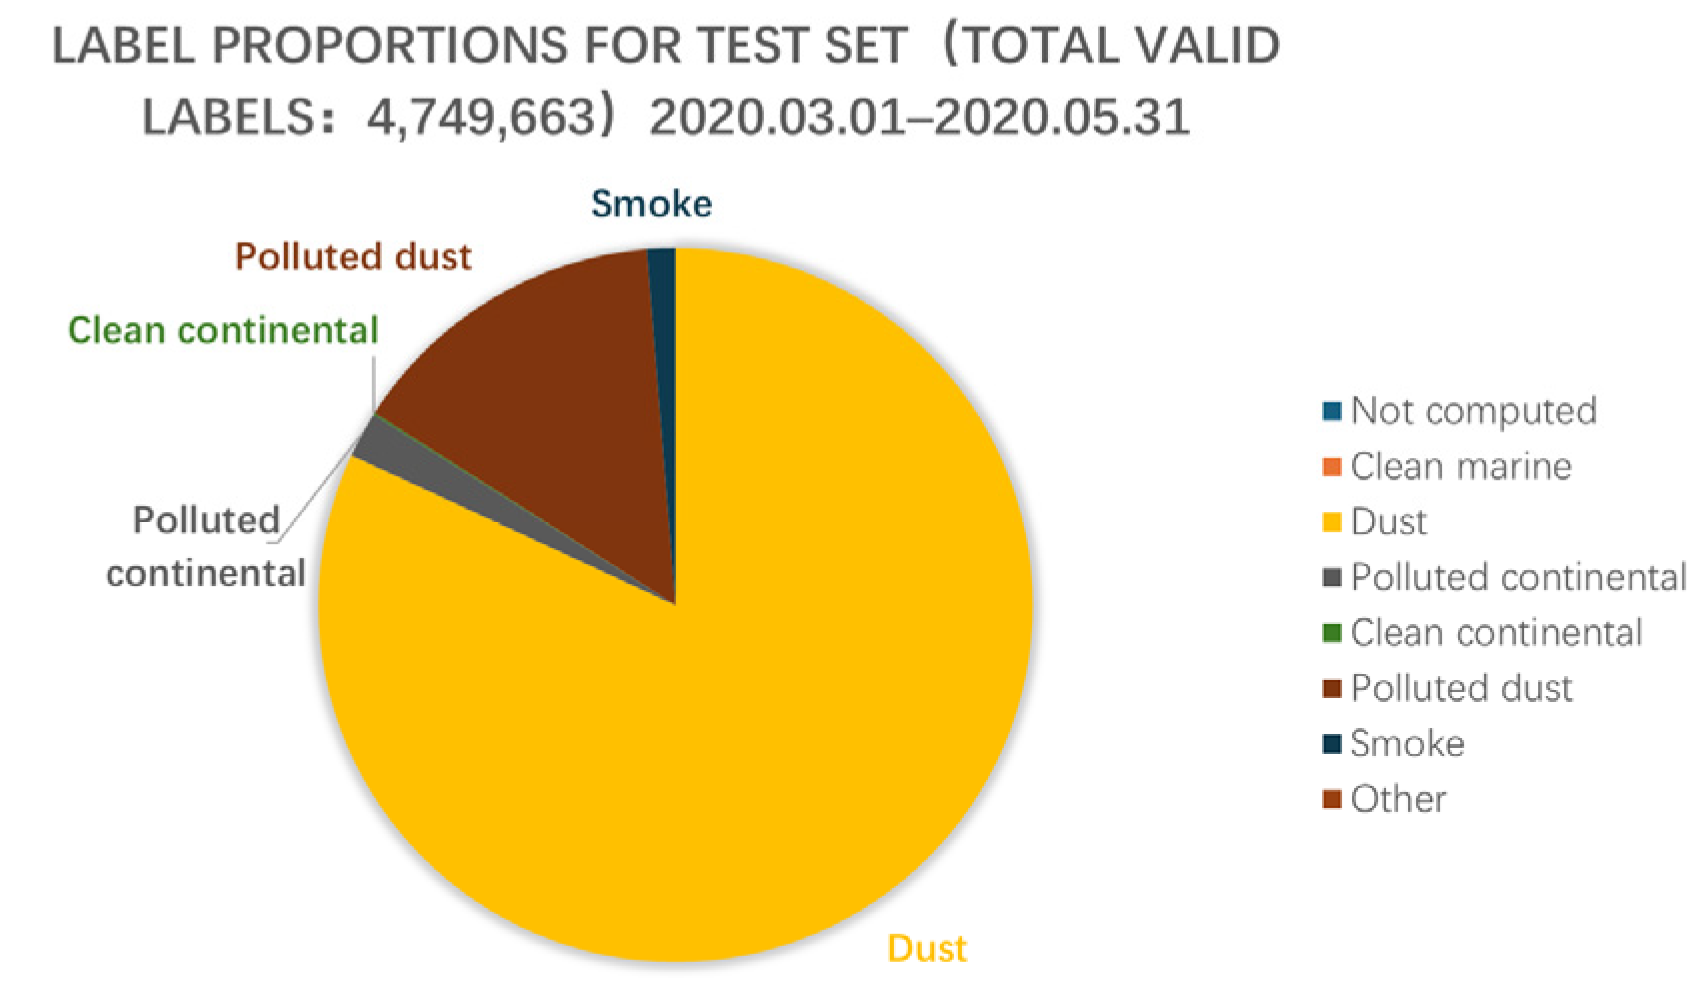
Training and validation datasets were derived from CALIPSO data collected between 1 March and 31 May 2015–2019, with a 9:1 split (see
Figure 2 and
Figure 3), selected to capture seasonal and interannual dust aerosol variability in Northwest China. The test dataset, assessing model generalization, comprises data from 1 March to 31 May 2020 (see
Figure 4). The 2015–2020 period was chosen for its consistent data quality and sufficient volume for robust model training. Although CALIPSO data are available until August 2023, this period aligned with the study’s timeline. Future work will incorporate more recent data (2021–2023) to enhance model relevance and capture evolving aerosol patterns. Input features were standardized per Equation (3) and constrained to [−1 × 10
6, 1 × 10
6] to minimize extreme value impacts. To address class imbalance, elevated sampling weights were assigned to dust and polluted dust categories using WeightedRandomSampler for oversampling. The CalipsoDataset class encapsulates input features, labels, and temporal features, encoded as annual periodic representations from timestamps. Data augmentation, including random noise (0.15–0.3), scaling (0.7–1.3), and cropping (up to 20 altitude points), enhanced robustness for underrepresented classes. These procedures ensure CALIPSO data integrity, standardization, and compatibility, delivering high-quality inputs for a U-Net-based classification model, effectively addressing class imbalance and capturing complex vertical aerosol structures.
In the standardization formula, represents the original input features (e.g., 532 nm and 1064 nm backscatter), is the feature mean, and is the standard deviation.
3. Method
This study develops a deep learning system for aerosol classification using CALIPSO satellite data, incorporating data preprocessing, a custom dataset, multiple U-Net architectures, loss functions, and training and testing modules. The CalipsoDataset encapsulates input features, incorporating temporal features and dynamic data augmentation to enhance performance on rare classes. The Channel Attention and Spatial Attention modules form the CBAM, improving channel and spatial feature selection. The TransformerBlock employs multi-head self-attention to capture global dependencies, while the InceptionModule extracts multi-scale features, and the ResidualWrapper introduces residual connections to improve training stability. The Enhanced 1D U-Net Network serves as the baseline model, integrating Inception, CBAM, Transformer, and a binary classifier to optimize differentiation between dust and polluted dust; variant models (e.g., NoInception 1D U-Net) remove specific components to evaluate their impact.
3.1. U-Net
The U-Net, originally developed for biomedical image segmentation, is an encoder–decoder framework widely used for sequence data processing, such as aerosol classification in this study. The encoder down samples input data via convolutional and pooling operations, extracting multi-scale features from local to global patterns. The decoder upsamples these features using transposed convolutions and integrates high-resolution encoder features through skip connections, preserving detailed information while recovering original resolution. Skip connections mitigate information loss, combining low-level details with high-level semantics [
27]. Adapted as a 1D convolutional network for CALIPSO satellite data, this U-Net incorporates Inception modules, attention mechanisms, CBAM, and Transformer modules to enhance feature representation and classification accuracy, particularly for complex aerosol types like dust and polluted dust under class imbalance. Residual connections and batch normalization ensure training stability, making U-Net ideal for high-precision aerosol classification.
3.2. CBAM
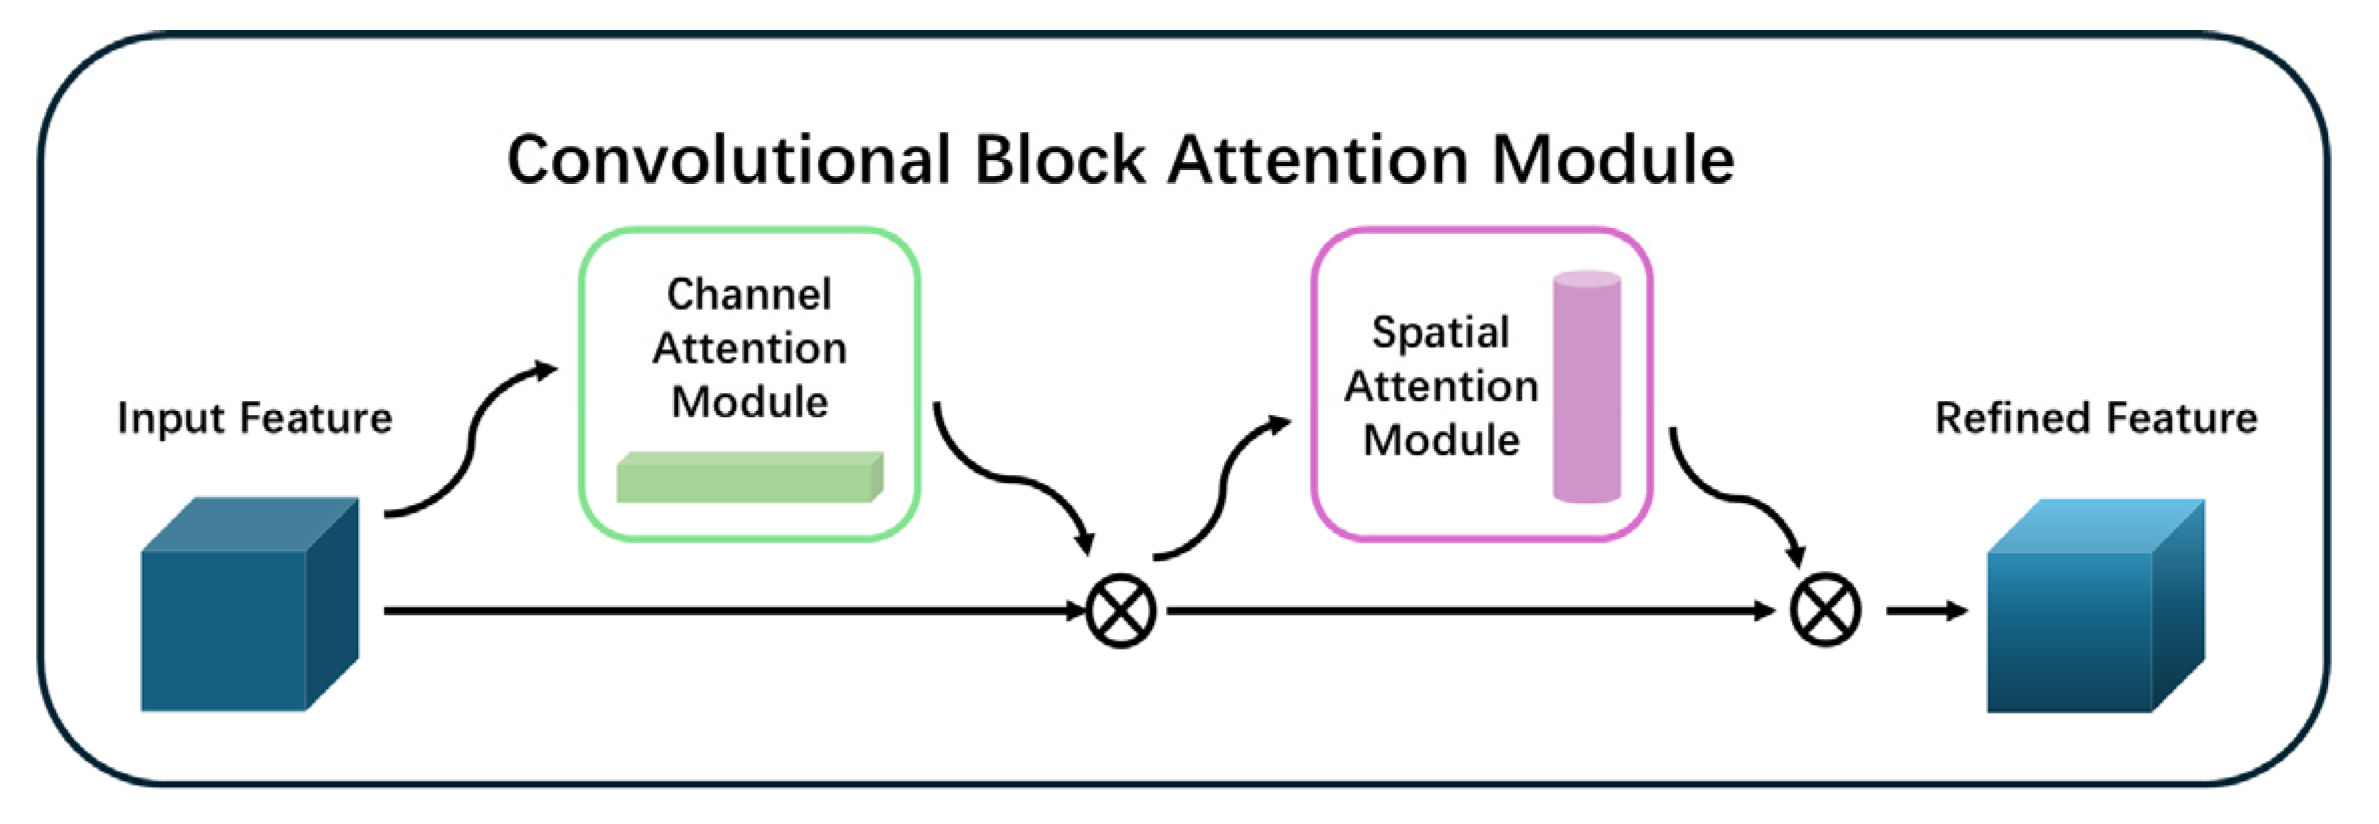
The Convolutional Block Attention Module (CBAM) is an advanced attention mechanism that enhances neural network feature representation by integrating channel and spatial attention mechanisms, as shown in
Figure 5. This dual-attention approach enables CBAM to selectively emphasize informative features across channel and spatial dimensions, thereby improving the model’s ability to capture critical patterns and dependencies within the data.
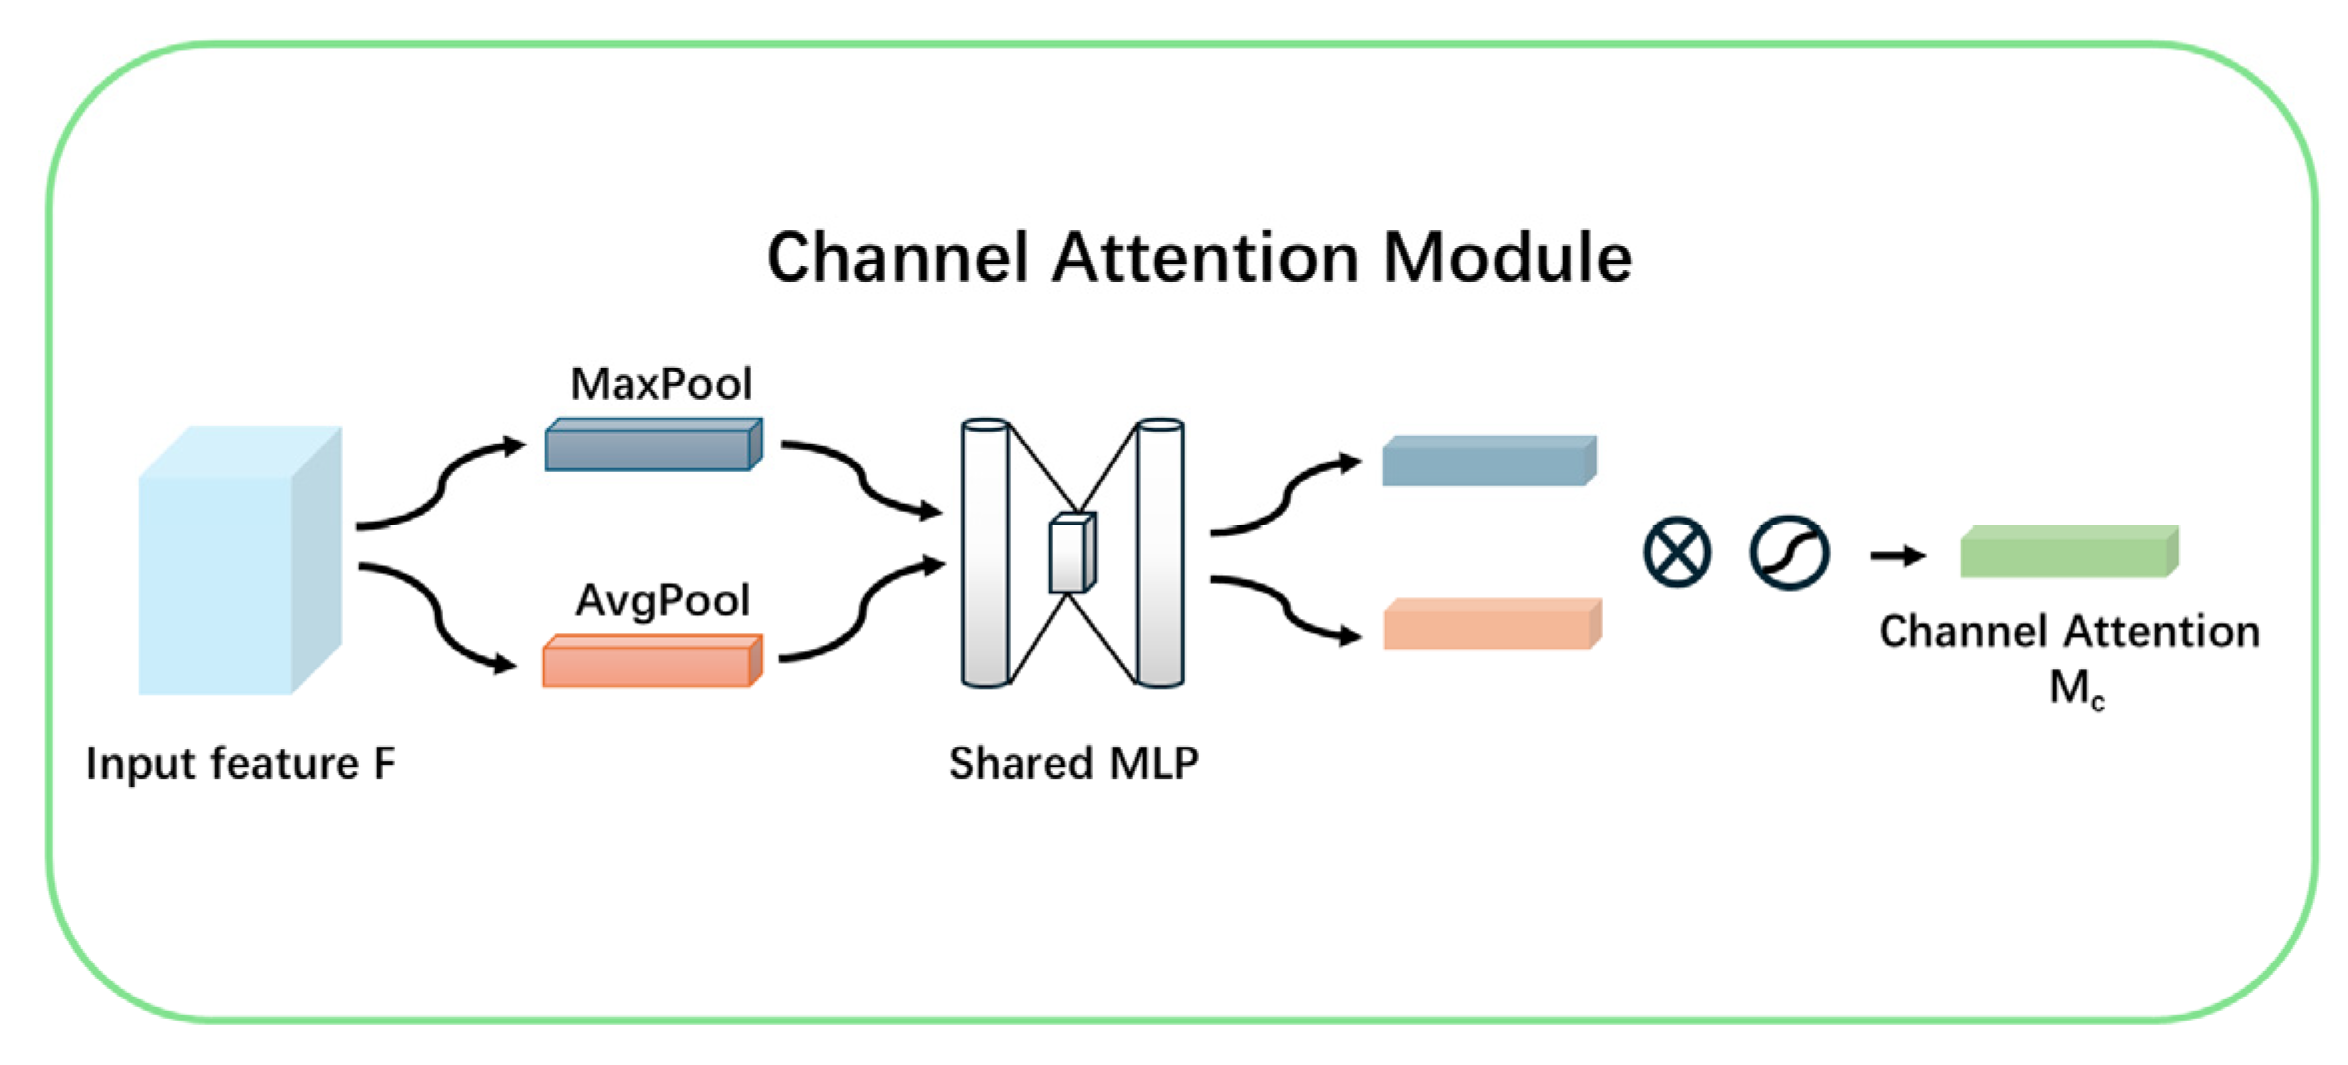
The Channel Attention Module enhances feature extraction by leveraging global average pooling and global max pooling to capture channel-wise characteristics. These features are processed through fully connected layers to produce weights that selectively emphasize channels most relevant to the classification task, as depicted in
Figure 6. This mechanism enables the model to prioritize informative channels, thereby improving its discriminative capacity.
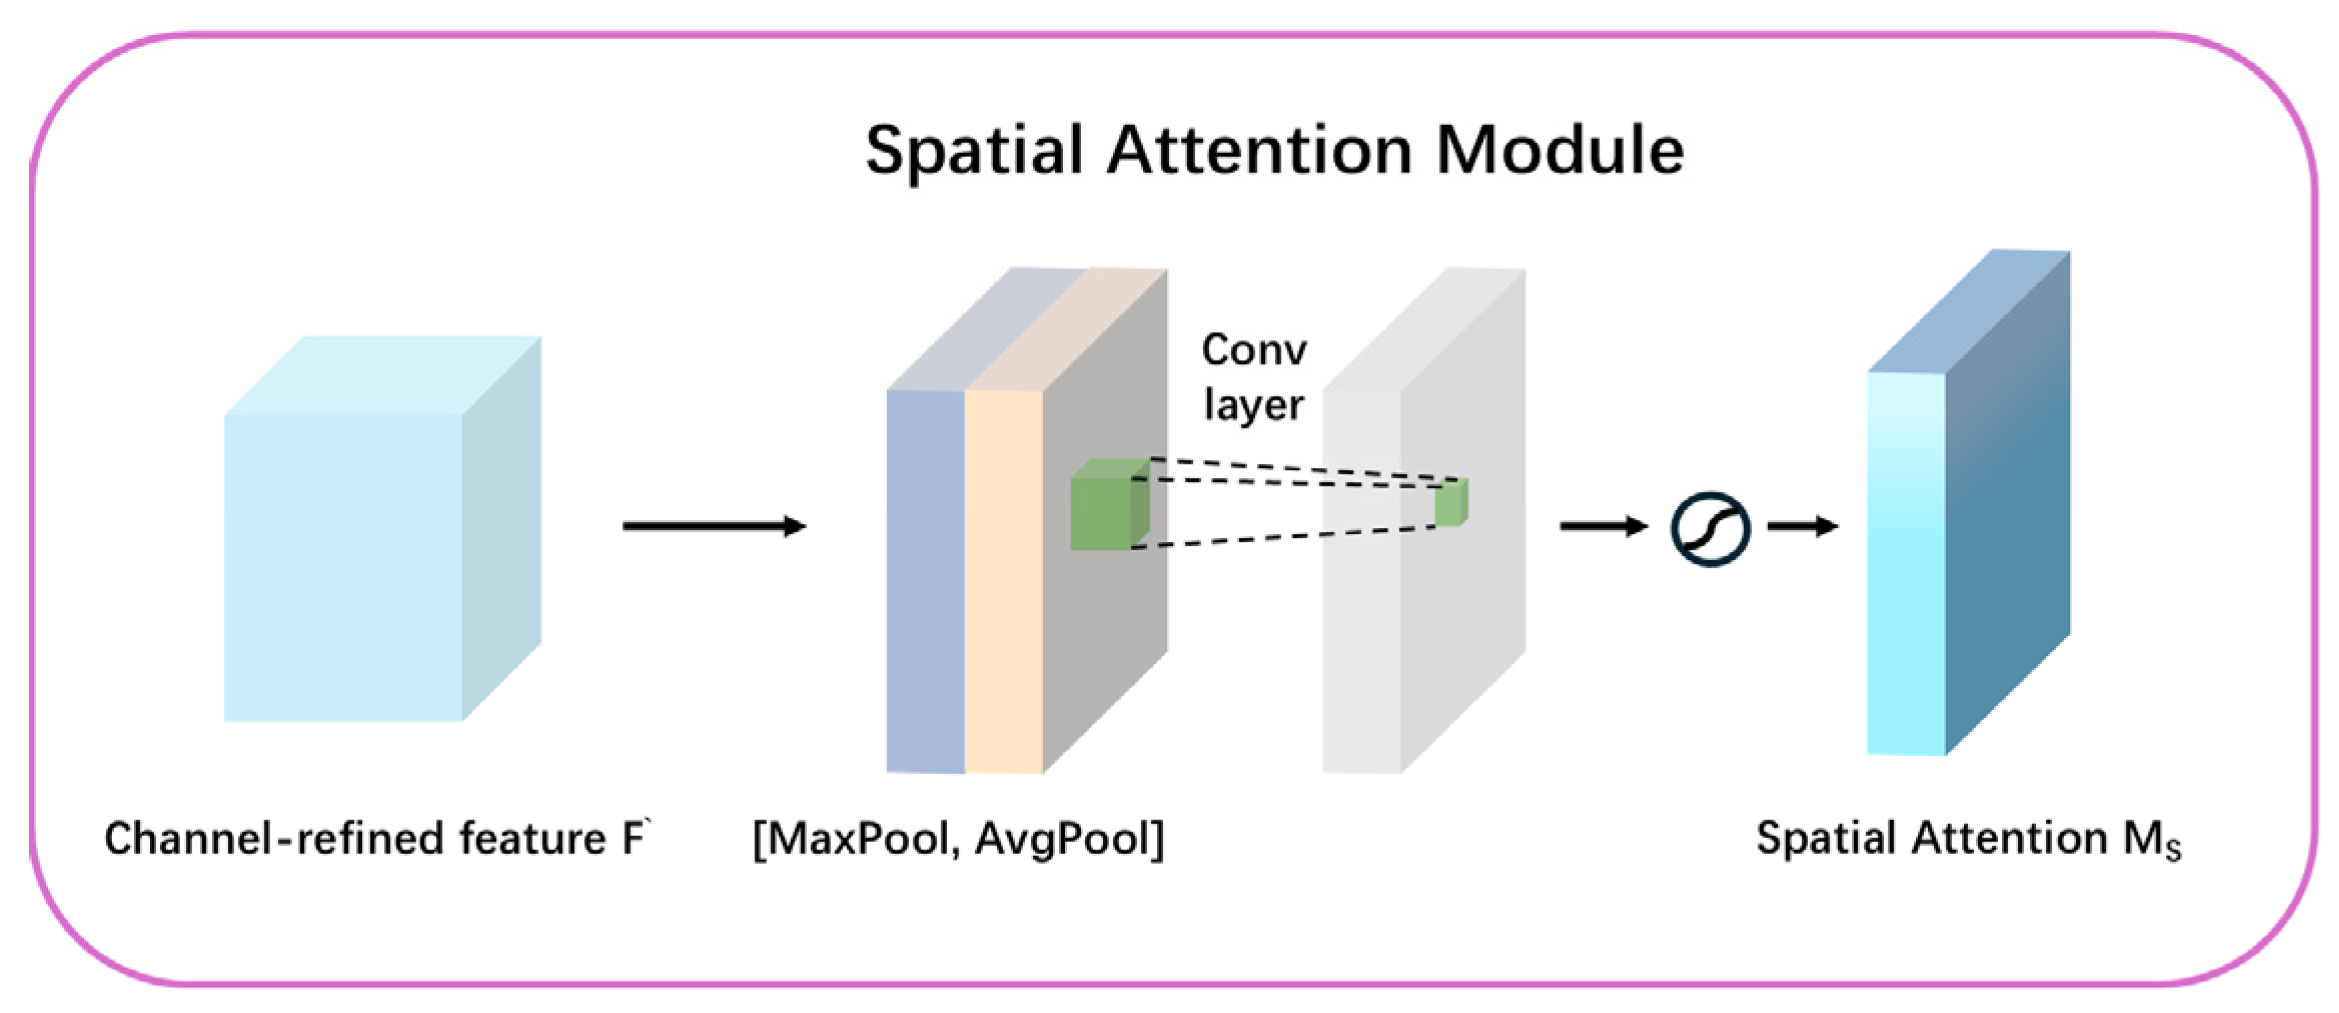
In contrast, the Spatial Attention Module generates a spatial feature map by performing pooling operations along the channel dimension, followed by convolutional operations to produce spatial weights that highlight critical regions within the feature map, as illustrated in
Figure 7. This mechanism enables the model to selectively focus on spatially significant areas, enhancing its ability to capture relevant contextual information for the classification task.
CBAM’s sequential design first optimizes channel importance and then refines spatial distribution, significantly improving the model’s ability to capture complex aerosol patterns. Compared to the Squeeze-and-Excitation network, which focuses solely on channel attention, CBAM’s incorporation of spatial attention offers a distinct advantage in processing sequential data [
28]. In this study, CBAM is embedded within the encoding and decoding paths of the U-Net architecture to enhance feature selection and reduce the impact of redundant information on classification performance. Furthermore, CBAM’s lightweight design ensures low computational overhead, making it well-suited for integration into deep networks [
29]. By dynamically weighting features, CBAM markedly improves model performance on rare classes, thereby enhancing the robustness of CALIPSO data processing.
3.3. Inception and Transformer
The Inception module, inspired by the GoogleNet architecture, integrates parallel convolutional kernels (1 × 1, 3 × 3, and 5 × 5) alongside pooling operations to capture multi-scale features. This design significantly enhances the U-Net’s capability to extract intricate aerosol patterns from CALIPSO data, enabling robust representation of complex aerosol characteristics across diverse spatial scales. By concatenating outputs, it forms rich feature representations across scales, with 1 × 1 convolutions reducing computational complexity for integration into deep U-Net architectures. Incorporated into the encoder and decoder paths, Inception modules improve differentiation of aerosol types, such as dust and polluted dust, addressing data heterogeneity. Residual variants further stabilize training, optimizing performance in deep networks [
30].
The Transformer module, leveraging multi-head self-attention, captures long-range dependencies in sequential aerosol profile data, reshaping features into sequences and computing global relationships [
31]. Integrated into the U-Net’s bottleneck layer, it enhances modeling of complex patterns, like smoke and polluted continental aerosols, with residual connections and layer normalization ensuring training stability. Its multi-head design diversifies feature representations, improving the classification of rare classes by addressing convolutional limitations in global context modeling.
Together, Inception and Transformer modules synergistically enhance the U-Net’s feature extraction and contextual modeling, significantly improving classification accuracy for diverse aerosol types in CALIPSO data while maintaining computational efficiency and training stability.
3.4. Enhanced 1D U-Net Network
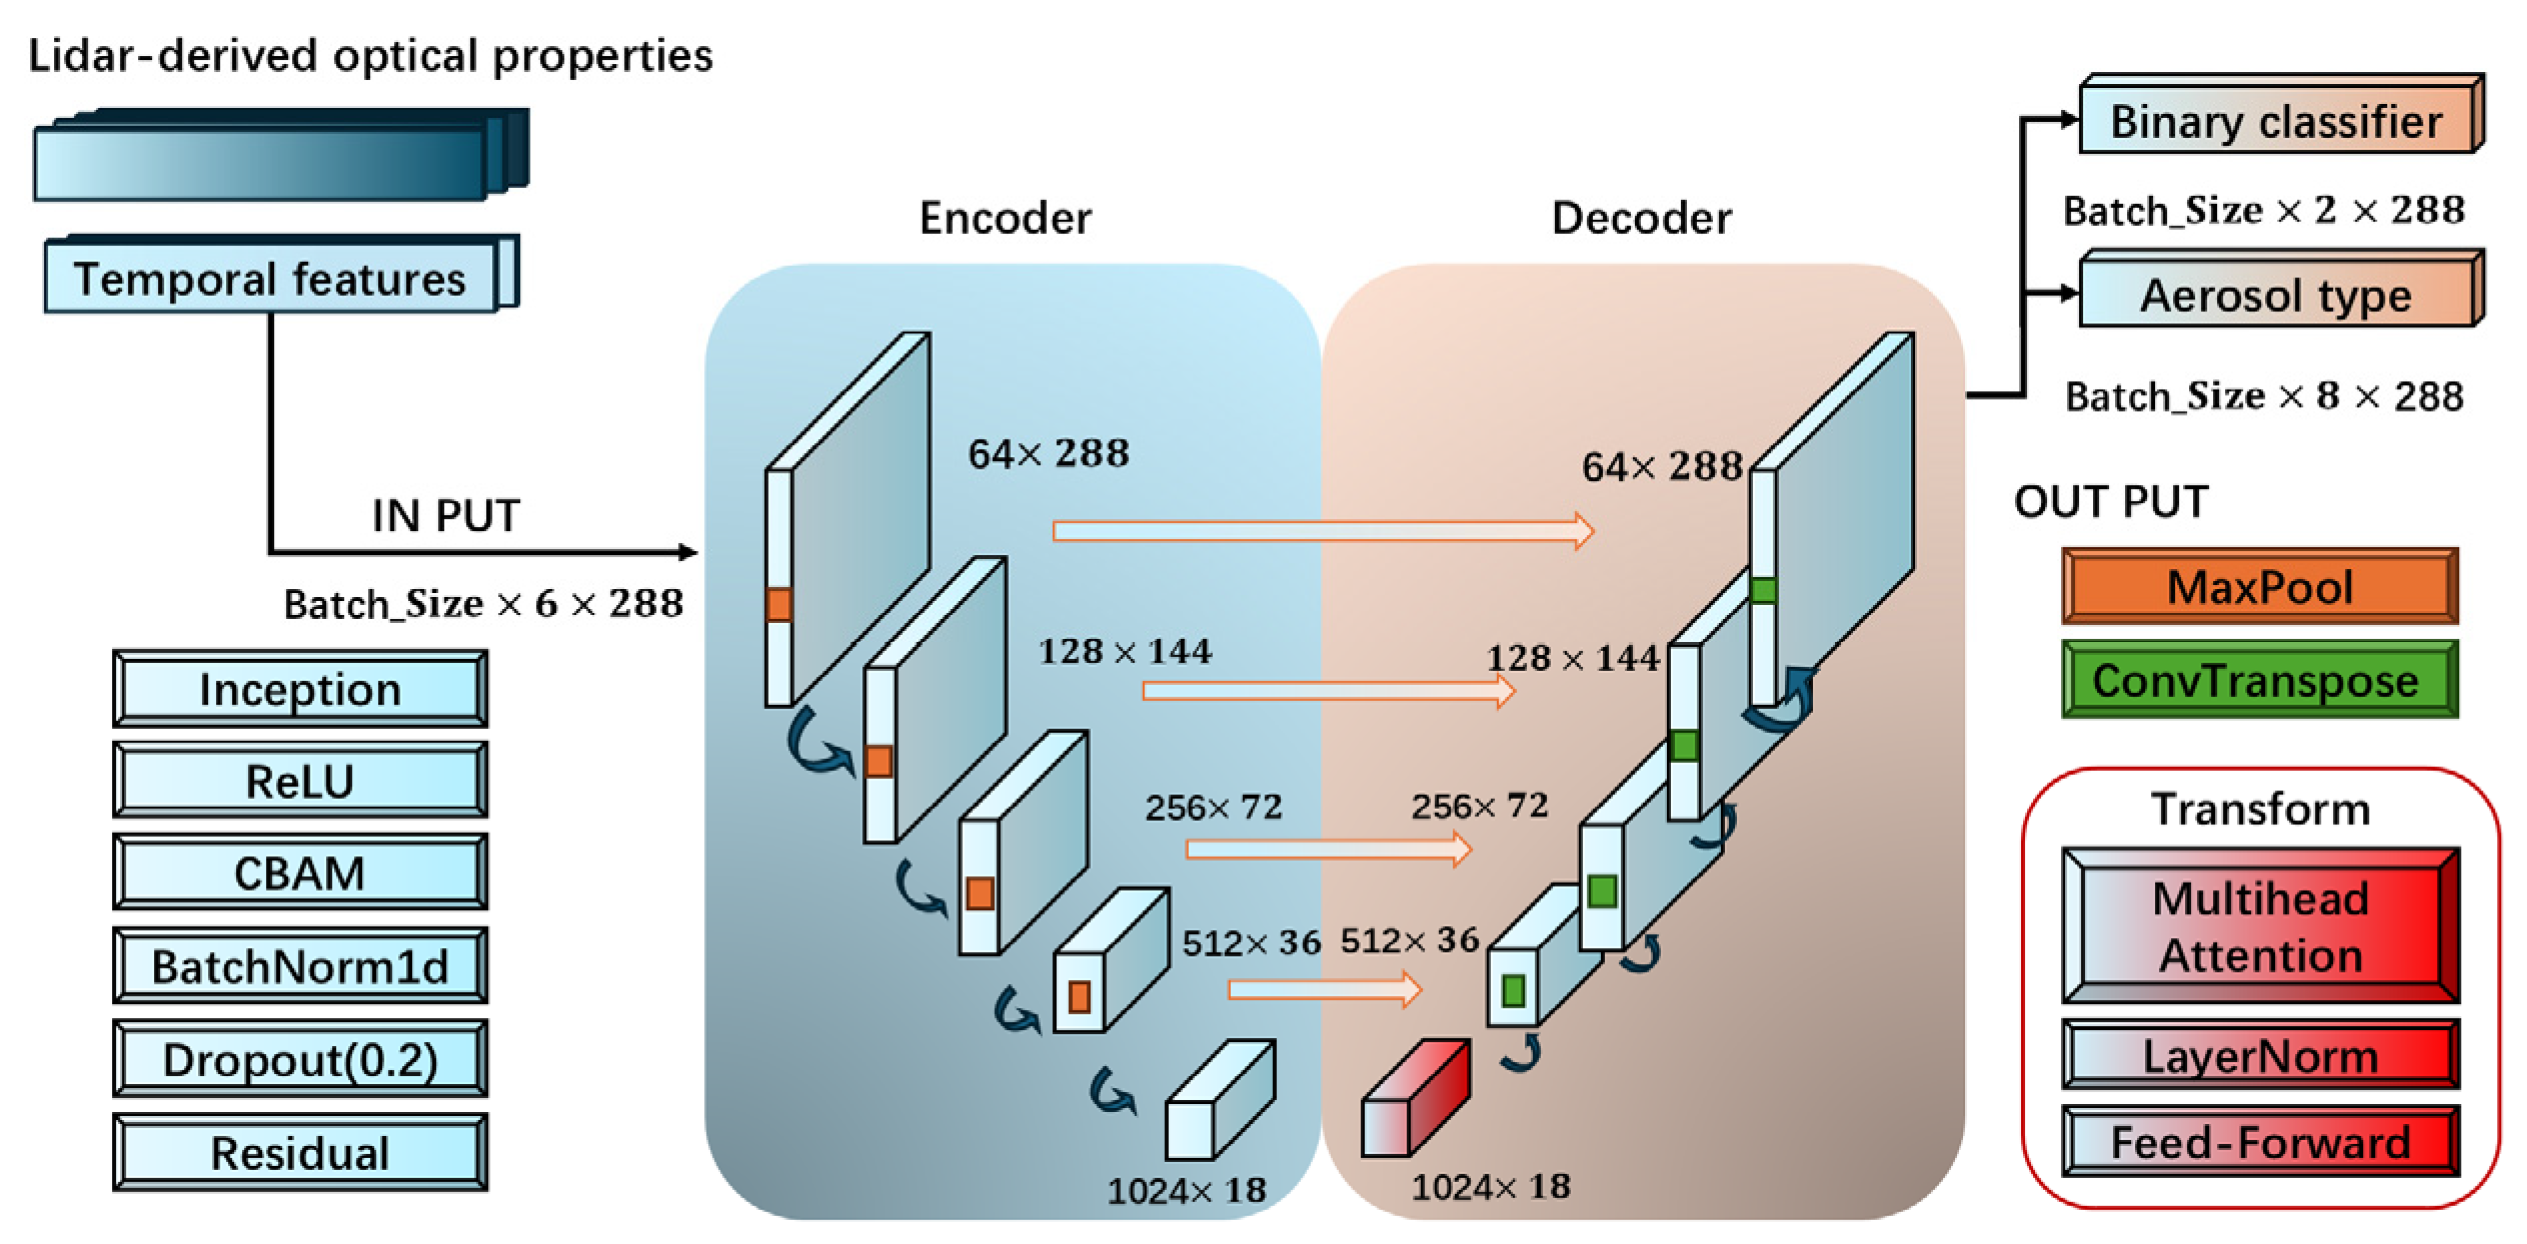
The Enhanced 1D U-Net model, the core of this study, is built on the U-Net architecture and is designed for CALIPSO aerosol classification, incorporating Inception, CBAM, Transformer, and residual connections to optimize complex feature modeling. The encoder extracts multi-scale features through downsampling, leveraging Inception modules to capture diverse patterns (refer to
Figure 8). The bottleneck layer incorporates a Transformer module to model global dependencies, while the decoder employs upsampling and skip connections to restore resolution, fusing low- and high-level features [
27]. CBAM enhances feature selection by emphasizing critical channels and spatial regions [
28]. The model outputs both primary classifications (eight aerosol types) and binary classifications (dust versus polluted dust), with an auxiliary classifier improving performance on key classes. Residual connections ensure training stability in deep architectures, accommodating the multi-module integration. Optimized for the class imbalance in CALIPSO data, the model significantly improves classification accuracy for dust-related categories through dynamic data augmentation and attention mechanisms, demonstrating robust adaptability to complex aerosol profile data.
This deep learning model employs CALIPSO satellite vertical profile data for aerosol type classification. The input comprises six channels—532 nm and 1064 nm backscatter coefficients, color ratio, depolarization ratio, and temporal features (annual cycle sine and cosine encodings)—with a shape of 6, 288. Here, 288 represents the number of altitude points in the vertical profile, corresponding to a vertical resolution of approximately 30 m per point, covering an altitude range from 0.44 km to 8.3 km.
Theoretically, dust aerosols’ relationship with altitude and backscatter coefficients at 532 nm and 1064 nm stems from their physical properties and atmospheric transport. Larger mineral dust particles, prevalent in pure dust, scatter more strongly at 1064 nm due to their size (typically 1 μm), yielding higher backscatter coefficients at this wavelength and distinct color ratios (1064 nm/532 nm). Polluted dust, with smaller particles from anthropogenic mixing, shows relatively stronger scattering at 532 nm. Altitude distribution is influenced by wind patterns and atmospheric stability; coarse dust settles closer to the surface (e.g., 0.44–4 km), while finer particles reach higher altitudes (up to 8.3 km) via long-range transport. These optical and vertical characteristics, captured by CALIPSO data, enable our model to differentiate dust types based on their backscatter profiles.
Data undergoes logarithmic transformation, NaN interpolation, normalization, and augmentation. Built on a U-Net architecture, the model integrates Inception, Transformer, and CBAMs, producing per-height classifications for eight aerosol types (Not computed, Clean marine, Dust, Polluted continental, Clean continental, Polluted dust, Smoke, Other), with an output shape of batch_size, 8, 288. The baseline model includes an additional binary classifier to distinguish Dust from Polluted dust, addressing their frequent confusion. Predictions are processed via softmax and smoothed with median filtering, optimized for class imbalance, particularly enhancing the accuracy of dust-related aerosol types. This study primarily focuses on dust aerosol classification.
3.5. Evaluation Metrics
Precision is a critical metric for evaluating the performance of classification models, measuring the proportion of samples predicted as positive that are actually positive, thereby reflecting the model’s accuracy in positive class predictions. It is particularly crucial in scenarios where avoiding false positive predictions is essential, such as in CALIPSO aerosol classification, where misclassifying non-dust aerosols as dust must be minimized. The formula for calculating precision is given in Equation (4) below:
TP (true positive) represents the number of samples correctly predicted as positive by the model, such as accurately identified “dust” samples. FP (false positive) denotes the number of samples incorrectly predicted as positive, for instance, misclassifying “polluted dust” as “dust.” In the formula, the numerator is the count of correct positive predictions, while the denominator includes all samples predicted as positive (both correct and incorrect). Higher precision indicates greater reliability in the model’s positive class predictions.
Recall, also known as sensitivity or the true positive rate, measures the proportion of actual positive samples correctly identified as positive by the model, reflecting the model’s ability to capture positive class samples. The formula for calculating recall is given in Equation (5) below:
Here, TP (true positive), as described earlier, represents the number of samples correctly predicted as positive by the model. FN (false negative) denotes the number of samples that are actually positive but incorrectly predicted as negative, such as misclassifying “dust” as “polluted dust.” In the formula, the numerator is the count of correct positive predictions, while the denominator includes all actual positive samples (both correctly and incorrectly predicted). A higher recall indicates fewer positive samples missed by the model.
The F1 score is the harmonic mean of precision and recall, used to comprehensively evaluate a model’s balanced performance between precision and recall, particularly in scenarios with imbalanced classes, such as the classification of rare aerosol types in CALIPSO data. The F1 score simultaneously accounts for prediction accuracy and positive class coverage, providing a single, comprehensive metric. The formula for calculating the F1 score is given in Equation (6) below:
The F1 score provides a single metric for evaluating model performance when precision and recall are imbalanced, with values ranging from 0 to 1. Higher scores indicate better balance between precision and recall.
4. Results
This study utilizes a U-Net-based deep learning model for the accurate retrieval of dust aerosol types from CALIPSO satellite vertical profile data. The training dataset comprises CALIPSO data from 1 March to 31 May each year from 2015 to 2019, with training and validation sets randomly split in a 9:1 ratio. An independent test dataset from the same period in 2020 is used to evaluate the model’s generalization performance. The baseline model, Enhanced 1D U-Net Network, is complemented by three variants (NoInception 1D U-Net, NoTransformer 1D U-Net, and NoCBAM 1D U-Net) to assess the contributions of the Inception, Transformer, and CBAMs. Training is conducted on a high-performance CUDA-enabled system equipped with an Intel® Core™ i9-14900K processor (3.20 GHz) is manufactured by Intel Corporation, sourced from Santa Clara, CA, USA. The 128 GB RAM is provided by Kingston, sourced from Taiwan. The NVIDIA GeForce RTX 4090 D GPU is manufactured by NVIDIA Corporation, sourced from Santa Clara, CA, USA. The training process spans 100 epochs, with each epoch computing training loss and validation accuracy. The focal loss function’s weighting parameters are dynamically adjusted to enhance the retrieval accuracy of dust aerosol types, ensuring robustness and precision in complex atmospheric scenarios.
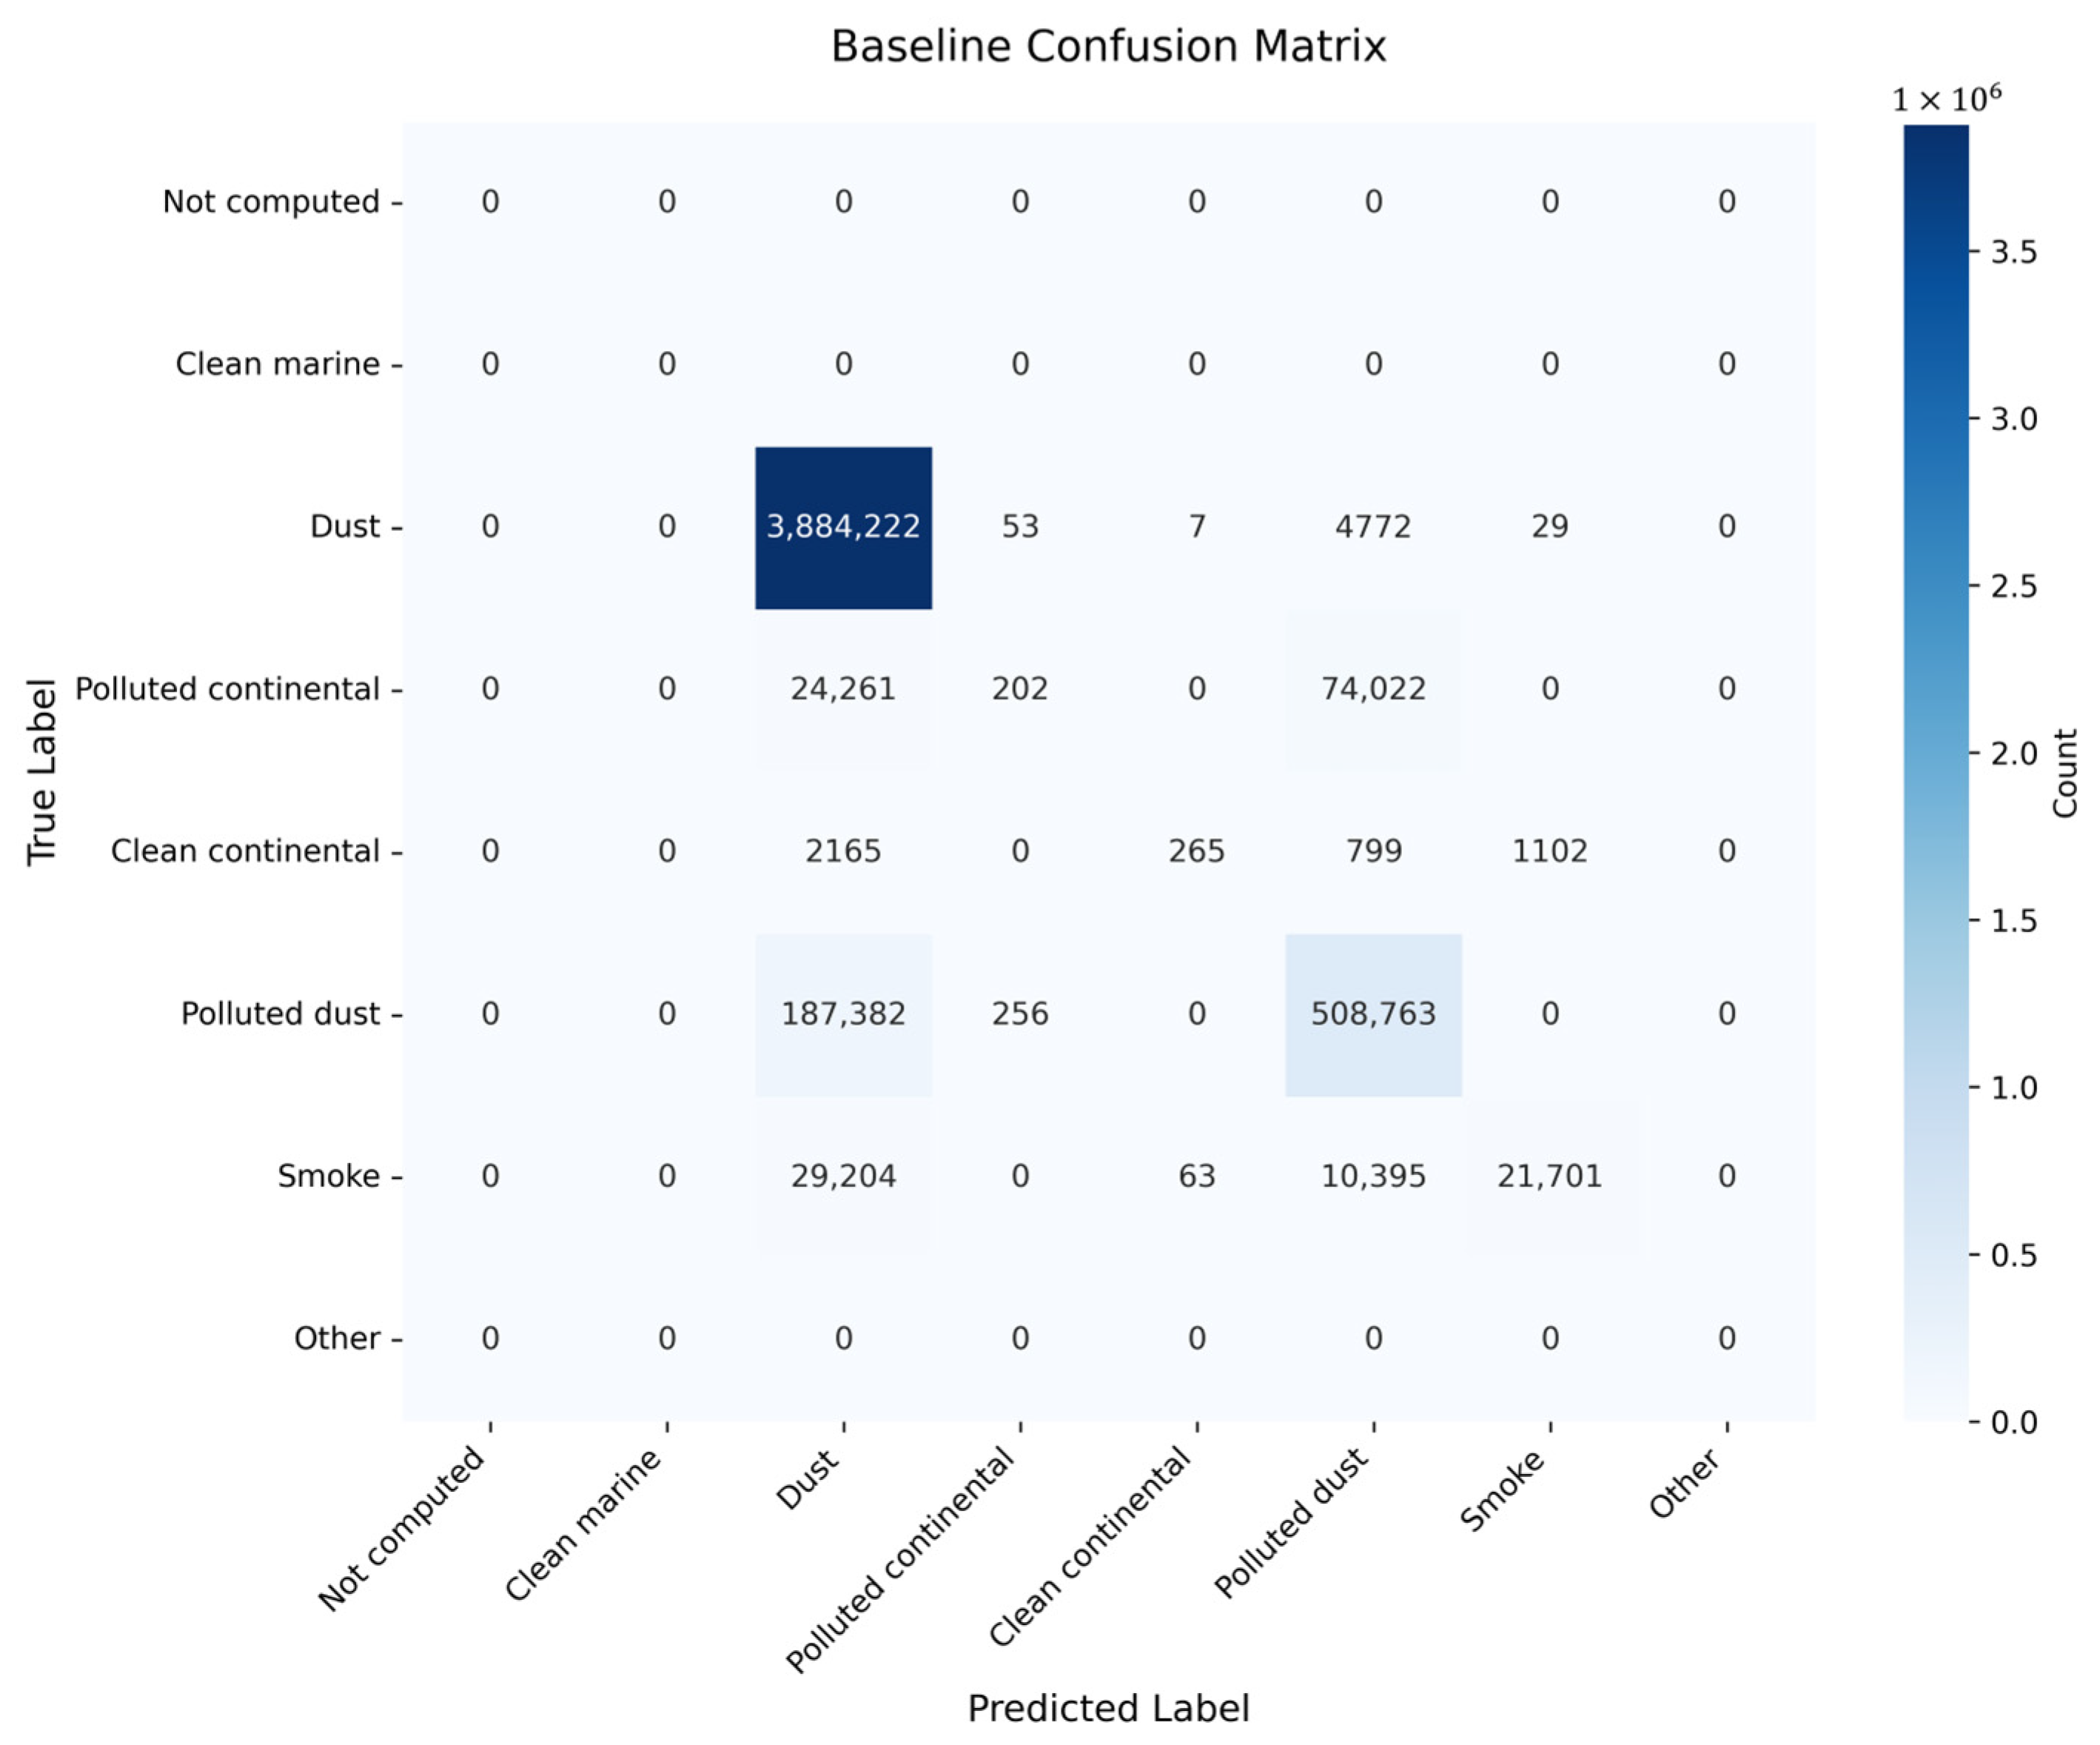
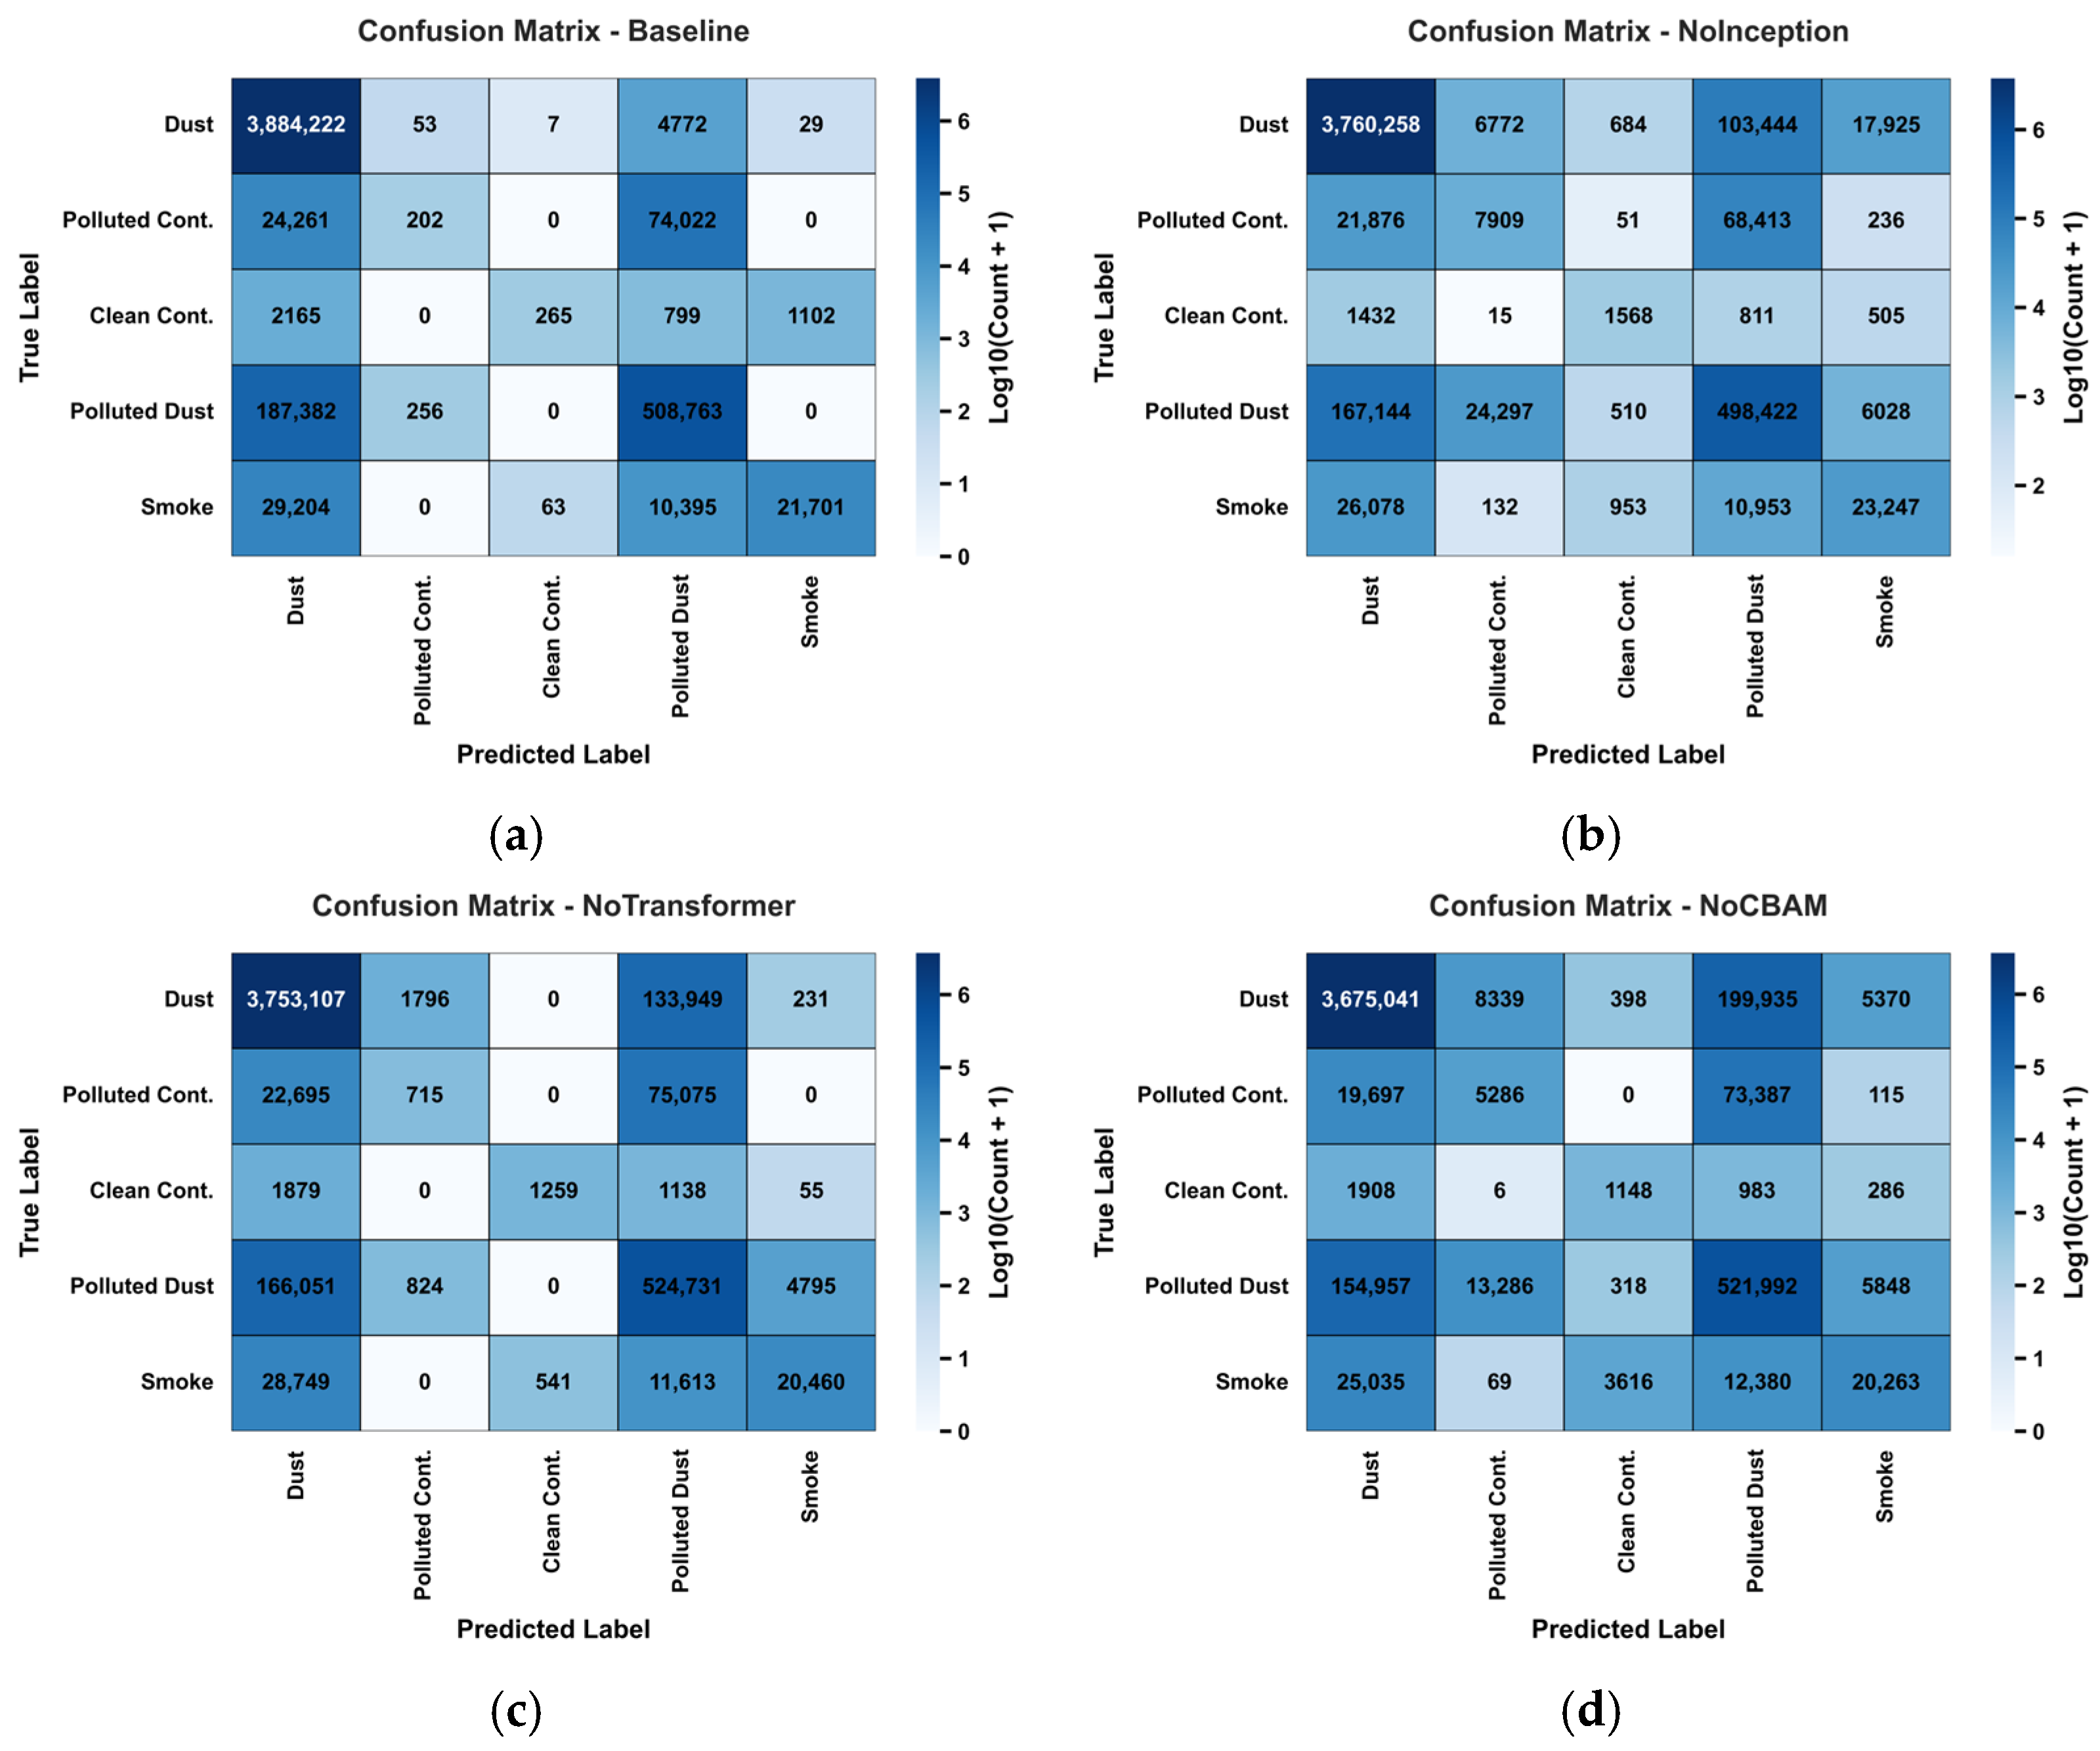
The confusion matrices for the Baseline, NoInception, NoTransformer, and NoCBAM models offer a comprehensive assessment of their performance in classifying dust aerosols (Class 2, Aerosol-Dust). The Baseline model achieves the highest true positive (TP) count, correctly classifying 3,884,222 Dust samples, with minimal misclassifications: 4772 samples to Polluted dust, 53 to Polluted continental, 29 to Smoke, and 7 to Clean continental (
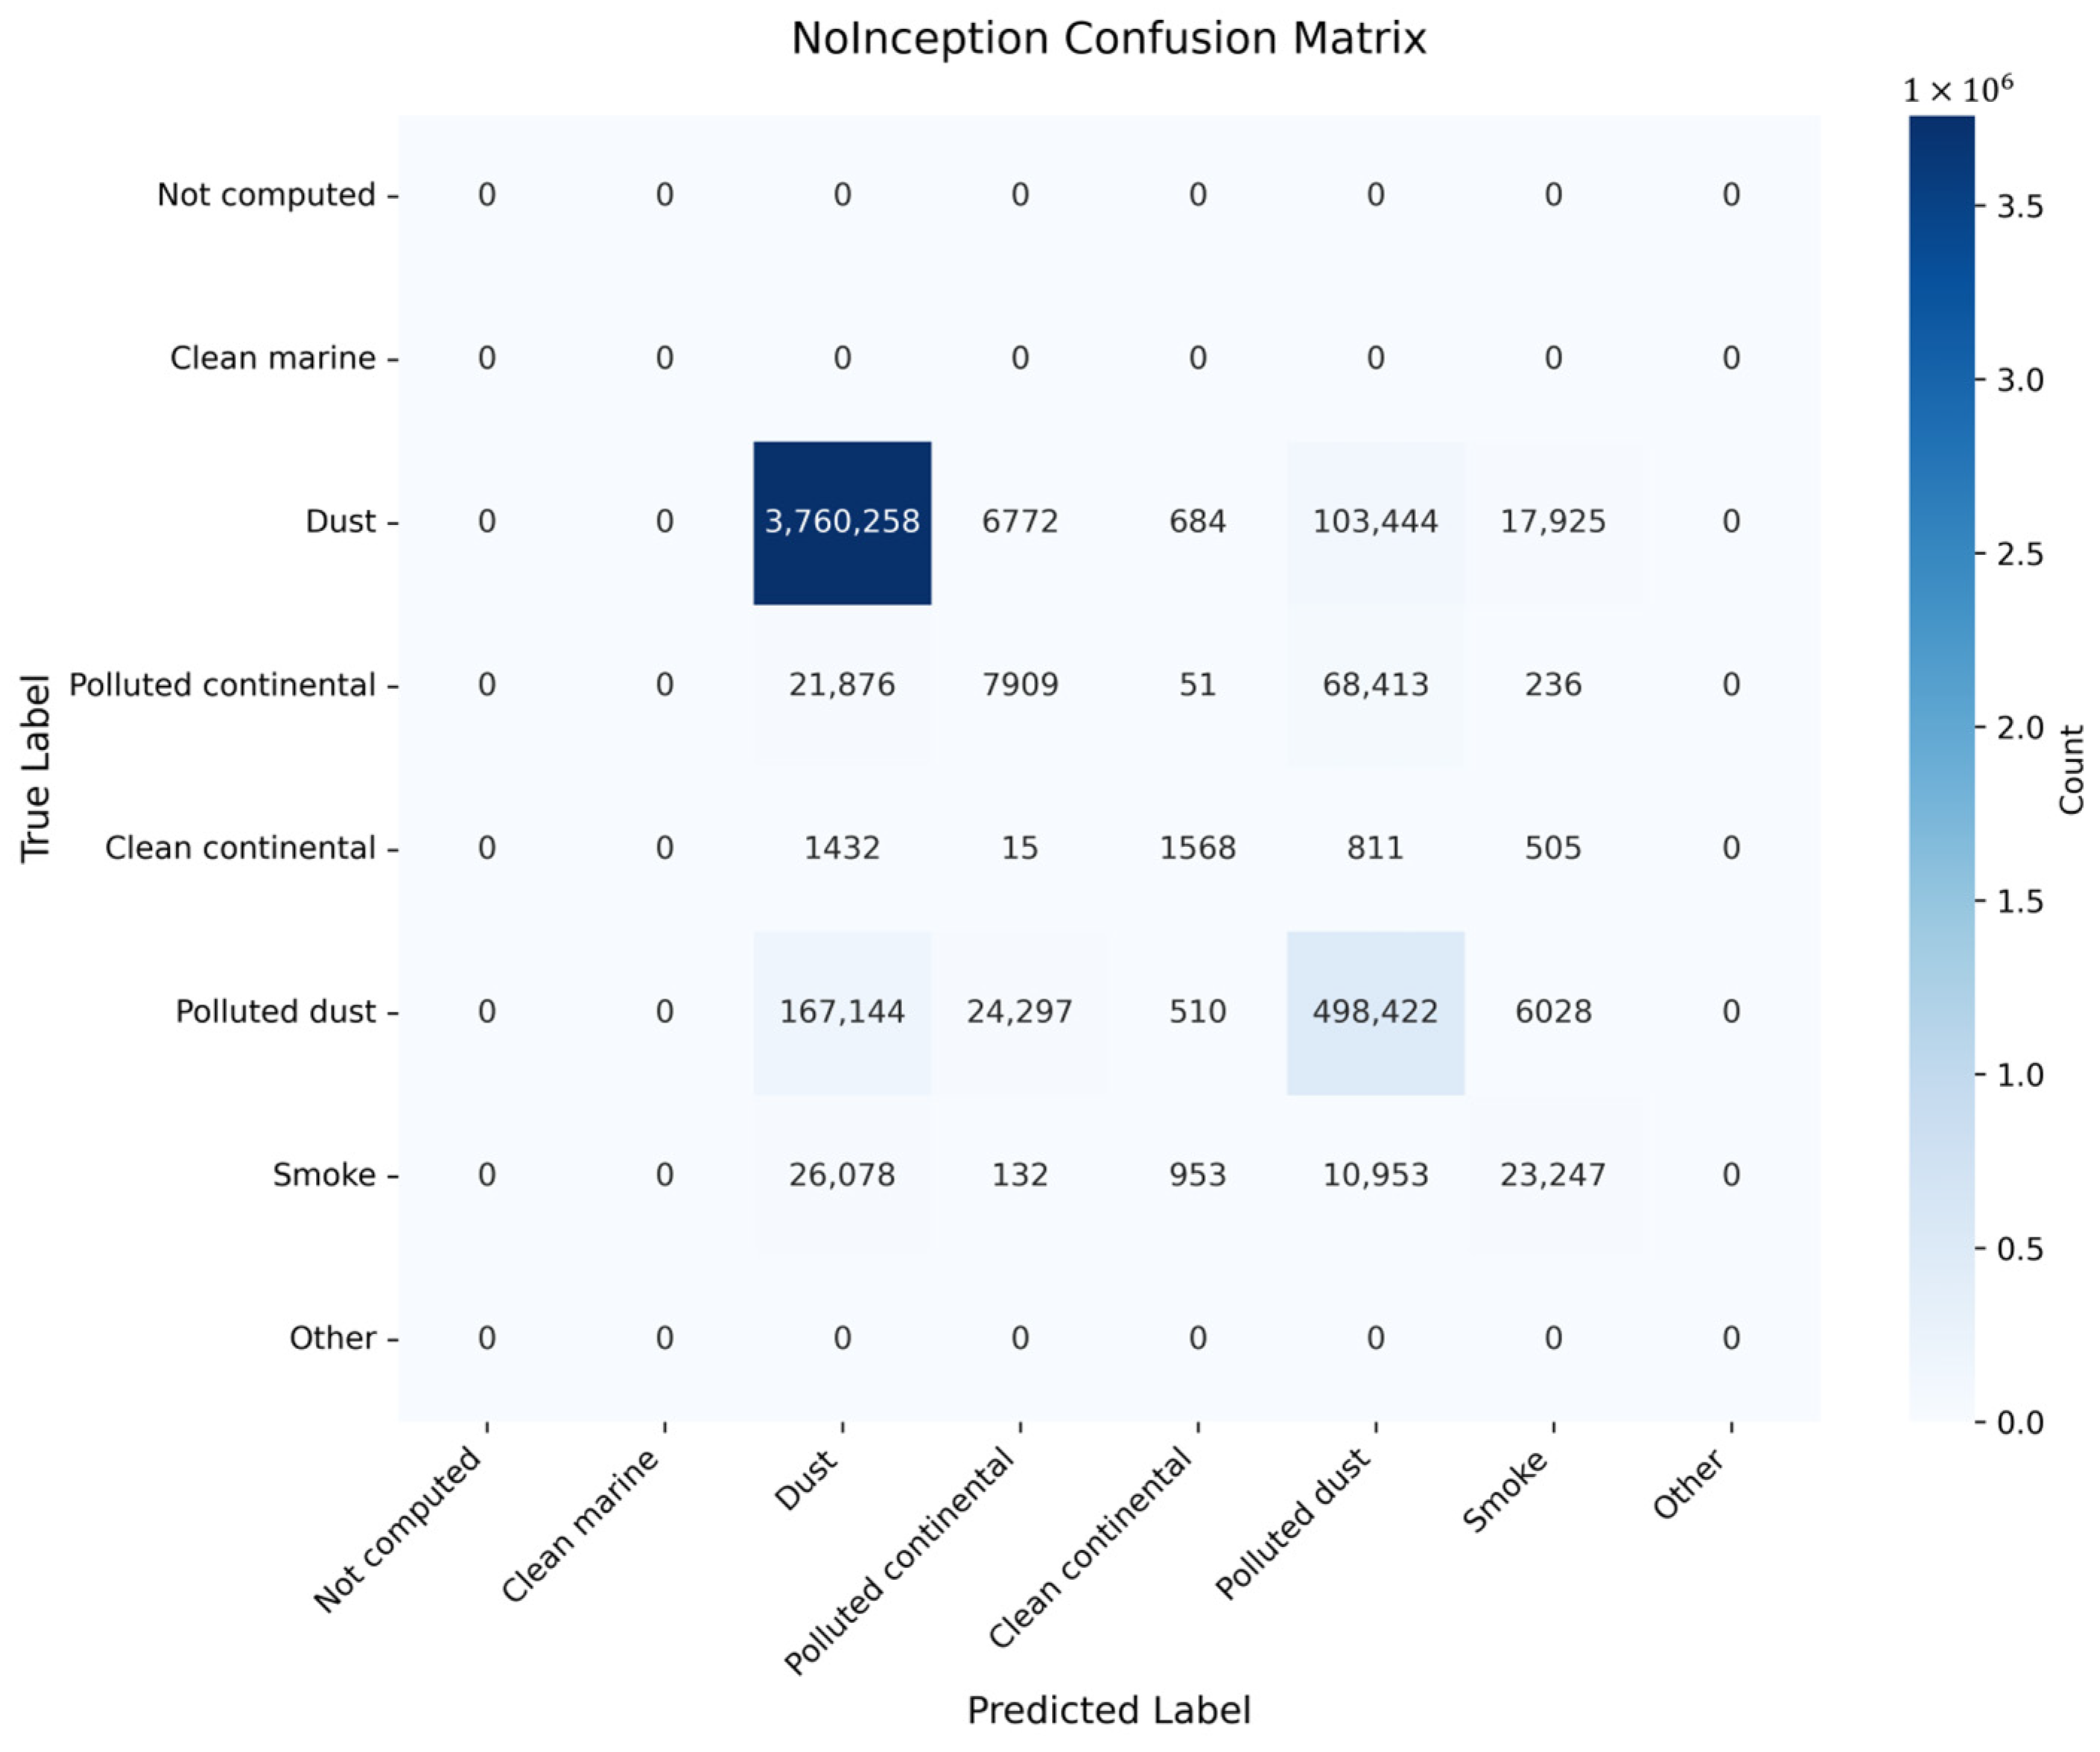
Figure 9a). In contrast, the NoInception model correctly classifies 3,760,258 Dust samples but misclassifies 103,444 samples as Polluted dust and 17,925 as Smoke, indicating challenges in distinguishing Dust from these categories (
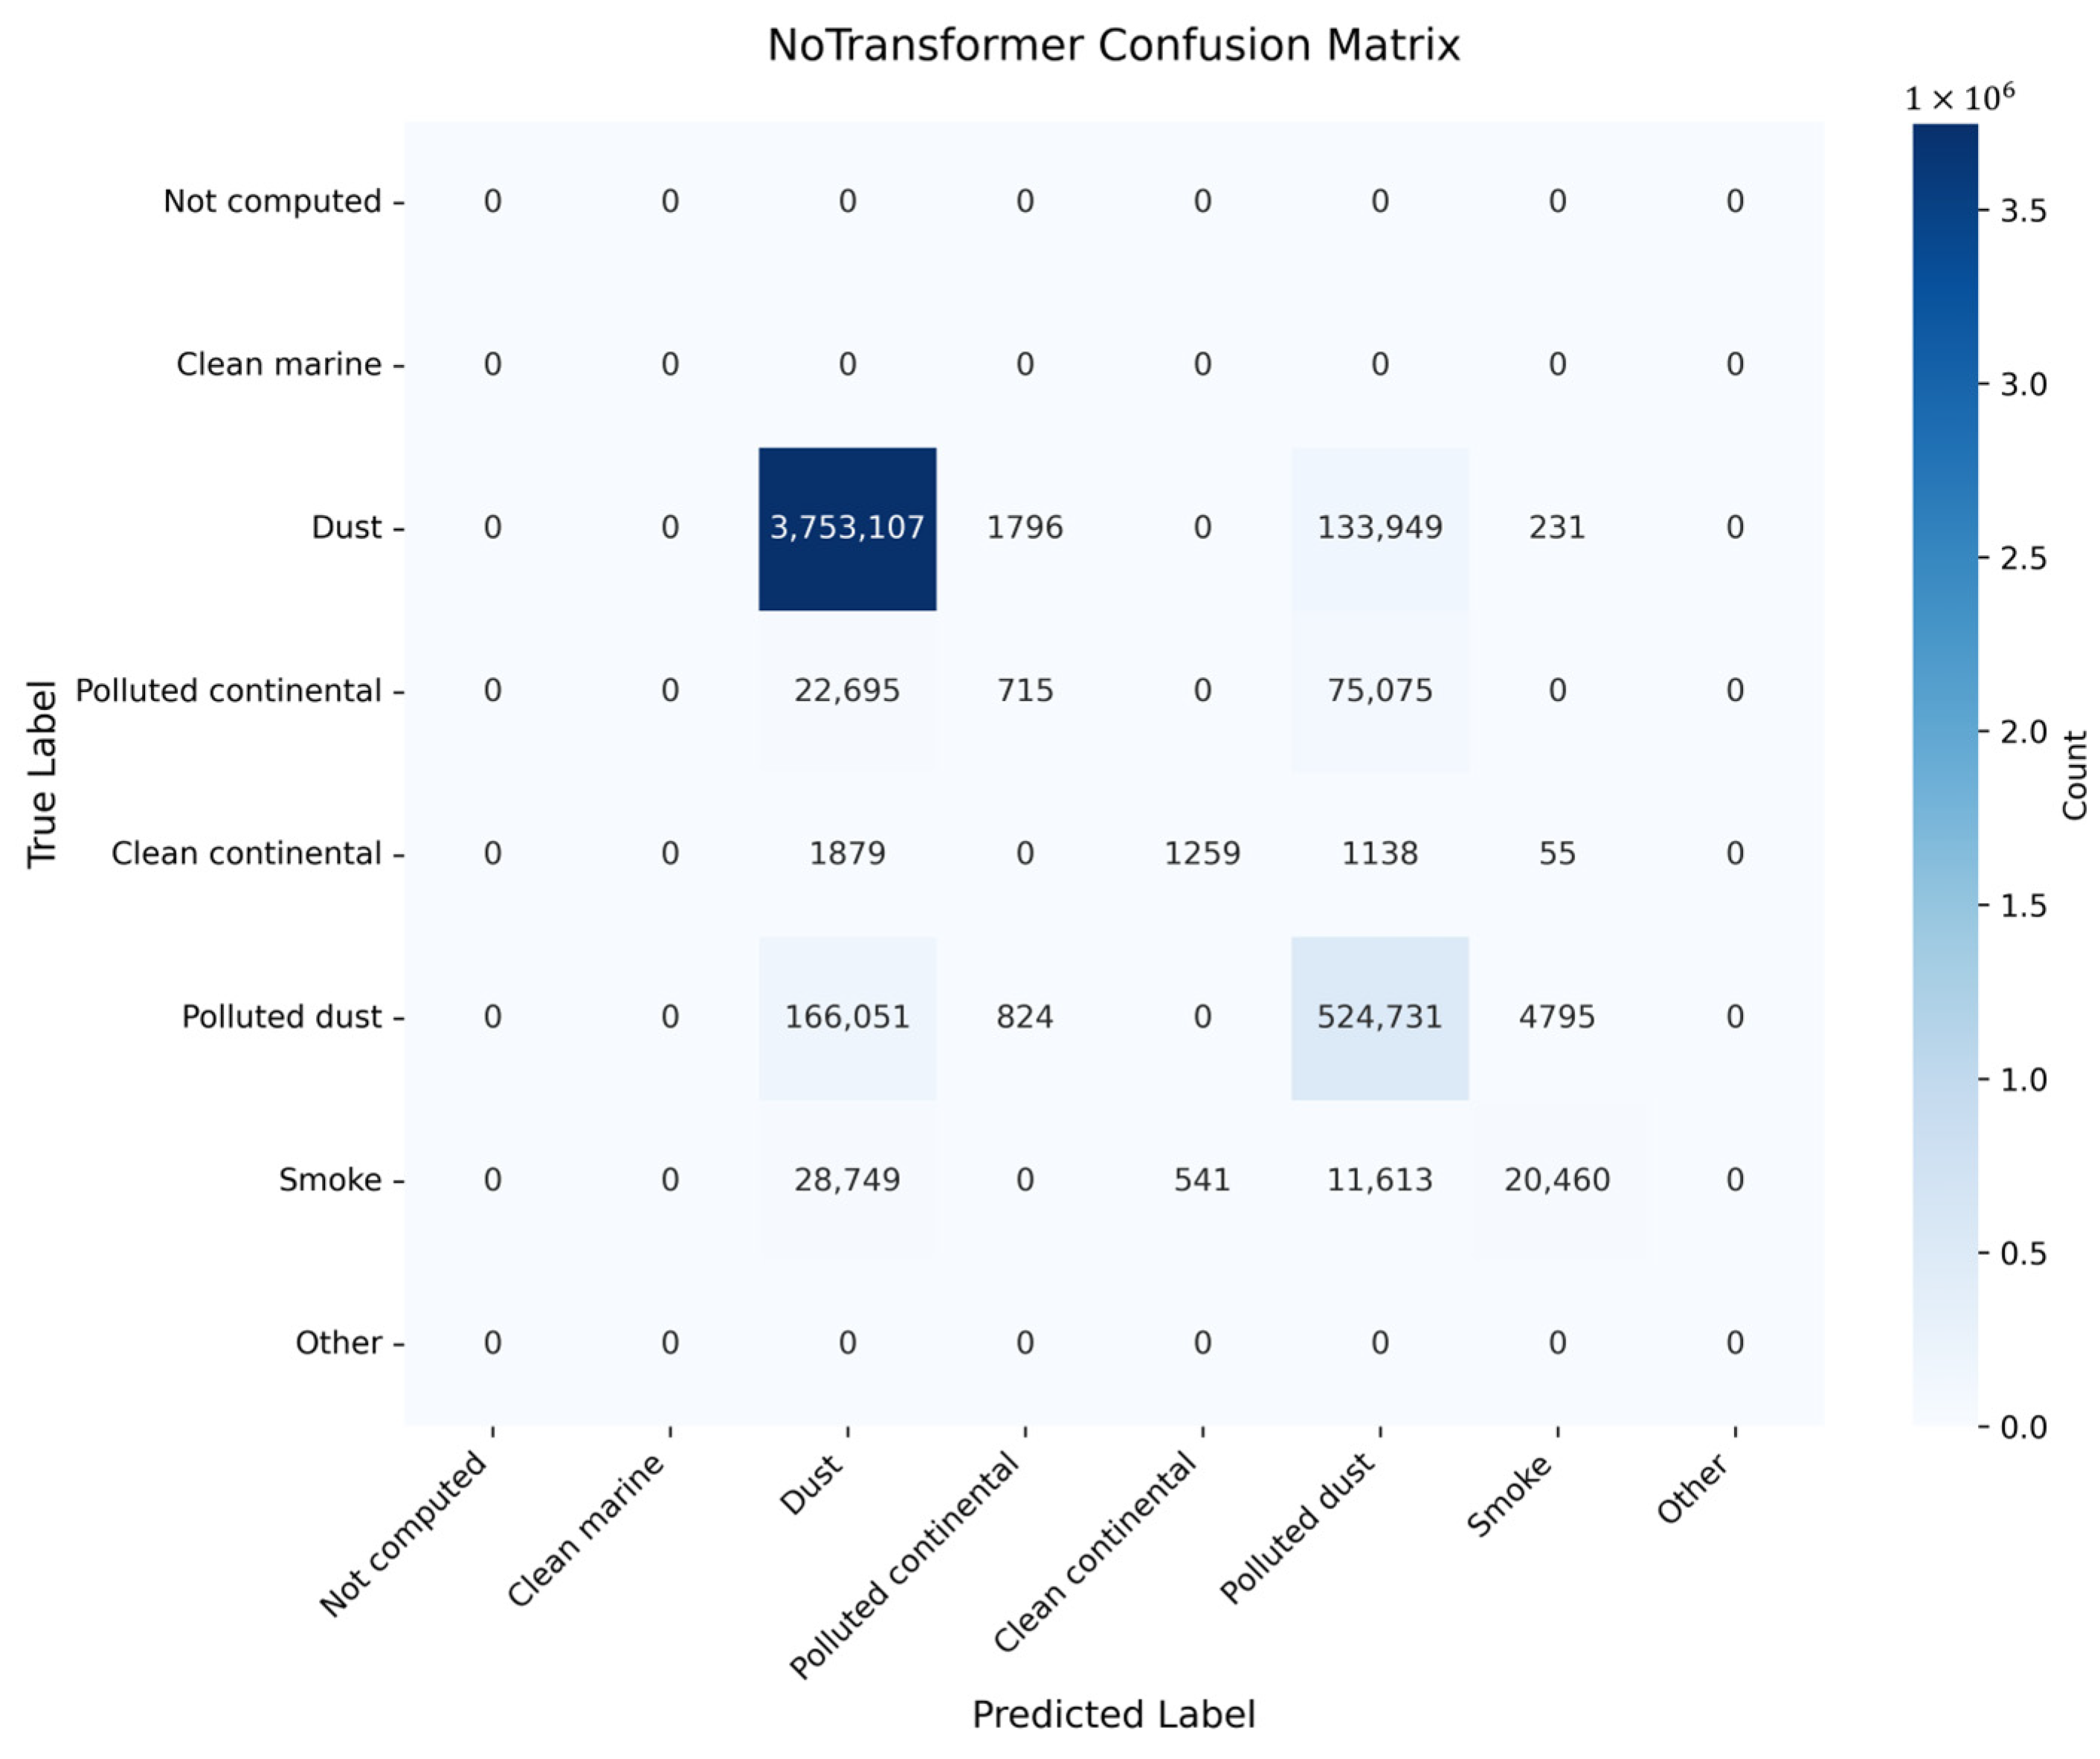
Figure 9b). The NoTransformer model correctly identifies 3,753,107 Dust samples, with a notable 133,949 misclassified as Polluted dust, performing better than NoCBAM but worse than Baseline (
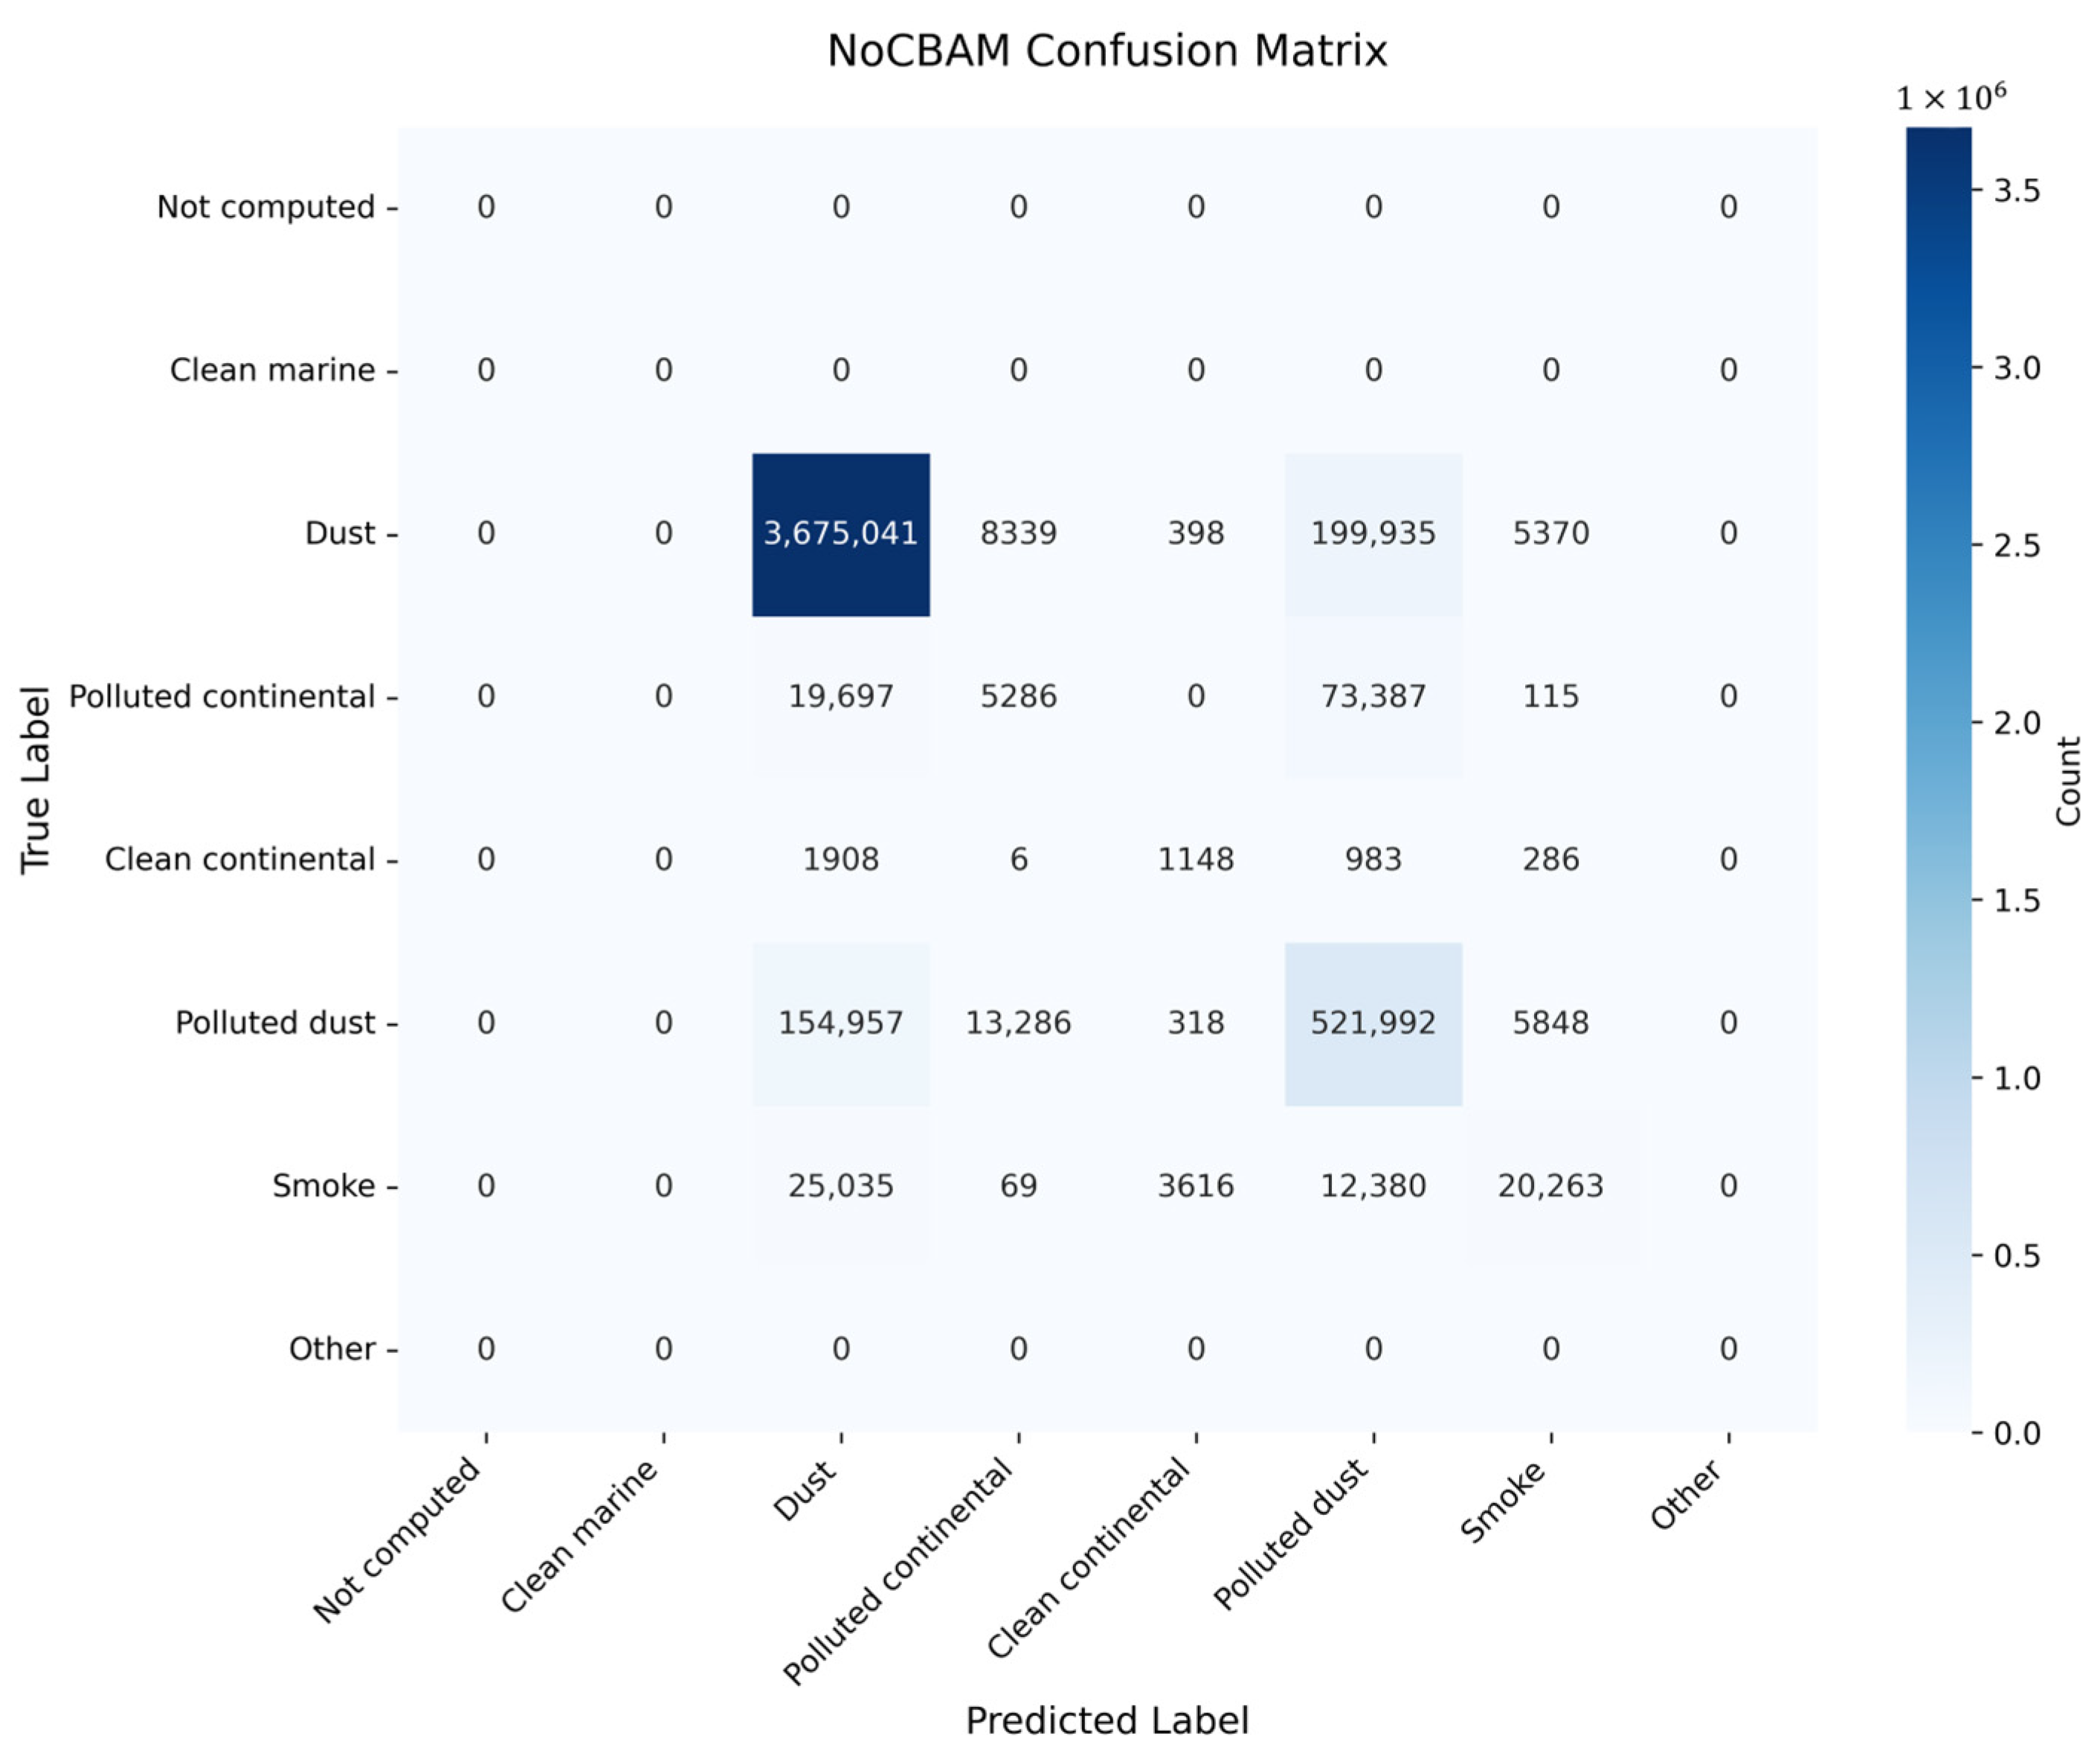
Figure 9c). The NoCBAM model exhibits the lowest performance, correctly classifying 3,675,041 Dust samples while misclassifying 199,935 as Polluted dust, 8339 as Polluted continental, 5370 as Smoke, and 398 as Clean continental, revealing significant confusion across multiple categories (
Figure 9d).
For the Dust class, the true positive (TP) represents samples correctly classified as Dust, while the false positive (FP) includes samples from other classes incorrectly predicted as Dust, and the false negative (FN) denotes Dust samples misclassified into other categories. The Baseline model excels with a TP of 3,884,222, an FP of 243,012 (sum of non-Dust samples predicted as Dust: 242,61 + 2165 + 187,382 + 29,204), and an FN of 4861 (sum of Dust samples misclassified: 53 + 7 + 4772 + 29), yielding a misclassification rate of approximately 0.125% (4861/(3,884,222 + 4861)) (
Figure 9a). The NoInception model has a TP of 3,760,258, an FP of 216,530, and an FN of 128,825, resulting in a higher misclassification rate of 3.31% (
Figure 9b). The NoTransformer model reports a TP of 3,753,107, an FP of 219,374, and an FN of 135,976, with a misclassification rate of 3.50% (
Figure 9c). The NoCBAM model performs least effectively, with a TP of 3,675,041, an FP of 201,597, and an FN of 214,042, leading to a misclassification rate of 5.50% (
Figure 9d). These results highlight the Baseline model’s superior ability to minimize misclassifications across all categories.
The performance disparities among the models underscore the critical roles of the Inception, Transformer, and CBAMs. The Baseline model’s robust feature extraction and discrimination capabilities, likely due to the synergistic integration of these modules, result in minimal misclassifications. The NoInception model’s increased misclassification rate suggests that the Inception module enhances the model’s ability to capture multi-scale features essential for distinguishing Dust from Polluted dust and Smoke. Similarly, the NoTransformer model’s performance degradation indicates that the Transformer module contributes to modeling long-range dependencies, improving classification accuracy. The NoCBAM model’s substantial misclassification rate emphasizes the importance of spatial and channel attention mechanisms in discerning subtle feature differences, particularly between Dust and Polluted dust. These findings demonstrate that the combined use of Inception, Transformer, and CBAMs is essential for achieving optimal classification performance in dust aerosol identification. (
Appendix A includes detailed confusion matrices for aerosol type prediction, offering a comprehensive evaluation of each model’s performance in the classification task. These matrices provide essential evidence for assessing the accuracy and robustness of the models in identifying aerosol categories.)
In terms of Dust classification accuracy, the models rank as follows: Baseline (3,884,222) outperforms NoInception (3,760,258), NoTransformer (3,753,107), and NoCBAM (3,675,041). All models exhibit the issue of misclassifying Dust as Polluted dust, with NOCBAM showing the highest misclassification rate (199,935) and Baseline the lowest (4772), highlighting a clear disparity in their ability to differentiate Dust from Polluted dust.
This study evaluates four models—Baseline, NoInception, NoTransformer, and NoCBAM—for CALIPSO aerosol classification, with a focus on dust aerosols (Class 2), which are critical for climate and air quality applications in Northwest China. Precision, recall, and F1 scores (
Table 1,
Table 2 and
Table 3) derived from confusion matrices provide a comprehensive assessment across eight aerosol categories. The Baseline Enhanced 1D U-Net model achieves an exceptional precision of 0.9411 for dust aerosols, reflecting its ability to accurately identify dust samples with minimal false positives (
Figure 9a). Combined with a recall of 0.9988 and F1 score of 0.9690, this performance highlights the model’s robustness in capturing dust aerosol characteristics, particularly in the 0.44–4 km altitude range where dust prevails (
Figure 10). The integration of Inception, Transformer, and CBAMs drives this superior precision. In contrast, the NoInception model, with a precision of 0.9456 and recall of 0.9669 (F1 = 0.9562), shows reduced coverage due to limited multi-scale feature extraction (
Figure 9b). The NoTransformer model, with a precision of 0.9448 and recall of 0.9650 (F1 = 0.9548), struggles with long-range dependencies, increasing misclassifications (
Figure 9c). The NoCBAM model performs the least effectively, with a precision of 0.9479 and recall of 0.9450 (F1 = 0.9464), underscoring the importance of attention mechanisms (
Figure 9d). These results demonstrate that the Baseline model’s architectural innovations significantly enhance precision, making it a reliable tool for dust aerosol retrieval and supporting applications in regional climate modeling and air quality monitoring.
For other aerosol categories, the Baseline model excels in Polluted dust (Class 5), achieving an F1 score of 0.7858 (precision: 0.8410, recall: 0.7306), surpassing other models and demonstrating strong adaptability to mixed aerosol types. In the Smoke category (Class 6), the Baseline model leads with an F1 score of 0.5158 (precision: 0.9505, recall: 0.3537). However, all models perform poorly on the Polluted continental (Class 3, F1 = 0.0041) and Clean continental (Class 4, F1 = 0.1137) categories, underscoring challenges posed by imbalanced data distributions for rare classes. Metrics for Not classified (Class 0), Clean marine (Class 1), and Other (Class 7) categories are consistently 0.0000, as these categories have no samples in the dataset, precluding any model performance evaluation.
The Baseline model’s superiority in dust aerosol classification stems from its high F1 score and balanced precision–recall performance, reflecting its ability to effectively extract dust aerosol features and maintain robustness in scenarios with concentrated data distributions. These findings confirm the Baseline model’s significant advantage over the NoInception, NoTransformer, and NoCBAM models, providing valuable insights for future model optimization. Subsequent research could explore data augmentation, feature engineering, or architectural refinements to enhance classification performance for rare categories, thereby achieving more comprehensive aerosol classification capabilities.
The vertical distribution characteristics of aerosols have profound implications for the atmospheric environment, climate change, and human health, as their distribution patterns significantly influence radiative forcing, cloud formation processes, and air quality, which in turn impact respiratory health. This study validates the superior performance of an enhanced U-Net network in aerosol type prediction by comparing two datasets: true labels and predicted labels. As shown in the true labels plot (
Figure 10), dust aerosols (represented in red) exhibit widespread distribution across the altitude range of 0.44 to 8.3 km, with the most concentrated presence between 1 and 5 km, forming dense and continuous red bands. This distribution suggests that dust aerosols dominate the atmospheric composition at these altitudes, likely due to the high desert coverage in Northwest China, coupled with frequent springtime convective weather, which lifts surface dust and allows it to remain suspended at these heights. In contrast, Polluted dust aerosols (purple) are primarily concentrated between 3 and 5 km, while Clean continental (yellow) and Polluted continental (green) aerosols are mostly found below 3 km, highlighting the distinct vertical distribution pattern of dust aerosols in the atmosphere.
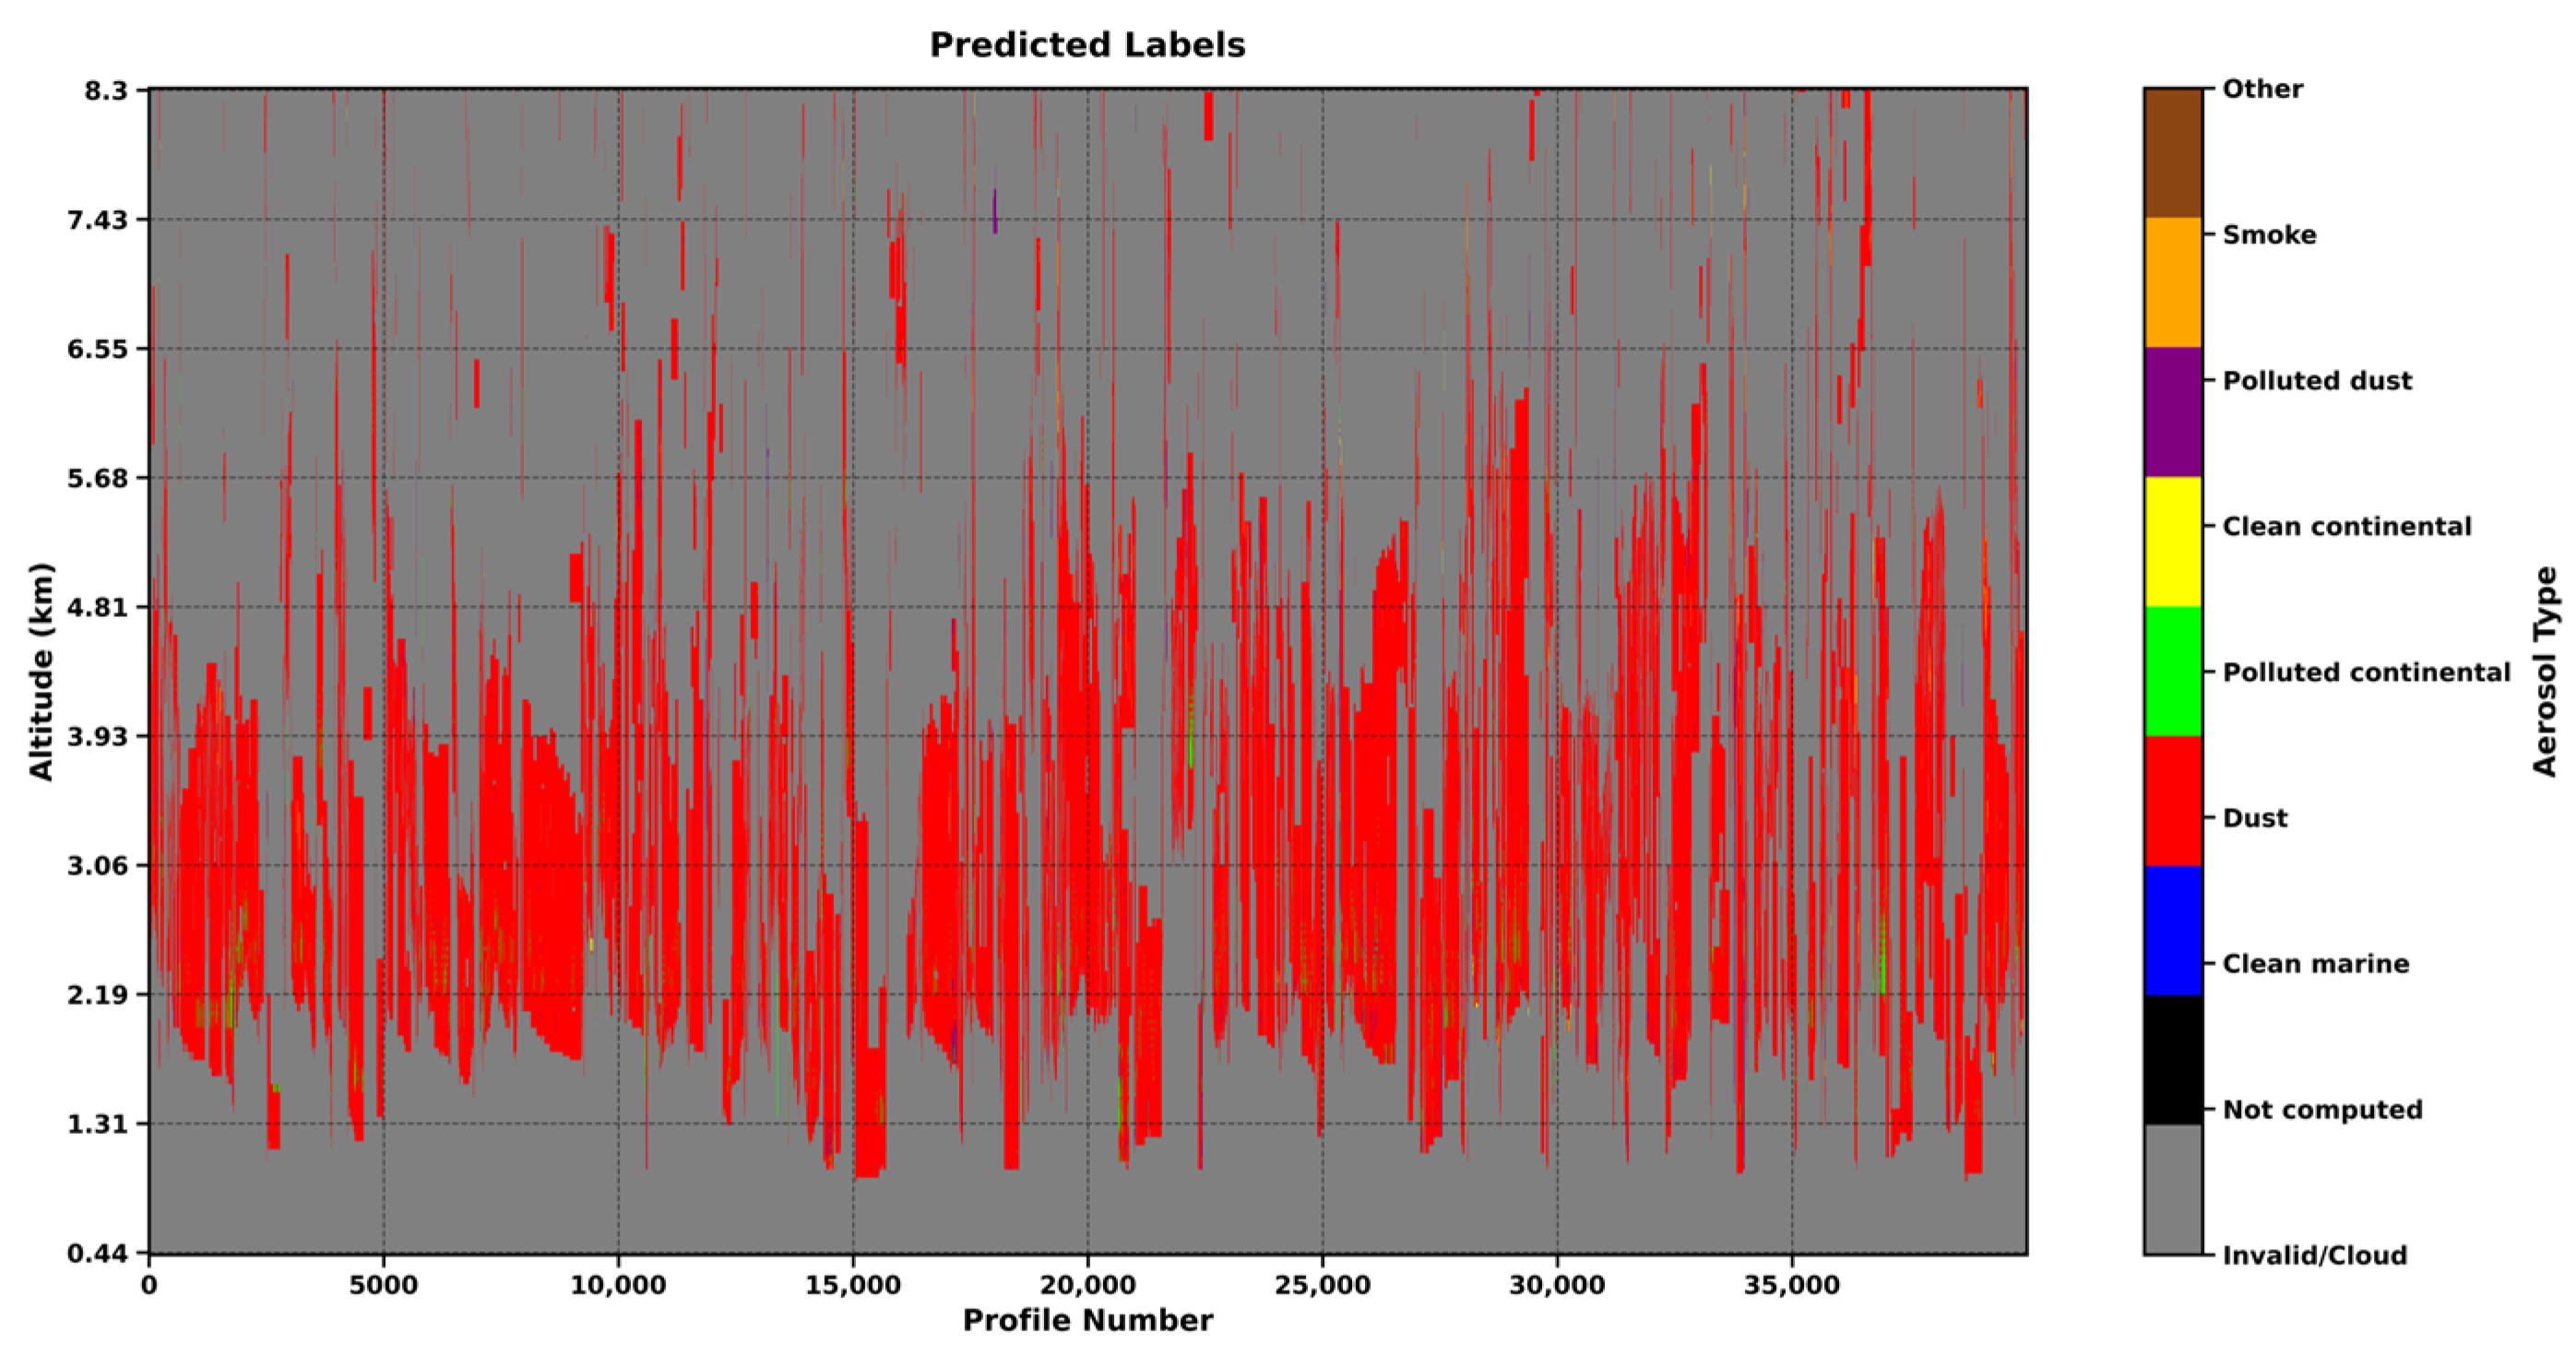
Figure 11 presents the predicted labels plot, which highlights the enhanced U-Net network’s robust performance in identifying dust aerosols. The spatial distribution of predicted dust aerosol labels closely aligns with the true labels, particularly within the 3 to 4 km altitude range, where the density and extent of the red regions (indicating dust aerosols) are nearly indistinguishable from the ground truth. This strong correspondence underscores the model’s effectiveness in capturing the characteristic features of dust aerosols at mid-altitudes. However, in certain atmospheric profiles, particularly at altitudes below 2 km and above 7 km, the model occasionally misclassifies dust aerosols as Polluted continental (green) or Clean continental (yellow) aerosol types. These misclassifications are likely due to overlapping optical and physical properties, such as particle size distribution, scattering coefficients, and absorption characteristics, which can obscure distinctions between aerosol types in these altitude ranges.
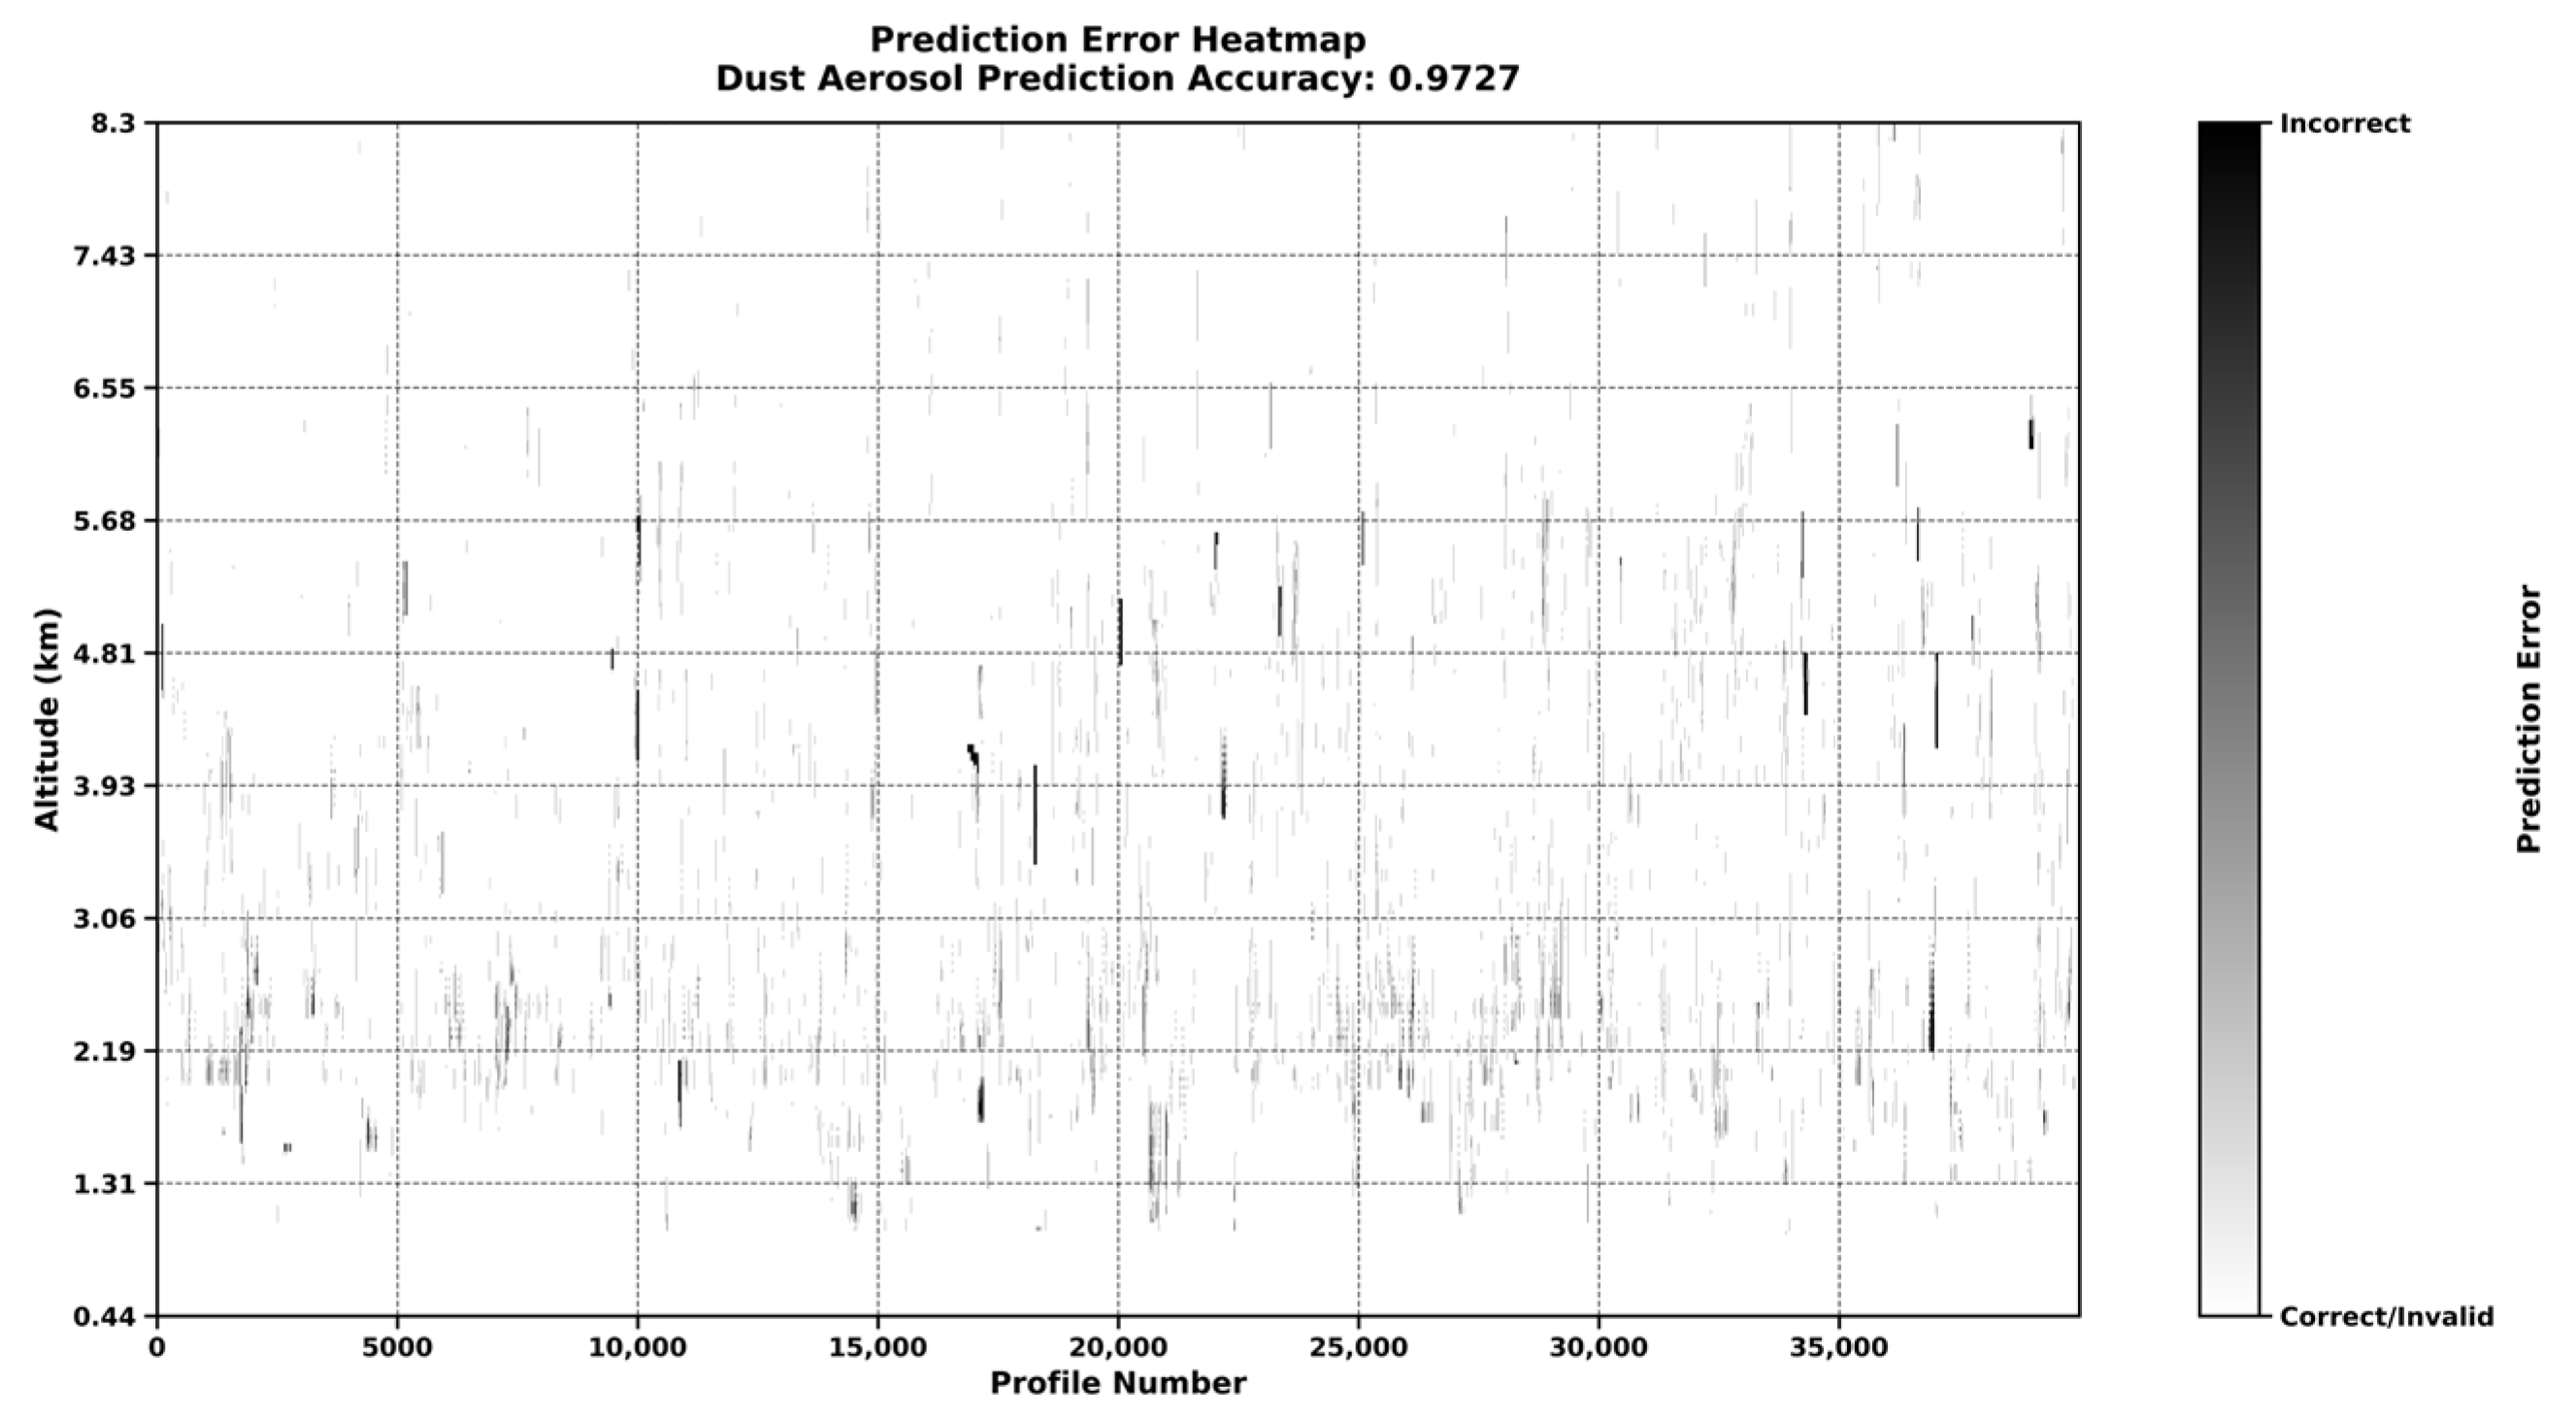
The prediction error heatmap in
Figure 12 provides deeper insight into the model’s performance. The enhanced U-Net achieves an impressive overall prediction accuracy of 0.9727 for dust aerosols, reflecting its high reliability in classification tasks. Nevertheless, the error bars (shown in black) indicate elevated uncertainty in distinguishing dust aerosols from polluted dust aerosols. This challenge likely stems from the close similarity in their optical properties, including comparable backscatter and extinction profiles, which complicates accurate differentiation. Additionally, classification errors are more pronounced at the upper and lower altitude extremes, where aerosol concentrations are typically lower, and signal-to-noise ratios are reduced, further hindering precise identification.
To address these limitations, future improvements could focus on integrating supplementary feature parameters, such as aerosol chemical composition or depolarization ratios, to enhance the model’s discriminative power. Additionally, advanced feature engineering or the incorporation of hybrid architectures, such as attention-based mechanisms, could improve the model’s ability to differentiate between closely related aerosol types like dust and polluted dust. Refining the model’s sensitivity to low-concentration aerosol signals at extreme altitudes could also mitigate misclassifications. These enhancements would further strengthen the U-Net’s predictive accuracy, providing more reliable data for atmospheric monitoring, air quality assessments, and climate modeling applications.
5. Conclusions and Future Work
This study developed an Enhanced 1D U-Net model to enhance aerosol retrieval from CALIPSO satellite data, addressing the complex challenge of atmospheric aerosol classification in Northwest China. By integrating Inception modules for multi-scale feature extraction, Transformer modules for global contextual modeling, and CBAM for enhanced feature selection, the model achieves a synergistic architecture that significantly improves classification accuracy. Ablation experiments with NoInception, NoTransformer, and NoCBAM variants confirm the critical contributions of each component, with the Baseline model achieving an overall accuracy of 0.9296, surpassing NoInception (0.9035), NoTransformer (0.9054), and NoCBAM (0.8893) models (
Table 4). Notably, the model excels in dust aerosol classification (Class 2), with a precision of 0.9411, recall of 0.9988, and F1 score of 0.9691, demonstrating robust performance for climate and air quality applications (
Table 3). Confusion matrix analysis (
Figure 9a) shows minimal misclassifications, particularly between dust and polluted dust (Class 5), compared to higher errors in NoCBAM (
Figure 9d).
The potential for widespread adoption of the Enhanced 1D U-Net model among environmental scientists is supported by several key attributes. First, its high accuracy and robustness, validated across diverse aerosol types and altitudes (0.44–8.3 km,
Figure 10 and
Figure 11), make it a reliable tool for regional climate studies and dust storm forecasting. Second, its compatibility with CALIPSO’s widely used Level 1B and Level 2 VFM data ensures seamless integration into existing remote sensing workflows, facilitating adoption by researchers studying aerosol impacts. Third, the model’s modular design supports scalability to other satellite datasets (e.g., MODIS, Aeolus), enhancing its applicability to global aerosol studies. Finally, the use of open-source frameworks and publicly available CALIPSO data promotes accessibility and reproducibility, key factors for community acceptance.
Challenges remain, particularly in classifying rare aerosol types (e.g., Classes 3 and 4,
Table 3) due to data imbalance. Future work will address this through data synthesis techniques and explore multisource data integration (e.g., MODIS, ground-based measurements) to improve resolution. Optimizing computational efficiency for real-time applications will further enhance the model’s appeal. These advancements position the Enhanced 1D U-Net as a transformative tool for aerosol retrieval, offering a robust, scalable, and accessible solution for environmental scientists worldwide.
Despite the significant advancements achieved in dust aerosol retrieval, this study identifies several areas for improvement and promising directions for future research. First, the model’s performance on rare categories, such as Class 3 (Aerosol—Polluted continental) and Class 4 (Aerosol—Clean continental), remains suboptimal due to the limited representation of these classes in the training data. To address this, future work could employ data synthesis techniques, such as generative adversarial networks, or transfer learning approaches to enhance the model’s generalization to underrepresented classes, thereby improving overall classification performance. Second, the current model relies primarily on CALIPSO’s 532 nm and 1064 nm backscatter data. Integrating multisource remote sensing data, such as MODIS satellite observations or ground-based measurements, could enhance the spatiotemporal resolution and robustness of the retrieval process. Additionally, the vertical distribution characteristics of dust aerosols have not been fully exploited. Developing three-dimensional convolutional networks or point cloud-based models could further improve the model’s ability to accurately capture the altitude distribution of dust aerosols. Finally, the real-time applicability and computational efficiency of the model require further optimization to meet the demands of large-scale operational applications. Future efforts could explore model compression, quantization, and hardware acceleration techniques to deploy the algorithm in real-time monitoring systems, thereby providing more efficient support for dust storm forecasting and environmental management. These advancements will further propel the application of deep learning in aerosol retrieval and environmental science, contributing to global efforts to address climate change and improve air quality.


 ,
, 


