Article

Interaction Between Radon, Air Ions, and Ultrafine Particles Under Contrasting Atmospheric Conditions in Belgrade, Serbia

1
Faculty of Technology and Metallurgy, University of Belgrade Karnegijeva 4, 11120 Belgrade, Serbia
2
The Institute of Physics Belgrade, National Institute of the Republic of Serbia, University of Belgrade, Pregrevica 118, 11080 Belgrade, Serbia
3
“Vinča” Institute of Nuclear Sciences, National Institute of the Republic of Serbia, University of Belgrade, Mike Petrovića Alasa 12–14, 11351 Belgrade, Serbia
*
Author to whom correspondence should be addressed.
Atmosphere 2025, 16(7), 808; https://doi.org/10.3390/atmos16070808
Submission received: 13 May 2025 / Revised: 22 June 2025 / Accepted: 25 June 2025 / Published: 1 July 2025
(This article belongs to the Special Issue Outdoor and Indoor Air Ions, Radon, and Ozone)

Abstract

Radon’s radioactive decay is the main natural source of small air ions near the ground. Its exhalation from soil is affected by meteorological factors, while aerosol pollution reduces air ion concentrations through ion-particle attachment. This study aimed to analyze correlations between radon, ions, and air pollution under varying conditions and to assess potential health impacts. Measurements were taken at two sites: in early autumn at a suburban part of Belgrade with relatively clean air, and in late autumn in central Belgrade under polluted conditions, with low temperatures and high humidity. Parameters measured included radon, small air ions, particle size distribution, PM mass concentration, temperature, humidity, and pressure. Results showed lower radon concentrations in late autumn due to high soil moisture and absence of nocturnal inversions. Radon and air ion concentrations exhibited a strong positive correlation for both polarities under suburban conditions, whereas measurements in the urban setting revealed a weak negative correlation, despite radon concentrations in soil gas being approximately equal at both sites. Small ion levels were also reduced, mainly due to suppressed radon exhalation and increased aerosol concentrations, especially ultrafine particles. A strong negative correlation (r < −0.5) was found between small air ion concentrations and particle number concentrations in the 20–300 nm range, while larger particles (300–1000 nm and >1 µm) showed weak or no correlation due to their lower and more stable concentrations. In contrast, early autumn measurements showed a diurnal cycle of radon, characterized by nighttime maxima and daytime minima, unlike the consistently low values observed in late autumn.

1. Introduction

While seasonal variations in Belgrade’s air quality and the physics of air ionization are well understood, there remains a lack of detailed outdoor observational studies linking seasonal radon exhalation and radon-driven ion concentrations with particle concentration behavior. Specifically, the motivation for this study stems from the need to understand how radon exhalation and ambient aerosols interact by means of air ions under contrasting urban and suburban outdoor conditions. This research compares early autumn from 20 to 24 September 2024 in a less polluted suburban area of Belgrade and late autumn from 25 to 29 November 2024 in a heavily polluted city center (a straight-line distance of 11.8 km). Aim was to elucidate differences in radon-ion-particle dynamics and potential implications for human exposure. In addition, a dedicated 48 h measurement campaign was carried out in late autumn at the urban site to further investigate short-term dynamics of ion–aerosol interactions under high pollution conditions. Air pollution is a significant environmental risk factor that adversely affects human health and the ecosystem. Adverse health effects may arise not only from the inhalation of air pollutants but also from the reduction in atmospheric ion concentrations, which are known to influence various beneficial physiological and psychological processes in humans [1].
During the late autumn and winter, Belgrade is one of the most polluted cities in Europe due to the large number of coal-fired thermal power plants and small household heating systems that burn slag or low-quality coal [2]. Such high pollution, along with the lack of an inversion temperature layer during the winter months, leads to a reduction in air ion concentration [3,4], or to their faster evolution into larger ions or neutralization. Air ions are charged molecules or clusters formed by the ionization of air, typically categorized as small, intermediate, and large ions based on their mobility and size.
This study aims to provide a detailed analysis of atmospheric concentrations of Rn, positive and negative small ions, particle number concentrations and PM2.5 levels, along with meteorological factors temperature and humidity during two relatively close but different periods (early and late autumn). Study aims to contribute to the understanding of urban air quality dynamics and the interconnection and interaction of the individual components of the air we breathe. Those components are: radon concentation in air as well as in soil gas, small air ions, aerosols (from 10 nm to 10 μm), and meteorological parameters such as temperature (T) and relative humidity (RH) as a consequence of soil water content. In the colder months, Belgrade experiences elevated levels of particulate matter (PM2.5 and PM10), nitrogen dioxide (NO2), sulfur dioxide (SO2), and carbon monoxide (CO), primarily due to intensified residential heating and to a lesser extent due to vehicular emissions [5]. These pollutant species originate from the combustion of wood, low-quality coal, and high-sulfur fuel in small household stoves and heating plants, as well as from diesel and gasoline engine exhaust [5]. Meteorological conditions such as temperature inversions and low wind speeds suppress atmospheric mixing and trap these emissions near the surface, resulting in persistent smog and air quality levels that too often exceed international health guidelines [6]. Fine particulate matter (PM2.5) concentrations often exceed EU limits, contributing to adverse respiratory and cardiovascular health outcomes, particularly among vulnerable populations [6]. Concurrently, naturally occurring radon gas and its short-lived decay products tend to accumulate near the ground surface, contributing to increased radiation dose from inhalation [7,8,9]. These radioactive progeny attach to fine aerosols, enhancing their penetration into the deep lung and elevating the risk of lung cancer with chronic exposure [8,9]. High aerosol concentrations during cold weather periods also lead to a marked decrease in small air ion concentrations through ion–aerosol attachment, which alters local atmospheric electric properties and may impact aerosol transformation and deposition processes [3,10]. The combined effects of elevated particulate pollution, radon-related radioactivity, and suppressed air ion concentrations create a complex cold-weather exposure profile in Belgrade that increase public health risks and necessitates integrated air quality and health protection strategies.

1.1. Radon

Radon (222Rn) is a naturally occurring radioactive noble gas that is continuously exhaled from the Earth’s surface. The radioactive decay of radon is the primary source of ion pair production in the lower troposphere [8]. Radon undergoes decay with a half-life of 3.82 days, releasing alpha particles with energies of approximately 5.49 MeV [8]. Each alpha particle, during its short life, can generate over 105 ion pairs (bipolar ionization) through collision processes in ambient air [11].
The exhalation rate of radon is modulated by environmental parameters, particularly soil moisture content and temperature. Atmospheric RH is closely linked to soil water content, both of which are governed by soil and air temperature [12]. Since radon is moderately soluble in water, elevated soil moisture during winter months typically suppresses its diffusion and release into the atmosphere [13]. Although radon, through its alpha decay, is the primary contributor to atmospheric ionization near the surface, other natural sources such as the gamma decay of potassium 40K and cosmic ray-induced ionization also contribute. However, the combined contribution from these additional sources is constant and generally limited to less than 20% of the total ion pair production in the lower atmosphere [14,15].

1.2. Aerosols

Atmospheric aerosols are defined as suspensions of solid or liquid particles in a gas [16]. These particles span over more than four orders of magnitude in size, from newly nucleated molecular clusters only a few nanometers in diameter to cloud droplets or dust particles tens of micrometers across [17]. Aerosols are typically classified by aerodynamic diameter, either into broad categories such as coarse (>2500 nm), fine (2500 nm–100 nm), and ultrafine particles (<100 nm, UFP), or more precisely into modal ranges. However, a more informative approach is mode range classification, which distinguishes particles based on formation mechanisms and size ranges: nucleation mode (<3–20 nm), Aitken mode (approximately 20–90 nm), accumulation mode (90–1000 nm), and coarse mode (>1000 nm) [16]. Depending on the literature source, these boundaries may vary slightly; nevertheless, mode classification is a useful tool for interpreting observed size distributions and should be considered when discussing dominant particle fractions. Alternatively, particulate matter (PM) can be classified by cumulative mass concentration of particles into PM10, PM2.5, and PM1 categories, which represent the total cumulative mass concentration of particles smaller than 10 μm, 2.5 μm, and 1 μm, respectively. It should be noted that, due to their negligible mass, UFPs contribute minimally to the overall mass concentrations of PM2.5 and PM10. Each of these size modes is associated with different formation mechanisms; for instance, nucleation-mode UFP are mainly formed by gas-to-particle conversion of atmospheric vapors. UFP are typically generated in large numbers either directly as byproducts of fossil fuel combustion and other industrial emissions or secondarily by the condensation of semi-volatile substances [18].
Unlike larger particles, UFPs deposit very efficiently in the pulmonary alveoli and can translocate from the lungs into the bloodstream, reaching all organs [19]. Consequently, exposure to UFPs has been linked to detrimental cardiovascular and respiratory outcomes [20]. For example, inhalation of UFPs is associated with accelerated atherosclerosis, an increased risk of asthma exacerbation, and heightened sensitivity to allergens [21,22]. Overall, the size-dependent classification of particulate matter is crucial because it reflects differences in particle origin, deposition behavior, and health impacts, with the ultrafine fraction warranting particular attention due to its unique ability to penetrate biological barriers and induce adverse effects.

1.3. Small Air Ions

Small air ions are charged clusters which are constantly present in the atmosphere in concentrations of several hundred to several thousand ions per cubic centimeter [10]. Their diameter ranges from 0.6 to 1.3 nm while the mobility is in the range from 0.7 to 1.8 cm2/Vs [23] and they have a relatively short lifespan measured in seconds. If the small ions are not neutralized, they become intermediate ions and then large ions. The process of ion growth from a primary ionized particle to a large ion is called ion evolution [24]. The small air ion concentration (n±) is presented by balance equation:
d n ± d t = q α n ± n n ± β Z
where q is the volumetric production rate, Z is the particle number concentration, α coefficient of losses of ion-to-ion recombination and β an effective ion-aerosol attachment coefficient, which is the integral over the size distribution of aerosol particles [25,26].
In open space ions can be neutralized through recombination or can increase in mass by attaching to other aerosols in the air. In the latter case, their mobility decreases, and they cease to play a significant role in atmospheric processes. This process occurs much more frequently, leading to an inverse relationship between ion and aerosol concentrations in the air. It is important to note that the mass and, consequently, the mobility of ions differ between positive and negative ions [10,15]. The ratio of positive to negative ion concentration is known as the unipolarity coefficient and typically has a value above 1. This is partially a consequence of the global electric circuit, in which the Earth is negatively charged, as well as the structure of air ions, where negative ions exhibit greater mobility and therefore follow a faster evolution pathway [27]. Ions in the air are an integral part of the atmosphere in which humans are born and live. Ions affect humans in two ways, through physiological effects during inhalation and by purifying the air through the aggregation and deposition of charged particles on surfaces [28]. Many studies have reported positive effects of negative air ions, for example, in reducing symptoms of depression, the cardiovascular system, the respiratory system, reproduction and development, cognition, sports muscle injury [29], and a lack of ions for any reason can have serious consequences for human and animal health [30].

2. Materials and Methods

2.1. Instrumentation

The study employed a multi-faceted approach to measure the concentrations of radon, air ions, UFP, PM, temperature and humidity. The following methodologies were utilized:
-
Radon Measurement: a continuous radon monitor Rad-7 (Durridge, Billerica, MA, USA) was deployed to measure radon hourly concentrations in real-time. It is a high-sensitivity electronic radon detector that operates using a solid-state detector in a sealed high voltage counting chamber. RAD7 measures the energy of each alpha particle and uses alpha spectrometry to distinguish between these isotopes based on their discrete energy peaks. This enables the instrument to discriminate radon from other radioactive isotopes like thoron (220Rn) and to reject background radiation. The alpha counts from radon progeny like polonium 218Po and 214Po allow the RAD7 to accurately calculate the radon concentration in Bq/m3.
-
Radon in soil gas: a continuous radon monitor RTM1688-2 (Sarad GmbH, Dresden, Germany) and soil gas probe were used to measure radon in soil at 80 cm depth, with integration time set to 15 min. At each measuring location, 4–5 measurements were performed until saturated value of radon in soil was reached.
-
Air Ions Measurement: Air ion concentrations were measured using bipolar air ion counter [31], made at the Institute of Physics, Belgrade. Instrument works on the principle of the Gerdien ion counter (or Gerdien condenser) that is a classical instrument used to measure atmospheric ion concentrations and air conductivity. A Gerdien condenser detects air ions by measuring signal of tens of femptoampere electric current (~10−14 A) collected as ions are drawn by a fan through a cylindrical capacitor under the influence of an applied radial electric field within the electrode system. The current, proportional to the ion concentration and mobility, is collected on a central electrode and measured with an electrometer. The instrument is set for detecting class of small air ions (mobility > 0.5 cm2V⁻1s⁻1). The measurement uncertainty of the ion concentration meter is ~5 ions/cm3 under steady-state conditions during indoor measurements and when the measurement is conducted with a sufficiently large number of samples and frequent zeroing [31]. During outdoor measurements, airflow may introduce instability in the air flow through the electrodes. Although the fan speed is feedback-controlled based on the flow rate, disturbances can occur in certain measurements, particularly during system zeroing. In such cases, the measurement uncertainty increases to 20 ions/cm3.
-
Nanoparticle size distributions from 10 to 420 nm were measured using NanoScan SMPS™ Nanoparticle Sizer 3910 (TSI Incorporated, Shoreview, MN, USA) for particles from 10 to 420 nm. Instrument operation is based on a unipolar diffusion charging method, where aerosol particles are charged and then classified by electrical mobility using a radial differential mobility analyzer (rDMA). The resulting particle size distribution is determined by measuring the electrical current carried by the particles as a function of their mobility.
-
Fine and coarse particles were measured using Optical Particle Sizer 3330 (OPS, TSI Incorporated, Shoreview, MN, USA for particles from 0.3 to 10 μm. OPS measures particle size and concentration using light scattering, where a laser beam illuminates individual particles as they pass through a detection chamber. The intensity and angle of the scattered light are analyzed to determine the particle’s optical diameter based on Mie scattering theory. Using SMPS and OPS together, all particle diameters from 10 nm to 10 µm are covered.
-
PM, i.e., cumulative mass concentration of particles, T, RH, and pressure were measured using AirVisual Outdoor monitor. The AirVisual Outdoor monitor by IQAir measures air quality by using laser-based optical sensors (similar to OPS, TSI) to detect particulate matter (PM2.5 and PM10) and electrochemical sensors to measure gaseous pollutants like CO2, temperature, and humidity.

2.2. Measuring Places

Measurements of all mentioned parameters were conducted at two distinct locations in Belgrade under two contrasting meteorological and environmental conditions, the first during early autumn, characterized by relatively high temperatures and clean air, and the second during late autumn, when ambient temperatures were significantly lower, relative humidity higher and residential heating activities were intense. At both measurement sites, nearly identical concentrations of radon in soil gas were recorded at a depth of 80 cm. Similarity in soil radon concentrations, combined with the use of identical instrumentation, experimental setup, and synchronized measurement protocols, enabled a meaningful comparison between the two locations despite environmental variability.
The early-autumn campaign was performed in a suburban environment at the “Vinča” Institute of Nuclear Sciences, Belgrade, representing relatively low-pollution background conditions. However, during the non-heating season, air pollution in Belgrade is still significantly influenced by emissions from nearby thermal power plants. The late-autumn campaign took place in the city center of Belgrade (the yard of the house in Svetogorska street), where the atmosphere was heavily polluted due to intensive urban emissions and stagnant meteorological conditions. These temporal and spatial contrasts provided a suitable framework for investigating seasonal and locational influences on atmospheric composition In terms of unrestricted radon exhalation from the soil, the suburban measurement site is a large grass-covered area that allows radon to escape freely from the soil. The urban measurement site was located on relatively porous concrete but also in close proximity to green areas. Such a configuration is expected to have minimal effect on soil sealing, allowing radon and other exhaled gases (CO2, CH4, N2O, etc.) to escape without significant obstruction.
The primary objective of the study was to explore interdependencies among measured parameters: radon concentration, air ion levels, aerosol content, and meteorological variables and also to elucidate the basic atmospheric processes governing air pollution dynamics, environmental radioactivity, and ion–aerosol interactions.

3. Results and Discussion

3.1. Air Temperature and Relative Humidity

From 20 to 24 September 2024, Belgrade experienced stable early-autumn weather dominated by high atmospheric pressure (~1020 hPa), light southeast winds (2–4 m/s), clear skies, and daily temperature amplitudes ranging from ~10 °C at night to ~25 °C during the day [32], averaging around 17 °C over the 4-day period (Figure 1a (black curve)). RH followed a diurnal cycle, with afternoon values near 45% and night-time peaks approaching 90%, while soil moisture remained low (~0.18 m3/m3) due to preceding dry conditions. Despite higher absolute humidity from increased evaporation, the warmer air can hold more water vapor, often resulting in lower relative humidity values during the hottest parts of the day (Figure 1b (black curve)).
During late autumn (Figure 1a,b (red curves)), a mid-latitude cyclone brought dynamic atmospheric changes, with surface pressure dropping below 1005 hPa and winds reaching up to 8 m/s. This cyclone introduced increased cloud cover and precipitation, resulting in high RH (up to 80%) and cooler mean temperatures (~10 °C), with greater day-to-day variation and nighttime minima between 5 and 10 °C. Light rainfall during this period significantly elevated the soil moisture content to ~0.32 m3/m3, approaching field capacity [32].
Together, these intervals illustrate the seasonal progression in Belgrade from warm, anticyclonic early autumn to cooler, wetter, and more variable late-autumn conditions that negatively affects radon exhalation from the soil and consequently lowering air ion production.
These meteorological intervals clearly reflect the seasonal transition in Belgrade—from warm, dry, and anticyclonic early autumn to cooler, wetter, and dynamically variable late-autumn conditions. Such shifts significantly reduce radon exhalation due to elevated soil moisture and suppressed vertical mixing, thereby lowering near-ground ion production.

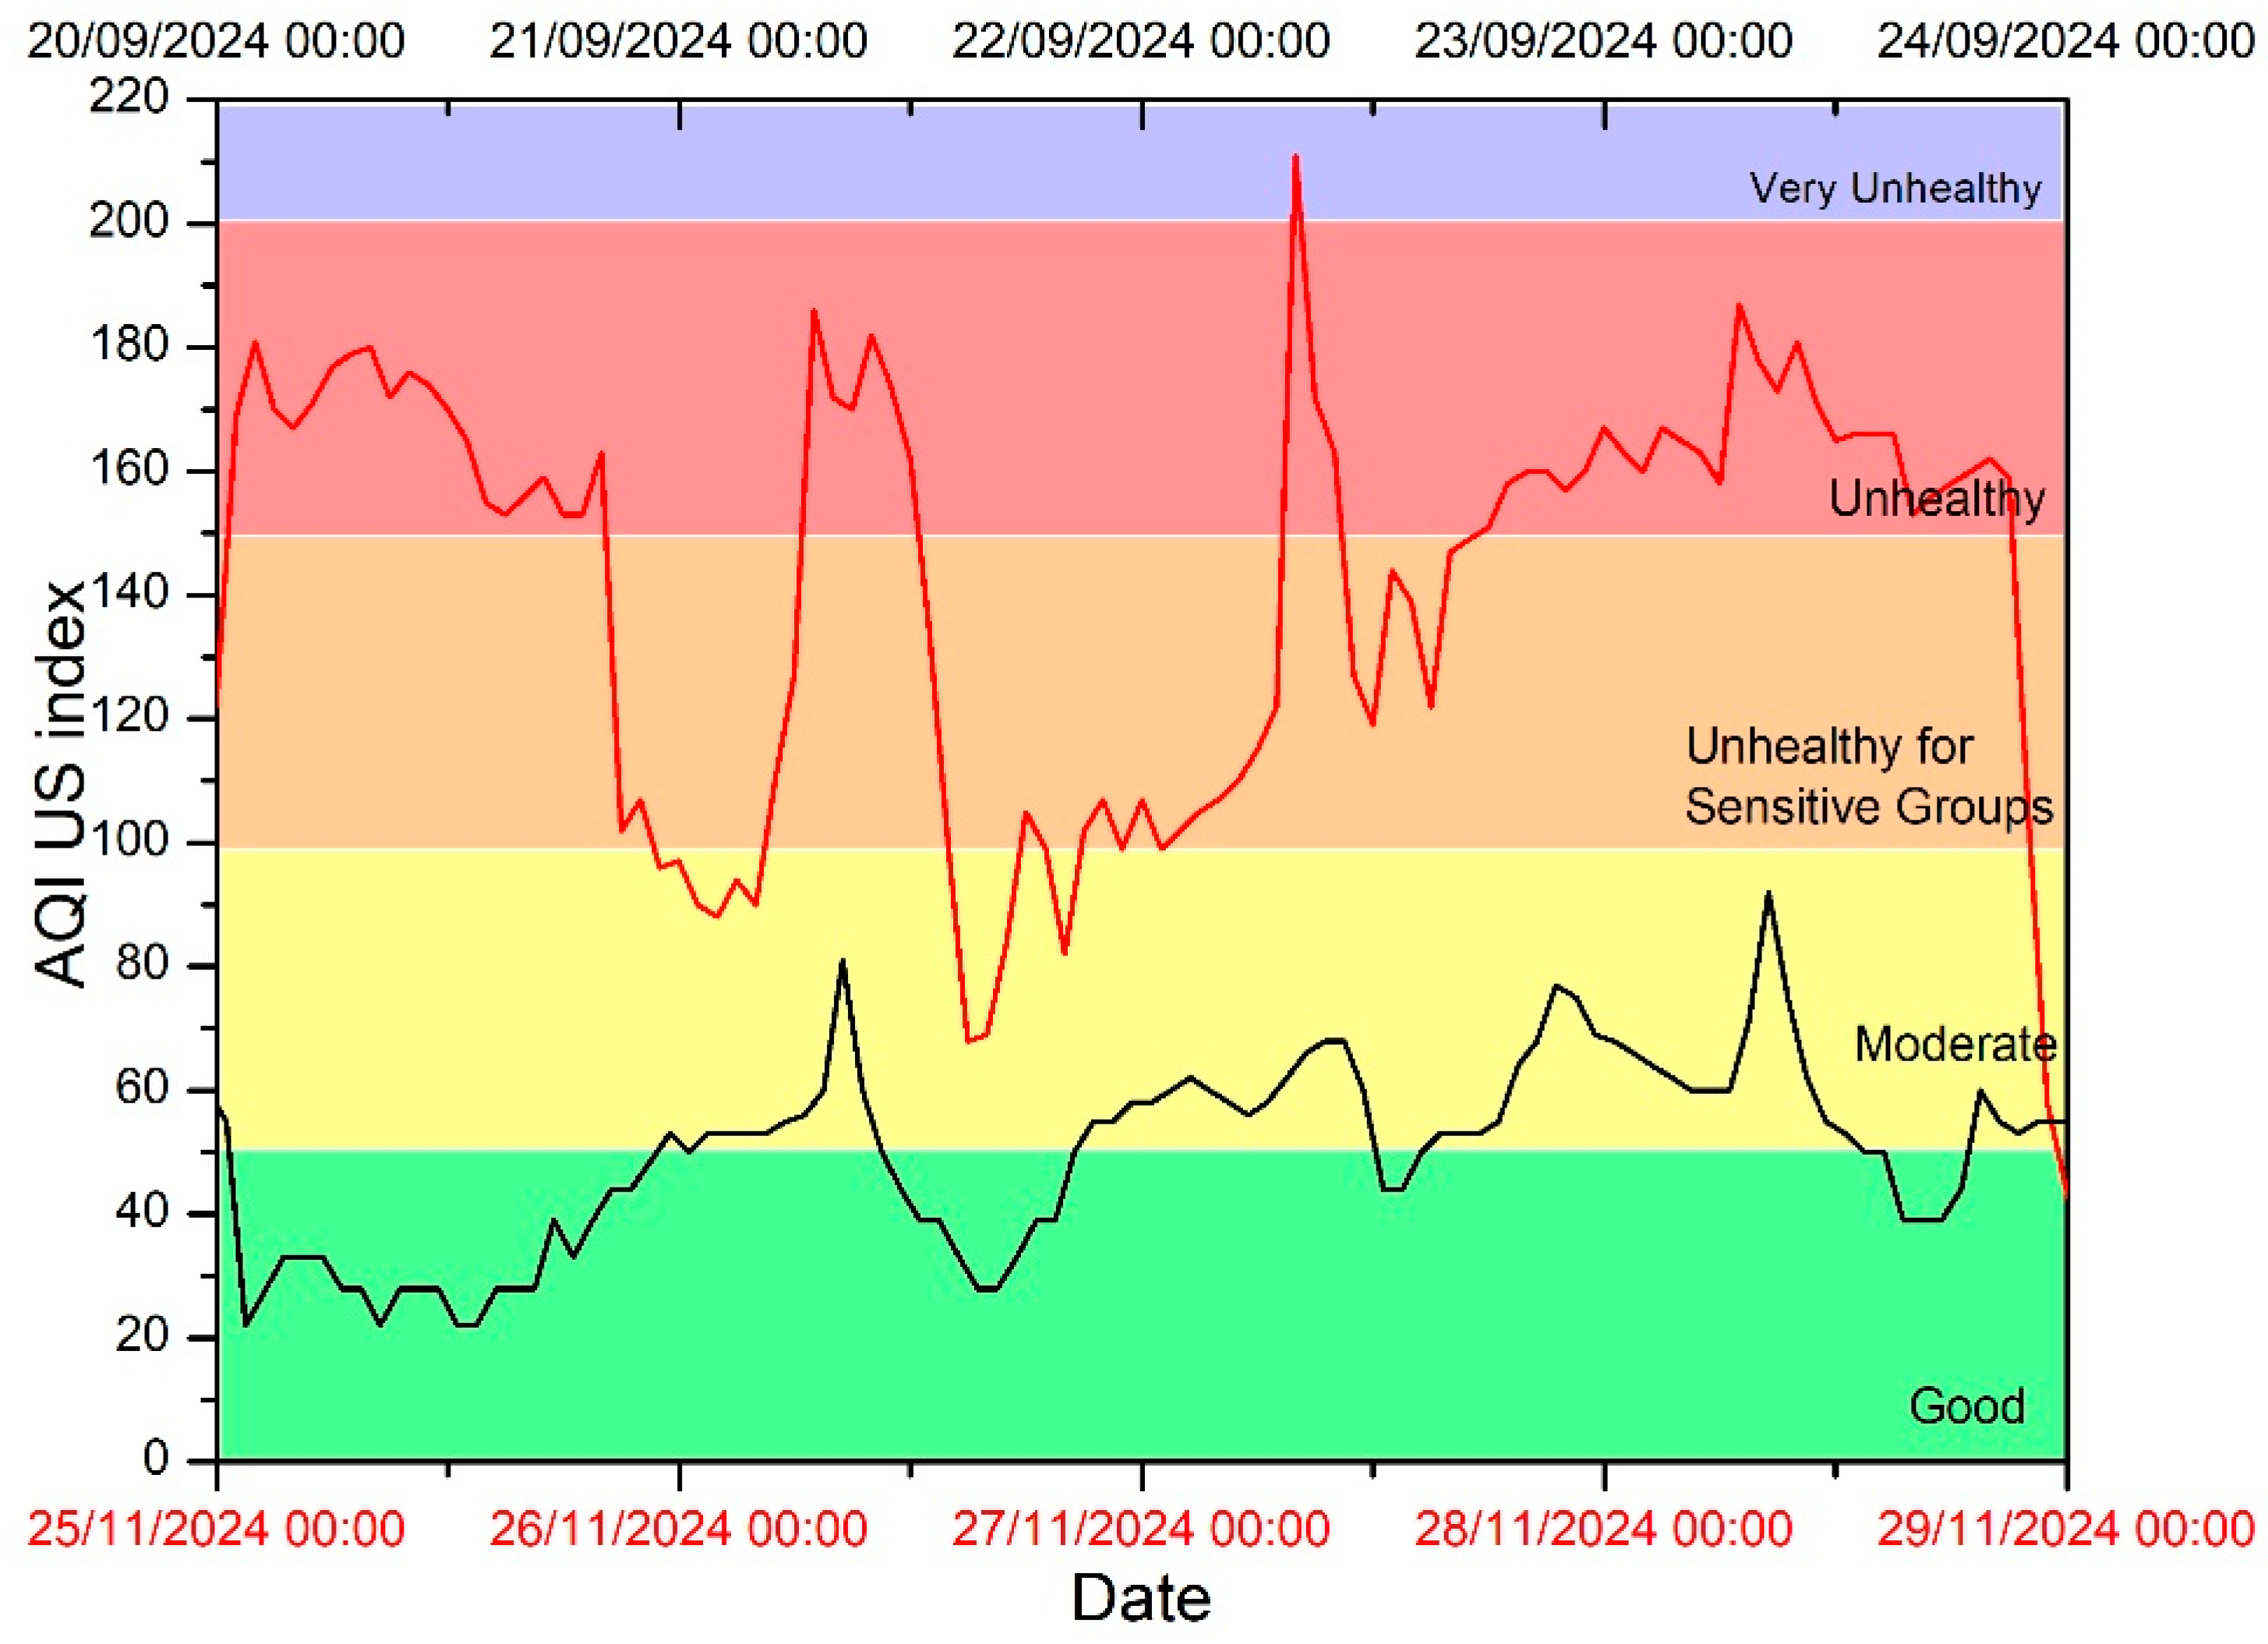
3.2. Air Quality Index

The Air Quality Index (AQI) is used to inform the public about the quality of the air they breathe, helping them understand potential health risks. It is calculated by measuring the concentrations of key pollutants, mostly particulate matter (PM2.5 and PM10), carbon monoxide, sulfur dioxide, and nitrogen dioxide. IQAir monitor measures the real-time concentration of these pollutants in the air, then converts them into AQI values based on predefined breakpoints for each pollutant. The highest AQI value among the pollutants is used as the overall AQI for the location. This helps individuals to be informed when making decisions about outdoor activities, particularly those with respiratory conditions or other health issues.
The AQI measured at both locations shown in Figure 2 indicates elevated air pollution levels in the city center during late autumn (red line) but also moderate air quality during early autumn (black line) which is most likely a consequence of the operation of nearby thermal power plants.
The AQI values shown are derived from PM2.5 concentrations via a non-linear scale. For better interpretability, horizontal lines representing category boundaries (e.g., AQI = 50, 100, 150) corresponding to PM2.5 levels of 12.0, 35.4, and 55.4 µg/m3 are indicated in the figure. The AQI (U.S. index) provided by the IQAir platform is based on in situ data from the AirVisual Outdoor monitor and does not follow the standardized U.S. EPA (USAQI) protocol. Instead, it uses a proprietary method developed by IQAir. During the early autumn measurements in Vinča (suburban site) AQI was in the range of good and moderately good air, never exceeding 100. Air parameter measurements were also conducted in the center of Belgrade at the end of November when the air was extremely polluted with average AQI US Index 147 which is bordering on unhealthy air with extremely high pollution peaks up to 210 (very unhealthy air) shown in Figure 2. Persistently polluted air during colder periods of the year poses serious health risks, particularly exacerbating respiratory and cardiovascular conditions in vulnerable populations.

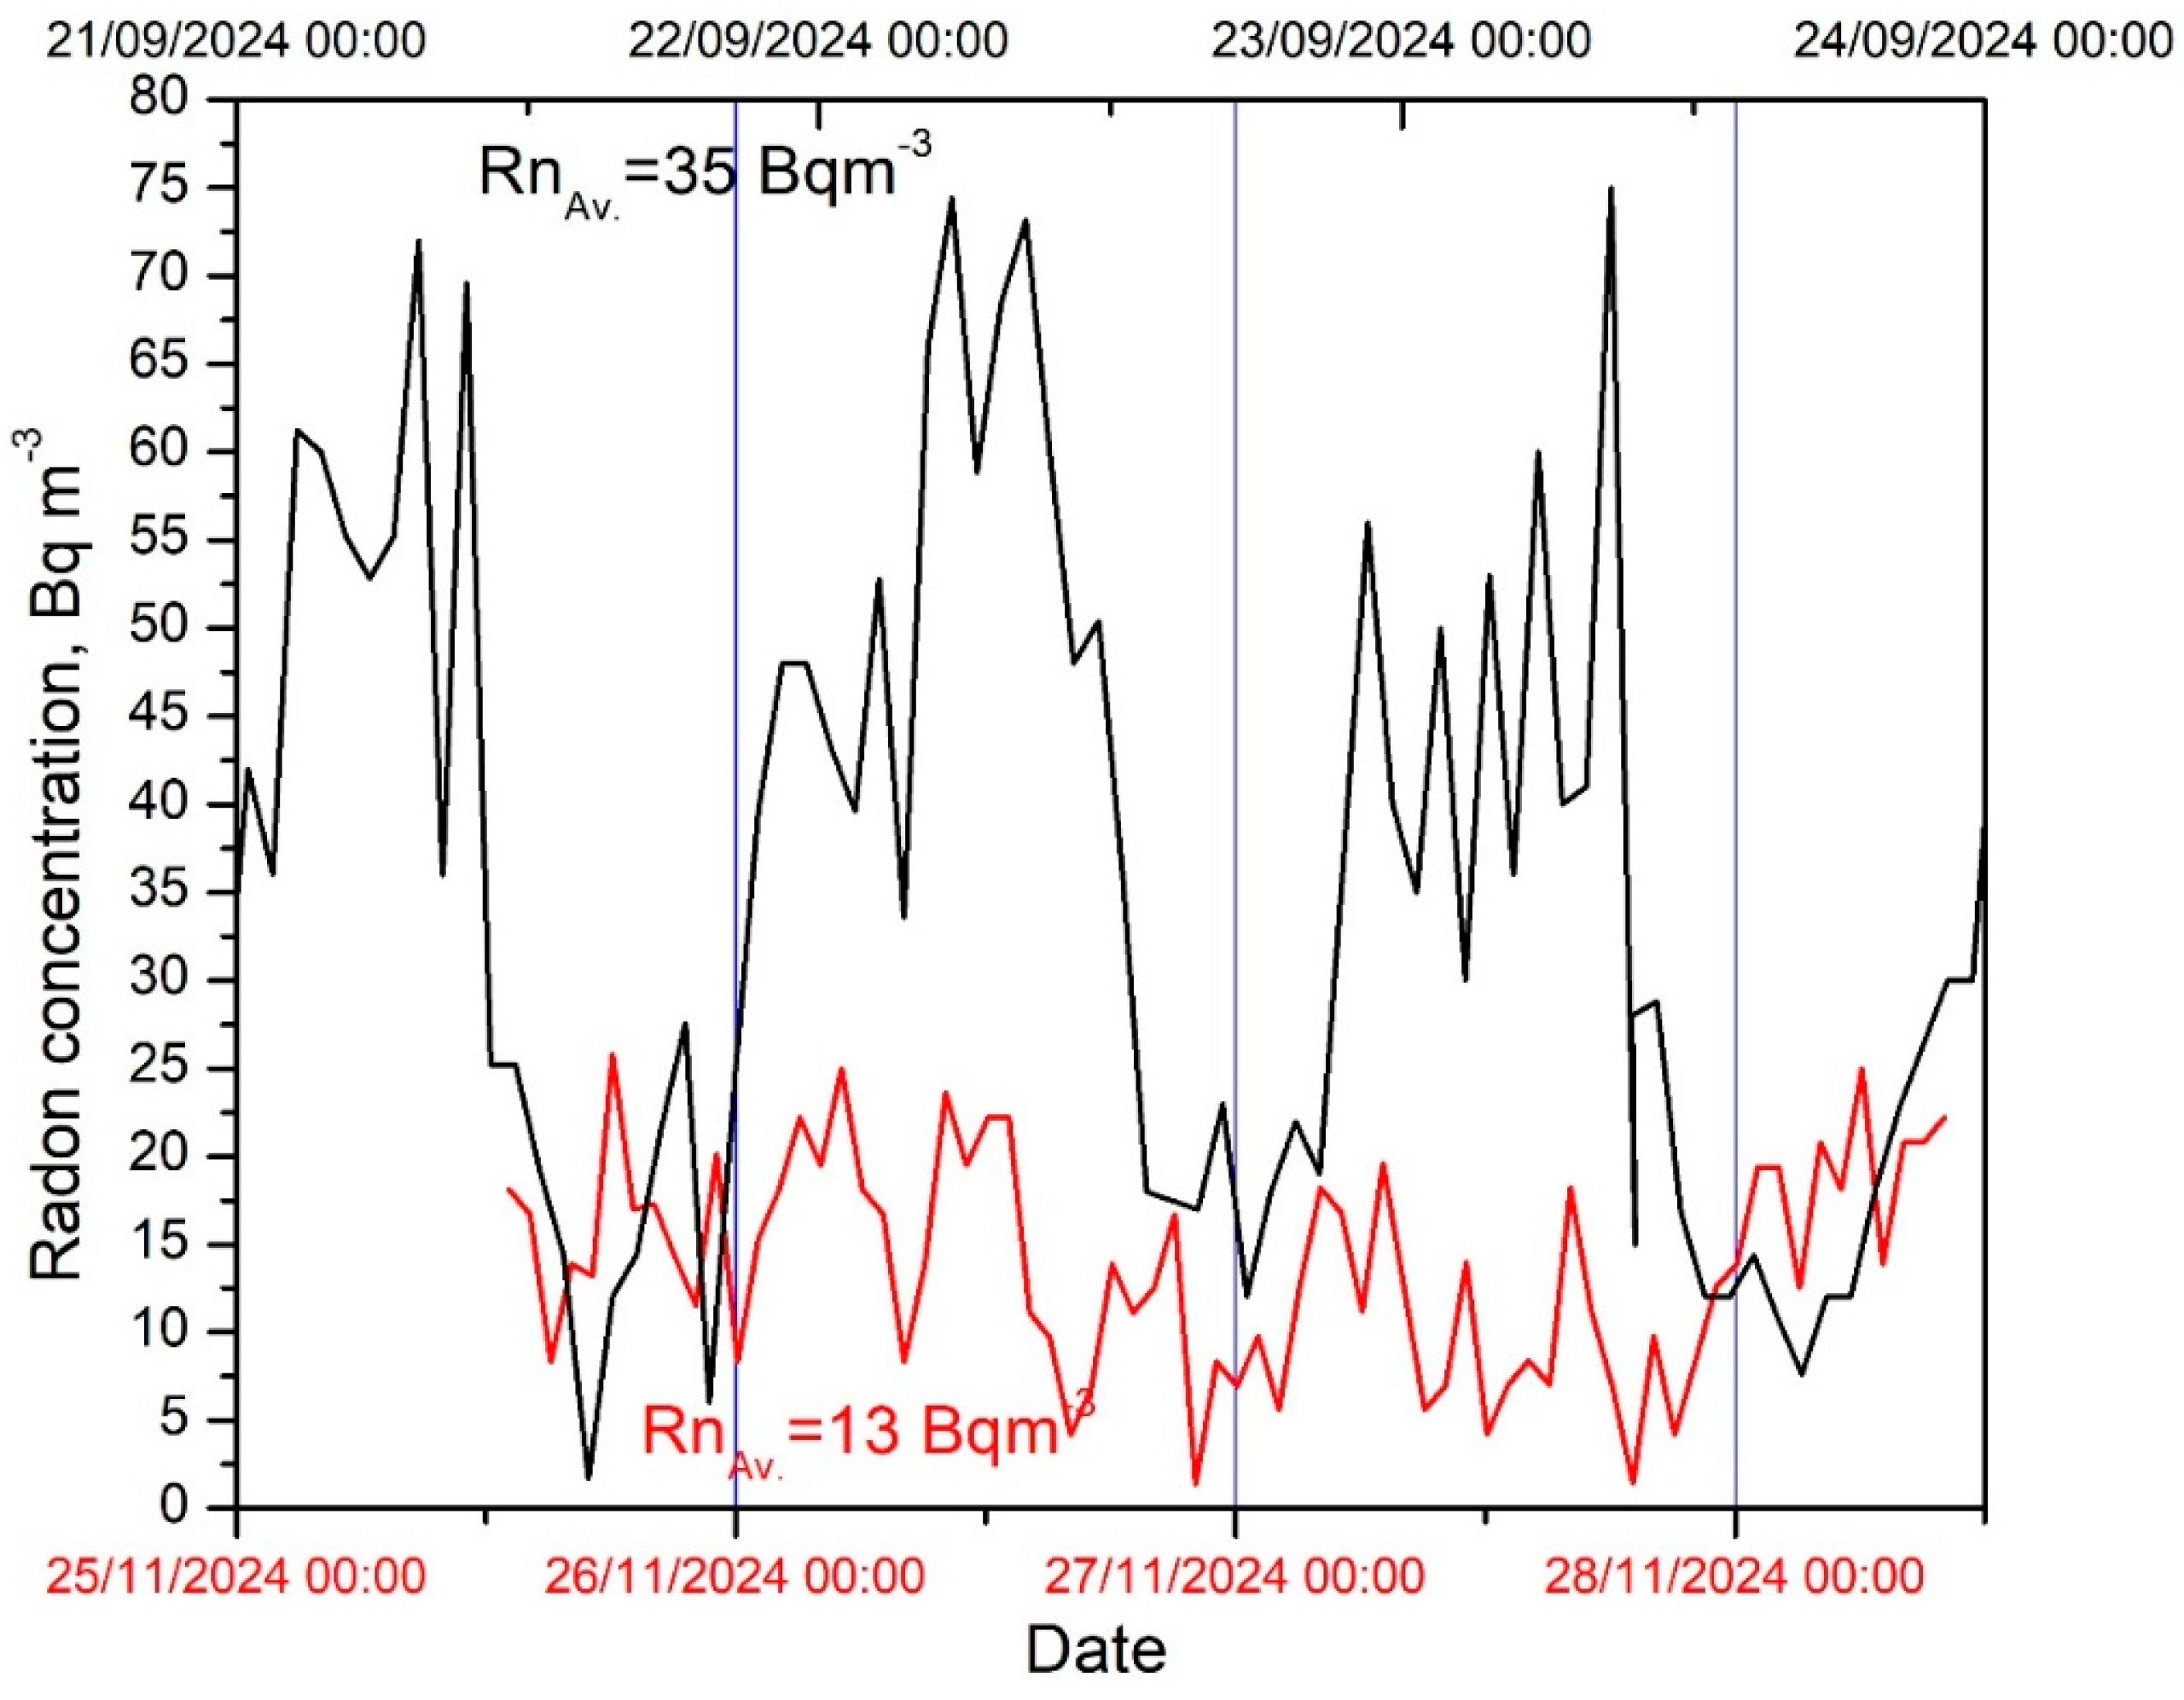
3.3. Radon Concentrations

Radon concentrations in soil gas at a depth of 80 cm, measured at two distinct locations—one in a suburban area and the other in the city center—were found to be statistically equivalent: 10,000 ± 600 Bq/m3 and 10,930 ± 660 Bq/m3, respectively. This result supports the selection of these measurement sites, indicating similar underlying geology and comparable radon exhalation potential. Consequently, the similarity in soil gas concentrations suggests that differences in airborne radon levels between the two sites are likely attributable to meteorological or urban structural factors, rather than to variations in subsurface radon sources.
Outdoor radon concentrations during early autumn measurements in suburban part of Belgrade exhibit distinct diurnal and seasonal patterns shown with black curve in Figure 3, are influenced by T and RH. Average radon concentration was 35 Bq/m3 while diurnal levels show pronounced nocturnal peaks, frequently exceeding 60 Bq/m3, and daytime concentrations fall significantly. This diurnal variation is a well-documented effect caused by the formation of a nocturnal temperature inversion layer, which inhibits vertical mixing and allows radon exhaled from the soil to accumulate near the surface during the night [33,34,35]. After sunrise, increasing solar radiation heats the Earth’s surface, which gradually weakens and breaks down the temperature inversion layer by daytime convection. This process enhances atmospheric turbulence and vertical mixing, allowing radon to disperse into higher layers of the atmosphere and resulting in lower concentrations near the ground during the day [36]. The radon pattern is tightly linked to meteorological conditions: radon concentration typically exhibits a negative correlation (Pearson correlation coefficient) with T and a positive correlation with RH [37]. In the present data, higher radon values are observed during periods of lower temperature and higher humidity. During the measurements, radon concentration was in a strong negative correlation with temperature (−0.73) and also a strong but positive correlation with relative air humidity (0.6) which is consistent with the relationships reported by [37] (r ≈ −0.75 with T and r ≈ +0.66 with RH).
In contrast, the urban site during late autumn (red curve) shows a 2.7 times lower average radon concentration (13 Bq/m3) with a more stable profile and almost no diurnal variation. The lower ambient T (average 10 °C) and consistently higher RH (average 66%) indicate longer nights and a more stable atmosphere, both of which support prolonged radon accumulation near the ground. Additionally, seasonal soil moisture conditions play a significant role. Autumn light rainfall and increased humidity likely led to wetter soil, reduces soil–air permeability and pore air volume, temporarily limiting radon exhalation from the soil. Because radon is moderately soluble in water, wetter soils retain more radon in the aqueous phase, which can later diffuse out under low-ventilation conditions [35]. However, moderate soil moisture can actually enhance radon release by improving emanation from mineral grains while still allowing gas–phase diffusion [38,39]. Laboratory studies have shown that radon flux reaches a maximum at intermediate soil moisture content (~20–30% by weight), beyond which it declines due to water-filled pore blockage [39]. Thus, the urban site in late autumn may have experienced suboptimal radon flux due to excessive moisture, in contrast to early autumn, where drier soil favored transport but not necessarily higher emanation. RH profiles confirm these conditions: in late autumn, high RH persisted day and night, suggesting moist soils and frequent dew formation, while in early autumn, RH was lower and more variable (Figure 1b).
Overall, the suburban part of Belgrade displays a classic pattern of nighttime radon trapping under inversions, while the urban city center in late autumn shows lower but more persistent radon levels due to meteorological stability, cooler temperatures, and likely moisture saturated soils. These findings align with the established influence of diurnal boundary layer dynamics, seasonal variation in atmospheric mixing, and soil moisture content on radon exhalation and atmospheric accumulation [33,38].

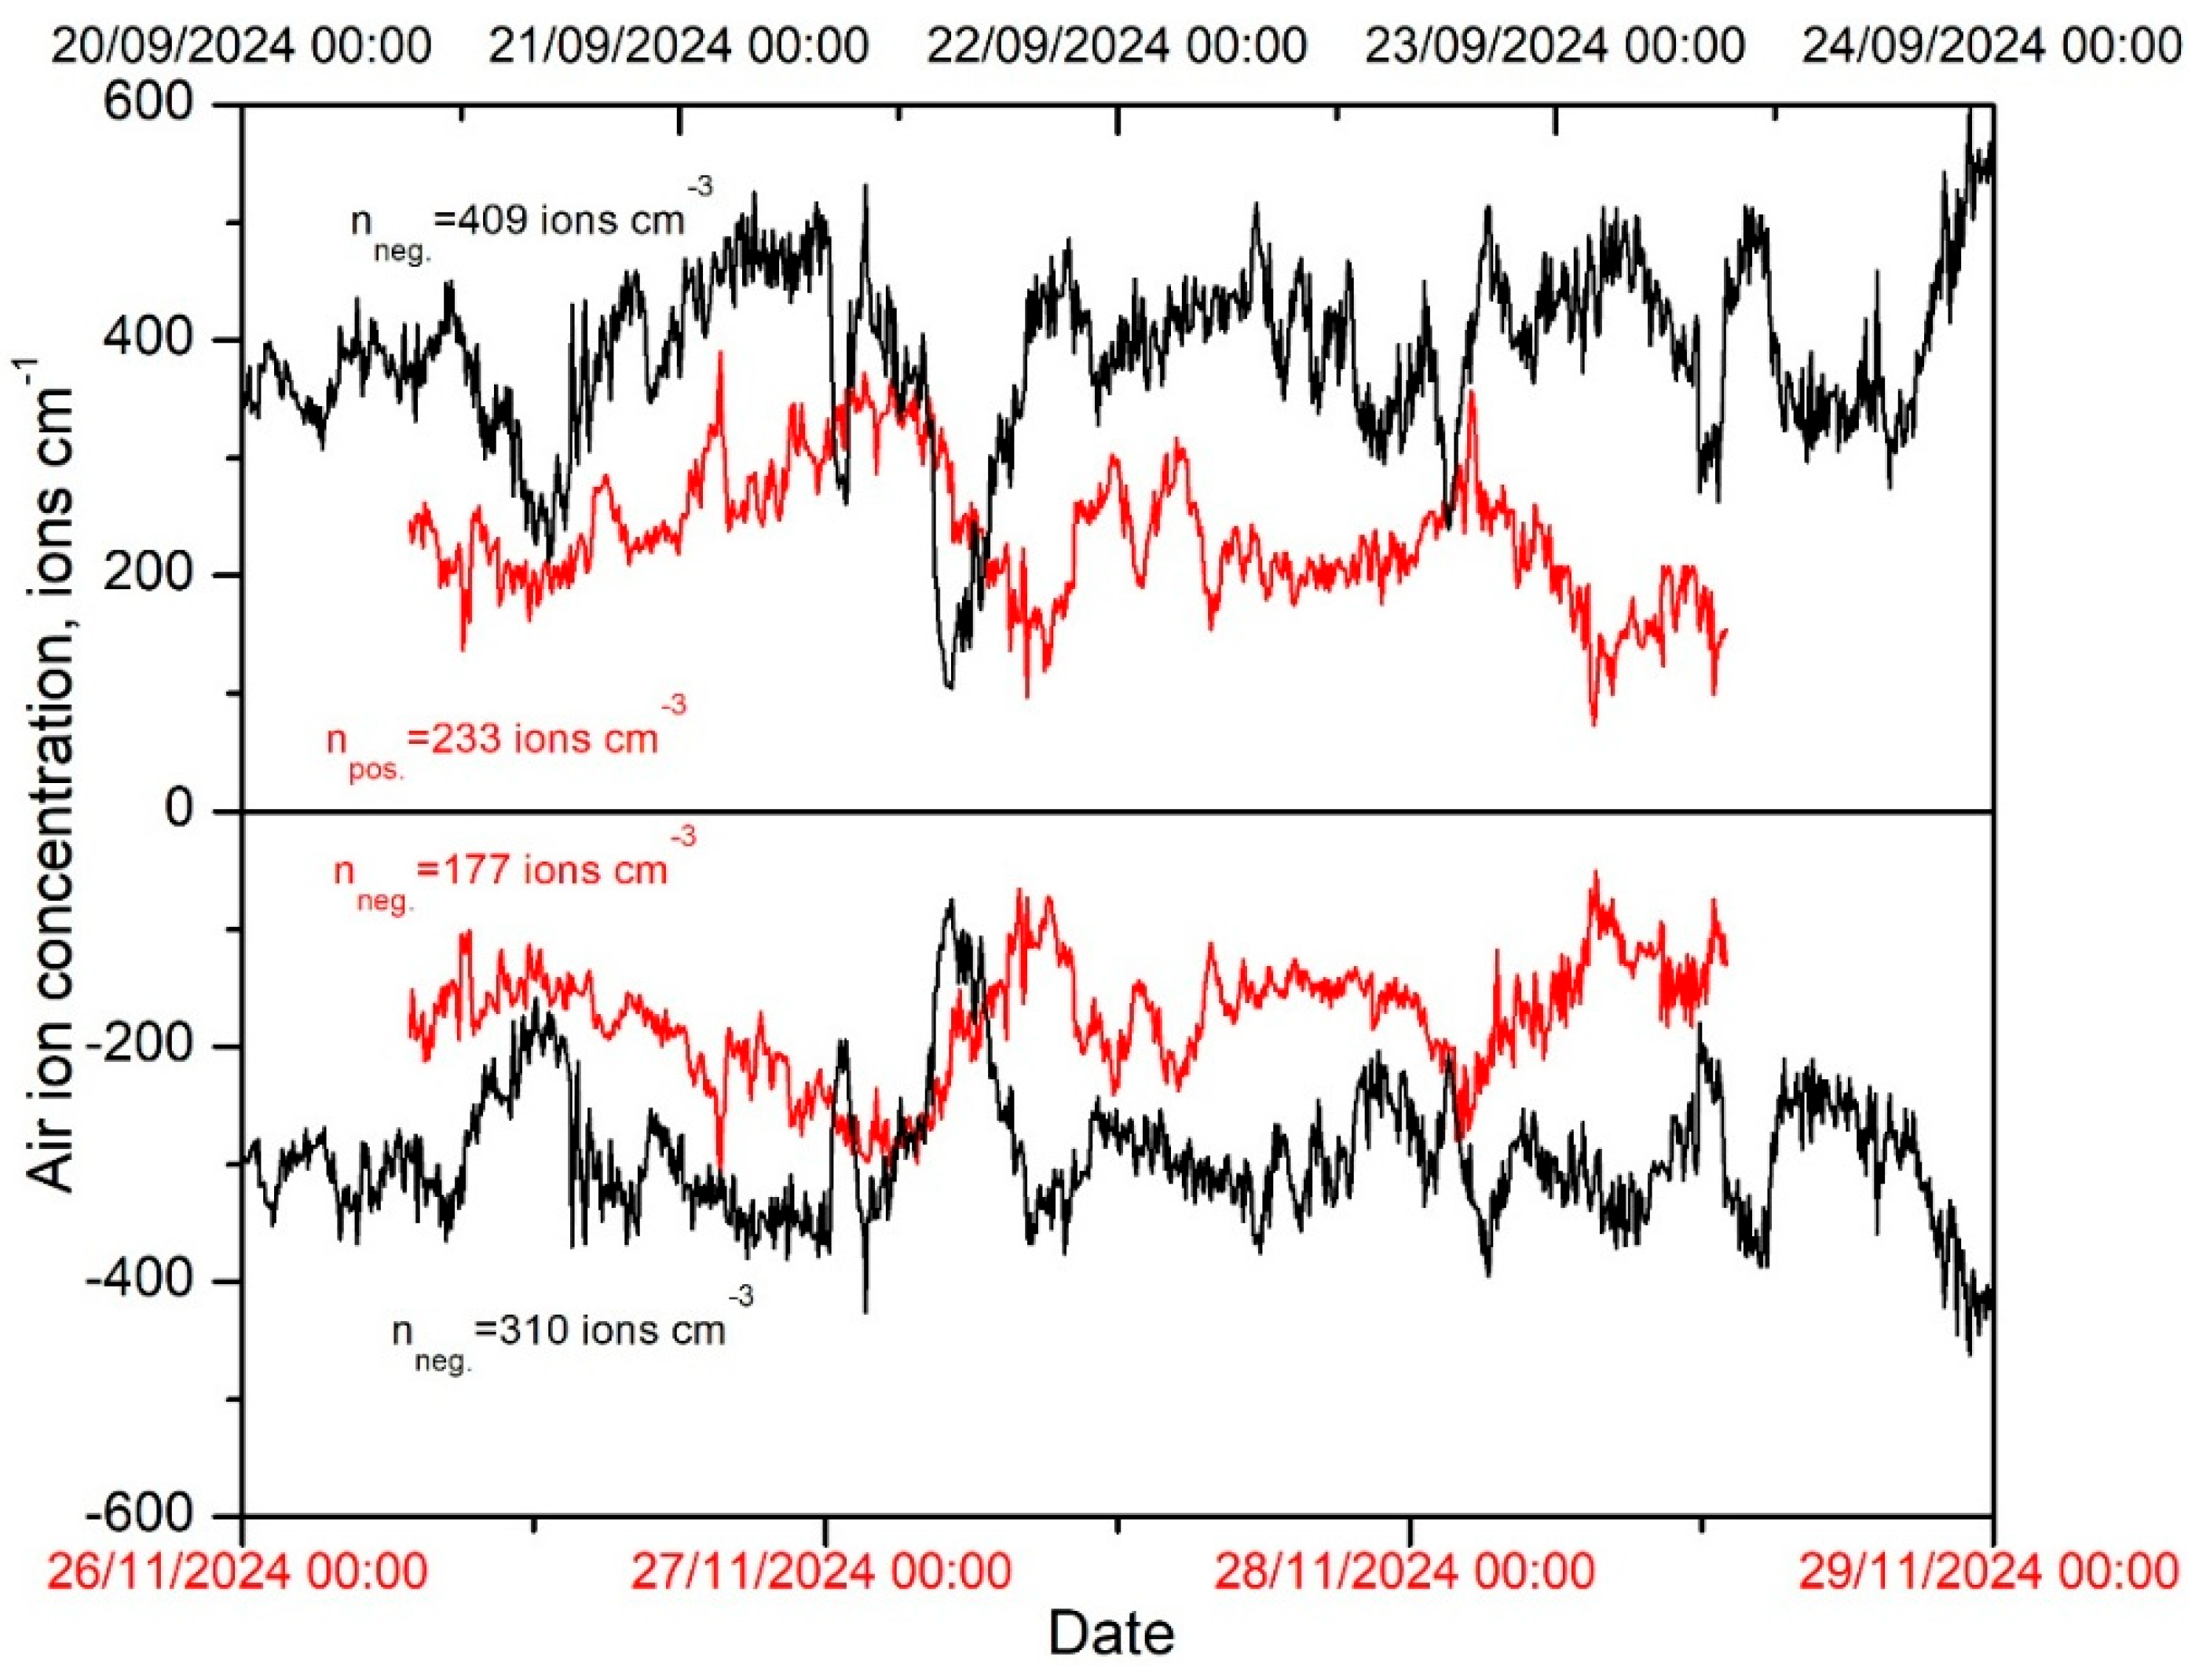
3.4. Air Ion Concentrations

Small air ion concentrations measured outdoors in Belgrade exhibit pronounced diurnal and seasonal variations, primarily driven by radon decay and modulated by local meteorological conditions [15,40]. In the late autumn period (Figure 4, (black curve)), small ion concentrations peaked early in the morning and dropped sharply in the afternoon, a pattern consistent with nocturnal radon accumulation under stable atmospheric conditions and its dispersal during daytime boundary-layer mixing [33,41]. Measurements in late autumn (Figure 4, (red curve)) showed lower ion levels and less diurnal variability, mainly due to reduced radon exhalation from moist soil, and enhanced ion loss through recombination on abundant urban aerosols [39,42]. Radon, the dominant ion generation source in the lower troposphere, was significantly higher in the early autumn dataset (35 Bq/m3) compared to late autumn (13 Bq/m3), and this disparity is directly translated to higher ion generation during warmer weather conditions [11].
Radon and air ion concentrations were in strong positive correlation (>0.5 for both ion polarities), while urban measurements showed weak negative correlation (~0.2 for both ion polarities). Lower temperatures and higher humidity in November inhibited radon transport from the soil by reducing gas permeability and increasing radon solubility in pore water [38,43]. The higher aerosol content in the urban air likely intensified small ion scavenging, lowering the steady-state ion concentration even when radon was present [3]. Moreover, urban boundary layers are generally more turbulent due to the heat island effect and structural roughness, which disrupt overnight inversion layer formation and reduce the potential for radon and consequently small air ion increase [15]. In contrast, the suburban site experiences stronger nocturnal inversions and less turbulent dilution, favoring the accumulation of both radon and air ions [44]. Overall, the observations confirm that small air ion concentrations are highly sensitive to environmental conditions, with radon exhalation from soil, boundary-layer dynamics, and aerosol number concentration acting as key controlling factors.

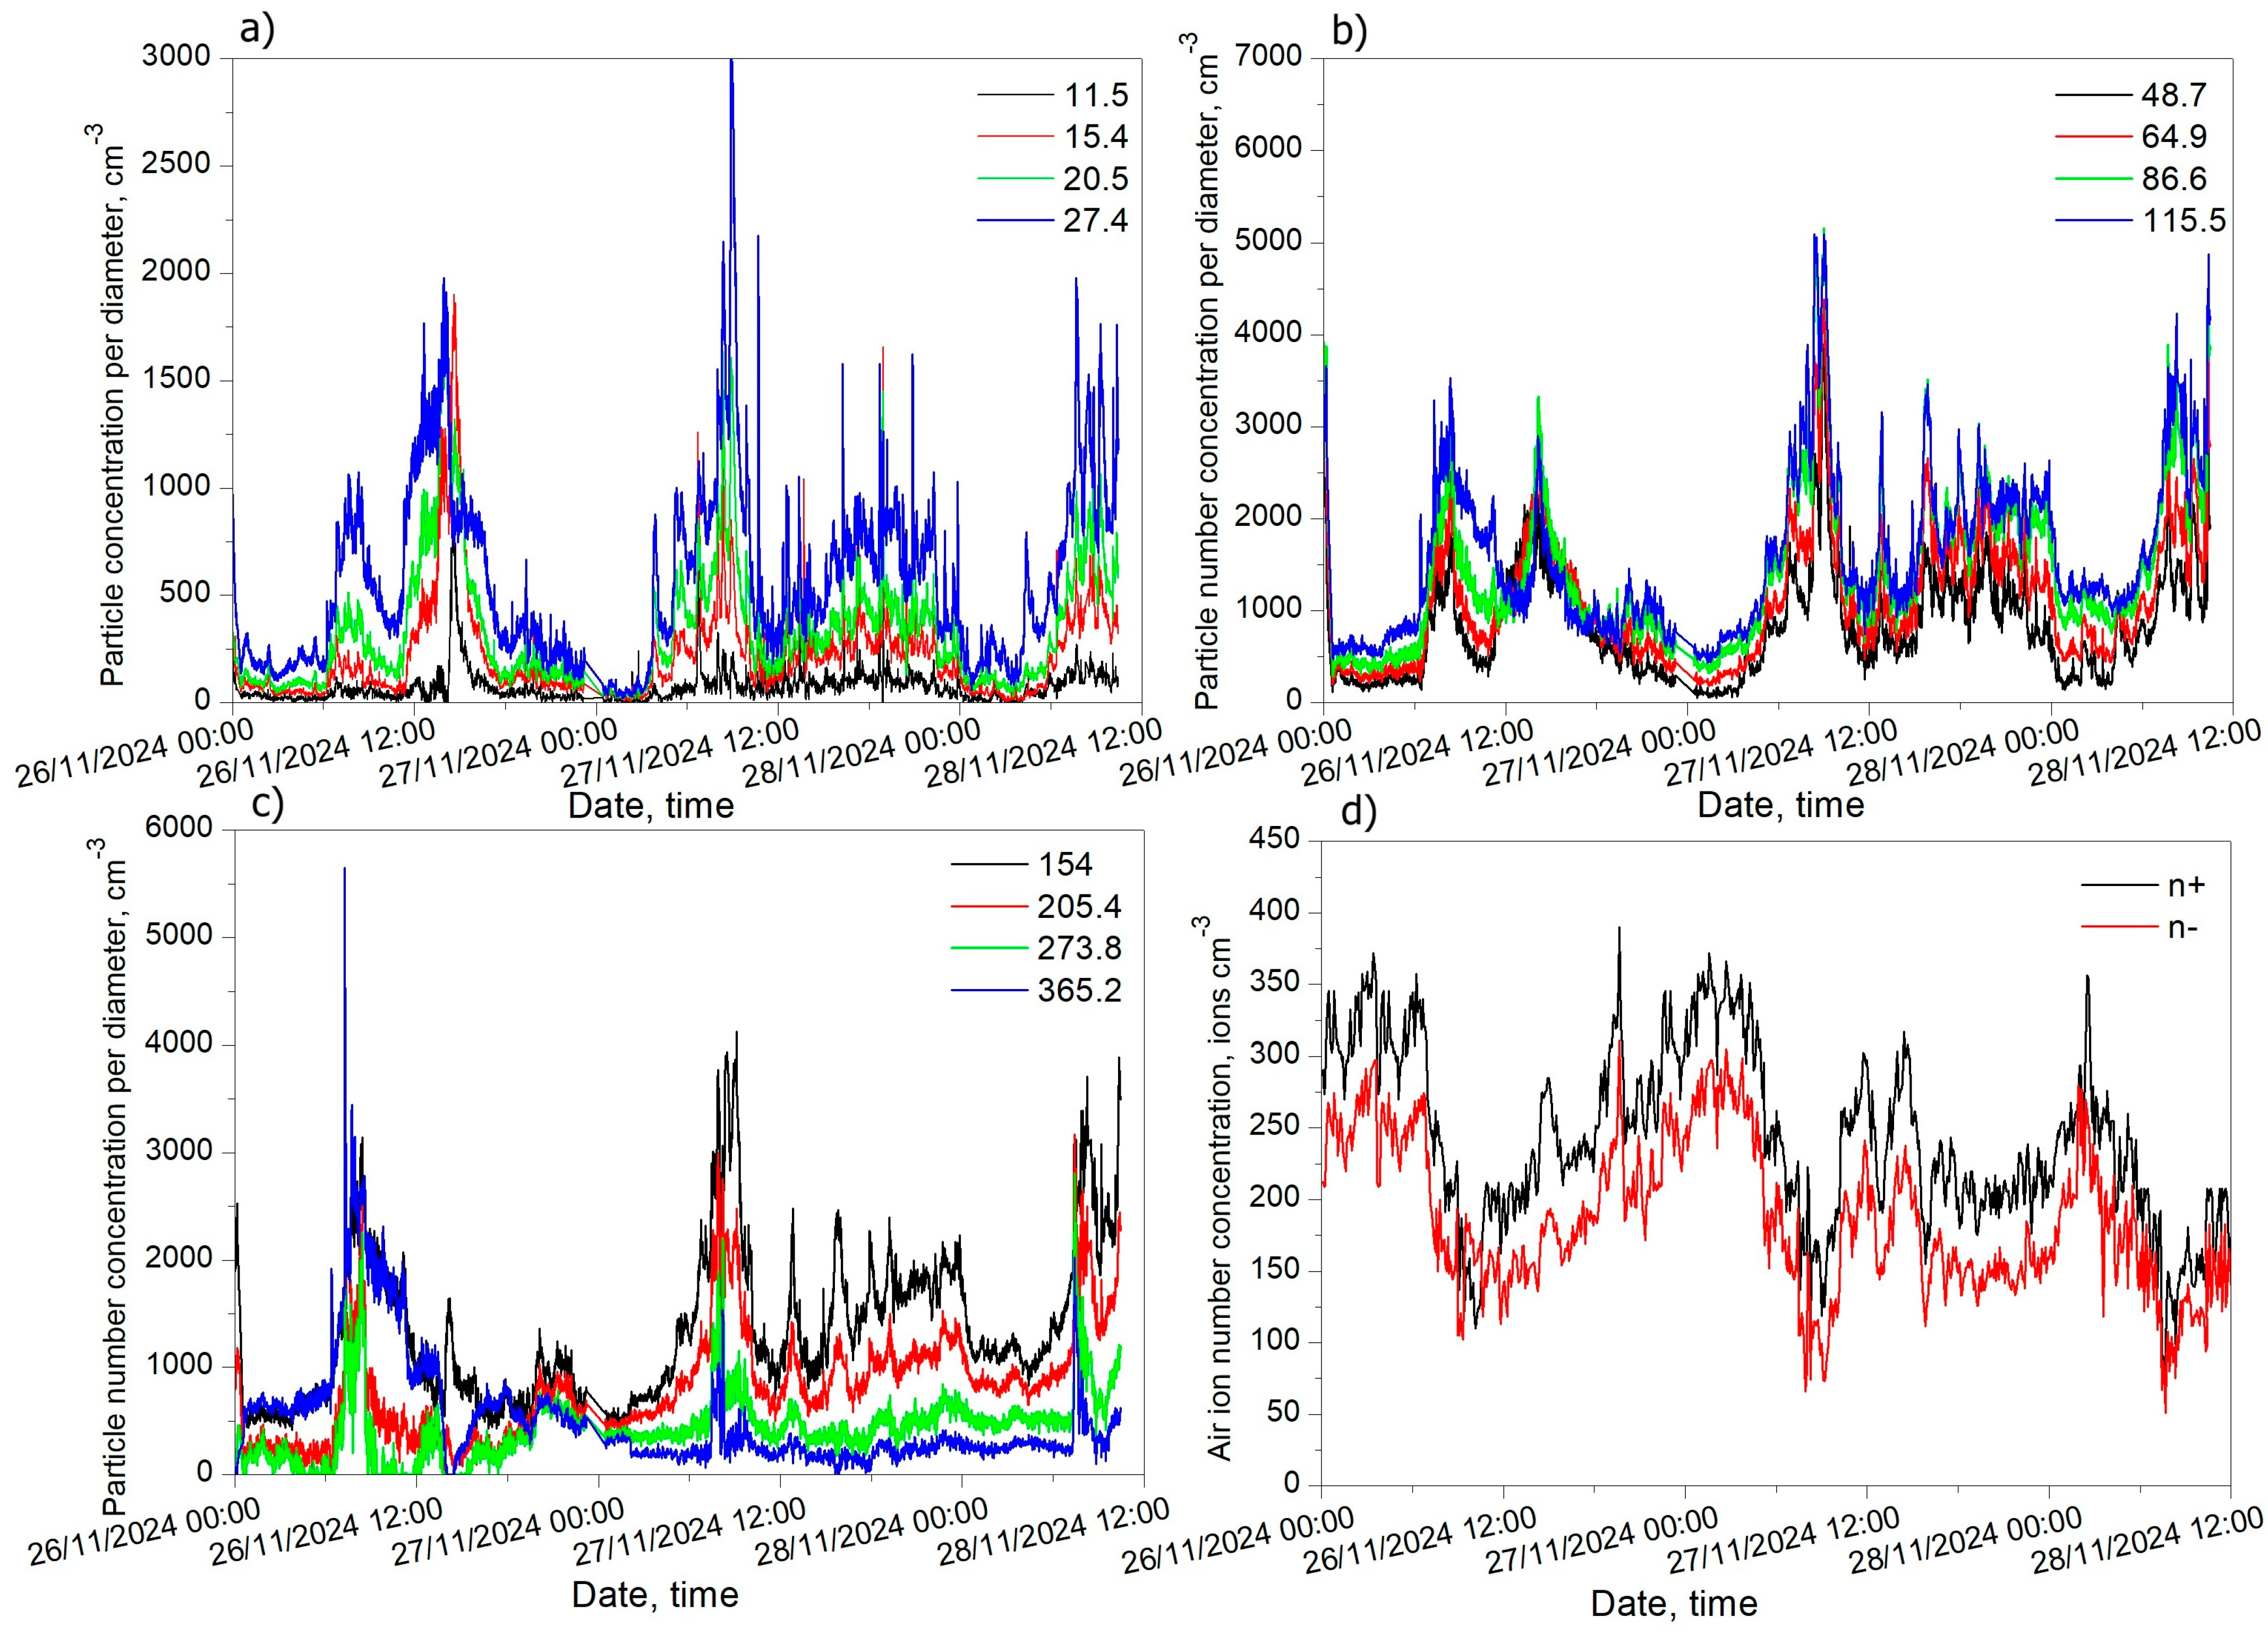
3.5. Nanoparticle Concentration Measured in Highly Polluted Air in the City Canter

Observations over a 48 h period in urban site in the center of Belgrade reveal a pronounced diurnal cycle in aerosol particle number and small air ion concentrations, with a clear inverse relationship between these variables (Figure 5a–d) [14,39]. Given that the diurnal radon concentration remained relatively stable during the observed period, it can be inferred that the ion pair production (Figure 5d) resulting from the radioactive decay of radon was also relatively constant. During the morning hours (starting around 6:00 a.m.), residential heating systems burning slag or low-quality coal, combined with rush-hour traffic emissions (beginning around 7:30 a.m.) and a shallow atmospheric boundary layer, lead to a sharp increase in particle number concentration. Consequently, the concentration of small air ions decreases to a minimum due to their attachment to the abundant aerosol particles [38,40]. As convective mixing intensifies, the boundary layer expands and dilutes particulate pollution into higher layers of the atmosphere, leading to reduced particle concentrations at near ground layer and a corresponding afternoon increase in small air ion concentration because fewer aerosol surfaces remain to scavenge ions. This inverse correlation persists throughout the evening and night, illustrating that higher aerosol concentrations deplete small air ion populations via enhanced recombination (less likely) and ion to aerosol attachment processes.
In the late afternoon and evening, a second smaller particle number peak occurs (27 November 2024), driven also by the evening rush-hour traffic and residential heating emissions and the formation of a stable nocturnal boundary layer that traps pollutants near the surface; this, again, coincides with a small air ion concentration minimum due to enhanced ion and aerosol interactions. As the night progresses beyond the evening peak, traffic-related particle emissions decrease and consequently aerosol concentrations also, which allows small air ion levels to gradually recover. The highest small air ion concentrations typically occur in the pre-dawn hours due to ionization originating from radon decay accumulated under the nighttime inversion [44,45,46]. These observations illustrate that boundary-layer dynamics and local anthropogenic emissions jointly regulate the timing of particle concentration peaks (accompanied by simultaneous ion minima) and the occurrence of small air ion maxima during periods of low particulate levels, thereby demonstrating the crucial interplay between atmospheric mixing and particle and ion interactions.

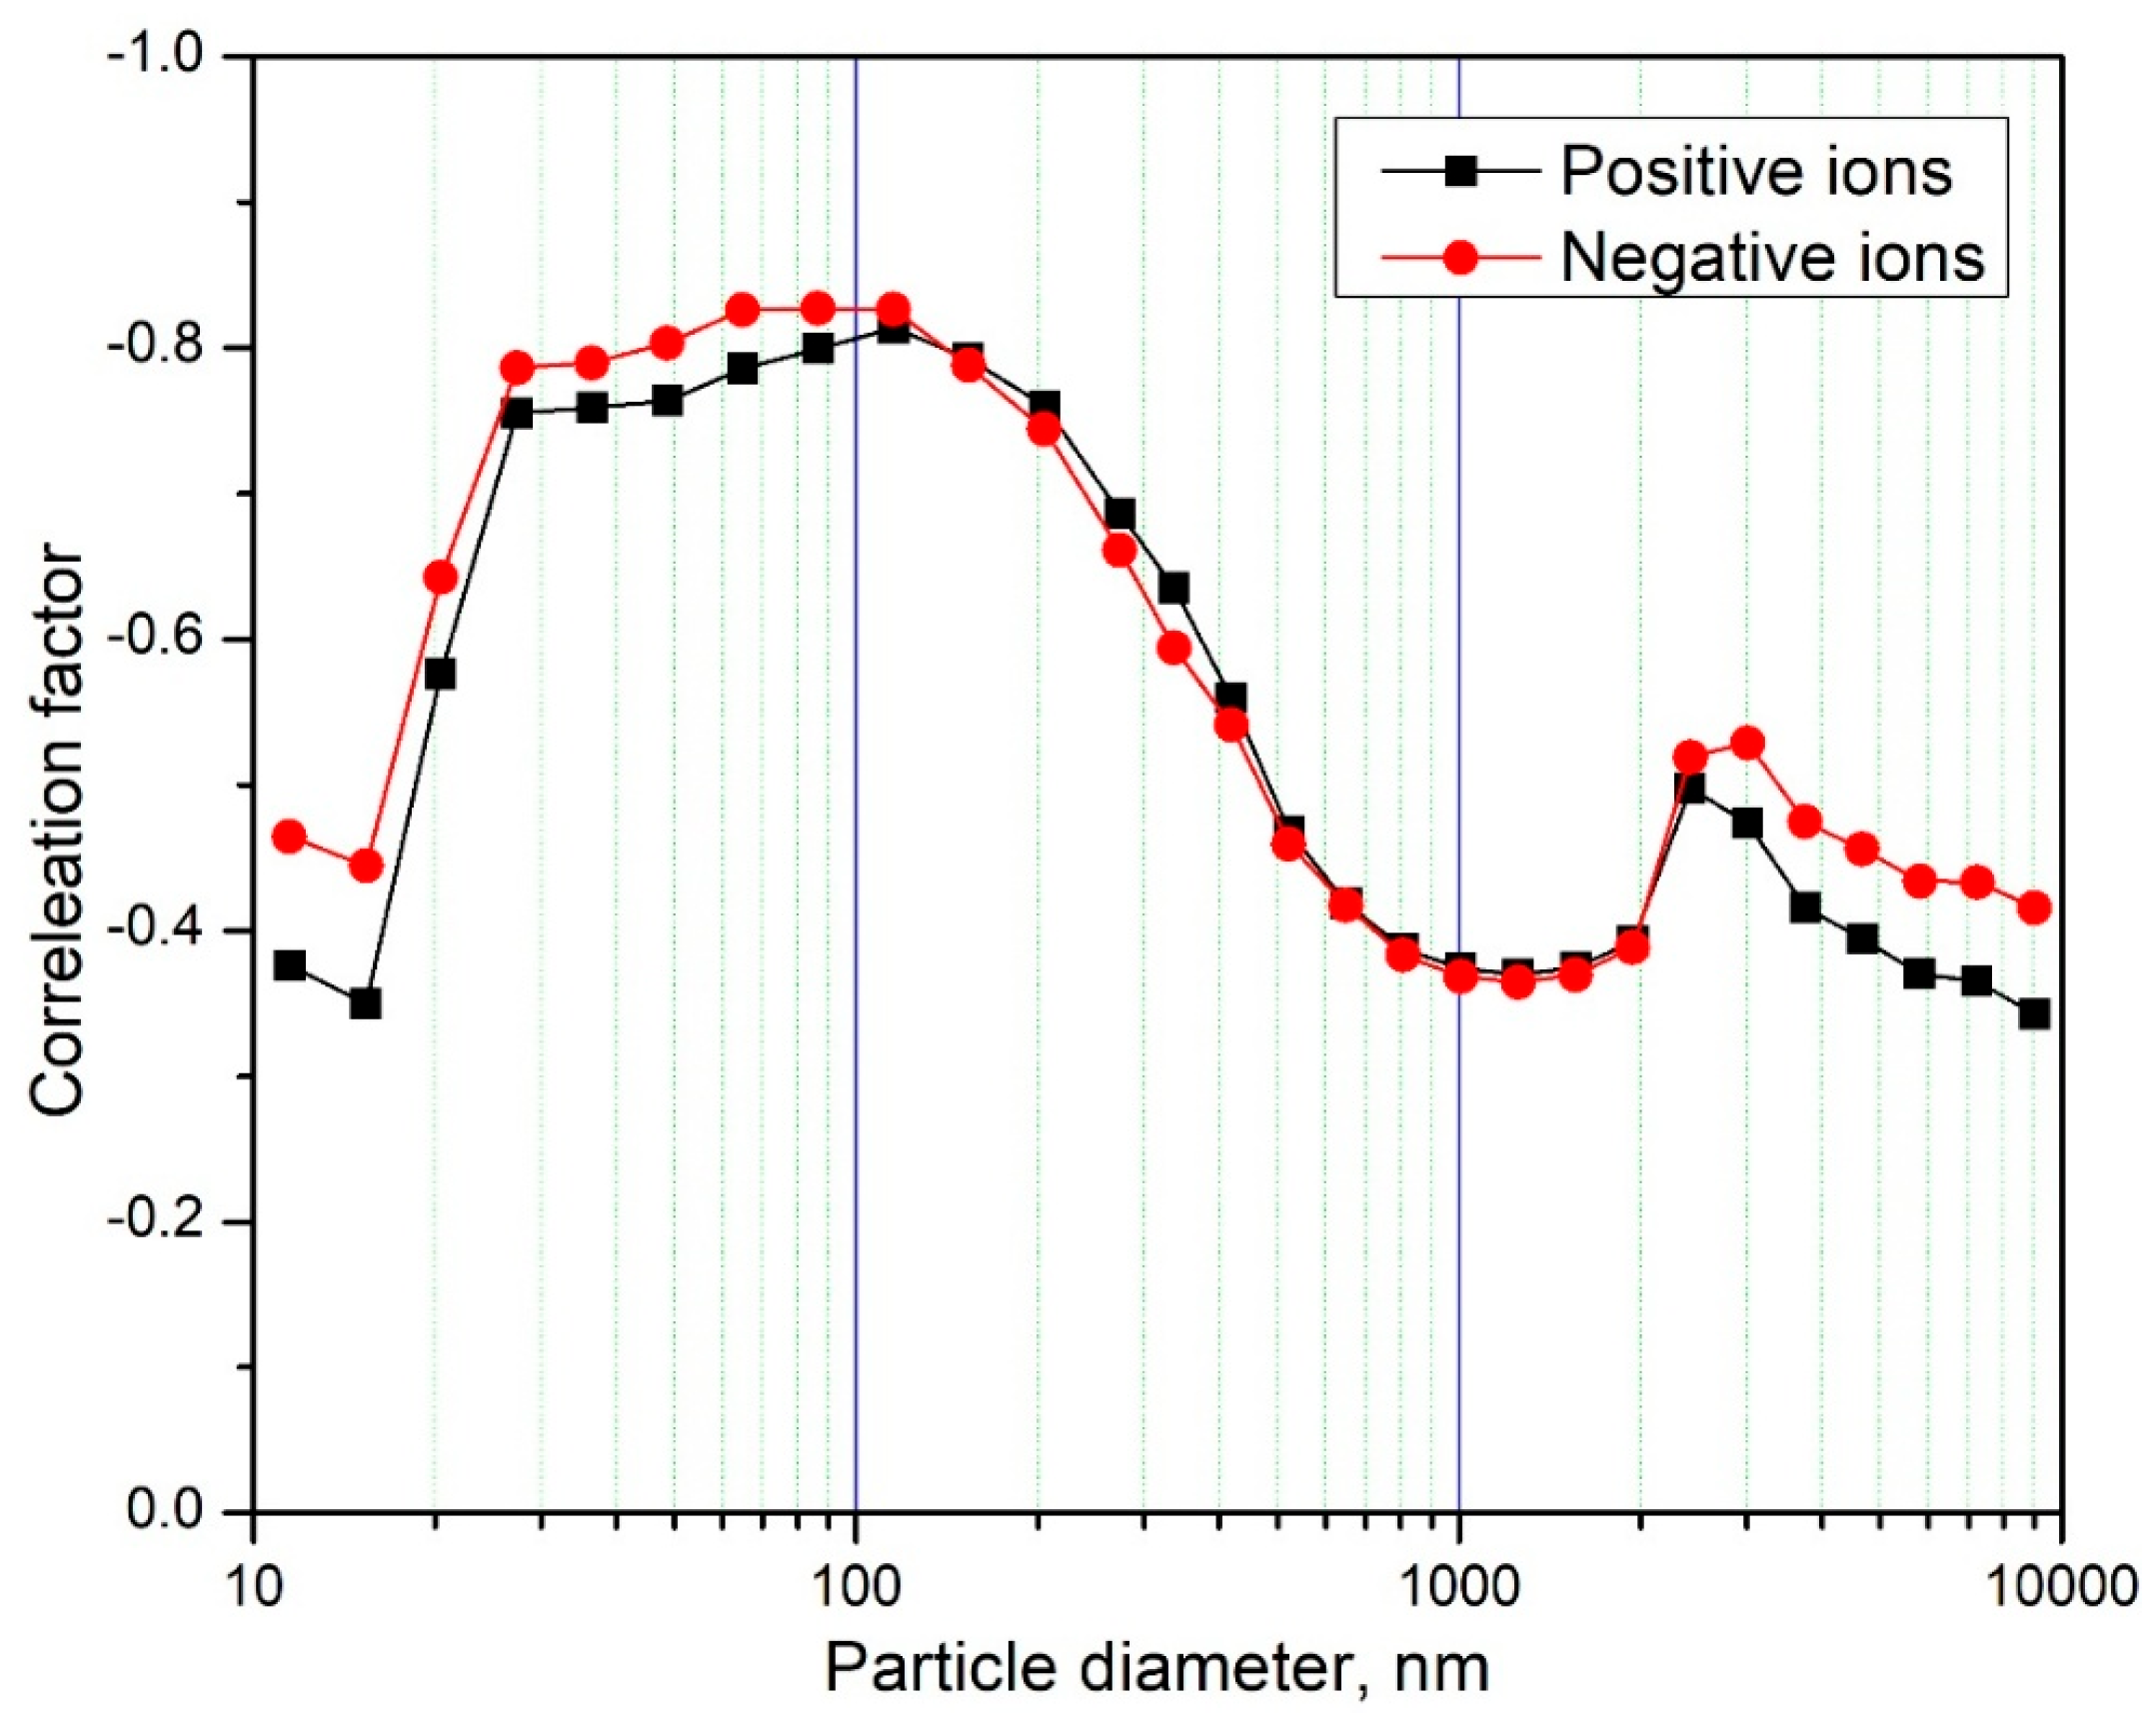
3.6. Correlation Coefficient Between Air Ion Concentration and Particle Concentration by Diameter

A strong negative correlation (r < −0.5) was observed between small air ion concentrations and particle number concentrations in the 20–300 nm range, particularly for UFPs (<100 nm) (Figure 6). This is primarily attributed to the efficient ion scavenging by these particles due to their high collective surface area [18,47,48]. It can be concluded that in polluted urban environments, particles in the 20–300 nm size range, that belongs to Aitken mode and the lower end of the accumulation mode, dominate the condensation sink, resulting in accelerated ion scavenging and significantly reduced steady-state concentrations of small air ions [18]. Transient events such as vehicular traffic, low-grade coal combustion, or nucleation bursts can cause sharp increases in number concentration of particles smaller than 300 nm, further intensifying ion attachment losses during such episodes [18,48]. In contrast, larger particles belonging to the accumulation mode size range (300–1000 nm) and coarse mode particles (>1000 nm) showing weaker or negligible correlations with small air ion levels due to their relatively low and stable number concentrations (Figure 6) [10]. Although individual coarse particles have larger surfaces, their low abundance means they contribute minimally to the total ion sink compared to 20–300 nm size range particles [49]. Moreover, abovementioned range undergo rapid temporal variability linked to local sources, while larger particles typically originate from regional or aged aerosols and thus vary on longer timescales, excluding them from ion dynamics [47,50]. Empirical studies support this size-dependent pattern, with the strongest anticorrelation between ions and particles observed in the nucleation and Aitken modes, diminishing across the accumulation and coarse size ranges [48] ion variability, so the correlation there is weaker.

4. Conclusions

In early autumn at a suburban site and late autumn at an urban site in the center of Belgrade, distinct temporal patterns were observed in radon, small air ions, particle concentrations, T, and RH. Alpha particles from radon decay were identified as the dominant source of near-ground atmospheric ionization, as evidenced by a strong positive correlation between radon and small ion concentrations [41,51]. During early autumn measurements, small ion concentrations closely followed radon levels and exhibited a strong correlation, confirming that radon is a primary contributor to near-ground atmospheric ionization, particularly under stable meteorological conditions. Conversely, small ion levels exhibited a clear strong inverse correlation with particles in the 20–300 nm size range that belongs to Aitken mode and the lower end of the accumulation mode, indicating that elevated aerosol loads act as an efficient sink for ions through ion to aerosol attachment and ion recombination processes. Particles in the 20–300 nm size range dominate the ion scavenging process, so ion–particle anticorrelation is strongest at those sizes. As particle size increases, the impact on ion concentrations per particle decreases and the correlation correspondingly weakens; as a result, accumulation mode and coarse particles showed weak or negligible correlations, consistent with their relatively low and stable number concentrations. This inverse small air ion–particle relationship was especially pronounced at the urban site, where increased aerosol concentrations coincided with significantly lower small ion levels compared to the suburban environment. At the suburban site, dry soil conditions and stable nocturnal boundary layers with high RH were observed to coincide with increased radon exhalation and nighttime accumulation of small ions. In contrast, the urban location experienced reduced radon release due to higher soil moisture, along with enhanced ion scavenging from higher particle concentrations [52]. Atmospheric stability emerged as an important factor influencing air ion behavior during the measurement period, with stable conditions promoting radon and ion accumulation, more prominently in the suburban than in the urban setting. While these findings are limited to the specific measurement conditions at each location, they support the hypothesis that radon exhalation, atmospheric mixing, and particle pollution act as key controls on small ion concentrations. Further multi-seasonal and multi-site studies are needed to confirm the consistency and generalizability of these relationships.

Author Contributions

Conceptualization, P.K., F.S. and A.J.; methodology, P.K.; validation, I.Č.; formal analysis, F.S., I.Č. and M.Ć.; investigation, F.S., P.K., I.Č. and M.Ć.; writing—original draft, F.S. and P.K.; writing—review and editing, F.S., P.K., I.Č. and A.J.; supervision, A.J. All authors have read and agreed to the published version of the manuscript.

Funding

This work was financially supported by the Ministry of Science, Technological Development, and Innovation of the Republic of Serbia through Contract No. 451-03-136/2025-03/200017 and 451-03-137/2025-03/200135. The authors acknowledge funding provided by the Institute of Physics Belgrade, Serbia. This work was also supported by the Science Fund of the Republic of Serbia, the Green program of cooperation between science and industry, grant no. 5661. Any opinions, findings, conclusions, or recommendations expressed in this material are those of the authors and do not necessarily reflect the views of the funder.

Institutional Review Board Statement

Not applicable.

Informed Consent Statement

Not applicable.

Data Availability Statement

The original contributions presented in this study are included in the article. Further inquiries can be directed to the corresponding author.

Conflicts of Interest

The authors declare no conflicts of interest.

References

  1. Jiang, S.Y.; Ma, A.; Ramachandran, S. Negative Air Ions and Their Effects on Human Health and Air Quality Improvement. Int. J. Mol. Sci. 2018, 19, 2966. [Google Scholar] [CrossRef]
  2. Majić, M. Sale and Combustion of Tailings as Coal Blamed for Increased Air Pollution in Serbia. Balkan Green Energy News. 2022. Available online: https://balkangreenenergynews.com (accessed on 24 June 2025).
  3. Ling, X.; Jayaratne, R.; Morawska, L. The relationship between airborne small ions and particles in urban environments. Atmos. Environ. 2013, 79, 1–6. [Google Scholar] [CrossRef]
  4. Hartmann, A.; Kriegel, M. The influence of air ions on the particle concentration in indoor environments—A systematic literature review. Results Eng. 2022, 15, 100528. [Google Scholar] [CrossRef]
  5. Kukolj, S.; Stauffer, A.; Matković, V.; Zander, E. The Health Harm of Air Pollution in Belgrade; Health and Environment Alliance (HEAL): Brussels, Belgium, 2019. [Google Scholar]
  6. World Health Organization. WHO Global Air Quality Guidelines: Particulate Matter (PM2.5 and PM10), Ozone, Nitrogen Dioxide, Sulfur Dioxide and Carbon Monoxide; WHO: Geneva, Switzerland, 2021. [Google Scholar]
  7. Stojanovska, Z.; Boev, B.; Zunic, Z.S.; Ivanova, K.; Ristova, M.; Tsenova, M.; Stojanovska, M. Variation of indoor radon concentration and ambient dose equivalent rate in different outdoor and indoor environments. Radiat. Environ. Biophys. 2016, 55, 171–183. [Google Scholar] [CrossRef]
  8. United Nations Scientific Committee on the Effects of Atomic Radiation (UNSCEAR). Sources, Effects and Risks of Ionizing Radiation: Report to the General Assembly, with Scientific Annexes; UNSCEAR: New York, NY, USA, 2016. [Google Scholar]
  9. International Commission on Radiological Protection (ICRP). Lung cancer risk from radon and progeny and statement on radon. ICRP Publication 115. Ann. ICRP 2010, 40, 1–64. [Google Scholar] [CrossRef]
  10. Hirsikko, A.; Nieminen, T.; Gagné, S.; Lehtipalo, K.; Manninen, H.E.; Ehn, M.; Hõrrak, U.; Kerminen, V.-M.; Laakso, L.; McMurry, P.H.; et al. Atmospheric ions and nucleation: A review of observations. Atmos. Chem. Phys. 2011, 11, 767–798. [Google Scholar]
  11. Hoppel, W.A.; Anderson, R.V.; Willett, J.C. Atmospheric Electricity and the Earth’s Environment; Naval Research Laboratory Report 8964; The National Academies Press: Washington, DC, USA, 1986. [Google Scholar]
  12. Jiang, K.; Pan, Z.; Pan, F.; Teuling, A.J.; Han, G.; An, P.; Chen, X.; Wang, J.; Song, Y.; Cheng, L.; et al. Combined influence of soil moisture and atmospheric humidity on land surface temperature under different climatic background. iScience 2023, 26, 106837. [Google Scholar] [CrossRef]
  13. Bethesda, MD: National Council on Radiation Protection and Measurements (NCRP). Measurement of Radon and Radon Daughters in Air; NCRP Report No. 97; National Council on Radiation Protection and Measurements: Bethesda, MD, USA, 1988. [Google Scholar]
  14. Israel, H. Atmospheric Electricity; Israel Program for Scientific Translations: Jerusalem, Israel, 1970; Volume 2. [Google Scholar]
  15. Harrison, R.G.; Carslaw, K.S. Ion-aerosol-cloud processes in the lower atmosphere. Rev. Geophys. 2003, 41, 1012. [Google Scholar] [CrossRef]
  16. Seinfeld, J.H.; Pandis, S.N. Atmospheric Chemistry and Physics: From Air Pollution to Climate Change, 2nd ed.; Wiley-Interscience: Hoboken, NJ, USA, 2006. [Google Scholar]
  17. McMurry, P.H. A review of atmospheric aerosol measurements. Atmos. Environ. 1999, 34, 1959–1999. [Google Scholar] [CrossRef]
  18. Kulmala, M.; Vehkamäki, H.T.K.; Petäjä, T.; Dal Maso, M.; Lauri, A.; Kerminen, V.-M.; Birmili, W.; McMurry, P.H. Formation and growth rates of ultrafine atmospheric particles: A review of observations. J. Aerosol Sci. 2004, 35, 143–176. [Google Scholar] [CrossRef]
  19. Nel, A.; Xia, T.; Mädler, L.; Li, N. Toxic potential of materials at the nanolevel. Science 2006, 311, 622–627. [Google Scholar] [CrossRef] [PubMed]
  20. Schraufnagel, D. The health effects of ultrafine particles. Exp. Mol. Med. 2020, 52, 311–317. [Google Scholar] [CrossRef] [PubMed]
  21. Schulz, H.; Harder, V.; Ibald-Mulli, A.; Khandoga, A.; Koenig, W.; Krombach, F.; Radykewicz, R.; Stampfl, A.; Thorand, B.; Peters, A. Cardiovascular effects of fine and ultrafine particles. J. Aerosol Med. 2005, 18, 1–22. [Google Scholar] [CrossRef] [PubMed]
  22. Leikauf, G.D.; Kim, S.H.; Jang, A.S. Mechanisms of ultrafine particle-induced respiratory health effects. Exp. Mol. Med. 2020, 52, 329–337. [Google Scholar] [CrossRef]
  23. Tammet, H. Size and mobility of nanometer particles, clusters and ions. J. Aerosol Sci. 1995, 26, 459–476. [Google Scholar] [CrossRef]
  24. Tammet, H.; Hõrrak, U.; Laakso, L.; Kulmala, M. Factors of air ion balance in a coniferous forest according to measurements in Hyytiälä, Finland. Atmos. Chem. Phys. 2006, 6, 3377–3390. [Google Scholar] [CrossRef]
  25. Laakso, L.; Petäjä, T.; Lehtinen, K.E.J.; Kulmala, M.; Paatero, J.; Hõrrak, U.; Tammet, H.; Joutsensaari, J. Ion production rate in a boreal forest based on ion, particle and radiation measurements. Atmos. Chem. Phys. 2004, 4, 1933–1943. [Google Scholar] [CrossRef]
  26. Hõrrak, U.; Mirme, A.; Salm, J.; Tamm, E.; Tammet, H. Air ion measurements as a source of information about atmospheric aerosols. Atmos. Res. 1998, 46, 233–242. [Google Scholar] [CrossRef]
  27. Harrison, R.G. Atmospheric Electricity and Cloud Microphysics; Springer: Cham, Switzerland, 2023; pp. 15–20. [Google Scholar]
  28. Kolarž, P.; Ilić, A.; Janković, M.; Janićijević, A.; Trbovich, A.M. Estimating aerosol particle removal in indoor air by ion-enhanced deposition. J. Aerosol Sci. 2023, 173, 106199. [Google Scholar] [CrossRef]
  29. Xiao, S.; Wei, T.; Petersen, J.D.; Zhou, J.; Lu, X. Biological effects of negative air ions on human health and integrated multiomics to identify biomarkers: A literature review. Environ. Sci. Pollut. Res. 2023, 30, 69824–69836. [Google Scholar] [CrossRef]
  30. Krueger, A.P.; Reed, E.J. Biological impact of small air ions. Science 1976, 193, 1209–1213. [Google Scholar] [CrossRef] [PubMed]
  31. Kolarž, P.; Miljković, B.; Ćurguz, Z. Air-ion counter and mobility spectrometer. Nucl. Instrum. Methods B 2011, 279, 219–222. [Google Scholar] [CrossRef]
  32. Republic Hydrometeorological Service of Serbia (RHMSS). Seasonal Bulletin for Serbia: Autumn 2024; Division for Climate Monitoring and Climate Forecast: Belgrade, Serbia, 2024. [Google Scholar]
  33. Sesana, L.; Caprioli, E.; Marcazzan, G.M. Long period study of outdoor radon concentration in Milan and correlation with atmospheric dispersion. J. Environ. Radioact. 2003, 65, 147–160. [Google Scholar] [CrossRef]
  34. Porstendörfer, J. Properties and behaviour of radon and thoron and their decay products in the air. J. Aerosol Sci. 1994, 25, 219–263. [Google Scholar] [CrossRef]
  35. Čeliković, I.; Pantelić, G.; Vukanac, I.; Nikolić, J.K.; Živanović, M.; Cinelli, G.; Gruber, V.; Baumann, S.; Ciotoli, G.; Poncela, L.S.Q.; et al. Overview of Radon Flux Characteristics, Measurements, Models and Its Potential Use for the Estimation of Radon Priority Areas. Atmosphere 2022, 13, 2005. [Google Scholar] [CrossRef]
  36. Whiteman, C.D.; Hoch, S.W.; Horel, J.D.; Charland, A. Relationship between particulate air pollution and meteorological variables in Utah’s Salt Lake Valley. Atmos. Environ. 2014, 94, 742–753. [Google Scholar] [CrossRef]
  37. Kumar, K.C.; Kamsali, N. One year of 222Rn concentration at a typical rural site in South India. Radiat. Prot. Environ. 2021, 44, 73–78. [Google Scholar] [CrossRef]
  38. Stranden, E.; Kolstad, A.K.; Lind, B. The influence of moisture and temperature on radon exhalation. Radiat. Prot. Dosim. 1984, 7, 55–58. [Google Scholar] [CrossRef]
  39. Rahman, S.; Matiullah Ghauri, B. Effect of moisture on the radon exhalation rate from soil, sand and brick samples. Radiat. Prot. Dosim. 2008, 130, 172–177. [Google Scholar] [CrossRef]
  40. Kolarž, P.; Ćurguz, Z. Air ions as indicators of short-term indoor radon variations. Appl. Radiat. Isot. 2015, 99, 179–185. [Google Scholar] [CrossRef]
  41. Kolarž, P.M.; Filipović, D.M.; Marinković, B.P. Daily variations of indoor air-ion and radon concentrations. Appl. Radiat. Isot. 2009, 67, 2062–2067. [Google Scholar] [CrossRef] [PubMed]
  42. Tiitta, P.; Miettinen, P.; Vaattovaara, P.; Laaksonen, A.; Joutsensaari, J.; Hirsikko, A.; Aalto, P.; Kulmala, M. Road-side measurement of aerosol and ion number size distributions. Boreal Environ. Res. 2007, 12, 311–321. [Google Scholar]
  43. Yang, J.; Busen, H.; Scherb, H.; Hürkamp, K.; Guo, Q.; Tschiersch, J. Modeling of radon exhalation from soil influenced by environmental parameters. Sci. Total Environ. 2019, 656, 1304–1311. [Google Scholar] [CrossRef]
  44. Čeliković, I.; Pantelić, G.; Vukanac, I.; Krneta Nikolić, J.; Živanović, M.; Cinelli, G.; Gruber, V.; Baumann, S.; Quindos Poncela, L.S.; Rabago, D. Outdoor radon as a tool to estimate radon priority areas: A literature overview. Int. J. Environ. Res. Public Health 2022, 19, 662. [Google Scholar] [CrossRef]
  45. Hõrrak, U.; Salm, J.; Tammet, H. Diurnal variation in the concentration of air ions and aerosol particles. J. Geophys. Res. 2000, 105, 9291–9302. [Google Scholar] [CrossRef]
  46. Dos Santos, V.N.; Herrmann, E.; Manninen, H.E.; Hussein, T.; Hakala, J.; Nieminen, T.; Aalto, P.P.; Merkel, M.; Wiedensohler, A.; Kulmala, M.; et al. Variability of air ion concentrations in urban Paris. Atmos. Chem. Phys. 2015, 15, 13717–13737. [Google Scholar] [CrossRef]
  47. Rowell, A.; Brean, J.; Beddows, D.C.S.; Shi, Z.; Kumar, A.; Rissanen, M.; Dal Maso, M.; Mettke, P.; Weinhold, K.; Merkel, M.; et al. The behaviour of charged particles (ions) during new particle formation events in urban Leipzig, Germany. Atmos. Chem. Phys. 2024, 24, 10349–10361. [Google Scholar] [CrossRef]
  48. Cheung, H.C.; Chou, C.C.K.; Jayaratne, E.R.; Morawska, L. Impact of particle formation on atmospheric ions and particle number concentrations in an urban environment. Atmos. Res. 2015, 157, 127–136. [Google Scholar] [CrossRef]
  49. Harrison, R.M. Urban atmospheric chemistry: A review of current understanding. Environ. Pollut. 2000, 110, 3–25. [Google Scholar]
  50. Weber, R.J.; McMurry, P.H.; Mauldin, R.L.; Tanner, D.J.; Eisele, F.L.; Clarke, A.D.; Kapustin, V.N. New particle formation in the remote troposphere: A comparison of observations at various sites. Geophys. Res. Lett. 1999, 26, 307–310. [Google Scholar] [CrossRef]
  51. Graeffe, G.; Keskinen, J.; Lehtimäki, M. Small ion concentration in houses with enhanced radon concentration. Environ. Int. 1989, 15, 309–313. [Google Scholar] [CrossRef]
  52. Akinloye, M.K.; Olomo, J.B.; Oladapo, O. Effect of soil moisture on radon exhalation rate from soils. Radiat. Prot. Dosim. 2020, 190, 152–159. [Google Scholar]
Figure 1. Air temperature (a) and relative humidity (b) variations measured during early autumn (black curves) and late autumn (red curves), over a 4-day period.
Atmosphere 16 00808 g001
Figure 2. The Air Quality Index provided by IQair platform measured at both locations indicates air pollution levels during early (black curve) and late autumn (red curve).
Atmosphere 16 00808 g002
Figure 3. Radon hourly concentrations measured at both sites during early (black curve) and late autumn (red curve).
Atmosphere 16 00808 g003
Figure 4. Small air ion concentrations measured at both sites during early (black curve) and late autumn (red curve).
Atmosphere 16 00808 g004
Figure 5. Temporal variation in particle number concentrations in four selected ultrafine size bins (ac) and small air ion concentrations of both polarities (d) measured at the urban site during the late autumn.
Atmosphere 16 00808 g005
Figure 6. Correlation factor between air ion concentration and particle number concentration by diameter (10 nm-10 µm).
Atmosphere 16 00808 g006
Disclaimer/Publisher’s Note: The statements, opinions and data contained in all publications are solely those of the individual author(s) and contributor(s) and not of MDPI and/or the editor(s). MDPI and/or the editor(s) disclaim responsibility for any injury to people or property resulting from any ideas, methods, instructions or products referred to in the content.

