Article

Mapping Solar Future Perspectives of a Climate Change Hotspot: An In-Depth Study of Greece’s Regional Solar Energy Potential, Climatic Trends Influences and Insights for Sustainable Development

by
Stavros Vigkos
and
Panagiotis G. Kosmopoulos
*
Institute for Environmental Research and Sustainable Development, National Observatory of Athens (IERSD/NOA), 15236 Athens, Greece
*
Author to whom correspondence should be addressed.
Atmosphere 2025, 16(7), 762; https://doi.org/10.3390/atmos16070762 (registering DOI)
Submission received: 25 April 2025 / Revised: 6 June 2025 / Accepted: 19 June 2025 / Published: 21 June 2025

Abstract

:
This study addresses the influence of clouds and aerosols on solar radiation and energy over Greece from September 2004 to August 2024. By leveraging Earth Observation data and radiative transfer models, the largest to date time series was constructed, in order to investigate the fluctuations in global horizontal irradiance, its rate of change, and the natural and anthropogenic factors that drive them. By incorporating simulation tools and appropriate calibration, the solar potential per region and the rate of change of the produced photovoltaic energy for 1 kWp were also quantified, highlighting the climatic effects on the production of solar energy. Additionally, two energy planning scenarios were explored: the first regarding the energy adequacy that each region can achieve, if a surface equal to 1% of its total area is covered with photovoltaics; and the latter estimating the necessary area covered with photovoltaics to fully meet each region’s energy demand. Finally, to ensure a solid and holistic approach, the research converted energy data into economic gains and avoided CO2 emissions. The study is innovative, particularly for the Greek standards, in terms of the volume and type of information it provides. It is able to offer stakeholders and decision and policymakers, both in Greece and worldwide thanks to the use of open access data, invaluable insights regarding the impact of climate change on photovoltaic energy production, the optimization of photovoltaic installations and investments and the resulting financial and environmental benefits from proper and methodical energy planning.

1. Introduction

Climate change is a multidimensional process that bears a substantial influence on a variety of atmospheric parameters interacting with sunlight. These interactions are critical to the efficiency and feasibility of solar energy generation, particularly photovoltaics (PV). One of the key meteorological characteristics impacted by climate change is global horizontal irradiance (GHI), which is regulated by cloud cover, aerosol concentration, and atmospheric water vapor levels. These variations can either increase or decrease the quantity of solar radiation reaching the Earth’s surface, influencing the PV systems’ energy generation. For example, higher cloud cover can reflect more sunlight back into space, lowering the amount of energy accessible to solar systems. The phenomena of global dimming and brightening (GDB) highlight the complicated link between climate change and greenhouse gases (GHGs). During periods of global dimming, higher aerosol concentrations from anthropogenic activities diminish GHI, whereas global brightening phases, marked by cleaner atmospheres, raise GHI [1]. These oscillations have a direct impact on PV energy generation. Fluctuations in aerosol concentrations have a considerable influence on global horizontal irradiance (GHI) levels, which in turn affect solar energy output [2]. Additionally, changes in cloud cover and aerosol optical depth can cause significant fluctuations in GHI, leading to reductions in solar power output [3]. Moreover, it has been concluded that a mitigation scenario might enhance photovoltaic (PV) potential by around 5% due to lower cloud cover and higher clear-sky radiation [4]. In contrast, scenarios with a stronger reliance on fossil fuels may experience a drop in clear-sky radiation—though this may be offset by decreases in cloud cover, resulting in an overall gain in all-sky radiation. Understanding these processes is increasingly important for maximizing renewable energy resources and ensuring sustainable energy production as the global climate changes.
Geo-observation technology advancements have transformed our capacity to track and evaluate atmospheric factors over lengthy periods of time. Satellite-based remote sensing, ground-based observational networks, and modern climate models all provide large datasets that allow for extensive investigation of atmospheric factors such as GHI, cloud cover, and aerosol concentration. These technologies enable continuous monitoring of these parameters, allowing for a more complete knowledge of their temporal and geographical fluctuations. For example, monitoring aerosol optical depth and its influence on GHI has relied heavily on satellite data from equipment such as MODIS (Moderate Resolution Imaging Spectroradiometer). Long-term datasets generated from these geo-observation techniques are particularly valuable for assessing the effects of climate change on PV energy generation, as researchers analyze historical and projected data to identify trends that inform the design and optimization of PV systems [5]. These strategies empower scientists to analyze patterns and make precise forecasts regarding future PV system performance.
Following 921 MW of new installations in the first half of 2024, the Greek solar power sector installed 337 MW in July, the country’s best month ever. With the new power plants, Greece’s total renewable energy system (RES) installed capacity increased to 13.47 GW, with solar power accounting for 7.57 GW. Overall, Greece deployed 2.6 GW of solar in 2024, bringing its cumulative installed PV capacity to 9.6 GW by the end of December [6]. It should be mentioned that the latest draft of Greece’s National Energy and Climate Plan (NECP) anticipates 13.5 GW of photovoltaics by 2030 [7,8]. Located in the Mediterranean area, the country experiences climate fluctuation caused by both natural and manmade sources. The region receives significant sun irradiation, making it an excellent site for PV energy generation. However, climate change presents a threat to this potential. According to studies, Greece has undergone both global dimming and brightening periods, which impact the constancy of solar energy [9,10]. Increased temperatures and precipitation patterns have an impact on cloud cover and aerosol concentrations, which in turn affect solar radiation levels. Climate change is expected to have an impact on Greece’s PV potential, with GHI changes causing differences in PV output. Some scenarios predict that PV output might rise, emphasizing the significance of adaptive solutions for maximizing solar energy generation in the face of changing meteorological circumstances [11].
Modern geophysical technologies are widely employed in Greece to monitor atmospheric characteristics. GHI, cloud cover, and aerosol concentrations are tracked using satellite data, ground observations, and climate models. The National Observatory of Athens uses all of this to track changes in solar radiation and other atmospheric factors. Satellite-based data, for example, are used to construct precise solar radiation maps, which are critical for appraising Greece’s solar energy potential in various places. These efforts are aided by worldwide cooperation and data-sharing initiatives, which improve the precision and reliability of climate assessments. These tools give useful data for improving PV system performance and planning future deployments.
To summarize, Greece’s solar energy business is growing, owing to high solar insolation and significant government assistance, and the country is well on its way to becoming a solar energy leader in the EU. The purpose of this ground-breaking study is to eventually contribute to and assist substantially in decision- and policy-making by providing invaluable insights about climate and PV power generation nationwide.
In today’s era of big data and rapid computation, simulation methodologies must keep pace with ever-increasing demands for resolution and speed. While conventional frameworks—such as widely used tools like libRadtran—often struggle with extensive computation times and unwieldy data volumes, our approach leverages the innovative fast radiative transfer model (FRTM) [12] to dramatically reduce processing durations from months to mere minutes while efficiently managing massive simulation datasets. However, the true breakthrough of our study is not solely this computational acceleration. We have assembled and exploited the largest continuous satellite-based database for Greece, spanning a full 20-year period; to our knowledge, this is the first fully observational dataset of its kind for the region. Unlike previous studies that primarily rely on hypothetical models, our work is grounded in extensive, observational data. This unprecedented compilation enables us to construct a robust regional climatology and capture long-term trends in global horizontal irradiance driven by both natural variability and anthropogenic influences. This unique dataset not only offers unprecedented insights into natural fluctuations and regional variability in solar radiation but also enables a more reliable assessment of the climatic impacts on solar energy production. Furthermore, by translating our findings into tangible societal benefits—quantifying solar potential, economic gains, CO2 emission savings, and refined energy planning benchmarks—our research bridges the gap between environmental science and policy-making and between advanced environmental simulations and pragmatic energy planning. In doing so, it provides stakeholders and decision-makers with actionable insights to optimize photovoltaic installations, information that can guide investments in PV technology and foster sustainable energy strategies, thereby advancing both geospatial modeling and environmentally informed policy-making.
Following this introduction, Section 2 outlines our methodology by detailing the data sources, the fast radiative transfer model (FRTM), and our approach to metadata processing and visualization. Section 3 presents our results through three interrelated subsections. In Section 3.1, we introduce the most up-to-date PV power potential map of Greece. Section 3.2 then delves into the 20-year evolution of global horizontal irradiance (GHI) across Greek regions, revealing monthly trends and spatial distributions that capture the dynamic nature of solar irradiance. Section 3.3 connects these solar resource insights to observed PV production fluctuations by examining annual trends, economic implications (monetary equivalents), and environmental impacts. In Section 4, we discuss these findings in the context of existing literature, highlighting the methodological novelties and the study’s broader implications, while the concluding remarks are provided in Section 5. Moreover, Appendix A supplements our findings by offering a detailed estimation of per-1 kWp metrics. Here, Table A1 summarizes the 20-year average solar resource metrics (PV output, GHI in both W/m2 and kWh/m2, and annual energy errors under clear-sky and all-sky conditions), and Table A2 presents the corresponding 20-year average revenue and CO2 emissions-related uncertainty metrics—thereby reinforcing the robustness of our overall assessment. Finally, Appendix B offers further description and explanation on the multi-layer radiative transfer in cloud atmospheres, while Appendix C deals with the limitations and refinement of the PVGIS calibration utilized.

2. Materials and Methods

2.1. Data Sources

Earth Observation data of spatial resolution of 3 km and temporal resolution of 15 min were exploited in order to quantify the climatological levels of the solar energy potential and atmospheric parameter effects. Although the sensor’s nominal resolution is 3 km, analyses of MSG-SEVIRI imagery over Greece have shown that the effective spatial resolution demonstrates an average representative resolution of roughly 4.5 km—due to variations in the off-nadir viewing geometry [13,14]. Satellite data provide extensive spatial coverage, making them ideal for assessing solar potential across large areas, including remote and inaccessible regions. Moreover, satellites offer consistent and regular observations, which are crucial for long-term monitoring and analysis, while frequent satellite passes allow for high temporal resolution, effectively capturing temporal changes in solar irradiance.
The Copernicus Atmosphere Monitoring Service (CAMS) [15,16,17] was also employed, with a total aerosol optical depth (AOD) of 550 nm, to examine the aerosol influence on solar energy generation. CAMS is based on the reanalysis technique and its aerosol type categorization identifier, known as Monitoring Atmospheric Composition and Climate (MACC) [18]. In terms of cloud influence on solar energy, Meteosat Second Generation (MSG) data were employed, expediting the development of real-time image processing tools. Using such Earth Observation methods, insights about a variety of meteorological variables can be obtained in near-real time. The cloud optical characteristics were acquired using the Satellite Application Facility for Supporting Nowcasting (SAFNWC) and very short-range forecasting, which is distributed by EUMETSAT and extensively utilized, such as in cloud microphysics algorithms [19], including the cloud optical thickness (COT) parameter [20], cloud phase (CPH), and cloud type (CT) [21,22]. Each of these features is understood separately to assist in forecasting. COT is a satellite-based product that is created in near-real time and does not require any subsequent processing. COT primarily explains the impact of cloud attenuation on solar energy reaching the Earth’s surface. Therefore, COT is primarily used to predict cloudiness and quantify the effect of cloud cover on GHI hitting the ground level.
Therefore, for the purposes of this study, the input data for the Nowcasting SAF software (NWC/GEO v2021 and NWC/PPS v2021) consisted of two main components designed to ensure consistency and homogeneity—even though the SAF system is primarily developed for nowcasting rather than the generation of long-term climate data records. First, all the 15-min cloud microphysics images provided by the SAFNWC were used. These images furnish critical parameters such as cloud optical thickness, cloud type, and cloud phase. The high temporal resolution (15-min intervals) guarantees a regular and continuous dataset. Although the SAF system is not explicitly designed for climate record generation, this consistent collection of cloud properties is well suited for climatological studies aiming at trend estimation of cloud effects on solar irradiation. The homogeneous nature of these images parallels the quality and consistency expected from datasets like the SEVIRI Fundamental Climate Data Record, ensuring that our input remains reliable over long-term analyses. Second, to quantify the aerosol effect on solar irradiation, the CAMS AOD data were utilized. In this product, MODIS observations are internally assimilated, which significantly improves the consistency and accuracy between the model outputs and actual observations. This assimilation process has been validated in previous studies [23,24,25,26], confirming that the CAMS AOD product is robust for applications in both operational and climatological contexts. Thus, by explicitly using a homogeneous, high-temporal-resolution dataset for cloud microphysics together with the carefully assimilated CAMS AOD product, our approach directly addressed any possible concerns regarding the input data’s suitability for climate trend analysis. The methodological rigor in selecting and evaluating these data sources ensured that any trend estimations derived from our study would be based on consistent and reliable measurements.
Moreover, following a request submitted to the Strategic Governance and Data Sector of the Business Analytics and Data Directorate of HEDNO S.A. (Hellenic Electricity Distribution Network Operator S.A., Athens, Greece) [27], we received annual energy consumption data for each region, covering the last 5 years.

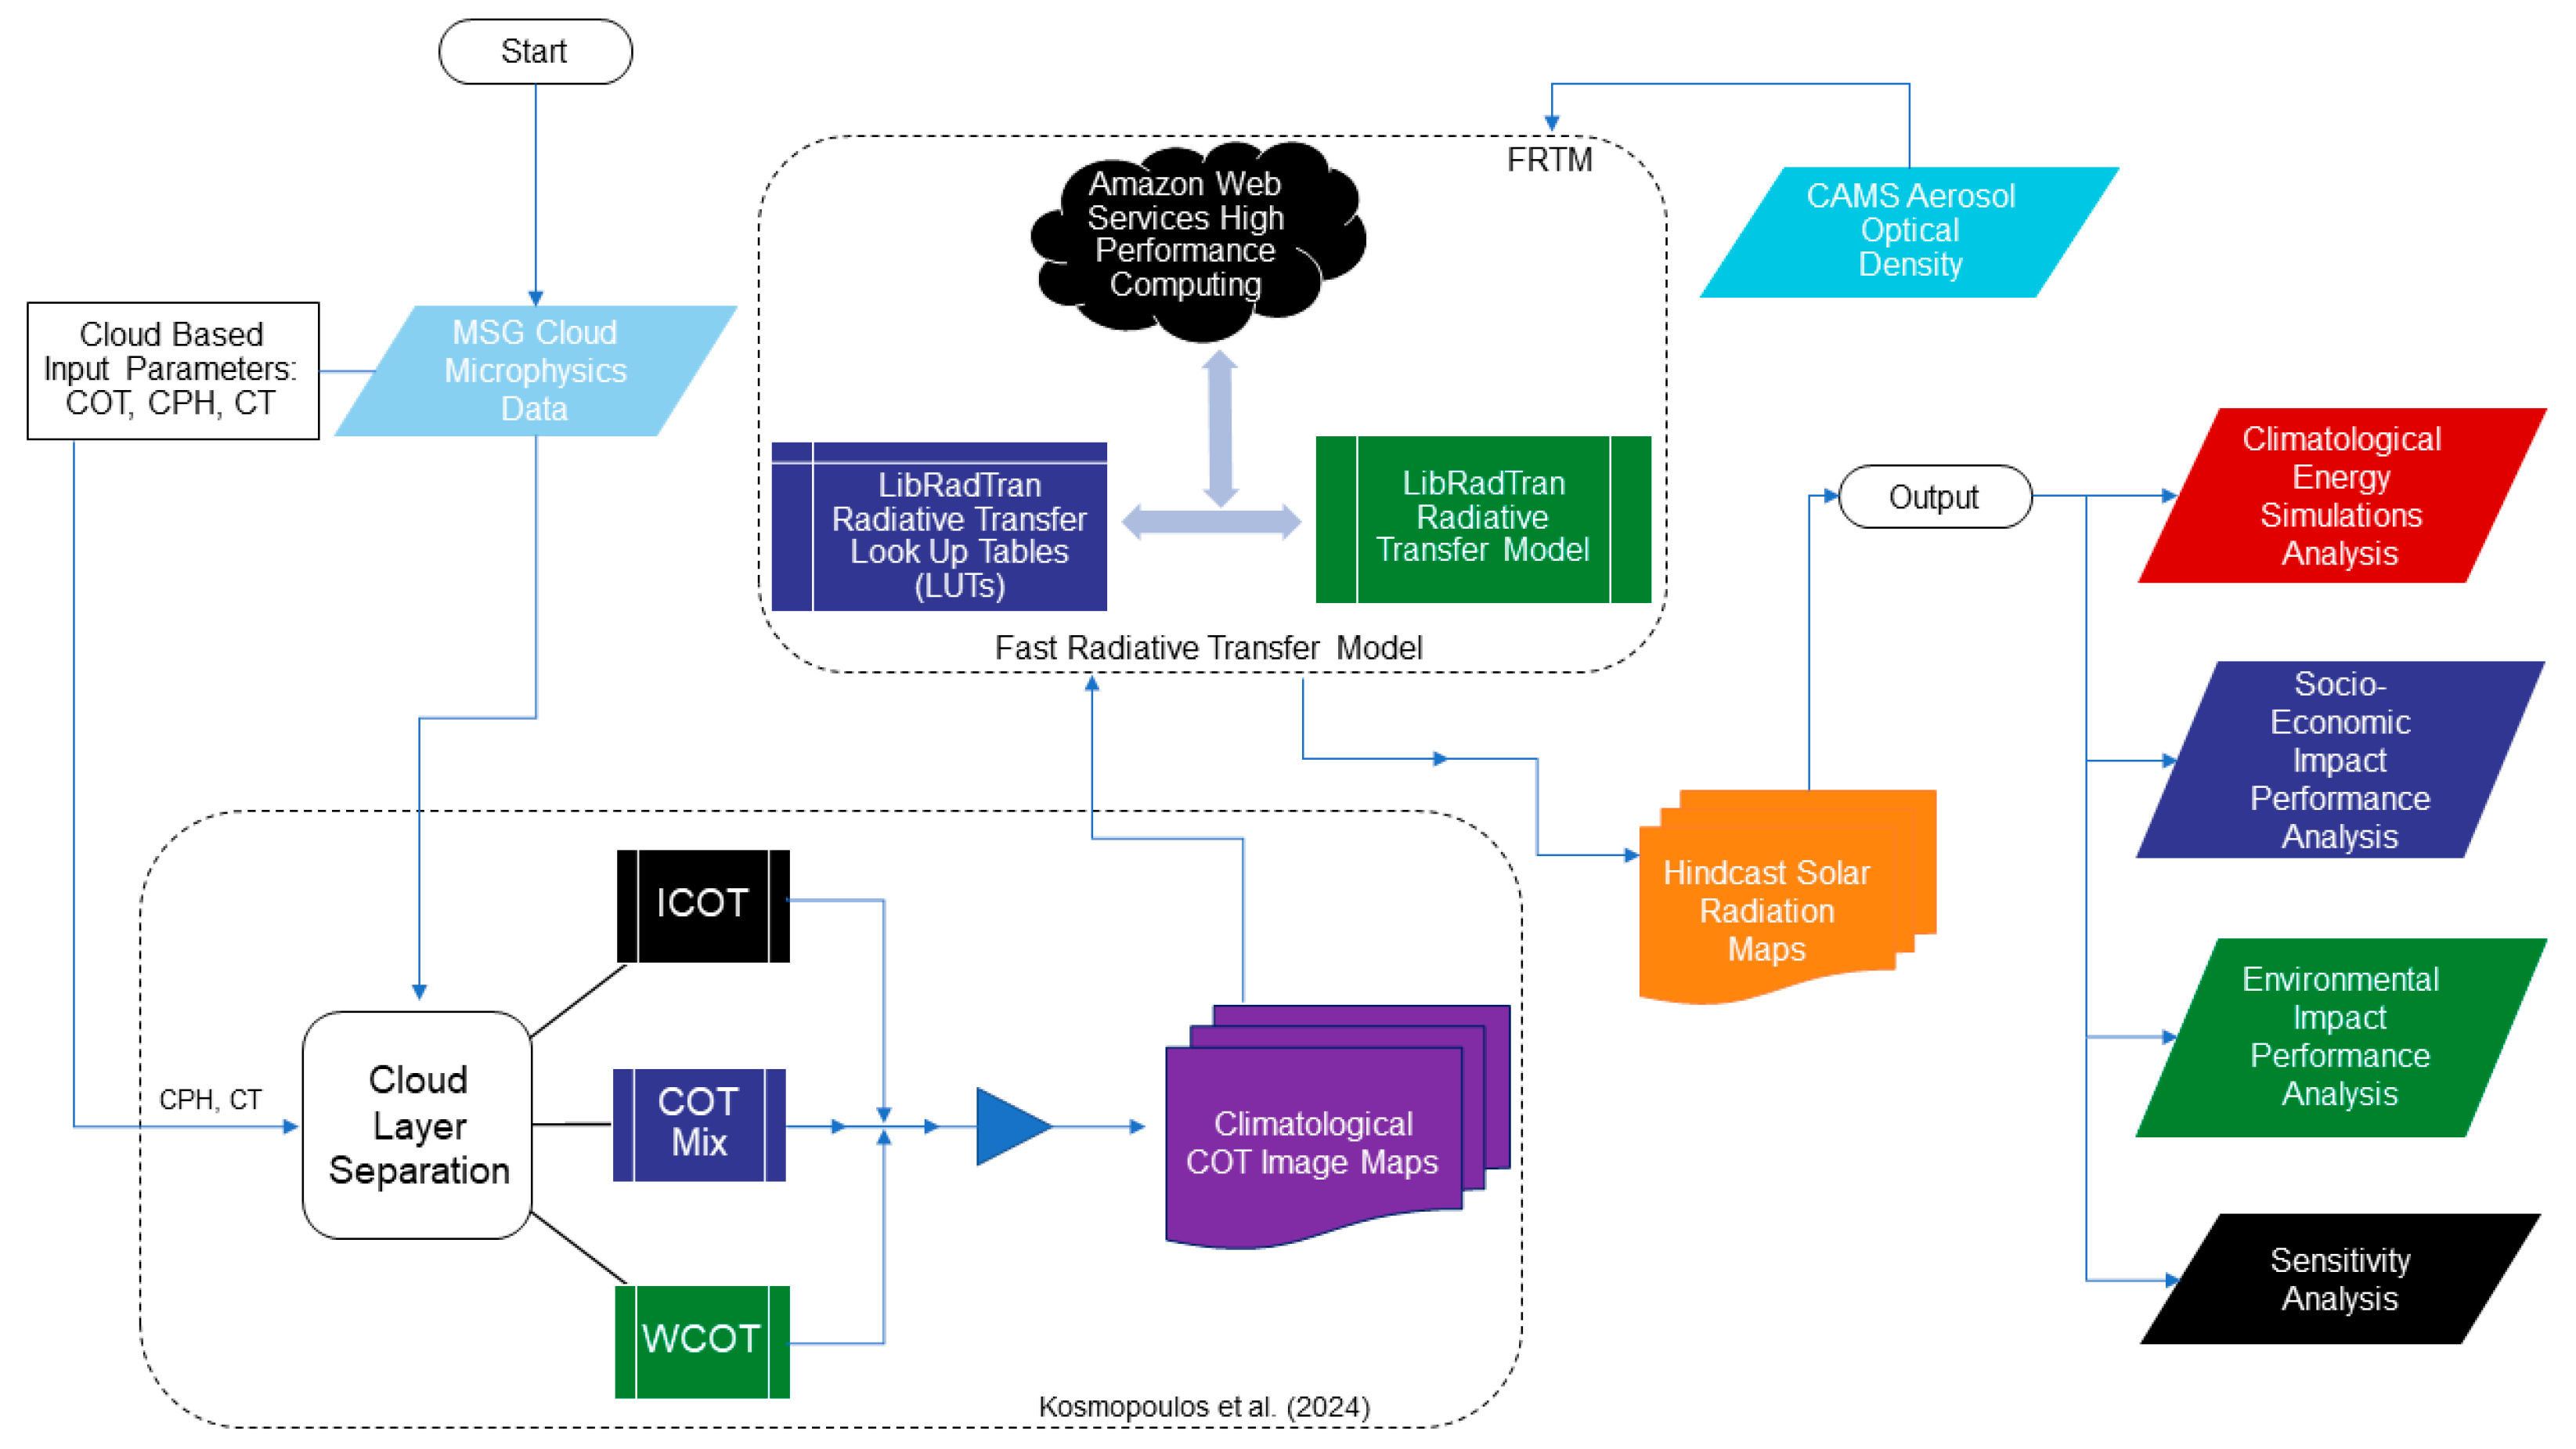
2.2. Fast Radiative Transfer Model (FRTM)

The fast radiative transfer model (FRTM) [12] used for the purposes of this climatological study is a sophisticated tool designed for the rapid and accurate calculation of solar radiation at the Earth’s surface. It is based on the libRadtran software package (version 2.0.6) and is the first of its kind that supports 3 layers of clouds for massive simulations [12]. The input parameters under clear-sky conditions include solar zenith angle, aerosol optical depth, and single-scattering albedo, along with other parameters like columnar water vapor and ozone. Under cloud-sky conditions, aerosol optical properties are replaced by cloud microphysics in terms of cloud type, phase, and optical thickness, since the effect of aerosols is negligible compared to thick clouds. Key features of the FRTM include high accuracy, speed, and versatility. The outputs from the FRTM trained with the LUT that enabled the multi-layer cloud effect are referred to as SOLEA 3D [12].
The model employs advanced algorithms to ensure precise calculations of solar radiation, considering various atmospheric parameters such as aerosols, water vapor, and ozone. Designed for operational use, the FRTM is optimized for fast computations, making it suitable for real-time applications. Additionally, the model can be applied to different geographical regions and time scales, providing flexibility for various solar energy forecasting needs.
To adapt the FRTM for climatological applications, particularly for long-term analysis of GHI over Greece, the following adjustments were implemented. The FRTM was configured to process data over a 20-year period, allowing for the analysis of long-term trends and patterns in GHI. The model was tailored to focus on different regions within Greece, providing detailed spatial resolution to capture regional variations in GHI. Historical climatological data from satellite observations were integrated into the model to enhance its accuracy and relevance for long-term studies. By implementing these adaptations, the FRTM was effectively transformed into a powerful tool for long-term climatological analysis, providing valuable insights into the relationship between solar radiation and PV production in Greece. The FRTM simulations [12], as compared to ground-truth measurements from the Baseline Solar Radiation Network (BSRN) stations, introduce a relative root square error (RMSE) of 37 W/m2 in clear sky condition sites (e.g., Tamanrasset in southern Algeria) and 59 W/m2 in cloudy condition sites (e.g., Cabauw in the Netherlands) for the instantaneous (15-min) simulations. To this end, the aforementioned uncertainty introduced by the FRTM to the climatological solar energy potential is of the order of 2 and 5% on an annual basis under clear- and all-sky conditions, respectively. For more in-depth information, please refer to Appendix A, which provides a detailed breakdown of all relevant statistics and the variation in real-time simulations compared against BSRN ground stations for different seasons and sky conditions.
Modified and appropriately adapted for climatological study, the SOLEA 3D component of [12]—now essentially a climatological and hindcasting algorithm via a multi-layer cloud displacement reconstruction approach; annotated as “Kosmopoulos et al., (2024)” in Figure 1 that follows on page 7—analyzes the past evolution of clouds in three dimensions (capturing both horizontal movement and vertical structure). These three-dimensional cloud hindcasts provide the historical cloud properties (such as spatial distribution and optical characteristics) that serve as input for the fast radiative transfer model (FRTM). The FRTM then rapidly computes the corresponding surface irradiance based on these cloud properties. In other words, the SOLEA 3D module and the FRTM are tightly coupled: SOLEA 3D generates the necessary cloud field data, which the FRTM translates into solar irradiance climatological estimations and hindcasts. In short, we can alternatively say that the SOLEA 3D component of [12], as modified and appropriately adapted for the purposes of the current climatological study, is essentially the FRTM that can and does handle multiple cloud layers for the radiative transfer, of which the equation is given in extensive detail and explanation in Appendix B.
By integrating rapid radiative transfer calculations (via FRTM) with an advanced multi-layer cloud displacement reconstruction approach, the method overcomes the limitations of simpler historical reconstruction techniques. This coupled approach not only increases the accuracy of solar irradiance assessments but also makes the computational process viable for operational use in solar energy management settings. This synergy is especially important in practical scenarios where both speed and accuracy are essential—for example, in analyzing the historical performance of solar photovoltaic systems, where past variations in irradiance can have significant operational impacts.
The flowchart in Figure 1 presents the methodological framework for assessing solar radiation dynamics through advanced cloud microphysics data processing and radiative transfer simulations. The workflow begins with cloud-related input parameters—cloud optical thickness (COT), cloud phase (CPH), and cloud type (CT)—which are derived from MSG cloud microphysics data. These parameters are subsequently refined through a cloud layer separation module, yielding ice cloud optical thickness (ICOT), water cloud optical thickness (WCOT), and mixed-phase COT classifications. Following that, all the extracted information is aggregated and, in the end, generates climatological COT image maps. Afterwards, all this information is incorporated into the libRadtran radiative transfer look-up tables (LUTs) and the libRadtran radiative transfer model, both executed via Amazon Web Services High Performance Computing (AWS HPC) to construct the fast radiative transfer model (FRTM). Additionally, CAMS aerosol optical density data are integrated into the FRTM to enhance the radiative computations. The hindcast solar radiation map outputs resulting from the FRTM are then applied to multiple analytical domains. These include climatological energy simulation analysis, socio-economic impact performance analysis, environmental impact performance analysis, and sensitivity analysis, offering insights into atmospheric radiative interactions and their broader implications. This structured approach provides a robust framework for investigating cloud–radiation interactions, contributing to improved climate modeling, energy resource assessments, and environmental impact evaluations.
The FRTM is designed to simulate, very rapidly, how solar radiation was affected by clouds. Radiative transfer calculations are typically computationally expensive, but the FRTM streamlines this process so that it can efficiently convert historical cloud optical properties into surface radiative flux reconstructions. This is a key requirement for real-time or near-real-time climatological assessment of solar irradiance. Traditional methods usually track clouds in a two-dimensional (horizontal) sense. In contrast, the multi-layer (or three-dimensional) approach captures the vertical structure of the clouds as well. By reconstructing the movement of several cloud layers, this technique provides a more nuanced and realistic estimate of past cloud cover evolution. In operational developments, this historical reconstruction method is sometimes branded or implemented as part of the SOLEA suite (for example, SOLEA 3D), which taps into advanced computer vision and cloud microphysics to deliver climatological analysis for solar energy management. In the proposed system, the SOLEA 3D component of [12], modified and appropriately adapted for climatological study and annotated as “Kosmopoulos et al., (2024)” in Figure 1 above, analyzes how clouds evolved, taking into account both their horizontal movement and their vertical (multi-layer) structure. These reconstructed cloud fields are then fed into the FRTM. In other words, the 3D climatological assessments provide the spatial distribution and optical properties of the clouds over time, while the FRTM quickly computes the corresponding effects on downwelling solar irradiance. This combination allows the overall system to generate accurate historical solar energy assessments with high spatial (5 km grid) and temporal (15-min intervals) resolution.
By incorporating the FRTM into climate models, researchers can improve the accuracy of simulations related to solar radiation and its impact on climate systems. This includes studying the effects of aerosols, clouds, and other atmospheric constituents on solar radiation. The FRTM’s ability to provide detailed and accurate GHI data is invaluable for the planning and management of solar energy systems, including optimizing the placement and operation of solar panels to maximize energy production.
In conclusion, it is a powerful tool that combines speed, accuracy, and versatility. Its applications in climatology, particularly for long-term GHI analysis, make it an essential component of modern atmospheric and environmental research.

2.3. Metadata Processing and Visualization

The GHI data for Greece cover an extended time period from September 2004 to August 2024, providing a detailed temporal resolution for the analysis. They represent the country divided into a grid of 151 by 181 pixels, ensuring comprehensive spatial coverage, and consist of monthly GHI values per pixel. The regions of Greece were classified approximately into rectangle boundary boxes with dimensions proportional to their true longitude and latitude limits, in full accordance with the administrative boundaries of Greece, ensuring that each region was adequately represented. This allowed for an accurate representation of the regional geographical variations in solar potential.
The data were processed using MATLAB (R2025a), and the M_Map tool [28] was incorporated to create detailed maps, illustrating the solar potential across Greece. The data processing involved several steps. Initially, the raw GHI per pixel, already considering the effects of clouds and aerosols, was preprocessed to remove potential inconsistencies, ensure uniformity across the datasets, and normalize the data to a common scale. Subsequently, the preprocessed data were mapped onto the 151 by 181 pixel grid, ensuring each pixel represented a specific geographical location within Greece.
One can more directly and easily understand the importance and innovation offered by the adoption of this methodology, and especially the incorporation of the aforementioned FRTM, by noting the numerical data regarding the number of simulations and the sizes and processing time of the resulting files. The massive estimations of solar irradiation provided by the FTRM are based on a dedicated LUT approach. Briefly, the LUT consists of almost 303 million simulation records, including the quantification of multi-layer cloud presence and microphysics in conjunction with aerosol optical properties [12]. Running simulations for the depictions of Greece with a total number of 27,331 pixels each, every 15 min, which gives 96 quarters of 15 min in a day in total, for each of the 365 days of a single year (35,040 time steps per year), and for the 20 total years for which we had and processed data, this whole product gave us more than 19.15 billion simulations! Furthermore, regarding the equivalent volume of this dataset and the necessary storage space, if considered that each such visualization of Greece is around 150 KB, again with the same reasoning, we ultimately arrive at 105.12 GB. If we were to use more well-trodden, conventional approaches, such as libRadtran [29,30], the completion of all this work would require 195 days of continuous simulation runs. In comparison, with the integration of the FRTM, we managed to reach the same, desired result in just about 9 min.
Long-term trends in solar potential were identified by analyzing the GHI data over the 20-year period, helping to understand temporal variations in solar irradiance and contributing factors. Additionally, the mean value of GHI for each pixel over the entire time interval was calculated to provide an average solar potential for each geographical location. The slope or rate of change for each pixel was determined through linear regression on the monthly GHI values for each pixel, offering valuable insights into trends and changes in solar potential over time.
The PVGIS online tool [31] was employed to estimate the photovoltaic output [32,33,34,35,36,37,38,39,40] in the two opposite, most distant points of Greece: Ormenio in the north and Gavdos in the south. These point values were used for calibration and testing the validity of the derived equations in extreme geographical areas to guarantee accuracy for different sun heights climatologically, by adjusting the initial data based on the maximum and minimum monthly GHI values. The result is an equation that correlates, specifically for Greece, the energy produced in kWh by the default solar panel (crystalline silicon, grid-connected, installed peak PV power of 1 kWp, system losses of 14%, free-standing module, tilted at the optimized slope) with the GHI values measured in W/m2. This way, it is ensured that the PV output estimates were accurate and representative of the actual solar potential in different regions of Greece. The explanation of the conversion of solar radiation into energy is given in detail in Appendix B with all the relevant necessary equations. In addition, in [21], a comparison is made of the simulations and the real photovoltaics in the city of Athens, where the PVGIS method was also used to obtain the solar irradiance for reference.
Finally, PV energy output was converted into annual financial earnings using the following formula:
P (€) = E (MWh) × c (€/MWh)
where P is the profit (in Euros, EUR), E is the photovoltaic (PV) generated energy (in megawatt-hours, MWh), and c is the electricity price (cost) (in Euros per megawatt-hour, EUR/MWh).
Also, the Greenhouse Gas Equivalencies calculator [41] was utilized to translate the energy statistics into the equivalent amount of carbon dioxide (CO2) emissions produced. Using the AVoided Emissions and Generation Tool (AVERT) for the United States’ national weighted average CO2 marginal emission rate, it transforms kilowatt-hour savings into avoided CO2 emissions. The equation specified as being utilized to generate the final result (without accounting for any greenhouse gases other than CO2, and incorporating line losses) is as follows:
1540.1 lbs CO2/MWh × 1 metric ton/2204.6 lbs × 0.001 MWh/kWh = 6.99 × 10⁻⁴ metric tons CO2/kWh
The results of the analysis were used to create detailed maps, charts, and tables, illustrating the spatial and temporal variations in solar potential across Greece. These visualizations provided a comprehensive view of the solar energy landscape in Greece, highlighting areas with high and low solar potential, the factors influencing these variations, and consequential financial and environmental insights. Figure 1 previously and Figure 2 directly below summarize the entire study’s process logic and methodology.
Figure 2 provides an overview of the study’s methodology, facilitating content flow within the manuscript. The figure is systematically organized into distinct color-coded sections, each representing a key methodological step in the research process. These sections sequentially outline dataset characteristics, data processing techniques, validation procedures, photovoltaic (PV) output assessments, solar resource evaluation, and policy-relevant applications. By visually structuring the methodological framework, this figure enhances the coherence of the manuscript, providing a clear roadmap for data interpretation and analytical progression.

3. Results

3.1. Solar Resources of Greece: The Most Up-to-Date PV Power Potential Map
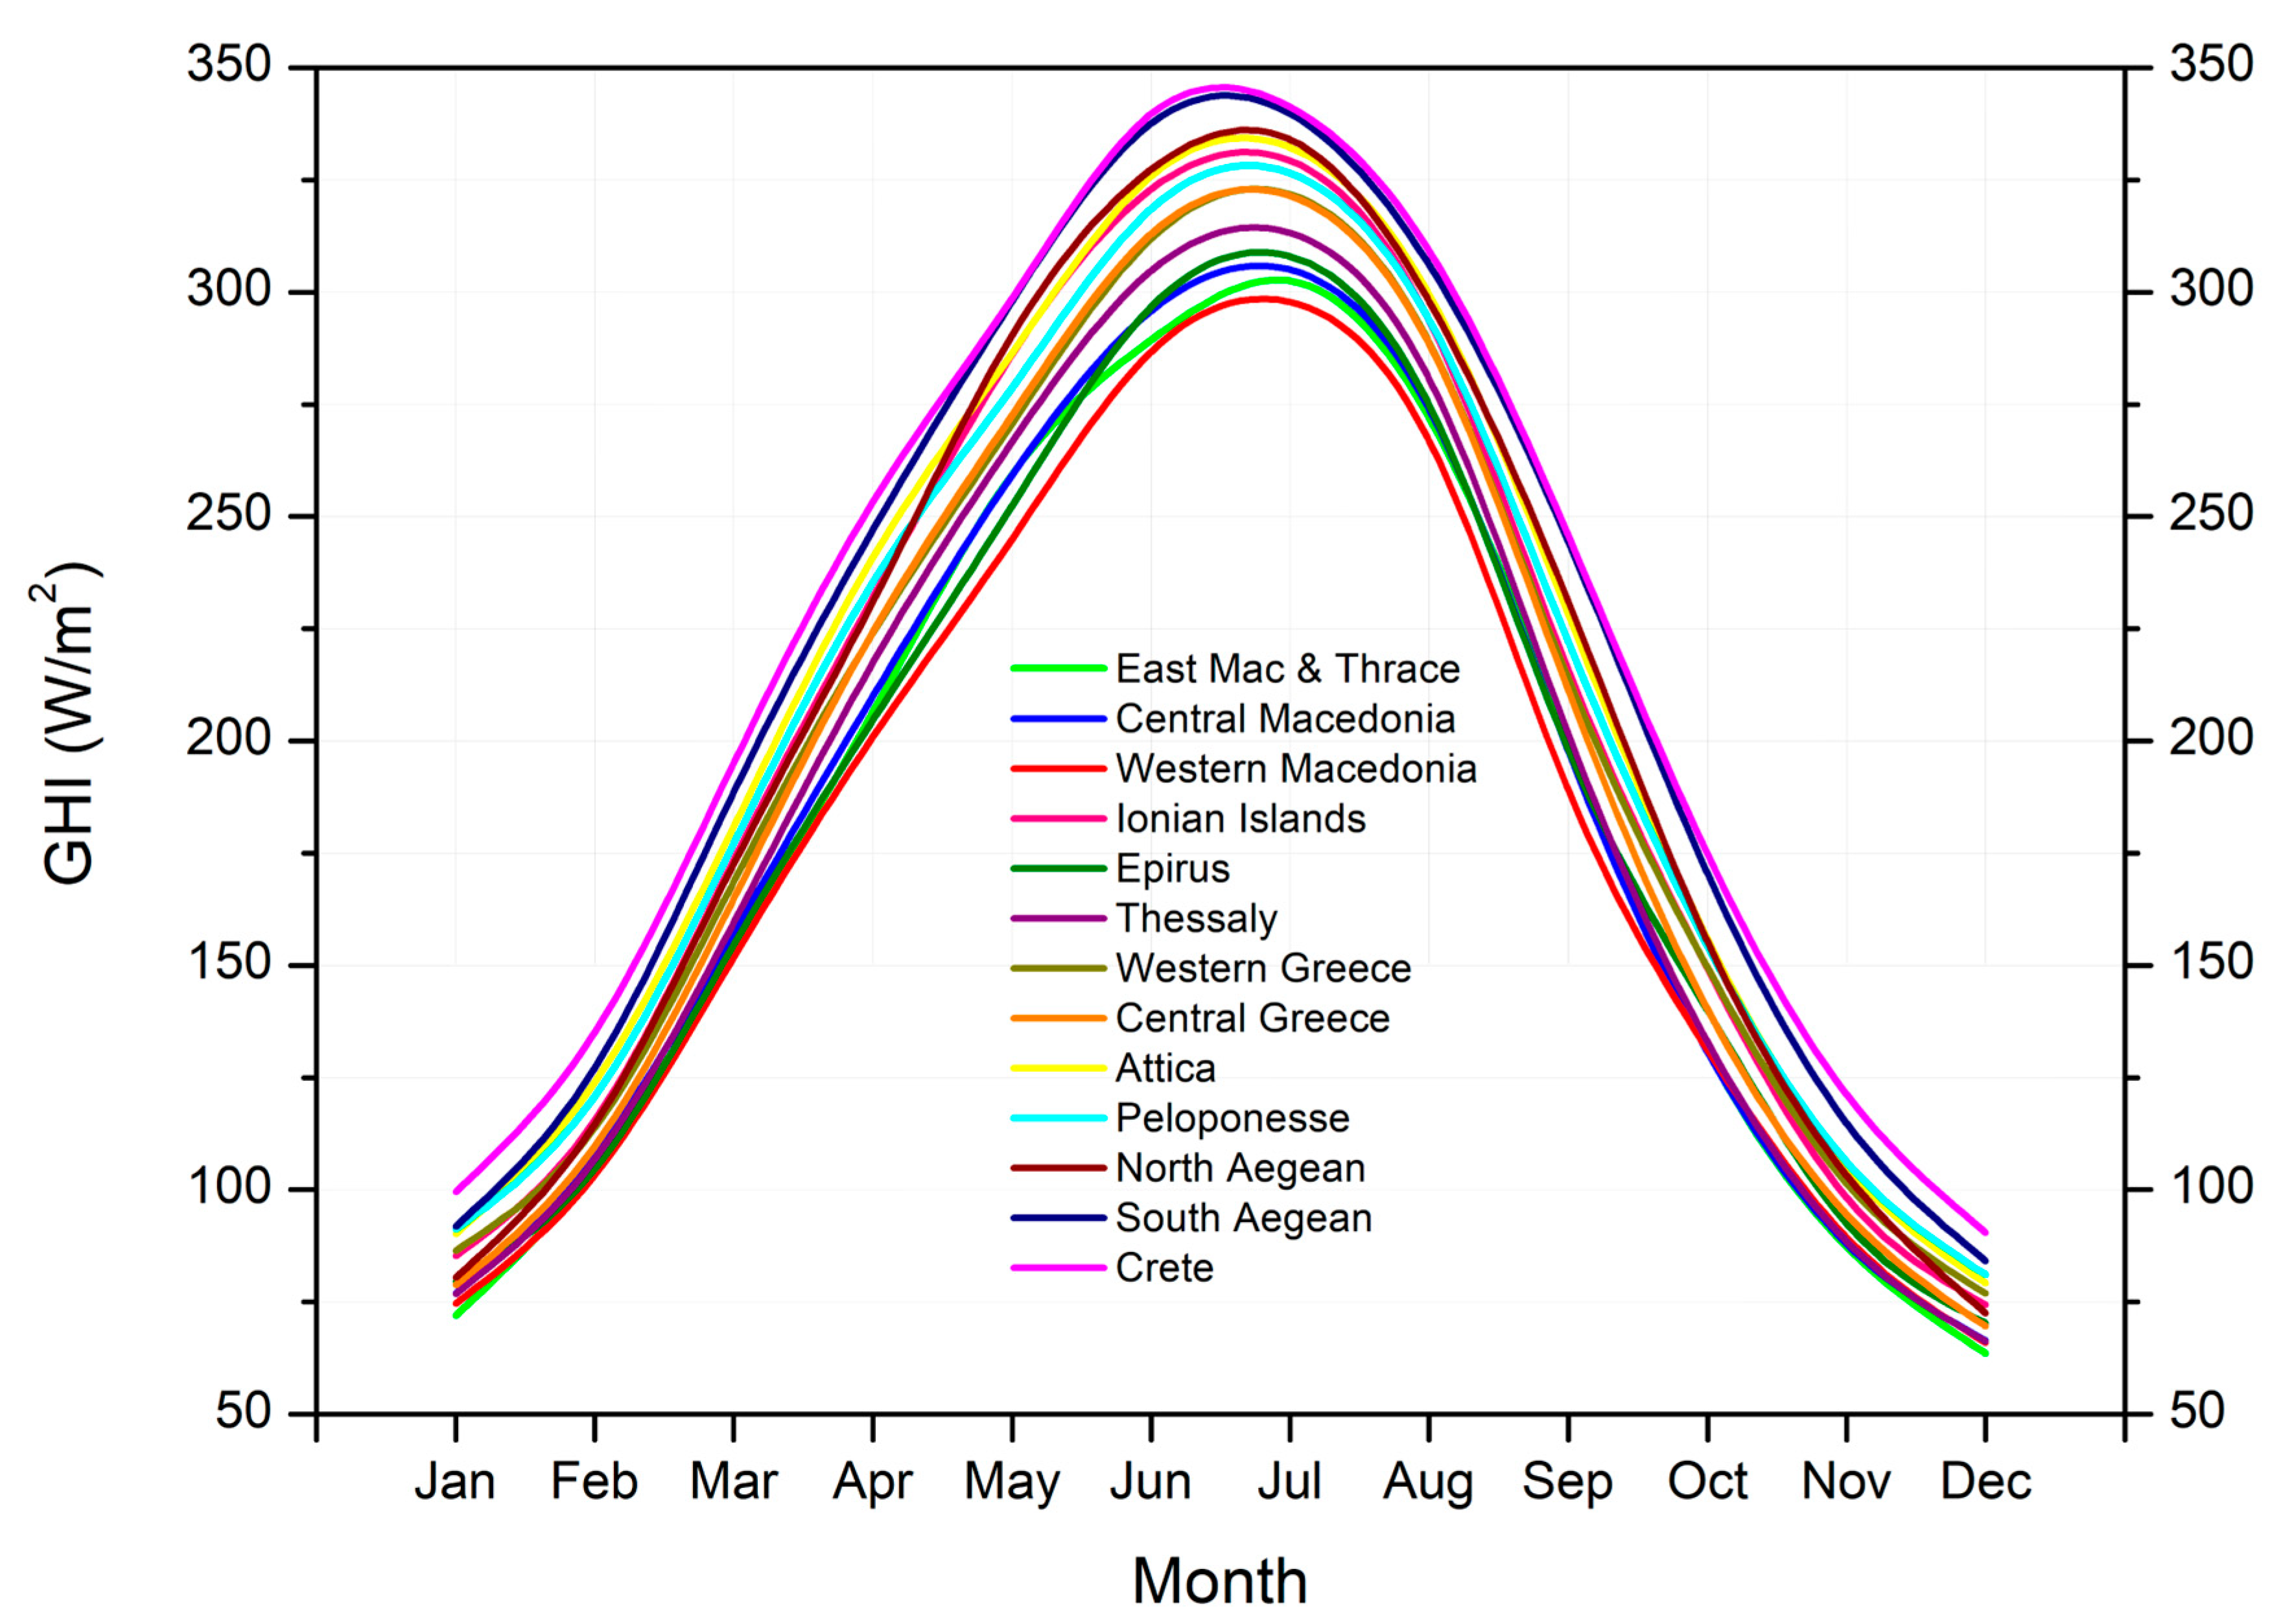
Figure 3 compares a map where all 13 regions of Greece are named and distinguished by different colors [42], with the original solar potential map developed exclusively for the purposes of the current study.
More specifically, the latter is a color-coded map, overlaid with a grid of latitude and longitude lines. It provides a clear reference for the spatial distribution of solar potential, representing the average solar photovoltaic power production over Greece. The averaging is essential to smooth out short-term variations due to weather and seasonal changes, providing a more stable and representative picture of solar potential. This map is crucial for understanding the spatial distribution of solar energy potential, which is essential for applications in solar energy harvesting. The highest potential values, around 1570 kWh, are concentrated in the southern parts of Greece, particularly around the Dodecanese Islands and Crete, due to the lower latitude and the relatively clear skies in these areas. In the islands of the North Aegean, in the Cyclades, in Attica, along the areas near and on the coastline of the Peloponnese, and in Kythira, significantly high values are also observed, around 1540 to 1560 kWh. The northern parts of Greece, most of Central Greece, the central Peloponnese, and northern Evia are characterized by lower values, roughly between 1520 and 1540 kWh. Finally, the imprinting of the minimum values along the Pindos mountain range and in the area around Mount Olympus is particularly evident. This decrease can be attributed to higher latitudes and possibly more cloud cover and atmospheric particles that scatter and absorb sunlight.

3.2. GHI Variation

Figure 4 illustrates the average GHI values for each month over the entire 20-year period, resulting in the characteristic bell-shaped curves that represent the annual GHI trends for each region of Greece. Figure 5 complements this by presenting 12 maps, each depicting the distribution of GHI across Greece for a specific month, using the same scale to highlight regional variations in solar potential throughout the year.
The highest GHI values occur in the southeastern Aegean and Crete. On the contrary, the lowest values are observed in Macedonia and Thrace, in essence, the whole wider area of northern Greece, while the other regions vary between these levels. Figure 5 below confirms the seasonal variation in incident solar radiation levels over Greece during a whole calendar year. The low values during the autumn and winter months succeed the moderate to high and very high values of the spring and summer months, etc. [43,44,45,46].
Several factors cause variations in GHI across different regions and times. GHI is affected greatly by latitude and altitude. Solar radiation is typically more abundant in regions closer to the equator and at higher altitudes. GHI is also significantly influenced by the quantity and kind of cloud cover. Clear skies increase GHI, whereas gloomy skies diminish it. In addition, aerosols, air pollution, and particulate matter in general in the atmosphere, such as dust and smog, can scatter and absorb sunlight, lowering GHI. The angle of the Sun’s beams varies throughout the year owing to the tilt of the Earth’s axis, impacting the amount of solar energy absorbed as well. Thus, GHI changes with the seasons, peaking in the summer owing to longer daylight hours and more direct sunshine, and falling in the winter. Moreover, the physical topography, which includes mountains and valleys, can generate microclimates that influence local GHI levels.
For example, in Northern Greece, the topography generally includes mountains and valleys. These geographical features can lead to variations in solar radiation, with higher altitudes receiving more direct sunlight [47]. In Central Greece, such as in the region of Thessaly, seasonal changes are pronounced. During summer, the Sun is higher in the sky, leading to longer daylight hours and higher GHI values. Conversely, in winter, the Sun is lower, resulting in shorter days and lower GHI values [48]. The Ionian Islands, including Corfu, often experience increased cloud cover, especially during the winter months. This cloudiness significantly impacts GHI by reflecting and absorbing sunlight, leading to lower GHI values during these periods [49]. Additionally, the Pindos mountain range significantly influences the climate and, consequently, the GHI and solar potential in the Ionian Islands and Western Greece. The mountains act as a barrier to the moist westerly winds from the Ionian Sea, causing high rainfall on the western slopes and creating a rain shadow effect on the eastern side. This results in lower cloud cover and higher GHI on the eastern side, enhancing the solar potential in these areas. The Ionian Islands, despite being on the windward side, still possess good solar energy potential due to their geographical location and relatively high GHI values. Western Greece, benefiting from the rain shadow effect, experiences higher GHI and thus has a still favorable solar potential.
The southern regions of Greece, like Crete, are more susceptible to dust storms from the Sahara Desert. These dust storms can transfer large amounts of dust, reducing GHI by scattering and absorbing sunlight, particularly in spring and summer [50]. In the Aegean Islands, including the Cyclades, variations in atmospheric conditions (humidity, air pressure) can influence the amount of solar radiation reaching the ground. High humidity levels can lead to more scattering of sunlight, reducing GHI [51]. In urban areas like Athens, emissions from industrial activities, transportation, and heating can increase the concentration of aerosols and particulate matter in the atmosphere, affecting GHI. Reduced use of fireplaces and radiators in milder winters can lead to fewer suspended particles, resulting in higher GHI values [52]. Finally, the Peloponnese region has experienced changes in climate patterns, such as increased temperatures and altered precipitation patterns. Rising temperatures can lead to higher evaporation rates, increased cloud formation, and changes in dust transport patterns, all of which influence solar radiation levels.
The rate of change in GHI refers to the variation in the amount of solar radiation received per unit area on a horizontal surface over a specific time interval. It is typically expressed as a derivative or percentage change and can indicate increasing or decreasing solar energy levels based on changes in atmospheric and environmental conditions. A positive rate of change suggests an increase in solar energy received, which might be caused by longer daylight hours, cleaner skies, or the Sun rising higher in the sky. A negative rate of change, on the other hand, implies that the amount of solar energy received has decreased, which might be due to fewer daylight hours, cloudier skies, and particulate-laden atmosphere, or the Sun being lower in the sky. Table 1 gathers together the rate of change in GHI for each month per region over the 20-year study period, highlighting variations across Greece’s regions and providing insights into seasonal trends. Figure 6 complements Table 1 by presenting 12 maps, each depicting the rate of change of GHI across Greece for a specific month, using a consistent scale to showcase spatial and seasonal variations throughout the year. Nevertheless, both reveal similar patterns, offering complementary insights into temporal and spatial trends.
When investigating the rate of change in GHI in Greece during the last two decades, numerous factors come into play. In April, the positive rate of change implies that solar radiation is increasing as days lengthen and the Sun’s angle rises. This can be linked to a decrease in dust transport from the Sahara over time, resulting in reduced scattering and absorption of sunlight, and hence an increase in solar energy received on Earth. Studies have revealed that dust transport from the Sahara may vary greatly, and current trends suggest that dust activity may decrease due to changes in atmospheric circulation patterns [53,54,55]. The negative rate of change in June may be attributed to the Sun reaching its peak and beginning to decrease, or increased cloud cover. Cloudiness increases with time, causing clouds to reflect and absorb more sunlight, resulting in a negative rate of change in GHI. Rising global temperatures accelerate evaporation, causing more clouds to develop. This is an obvious sign of climate change, as greater evaporation and precipitation rates are anticipated. The positive rate of change in December shows that solar radiation will increase when the Sun rises higher in the sky following the winter solstice. Because of the warmer temperatures, there has been less use of fireplaces and radiators in the winter, resulting in less suspended particles in the air. When there are fewer particles to scatter and absorb sunlight, more solar radiation reaches the ground, resulting in a positive rate of change in GHI. Particulate matter levels have been demonstrated in studies to have a considerable influence on solar radiation. In milder winters, less emissions from heating sources lead to cleaner skies and greater GHI [56,57,58].

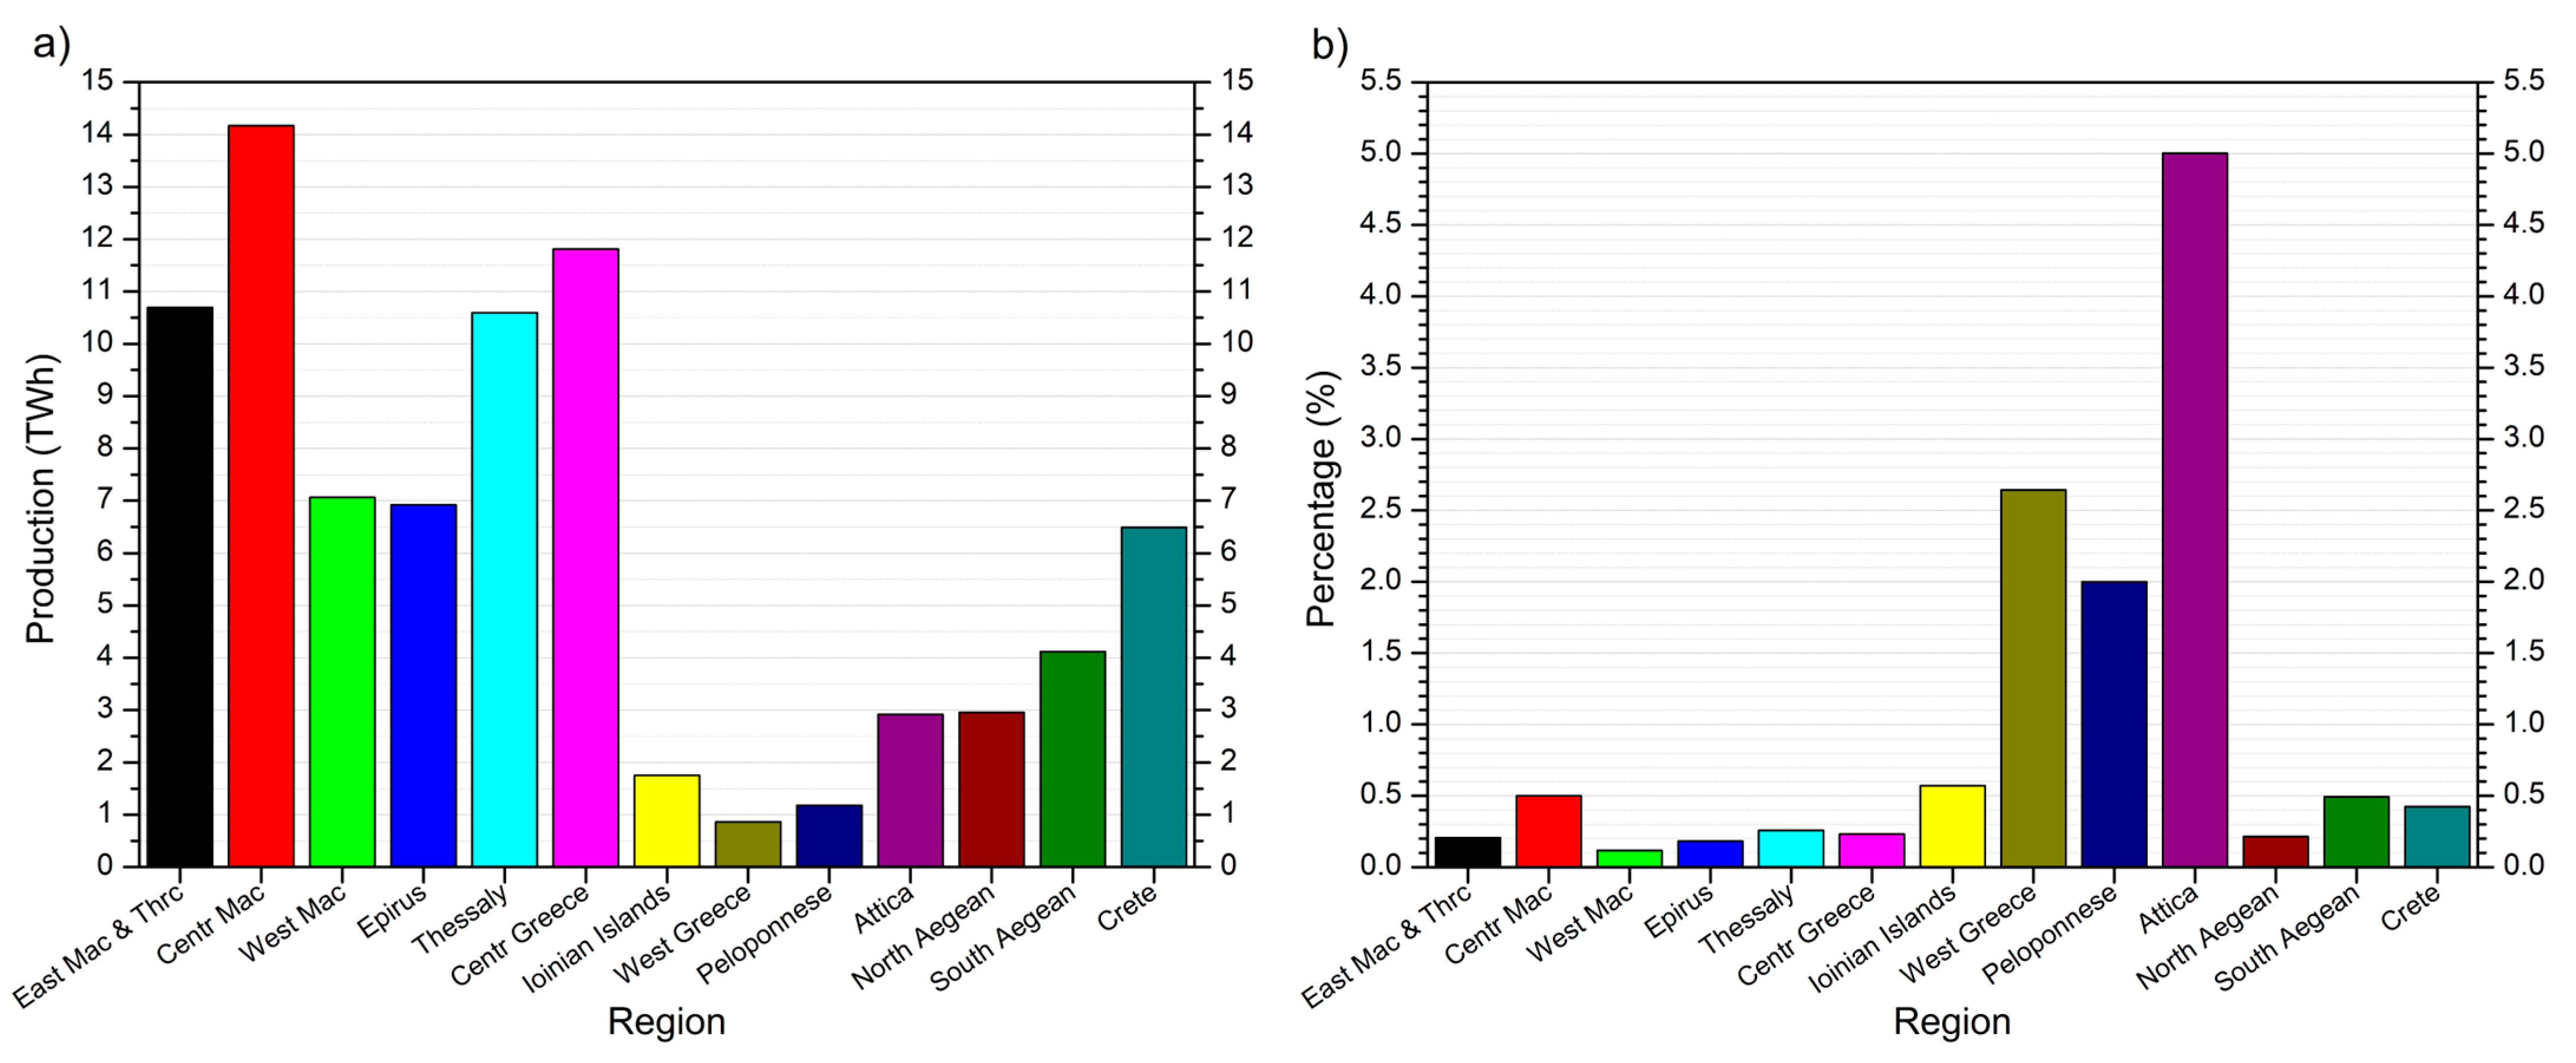
3.3. Fluctuations in PV Production

The conversion of GHI data into PV production reveals significant regional variations in the rate of change in energy produced by PV systems (RoC-PV) in Greece over the last 20 years. Since the same module was used in all cases for the theoretical simulation and under the same conditions, parameters such as degradation of PV systems over time, improvements in PV technology, or better maintenance practices will be ignored.
Moreover, translating produced energy into monetary value and carbon emissions avoided may offer a thorough knowledge of solar energy’s impact. Solar energy production’s potential revenue can be determined by multiplying the generated energy by the feed-in tariff (FiT) [38,59]. This metric provides a simplified yet practical indicator of financial viability, especially beneficial for parties interested in the economic advantages and financial viability of solar installations. While this calculation offers a useful baseline and insight into economic potential, actual revenue may vary depending on market dynamics and regulatory conditions. Nonetheless, for the purposes of the current study, this simplified approach is both adequate and informative. Greece has launched a cross-border energy auction for wind and solar power facilities, including 200 MW from Bulgaria and Italy. Members of the EEA Solar PV facilities with a capacity of greater than 1 MW will be eligible for a EUR 54/MWh tariff ceiling [60]. Converting the generated energy into carbon emissions avoided can highlight the environmental benefits of solar energy. In our case, we used the Greenhouse Gas Equivalencies Calculator by the EPA [41]. Solar panels have a significantly lower carbon footprint compared to fossil fuels. For instance, the life-cycle emissions of solar panels are around 41 g of CO2 equivalent per kWh, substantially lower than coal or natural gas [61]. Using both metrics provides a holistic view of the benefits of solar energy. It allows for a presentation of a balanced analysis that appeals to both economic and environmental stakeholders. Such a dual approach can strengthen the case for solar energy adoption by showcasing its financial viability and its contribution to reducing carbon emissions.
Table 2 summarizes the following data for each region over the 20-year study period: (1) the yearly rate of change in GHI, expressed in W/m2; (2) the yearly rate of change in PV production for a 1 kWp system, expressed in kWh; (3) the corresponding monetary values in euros, calculated based on the feed-in tariff (FiT) per kWh; and (4) the savings in carbon emissions, expressed in kilograms of CO2 equivalent per kWh. The negative CO2 equivalent values in this study indicate a reduction in carbon emissions due to decreased PV energy production, which results from a reduction in solar radiation (GHI) reaching the ground. These values reflect the reduced amount of solar energy available to replace fossil fuel-generated electricity, leading to fewer carbon emissions being saved compared to areas and/or periods of higher solar radiation. In other words, when solar PV output declines due to reduced irradiance, the potential for CO2 offset is diminished. This reduction, often described as a decrease in avoided emissions, does not mean that additional CO2 is being produced. Instead, it signifies a lowered capacity to displace fossil fuel-generated electricity with renewable PV energy, thereby reducing the environmental benefit of avoiding emissions.
Such an analysis highlights the direct relationship between changes in solar radiation levels and their impact on environmental benefits. This interpretation ties directly to the study’s investigation of how changes in GHI influence PV production and associated CO2 savings.
East Macedonia and Thrace and Central Macedonia exhibit a negative rate of change in PV production, indicating a decline in solar energy output over the last 20 years. This decline is accompanied by a reduction in CO2 equivalent emissions and a negative economic impact. Conversely, Western Macedonia shows a positive one. The Ionian Islands, Central Greece, and Crete also demonstrate significant positive changes in PV production, CO2 reductions, and economic gains. The Peloponnese and Attica regions exhibit the highest rates of change in PV production, with substantial CO2 equivalent reductions and notable economic benefits. Epirus, Thessaly, and Western Greece show moderate improvements in PV production, with corresponding CO2 reductions and economic benefits.
The findings suggest that while some regions are experiencing declines in PV production, others are making significant strides in solar energy output, leading to environmental and economic benefits. The data highlight the importance of regional strategies and policies to enhance PV production and maximize the benefits of solar energy. Regions with a negative rate of change in PV production are susceptible to increased emissions. The decline in PV production forces the energy grid to balance the shortfall with fossil fuel-based energy production. This not only negates the emission savings from PV but also exacerbates the overall carbon footprint. The forced balancing from fossil fuels can lead to a net increase in emissions, undermining the environmental benefits achieved in other regions with positive PV production trends. Enhancement of PV production could be achieved through the implementation of measures to boost PV production in regions with negative trends, such as upgrading existing systems, incentivizing new installations, and improving maintenance practices.

3.4. Energy Planning Scheme

Table 3 presents the average annual consumption of each region from 2019 to 2023, the extracted trend for consumption in the immediate future based on the last 5 years of data, and the energy adequacy in each region that would provide a PV coverage scenario of a surface equal to 1% of the total area of the entire region [62]. It also displays the potential monetary benefits in millions of euros and the carbon emission savings in metric tons per region for the required area that would cover the energy consumption of each region. Generally, the total possible maximum energy production can be derived given the area under discussion, the PV production in kWh corresponding to 1 kWp, and the fact that 1 MWp is equivalent to 20,500 m2 [34,35].
In formula form, it can be clearly, precisely, and effectively calculated with the following equation that provides the total possible maximum energy production in kWh for a region based on the PV system coverage and production capacity:
E t o t a l   k W h = A t o t a l × f c o v e r a g e A r e f × η P V   k W h k W p
where Atotal is the total available area (in m2); fcoverage is the assumed fraction of area covered by photovoltaic panels (here, 0.01 or 1%); Aref is equal to 20,500 m2 MWp−1 (reference area per MWp or land use conversion factor); and η P V is the specific energy production performance (in kWh kWp−1) (PV yield specific to each region).
Finally, the equation for estimating the energy adequacy for each region, taking into account the average annual consumption and the total possible maximum energy production from PV systems, as calculated using Equation (3) above, is
E n e r g y   A d e q u a c y   % = E t o t a l   k W h C a n n u a l   k W h × 100   %
where Cannual denotes the average annual energy consumption. This equation gives the energy adequacy as a percentage, indicating how much of the region’s energy consumption can be met by the PV systems covering 1% of the total area of the region.
Energy consumption in Greece varies by region. Attica, being the most populous region, has the highest energy consumption due to its residential, commercial, and industrial needs. Central Macedonia also has high energy consumption driven by significant industrial activities and urban centers like Thessaloniki. Crete’s energy consumption is influenced by tourism, which peaks during the summer months, increasing the demand for electricity. The Peloponnese region has a mix of agricultural and industrial energy consumption, while Western Greece has moderate energy consumption balanced between residential and agricultural use. Factors such as higher population density, significant industrial operations, extreme weather conditions (necessitating higher energy consumption for heating or cooling), seasonal tourism spikes, and government initiatives promoting renewable energy and energy efficiency collectively shape the energy consumption landscape across different regions in Greece.
Solar energy feasibility varies significantly. With just 1% photovoltaic (PV) coverage, Western Macedonia could generate eight times its energy demand, making it a renewable energy leader. East Macedonia and Thrace could produce five times its needs, followed by Thessaly and Central Greece (four times). Crete, the South Aegean, and Central Macedonia can exceed twice their demand, indicating strong solar potential. Attica exhibits the lowest energy adequacy percentage, requiring high PV investments due to its dense consumption.
East Macedonia and Thrace shows significant financial and environmental benefits. The high emissions savings highlight the region’s potential to contribute substantially to Greece’s carbon reduction goals. Central Macedonia stands out with the highest potential. Its considerable energy production potential and emissions savings underscore its critical role in Greece’s renewable energy strategy, making it a prime candidate for large-scale investments. Western Macedonia demonstrates moderate benefits from PV investments. The region’s potential for improvement in energy production efficiency should be explored to maximize returns. Epirus’ significant environmental benefits indicate strong potential for solar projects, which can enhance the region’s contribution to national energy goals. Thessaly presents substantial benefits, too. The region’s high energy production potential and emissions savings make it a valuable area for investment. Central Greece has financial returns similar to those of Thessaly. Its potential for renewable energy investments is significant, highlighting its capability to contribute to national energy and environmental goals. The Ionian Islands display moderate benefits. The region’s potential for further optimization should be explored to enhance its energy production efficiency. Western Greece’s numbers also indicate significant benefits. Focused efforts to improve solar energy infrastructure are necessary to maximize returns. The Peloponnese exhibits notable benefits as well. Targeted investments in renewable energy could enhance the region’s energy production efficiency. Attica enjoys the highest financial returns, reflecting its high energy consumption and potential for major renewable energy investments. Energy efficiency measures and renewable energy projects are crucial for Attica to meet its energy demands sustainably. The North Aegean shows moderate benefits, suggesting that further optimization should be explored to enhance its energy production efficiency. Contrariwise, the South Aegean promises strong potential for renewable energy investments. The region’s capacity to meet its energy demand with renewable sources makes it a promising area for investment. Finally, Crete evinces ample benefits. Strategic investments in PV systems could optimize the region’s energy production and contribute to national energy goals.
Figure 7 below is a two-panel graph, consisting of a column bar plot with the energy production potential per region for 1% of the area of each region on the left; and on the right, a column bar plot with the percentage of area of each region required to cover 100% of the energy demand.
Central Macedonia stands out with only 0.5% of its land area required to meet its energy demand. In contrast, Attica requires the highest percentage, emphasizing the need for energy efficiency measures and renewable investments. The Ionian Islands show moderate adequacy, while Western Greece and the Peloponnese require extensive PV coverage to meet their needs. East Macedonia and Thrace, Thessaly, and Central Greece demonstrate strong energy production with minimal land use, solidifying their roles in the national energy strategy.

4. Discussion

In light of the preceding, the following Table 4 presents an integrated overview of the key performance indicators, including the annual average rates of changes in GHI and PV production, the associated consumption trends, and the energy adequacy metrics. In particular, it details the energy adequacy percentage for a 1% PV coverage of the total regional area, the proportion of PV surface coverage required relative to the region’s area to achieve full energy adequacy, along with the corresponding economic earnings and the metric megatons of CO2 emissions avoided under a full consumption–demand energy scheme. This final, cumulative table helps capture both the technical details and the broader implications for energy schemes, providing a clear understanding of the aforementioned multidimensional analysis being presented in the whole manuscript.
The results of this work are in very good agreement with the recent literature. For example, ground stations have a total energy potential ranging from 1.5 to 1.9 MWh/m2 [63]. Cloudiness increases prediction inaccuracy by roughly 10%, and aerosols—especially during intense dust outbreaks—can dramatically reduce solar energy, with losses of up to 80% for concentrated solar power (CSP) systems and 50% for photovoltaic (PV) systems. Annual global radiation over Athens showed a positive trend between 1992 and 2017, with an increase of 0.40% per decade under all-sky conditions and 2.38% per decade under clear skies. In summer, global horizontal irradiance (GHI) increased by 1.85% per decade under all-sky conditions and 2.10% per decade under clear skies, whereas in winter, there was a negative trend of –2.46% per decade under all-sky conditions and –1.99% per decade under clear skies [64]. Furthermore, the influence of solar variability (sunspot cycle) on GHI levels in Athens from 1953 to 2018 was found to be less dominant than the impact of anthropogenic air pollution [65]. The ASPIRE Project [66] found that aerosols, such as dust and soot, significantly reduce solar irradiance by scattering and absorbing sunlight, which can decrease solar energy availability by up to 20%. Cloud cover also plays a decisive role, with clear skies providing the highest levels of solar irradiance, while overcast conditions drastically reduce it. Even partial cloud cover can cause fluctuations, making it challenging to predict solar power generation accurately.
Of particular interest is the close agreement between the present study and the findings reported in [67]. More specifically, the latter research is carried out until 2050, using historical (1971–2000) and prospective (2021–2050) climate data to determine influences on energy supply and demand, while this one, as already mentioned, deals with the last 20 years (2004–2024). Therefore, a large and significant overlap is observed in the middle of the time period. According to the findings of the climate simulations using the models CCLM4-8-17/CLMcom.ICHEC-EC-EARTH (m1), in all three RCP scenarios, an increase in power generation is projected in all areas, ranging between 1.5% and 2.5%. The HIRHAM5/DMI.ICHEC-EC-EARTH (m2) models, on the other hand, predict a loss in PV power output of between 0.5 and 1.0%, and the other two simulations (m3 and m4) predict both an increase and a decrease depending on the location and the climatic scenario under consideration. The expected changes are always less than ±0.5%. Correspondingly, in our current study, we find that the rate of change in the produced PV energy in kWh/kWp is equal to −1.0 in Eastern Macedonia and Thrace, −0.7 in Central Macedonia, +0.5 in Western Macedonia, +0.2 in Epirus, +0.9 in the Ionian Islands, +0.1 in Thessaly, +0.4 in Western Greece, +0.9 in Central Greece, +1.4 in Attica, +1.8 in the Peloponnese, +0.3 in the North Aegean, +0.8 in the South Aegean, and, finally, +1.0 in Crete. That is, it appears as if these studies are corroborating each other in a sense.
The striking similarity between the results of our study and the percentage-based findings of the aforementioned one [67] further reinforces the reliability and significance of our work. While the latter provides a model-driven percentage perspective on PV production changes influenced by climate, our analysis not only corroborates these trends but does so through real-world data, offering tangible results expressed in kWh/kWp for each Greek region. This approach makes the findings more actionable and directly applicable for energy planning and policy development. Moreover, this alignment of results highlights the validity of the model employed while simultaneously showcasing the robustness of our methodology, which incorporates the largest time series constructed to date for this purpose. By bridging these complementary perspectives—percentage trends and absolute quantifications—our work stands out as a comprehensive and practical resource for understanding and addressing the effects of climatic influences on solar energy production across Greece. This convergence strengthens the scientific foundation of both studies while positioning our work as a critical contribution to the field, especially for stakeholders seeking actionable insights.
The rate of change in produced PV energy in kWh/kWp varies significantly across different regions in Greece, with some areas experiencing increases and others decreases. This variation can be attributed to several factors, including differences in local climate conditions, solar radiation levels, and the specific characteristics of each region. There is a possible correlation between the climate simulations and the observed changes in PV energy production. The models take into account various climatic variables such as temperature, solar radiation, and cloud cover, which directly impact the efficiency and output of PV systems. Therefore, the regional differences in PV energy production rates are likely influenced by these climatic factors as projected by the different models. The similarity in the numbers suggests that the changes in PV energy production are relatively small across different regions and scenarios. This indicates that while there are variations, the overall impact of climate change on PV power generation might not be drastic in any single region. The changes are mostly within a narrow range, which could imply that the models are capturing consistent trends in climatic variables affecting solar power generation. The consistency in the numbers across different regions and models might also suggest that the factors influencing PV energy production, such as solar radiation and temperature, are relatively stable or change in a predictable manner across these regions. This could be useful for planning and optimizing PV installations, as it provides a more reliable basis for predicting future energy production. The similarity in the numbers highlights the importance of considering regional climatic conditions and using multiple models to gain a comprehensive understanding of the potential impacts on PV power generation. This approach can help in making more informed decisions for sustainable energy planning.
However, the impact is still rather small at present, but enough to be noticeable and to motivate further extensive study. In summary, the correlation between climate simulations and PV energy production highlights the importance of considering regional climatic conditions when planning and optimizing PV installations. This ensures that the potential impacts of climate change on solar power generation are adequately addressed and mitigated, especially since PV installations are among the key technologies adopted by the Greek Government for achieving the net zero target in 2050.
In addition, another very good agreement between our findings and those reported in [68] is also observed, where, in the context of solar energy, the satellite-based CLARA-A3 climate data record provides valuable insights into trends across Europe (SARAH data are better for such climatological studies as compared to CLARA-A3; however, the data are only open-access available at point-based requests [69]). This study investigates recent trends in surface incoming solar radiation (SIS) and cloud properties across Europe from 1982 to 2020. The findings also indicate a significant increase in SIS during spring and early summer, particularly in April and June, matching the pattern shown on our GHI map (Figure 5). This increase is accompanied by a decrease in daytime cloud fraction and cloud optical thickness, suggesting that clouds are playing an increasingly important role in defining favorable and unfavorable climate regimes for solar energy applications. The general trend of increasing sunlight availability could help boost solar energy applications in Greece, which has significant potential due to its sunny climate. Nevertheless, such opportunities will need to be balanced with the increasing frequency of extreme weather, which could introduce challenges for energy infrastructure resilience.
The issue of climate change-related mortality is also a growing concern for Greece. A study on heat-related and cold-related mortality across 854 European cities [70] suggests that, under climate change scenarios, Greece and other Mediterranean countries will face a substantial increase in heat-related deaths. This referenced research found that while colder regions of Europe might see a decrease in cold-related mortality, this will be far outweighed by the increase in deaths due to extreme heat, especially under high emissions and limited adaptation scenarios. The projections from the aforementioned referenced study for the period between 2015 and 2099 estimate a net increase of nearly 50% in climate-related deaths in Europe. Regional differences suggest a slight net decrease in death rates in Northern European countries but highlight the high vulnerability of the Mediterranean region, including Greece, and Eastern Europe. Greece, with its hot summers and a growing population of elderly people, is particularly at risk. The study emphasizes that, unless strong mitigation and adaptation measures are implemented, most European cities, including those in Greece, are expected to experience an increase in temperature-related mortality burdens. Adaptation measures, such as improved infrastructure, cooling systems, and better public health response strategies, could help mitigate these risks but are not sufficient to fully offset the negative effects of unchecked climate change.
The latest research and reports on climate change indicate that Greece, like much of southern Europe, faces significant risks due to climate impacts, with consequences for various sectors, including public health, energy, and agriculture. According to the latest Intergovernmental Panel on Climate Change (IPCC) findings [71], Greece is one of the regions most vulnerable to climate change. The Mediterranean, where Greece is located, is identified as a “climate change hotspot” with increasing temperatures, rising sea levels, and frequent extreme weather events such as heatwaves and forest fires. Specifically, average annual temperatures in Greece have been rising since the 1960s, with the most rapid increases occurring in summer and autumn, as we also identify. By 2050, the country is expected to experience significantly more heatwaves annually, potentially leading to severe urban heat island effects in cities. The increased frequency of wildfires and droughts, combined with rising temperatures, will further strain the environment, biodiversity, and agricultural sectors. Coastal areas in Greece are particularly vulnerable to sea-level rise, which threatens infrastructure and ecosystems. In terms of agriculture, changes in precipitation patterns and rising temperatures are expected to impact crop yields, further compounding the challenges posed by climate change.
In conclusion, Greece faces significant challenges from climate change, including higher temperatures, more frequent extreme weather events, and health risks related to heatwaves. While opportunities for solar energy exist, especially with increased solar radiation, these must be weighed against the vulnerabilities of the region, particularly in terms of infrastructure, public health, and agriculture. Addressing these challenges will require robust adaptation and mitigation strategies to safeguard both human health and the environment.
In 2023, Greece demonstrated a remarkable performance in domestic PV power production when assessed relative to national electricity supply, ranking first in Europe in terms of the percentage of domestic electricity produced by photovoltaics. Specifically, the contribution of solar PV to meeting Greece’s domestic energy needs exceeded the European average—registering a figure that was more than double the European norm (8.6%) and more than three times the global average (5.4%). It is important to emphasize that this ranking is based on the proportion of energy produced domestically via solar PV, rather than overall installed PV capacity. For context, while Germany leads Europe in total installed capacity (approximately 88.9 GW as of the end of 2023), the present claim pertains only to the metric of domestic production efficiency. In parallel with this outstanding performance, solar PV in Greece is estimated to have averted 5.7 million tons of CO2 in 2023—equivalent to the annual emissions from 4.6 million new internal combustion engine automobiles (each averaging a 10,000 km annual travel distance) or, alternatively, to the carbon sequestration potential of planting 147.6 million conifers or 90.1 million deciduous trees and allowing them to grow over a decade. Furthermore, in 2023 alone, new solar PV projects in Greece attracted investments of EUR 1.12 billion (USD 1.19 billion) and supported the creation of approximately 15,840 full-time equivalent jobs [72,73].
In 2024, Greece continued its momentum in expanding solar energy capacity. The country added 400 MW of new net-metered PV systems, bringing the cumulative distributed solar capacity to 850 MW by the year’s end. This growth was driven by both commercial (300 MW) and residential installations (100 MW), despite the shift from net metering to net billing. Additionally, large-scale projects such as the Chronus Kozani Solar PV Park, the largest in Greece and in the Balkans as well, with 140 MW of capacity, contributed to the country’s overall progress [74,75].
Our findings offer a nuanced understanding of regional variations in PV energy production and their implications for energy policy and investment. While previous studies focused on national or global trends, our regional analysis provides specific insights for targeted interventions and optimizing PV energy production across Greece. This study also highlights the importance of nowcasting, which provides real-time information on solar irradiance availability, crucial for managing energy loads and ensuring a stable power supply. Accurate solar forecasts can help reduce carbon emissions by allowing electricity network operators to integrate more renewable energy into the power grid. By providing accurate short-term forecasts, nowcasting can make solar farms more profitable and efficient. Understanding the correlations between solar energy production, balancing energy needs, and market dynamics is essential for developing strategies to optimize PV energy production nationwide.

5. Conclusions

In drawing our investigation to a close, regarding the rate of change in GHI over Greece in the last 20 years, three months are worth mentioning in particular: April, June, and December. We could define the rate of change in the rate of change in GHI, or the second derivative of GHI with respect to time, that signifies the acceleration or deceleration of changes in solar irradiance. This can provide insights into the dynamics of solar energy availability, such as predicting solar power fluctuations, understanding rapidly changing weather conditions, and optimizing solar energy systems for efficiency and resilience. A trend is observed for an increase in the rate of change in GHI in April as we move from top to bottom along the North–South axis of Greece. This is probably related to climate change and rising temperatures that modify the circulation of air masses, resulting in less dust than usual arriving from North Africa and thus causing less scattering and providing more available sunlight. In June, over mainland Greece, the rate of change in the GHI decreases, while over the Aegean Sea, it increases—events that are associated with climate change and indicate, respectively, the ever-increasing temperatures that cause drought and increasing evaporation of water masses, the resulting creation of more cloud cover, etc. Finally, in December, the reverse pattern is observed compared to April, where a tendency is evident for an increase in the rate of change in GHI as we move from bottom to top along the North–South axis of Greece. The faster warming rate in northern Greece compared to the south can be attributed to the geographical difference, as northern Greece is more inland and less influenced by the moderating effects of the sea, leading to more pronounced temperature changes. Additionally, climate change impacts, such as reduced frost days and increased heatwaves, are more intense in northern regions.
Understanding the spatial distribution of solar irradiance and its subsequent impact on power potential is crucial for various applications. Identifying regions with high solar irradiance aids in the planning and optimization of solar power plants and PV installations. This information is also vital for climate modeling, understanding the Earth’s energy balance, and influencing agricultural productivity. Our study highlights how environmental factors and human activities influence the rate of change in GHI in Greece over the last 20 years, reflecting broader trends in climate change and atmospheric conditions. Regions such as East Macedonia and Thrace and Central Macedonia exhibit negative rates of change, suggesting a decline in PV energy production. Conversely, regions like Attica, Peloponnese, and Crete show positive rates of change, indicating an increase in PV energy production, likely due to favorable climatic conditions. Areas like Thessaly and Epirus show relatively stable conditions for PV energy production with minor fluctuations. These findings contribute considerably to understanding the regional dynamics of PV production in Greece and offer actionable insights for policymakers and stakeholders to optimize solar energy utilization. Positive trends in regions like Attica and Peloponnese could serve as benchmarks for other areas, while negative trends in regions like East Macedonia and Thrace warrant further investigation to identify and mitigate underlying causes.
The data suggest a tailored approach to energy policy, considering regional variations in energy production potential and area requirements. Significant regional variations in energy production potential and the percentage of each region’s area needed to meet 100% of energy demand are also specifically revealed. These findings are crucial for informing energy policies and investment decisions. Tailored investments in renewable energy infrastructure across different regions can optimize financial returns and emission savings, supporting Greece’s overall energy strategy. For instance, regions with high energy production potential, low area requirements, high financial returns, and substantial emission savings, such as Central Macedonia and Thessaly, should be prioritized for renewable energy investments. The environmental benefits of renewable energy projects in regions with significant emission savings, such as Central Macedonia and Attica, are highlighted. However, due to its high consumption, Attica needs targeted energy efficiency measures to reduce or at least optimize the area required to meet energy demand. Regions with high potential, like Western Macedonia, East Macedonia and Thrace, and Epirus, should also be serious candidates for solar energy investments owing to their high energy adequacy percentages. Regions with notable disparities, such as Western Greece, require focused efforts to improve energy production efficiency.
With the ambitious forecast of up to 13.9 GW in solar capacity by 2027, Greece is on track to solidify its position as a renewable energy leader in Europe. By addressing all the regional disparities that this manuscript highlights, Greece can enhance its overall PV energy production and contribute more effectively to its renewable energy goals. These insights can guide policymakers in making informed decisions to optimize energy production and meet regional demands efficiently. Solar energy’s potential as a sustainable and efficient source is immense. Our findings emphasize solar energy’s feasibility in meeting national and worldwide energy demands. Optimizing photovoltaic installations and investments can achieve significant financial and environmental benefits, contributing to the global fight against climate change.

Author Contributions

Conceptualization, P.G.K.; methodology, P.G.K.; validation, P.G.K.; formal analysis, S.V.; investigation, S.V.; resources, P.G.K. and S.V.; data curation, S.V.; writing—original draft preparation, S.V.; writing—review and editing, P.G.K. and S.V.; visualization, S.V.; supervision, P.G.K.; project administration, P.G.K.; funding acquisition, P.G.K. All authors have read and agreed to the published version of the manuscript.

Funding

This research received no external funding.

Data Availability Statement

Data can be available upon request from the corresponding author, Dr. Kosmopoulos.

Acknowledgments

Both authors acknowledge the projects: “Support for Enhancing the Operation of the National Network for Climate Change (CLIMPACT)”, National Development Program, General Secretariat of Research and Innovation, Greece (2023ΝA11900001—Ν. 5201588) and the project “ThinkingEarth”, funded under Grant Agreement number 101130544 by the Horizon Europe programme topic HORIZON-EUSPA-2022-SPACE-02-55, that promotes the large-scale Copernicus data uptake with AI and HPC.

Conflicts of Interest

The authors declare no conflicts of interest.

Appendix A

Estimation of per-1 kWp Metrics and Sensitivity Analysis

The values reported in the following Table A1 and Table A2 represent the 20-year average annual photovoltaic energy yield per 1 kWp and the derived economic and environmental metrics on a per-unit basis. For each region, the annual PV output (in kWh/year per 1 kWp) was computed from calibrated long-term simulation data. To capture the uncertainty in these estimates, we propagate the relative errors based on the radiative transfer model (FRTM) comparisons with ground-truth measurements. As already mentioned in the Methodology Section (2.2), in the clear-sky case, a 2% uncertainty is applied, while for all-sky conditions, a 5% uncertainty is used. The long-term (20-year) average global horizontal irradiance values, originally provided in W/m2, are converted into annual irradiation (in kWh/m2/year) by multiplying by 8.76 (derived from 8760 h per year). Revenue is estimated by applying the feed-in tariff of EUR 54 per MWh (equivalent to EUR 0.054/kWh) to the per-1 kWp PV output, and the avoided CO2 emissions are calculated using the conversion factor of 0.0007 metric tons CO2 per kWh. This comprehensive procedure propagates the uncertainty from the instantaneous measurements through to the annual climatological, economic, and environmental outcomes, ensuring robust error bounds and sensitivity analyses that underpin our results. These per-unit metrics serve as the basis for subsequent “scaling-up” analyses and sensitivity studies. Note that all uncertainty figures (Δ(PVoutput), Δ(Revenue), and Δ(CO2) avoided) are expressed on a per-kWp basis and can be aggregated as needed for regional evaluations.
Table A1. Twenty-Year Average Solar Resource Metrics per 1 kWp: PV Output (kWh), GHI (W/m2 and kWh/m2), and Annual Energy Errors under Clear-Sky (2%) and All-Sky (5%) Conditions.
RegionPVoutput (kWh)GHI (W/m2)GHI (kWh/m2)Clear Sky Annual Error (2%) (kWh/m2)All Sky Annual Error (5%) (kWh/m2)
EastMac&Thrc1548.41200.891759.8235.2087.99
CentrMac1544.36197.211727.5634.5586.38
WestMac1532.19186.151630.6632.6181.53
Epirus1541.94195.011708.3034.1785.41
Thessaly1547.51200.071752.6335.0587.63
CentrGR1557.62209.261833.1236.6691.66
IonianIslands1557.07208.771828.7936.5891.44
WestGR1556.79208.501826.5036.5391.32
Peloponnese1561.72212.991865.7837.3293.29
Attica1571.72222.081945.4538.9197.27
NorthAegean1580.20229.792012.9440.26100.65
SouthAegean1596.61244.712143.6642.87107.18
Crete1596.23244.362140.6042.81107.03
Table A2. Twenty-Year Average Uncertainty Metrics per 1 kWp: Δ(PVoutput) (kWh), Δ(Revenue) (€/kWh), and Δ(CO2) (metric tons) under Clear-Sky (2%) and All-Sky (5%) Conditions.
RegionΔ(PVoutput) (2%) (kWh)Δ(PVoutput) (5%) (kWh)Δ(Revenue) (2%) (€/kWh)Δ(Revenue) (5%) (€/kWh)Δ(CO2) (2%) (metric tons)Δ(CO2) (5%) (metric tons)
EastMac&Thrc30.9777.421.674.180.0220.054
CentrMac30.8977.221.674.170.0220.054
WestMac30.6476.611.654.140.0210.054
Epirus30.8477.101.674.160.0220.054
Thessaly30.9577.381.674.180.0220.054
CentrGR31.1577.881.684.210.0220.055
IonianIslands31.1477.851.684.200.0220.054
WestGR31.1477.841.684.200.0220.054
Peloponnese31.2378.091.694.220.0220.055
Attica31.4378.591.704.240.0220.055
NorthAegean31.6079.011.714.270.0220.055
SouthAegean31.9379.831.724.310.0220.056
Crete31.9279.811.724.310.0220.056
Figure A1 presents a comparative analysis of SOLEA 3D and SODA against BSRN ground station measurements, with errors quantified in terms of mean bias error (MBE) and root mean square error (RMSE) in W/m2 across different seasons and sky conditions. The results indicate that SOLEA 3D consistently achieves lower error margins, reinforcing its accuracy in real-time solar radiation modeling.
Figure A1. A depiction, adapted with permission from [12], of the variation in real-time simulations from SOLEA 3D and SODA compared against BSRN ground stations for each season and sky condition. The simulation MBE and RMSE have been expressed in absolute units (W/m2). The seasons are abbreviated as Wtr (Winter), Spg (Spring), Smr (Summer), and Ann (Annual).
Atmosphere 16 00762 g0a1
SOLEA 3D consistently outperforms SODA across all evaluated stations and sky conditions, with significantly lower MBE and RMSE, making it the more reliable option. In Budapest, SOLEA 3D demonstrates reduced bias and error, particularly under all-sky conditions where its MBE ranges from −12.48 to −6.00 and RMSE from 47.59 to 59.19, compared to SODA’s higher MBE of −20.31 to −12.30 and RMSE of 68.39 to 87.97. Under clear-sky, SOLEA 3D maintains an MBE of −13.13 to −7.78 and RMSE of 46.42 to 57.22, while SODA shows greater inaccuracies, with MBE of −20.64 to −11.73 and RMSE of 66.62 to 85.25. Even under cloud-sky, SOLEA 3D keeps a controlled MBE (−0.29 to 1.60) and RMSE (10.37 to 21.93), while SODA has MBE values in the range of −0.57 to −1.76, and significantly higher RMSE (15.48 to 36.94). It is evident that SOLEA 3D outperforms SODA by reducing bias and error substantially and maintaining lower errors, thus making it more reliable.
In Cabauw, SOLEA 3D lowers errors under all-sky conditions, with MBE from −16.07 to −2.49 and RMSE from 43.84 to 85.78, whereas SODA exhibits higher MBE (−23.49 to −9.24) and RMSE (62.62 to 99.16). Under clear-sky, SOLEA 3D significantly reduces bias, with MBE of −4.54 to −0.14 and RMSE of 30.61 to 58.53, compared to SODA’s MBE (−15.67 to −4.34) and RMSE (42.41 to 79.09). In cloud-sky, SOLEA 3D maintains lower errors (MBE: −11.53 to −2.27, RMSE: 31.19 to 62.34), while SODA has higher RMSE (38.49 to 59.81). Again, SOLEA 3D provides noticeably lower errors and significantly reduces bias, and it is superior in RMSE performance.
For Cener, SOLEA 3D exhibits improved accuracy, particularly under all-sky conditions, with an MBE range of −20.54 to −5.51 and RMSE of 47.11 to 90.40, while SODA records higher MBE (−22.69 to −6.98) and RMSE (57.86 to 109.37). Under clear-sky, SOLEA 3D keeps MBE at −19.54 to −5.03 and RMSE at 45.19 to 86.95, significantly outperforming SODA (MBE: −20.18 to −6.18, RMSE: 54.51 to 102.40). Under cloud-sky, SOLEA 3D achieves lower errors (MBE: −1.83 to −0.48, RMSE: 13.20 to 27.57), outperforming SODA (MBE: −2.50 to 0.25, RMSE: 19.39 to 38.41). SOLEA 3D shows improved accuracy, better handles clear-sky conditions and has lower errors, proving its reliability.
In Payerne, SOLEA 3D proves its superiority in all-sky conditions, with MBE ranging from −24.80 to −6.70 and RMSE from 47.44 to 83.44, whereas SODA exhibits significantly higher MBE (−42.19 to −9.28) and RMSE (67.12 to 142.96). Under clear-sky, SOLEA 3D maintains lower errors (MBE: −25.24 to −6.43, RMSE: 46.37 to 81.24), compared to SODA (MBE: −42.19 to −8.62, RMSE: 64.59 to 138.08). Even under cloud-sky, SOLEA 3D offers lower MBE (−0.30 to 0.43) and RMSE (9.93 to 19.13), outperforming SODA (MBE: −0.96 to 0.41, RMSE: 18.24 to 37.07).
In Sonnblick, SOLEA 3D consistently outperforms SODA across all-sky conditions. Under all-sky conditions, SOLEA 3D achieves an MBE range of −27.24 to −11.29 and RMSE from 72.19 to 104.67, whereas SODA records higher errors, with MBE from −16.62 to −35.75 and RMSE from 98.73 to 141.54. In clear-sky conditions, SOLEA 3D maintains lower bias, with MBE from −24.18 to −15.58 and RMSE from 65.56 to 103.58, while SODA struggles, with MBE from −32.59 to −15.13 and RMSE from 88.73 to 140.11. Even in cloud-sky conditions, SOLEA 3D proves superior, with MBE from −5.53 to −0.64 and RMSE from 14.94 to 49.36, compared to SODA’s higher errors, with MBE from −8.35 to −0.63 and RMSE from 18.41 to 72.11.
Finally, in Tamanrasset, SOLEA 3D continues to demonstrate its advantage. Under all-sky conditions, SOLEA 3D achieves an MBE range of −9.34 to −2.08 and RMSE from 23.53 to 49.77, while SODA records errors, with MBE from −7.34 to −2.39 and RMSE from 18.81 to 51.33. In clear-sky conditions, SOLEA 3D maintains bias, with MBE from −8.11 to −1.99 and RMSE from 21.69 to 43.25, whereas SODA demonstrates MBE from −6.49 to −2.01 and RMSE from 15.91 to 41.12. In cloud-sky conditions, SOLEA 3D exhibits MBE from −1.63 to −0.09 and RMSE from 9.02 to 24.41, compared to SODA’s errors, with MBE from −0.85 to −0.38 and RMSE from 10.03 to 30.72.
Summarizing all of the above across all the mentioned stations, SOLEA 3D consistently maintains lower RMSE values and mitigates bias better than SODA, proving its robustness in various atmospheric conditions and reinforcing its performance superiority.
To further contextualize this comparison, as demonstrated in a recent relevant validation study [76], satellite-based datasets such as SARAH-3 provide key performance metrics for solar radiation estimates, including bias, mean absolute deviation (MAD), RMSE, and anomaly correlation for surface incoming shortwave (SIS), surface incoming direct (SID), and direct normal irradiance (DNI) across multiple timescales at monthly and daily resolutions. These values serve as a benchmark for evaluating the reliability of satellite-derived solar radiation estimates. Notably, SARAH-3 exhibits strong anomaly correlation values (ranging from 0.89 to 0.96), demonstrating its consistency in capturing solar radiation variations. More specifically, SIS shows a small positive bias, with both monthly and daily bias values around +2.0 W/m2. The mean absolute difference (MAD) is 5.2 W/m2 (monthly) and 10.8 W/m2 (daily), while RMSE values increase from 7.0 W/m2 to 15.9 W/m2 as the resolution shifts from monthly to daily. The anomaly correlation remains consistently high at approximately 0.95. SID, representing indirect irradiance, displays lower deviations, with bias values at 0.5 W/m2 for both monthly and daily resolutions. The MAD values are 7.9 W/m2 (monthly) and 16.1 W/m2 (daily), with RMSE ranging from 11.3 W/m2 (monthly) to 24.1 W/m2 (daily). Anomaly correlation values hover around 0.92, indicating strong agreement with measurements. Finally, DNI shows a slight negative bias, with −1.6 W/m2 for monthly resolution and −0.2 W/m2 for daily resolution. The MAD values increase from 16.9 W/m2 (monthly) to 31.1 W/m2 (daily), while RMSE values rise from 22.3 W/m2 to 43.22 W/m2. Despite the variations, anomaly correlation values remain robust at around 0.91, demonstrating strong alignment with station observations. These findings highlight the consistency of SARAH-3 estimations with ground-based measurements, with slightly increased deviations at daily resolutions. However, SARAH-3 relies on conventional satellite retrieval methods that do not explicitly account for cloud stratification effects. By juxtaposing these findings with SOLEA 3D’s performance, this analysis underscores the robustness of the proposed method in enhancing accuracy across diverse atmospheric conditions. Concerning the accuracy statistics between the SARAH-3 and SOLEA-3D hindcast datasets, the levels and ranges of errors as compared to BSRN stations are not directly comparable, since in [76], the error metrics were averaged into monthly and daily basis with a time step of 30-min intervals, while in [12] into seasonal and annual basis at 15-min intervals. Additionally, in [12], a classification between sky conditions was performed, highlighting the improvement under cloudy conditions, and hence, a more analytical comparative analysis is going to be performed in the near future in a study under all geostationary satellite coverage and various retrieval/simulation methods.
The SARAH-3 dataset, including its validation metrics, is accessible via the CM SAF Web User Interface [69], ensuring transparency and reproducibility in solar radiation assessments. However, the primary motivation behind utilizing SOLEA 3D instead of SARAH-3 lies in its ability to incorporate multi-layer cloud stratification, a crucial factor in climate studies. Unlike traditional satellite-derived methods like SARAH-3, which often rely on broad radiative transfer approximations, SOLEA 3D accounts for the vertical distribution of clouds, which plays a dominant role in radiative transfer processes and improved accuracy, especially under cloudy conditions. It explicitly integrates cloud layering effects, refining solar radiation estimates under complex cloudy conditions. This distinction is particularly relevant for climate research, where cloud formations play a dominant role in radiative transfer processes. By explicitly integrating cloud stratification effects, SOLEA 3D enhances accuracy in scenarios where conventional satellite-derived datasets may exhibit limitations and pushes the boundaries of climate research, offering refined accuracy in scenarios where cloud formations significantly impact solar radiation variability.
In this study, we employed the fast radiative transfer model (FRTM) rather than relying solely on existing climate data records (e.g., CM SAF SARAH) because FRTM’s physics-based approach provides operational flexibility and an ideal temporal resolution framework that is particularly well suited for the analysis of 15-min irradiance values. While CM SAF SARAH has been specifically designed for climate applications and shows strong validation performance (e.g., against BSRN), its retrieval algorithms are developed with long-term climate trend analyses in mind. In contrast, FRTM enables us to seamlessly integrate detailed radiative transfer physics to capture short-term variability and to directly compare performance metrics with measurement-based assessments. For example, as demonstrated in [77], Thomas et al. (2016) [78] validated the latest version of HelioClim-3 (v5) against BSRN and reported relative RMSE (rRMSE) values of 14.1–37.2% for 15-min averages. These figures are directly comparable to the FRTM-derived results in [77], which yielded rRMSE values in the range of 12–35.7%—with individual station comparisons (Lerwick (LER), Toravere (TOR), Cabauw (CAB), Camborne (CAM), Carpentras (CAR), and Tamanrasset (TAM)) showing striking consistency between the two approaches. In particular, for the LER, TOR, CAB, CAM, CAR, and TAM stations, [78] found rRMSE values of 37.2, 33, 29.4, 25.9, 16.3, and 15.8%, while from the [77] model performance evaluation results, we observed 35.7, 35.6, 29.9, 30.3, 20.2, and 12.2% for the same stations. The results clearly show that the [77] method has a measurable advantage. While [78] reported a 15-min rRMSE range of 14.1–37.2% for HelioClim-3 (v5), the [77] multi-regression function (MRF) technique (developed as an analytical methodology using the aforementioned FRTM outputs) evaluation achieved a slightly tighter range of 12–35.7%. More specifically, for instance, at the LER station, the error drops from 37.2% to 35.7%, and even more notably at the TAM station, from 15.8% down to 12.2%. These improvements at key stations demonstrate that, overall [77], and the employed FRTM take the edge in terms of performance. Thus, although the SARAH dataset is an excellent tool for climate applications, its specific design constraints and the approximations required for long-term trend analysis were carefully considered. In our application context, FRTM provided both the temporal granularity and the robust performance necessary to effectively capture and evaluate high-frequency radiative transfer phenomena.
While this study establishes the reliability of SOLEA 3D in regional comparisons, future research will conduct a comprehensive validation across full Earth disk coverage, integrating observations from Meteosat, Himawari, and GOES satellites. This next phase will facilitate direct performance comparisons between SOLEA 3D, SARAH-3, and BSRN stations at global scales, further strengthening its applicability in diverse atmospheric conditions.

Appendix B

Appendix B.1. Multi-Layer Radiative Transfer in Cloud Atmospheres

Radiative transfer in a multi-layer cloud system [12] is governed by a fundamental equation that describes the propagation of radiation through atmospheric layers. This equation accounts for processes such as absorption, scattering, and emission, which influence the distribution of radiation within each layer.

Appendix B.2. Multi-Layer Radiative Transfer Equation

The radiative transfer equation for a multi-layer cloud atmosphere is given by
d I λ i τ , μ d τ = I λ i τ , μ + ω i 2   1 1 P i μ , μ I λ i τ , μ d μ + Β λ i τ
where:
  • I λ i τ , μ represents the specific intensity at optical depth τ in layer i.
  • ω i is the single scattering albedo, defining the fraction of light scattered rather than absorbed in layer i.
  • P i μ , μ is the scattering phase function that characterizes the angular redistribution of radiation in layer i.
  • Β λ i τ is the Planck function that describes thermal emission from layer i.
Each term in this equation captures a crucial physical interaction. The first term represents the attenuation due to absorption and outscattering. The second term integrates the incoming scattered radiation from all directions, weighted by the scattering phase function. The final term represents the thermal emission of the medium.

Appendix B.3. Cloud Layer Classifications and Explanations

Cloud layers are categorized into high, medium, and low clouds based on altitude, composition, and their effects on radiative transfer. High clouds (i = 1), such as cirrus, cirrostratus, and cirrocumulus, exist above approximately 6 km. These clouds are primarily composed of ice crystals, which efficiently scatter shortwave radiation. Due to their relatively low optical depth, they appear thin and allow most incoming solar radiation to pass through while trapping outgoing infrared radiation. This contributes significantly to the greenhouse effect, warming the lower atmosphere. Their primary impact on radiative transfer occurs in the longwave spectrum, altering Earth’s thermal balance.
Medium clouds (i = 2), such as altostratus and altocumulus, are found between approximately 2–6 km. These clouds contain both water droplets and ice crystals, leading to mixed scattering behaviors. Their optical depth is moderate, allowing them to affect both shortwave and longwave radiation. They are frequently associated with frontal systems and moderate precipitation. Their influence on radiative transfer is balanced between shortwave reflection and longwave trapping, contributing to cloud-induced climate feedback.
Low clouds (i = 3), including stratus, stratocumulus, and nimbostratus, typically exist below 2 km. They are predominantly composed of water droplets and exhibit high optical depth, making them highly reflective. These clouds play a crucial role in cooling Earth’s surface by reflecting a significant portion of incoming solar radiation back into space. Their impact on radiative transfer is primarily through shortwave reflection, reducing surface temperatures and enhancing planetary albedo.

Appendix B.4. Boundary Conditions

In the multi-layer framework, several boundary conditions dictate the interaction of radiation within and beyond the cloud system. At the top of the atmosphere, incoming solar radiation is attenuated as it travels through the cloud layers. The interaction at this boundary is described by
I λ t o p = I λ i n c e τ t o p
where I λ i n c represents the incident solar flux, and τtop is the optical thickness of the uppermost layer.
At each cloud layer interface, radiative transfer must satisfy continuity conditions to ensure proper energy exchange between layers (inter-layer continuity). These continuity conditions dictate how radiation propagates vertically, ensuring a seamless transmission and reflection process across adjacent layers.
At the surface, radiation is subject to ground reflection, absorption, and emission processes. The ground may act as either an absorber or a secondary emitter, influencing the overall radiative balance within the system (surface interaction).

Appendix C

Limitations and Refinement of PVGIS Calibration Utilized

The PV production estimates presented here are based on a PVGIS calibration methodology that integrates multiple physical parameters—such as global horizontal irradiance, ambient temperature, and detailed panel specifications—to simulate photovoltaic output at high temporal resolution. This empirical approach, while effective for regional-scale analyses and supported by comparisons with field data (e.g., from Athens), relies solely on calibration data from specific geographic points, which may limit its ability to capture the full intra-country variability inherent in Greece’s diverse climates and terrains. Consequently, the resulting estimates should be interpreted as a first-order approximation suitable for illustrating general trends and informing large-scale assessments, rather than as definitive inputs for detailed system design, performance evaluation, or precise energy planning. Future studies would benefit from incorporating additional calibration points or adopting more comprehensive, physics-based modeling techniques to enhance predictive accuracy and better address regional heterogeneity.
The aforementioned formulation, while straightforward, is limited by its derivation from geographically extreme conditions and may not represent the average performance over diverse regions. To overcome this limitation, one can combine empirical regression with a physically based normalization approach. Many studies calibrate PV yield (in kWh/kWp) versus incident solar irradiance (usually expressed as accumulated energy, such as W/m2 or kWh/m2 over a given period) using a linear regression model. In the generalized empirical regression model, multi-regional data points are used to determine the coefficients via regression analysis, resulting in a model of the following form:
EPV = α × GHI + β
where α represents an effective conversion factor that aggregates the panel’s intrinsic efficiency and typical system losses (e.g., wiring, inverter, shading, temperature effects) and adjusts for unit conversion (often incorporating the time integration of GHI), and β is a baseline term accounting for constant generation contributions (for instance, early morning/minimum production effects or other system-specific offsets).
An alternative formulation grounds the conversion in physical principles by expressing the PV energy yield as the product of incident irradiation on the tilted plane and a performance ratio that encompasses system losses. This approach is expressed as
EPV = PR × Htilted
Here, Htilted represents the accumulated solar irradiation on the module’s tilted surface, and PR (typically ranging from 0.70 to 0.85 for grid-connected crystalline silicon systems) accounts for losses such as inverter inefficiencies and temperature effects. For instance, if assumed that—in a typical Greek climate—the daily solar irradiation (properly adjusted for tilt) averages about 5 kWh/m2 with a mean PR of 0.75, then on an annual basis (multiplied by 365), the yield would be approximately: 5 × 365 × 0.75 ≈ 1369 kWh/kWp. This value lies in the same ballpark as the empirical offset in the original formulation. In effect, this can be “translated” into a linear relation of the following form:
EPV = ηeff × GHI + c
by appropriately choosing ηeff and c so that they “absorb” the effects of intermittency, temperature losses, and the conversion between instantaneous irradiance (W/m2) and cumulative energy (kWh/kWp). When aggregated over time, the conversion can indeed be approximated linearly with well-defined coefficients representative of average climatic and system conditions.
To further relate the global horizontal irradiance (GHI) to the effective irradiation received by the panels, a tilt conversion factor (Kₜ) can be introduced, leading to
EPV = PR × Kₜ × GHI
where Kt is a tilt conversion factor (or “irradiance boost”) that converts the measured horizontal irradiation into the effective irradiation received on the panel surface. For fixed, optimally tilted panels, empirical studies often find values in the range of about 1.0–1.2, with approximately 1.1 being a reasonable average. This physically based formulation is later reconciled with the linearized empirical form by choosing parameters that absorb the effects of system losses, tilt, and unit conversion appropriately. For instance, assuming nominal values of Kt = 1.1 and PR = 0.78 this time, the conversion becomes EPV (kWh/kWp) = 0.78 × 1.1 × GHI ≈ 0.86 GHI. Thus, for every 1 kWh/m2 of annual GHI, the energy yield is about 0.86 kWh/kWp. For an installation receiving, say, 1400 kWh/m2 per year, the modeled yield would be approximately 1204 kWh/kWp. This formulation is rooted in physical considerations, making it broadly applicable rather than being limited to a particular geographic calibration, ensuring that the conversion from solar irradiation to energy output is transparent, physically meaningful, and adaptable to other locations.
For even further refinement, additional physical parameters can be incorporated to enhance model accuracy. For example, a more comprehensive formulation that includes corrections for tilt effects and temperature variations is given by
EPV = [a × GHI + b] × Ftilt × [1 − γ × (Tamb − Tref)]
In this equation, a and b are parameters determined from a broad regression analysis, Ftilt is a correction factor for the actual tilt relative to the optimal orientation, Tamb is the ambient temperature, Tref is a reference temperature (typically 25 °C), and γ is the temperature coefficient of the PV modules (approximately 0.004–0.005 °C−1). This extended model not only generalizes the conversion to various climatic conditions but also provides a transparent interpretation of the underlying physical parameters and system losses. For the purposes of a study similar to the current one—if the emphasis is on reproducing PVGIS-like outputs—the additional factors could be “folded” into the coefficients. That is, by calibrating with data from many locations, the regression-derived a and b would already reflect the average effects of tilt, temperature, and other losses, yielding a final form similar in structure to the original equation but with generalized calibration.
In summary, bridging empirical regression with physics-based normalization allows the conversion model to move beyond the limitations of a two-point calibration. The process—from starting with the empirically derived equation, through incorporating multi-regional regression to determine robust coefficients, to translating the relationship into a physics-based formulation with explicit correction factors—results in a comprehensive framework. This framework is adaptable for national-scale analyses and provides a firm foundation for further refinement through sensitivity analyses and the integration of site-specific adjustments [79,80,81,82,83,84,85].

References

  1. Stamatis, M.; Hatzianastassiou, N.; Korras-Carraca, M.-B.; Matsoukas, C.; Wild, M.; Vardavas, I. How strong are the links between global warming and surface solar radiation changes? Clim. Change 2024, 177, 156. [Google Scholar] [CrossRef]
  2. Wild, M.; Ohmura, A.; Makowski, K. Impact of global dimming and brightening on global warming. Geophys. Res. Lett. 2007, 34, L04702. [Google Scholar] [CrossRef]
  3. Soni, V.K.; Pandithurai, G.; Pai, D.S. Evaluation of long-term changes of solar radiation in India. Int. J. Climatol. 2012, 32, 540–551. [Google Scholar] [CrossRef]
  4. Hou, X.; Wild, M.; Folini, D.; Kazadzis, S.; Wohland, J. Climate change impacts on solar power generation and its spatial variability in Europe based on CMIP6. Earth Syst. Dynam. 2021, 12, 1099–1113. [Google Scholar] [CrossRef]
  5. Müller, S.; Remund, J. Satellite based shortest term solar energy forecast system for entire Europe for the next hours. In Proceedings of the 29th European Photovoltaic Solar Energy Conference and Exhibition, EUREC, Amsterdam, The Netherlands, 22–26 September 2014; pp. 2589–2590. [Google Scholar]
  6. Greece Installs 2.6 GW of PV Capacity in 2024. pv Magazine—Photovoltaics Markets and Technology. Available online: https://www.pv-magazine.com/2025/02/05/greece-installs-2-6-gw-of-pv-capacity-in-2024/ (accessed on 25 February 2025).
  7. Greece Unveils Revised National Energy and Climate Plan: Aiming for Carbon Neutrality by 2050. Greek News Agenda. Available online: https://www.greeknewsagenda.gr/greece-revised-national-energy-and-climate-plan/ (accessed on 25 November 2024).
  8. Energy Storage Is the Real Game Changer in Greece. PV Tech. Available online: https://www.pv-tech.org/energy-storage-real-game-changer-greece/ (accessed on 17 November 2024).
  9. Kitsara, G.; Papaioannou, G.; Papathanasiou, A.; Retalis, A. Dimming/brightening in Athens: Trends in Sunshine Duration, Cloud Cover and Reference Evapotranspiration. Water Resour. Manag. 2013, 27, 1623–1633. [Google Scholar] [CrossRef]
  10. Founda, D.; Pierros, F.; Sarantopoulos, A. Evidence of Dimming/Brightening Over Greece from Long-Term Observations of Sunshine Duration and Cloud Cover. In Perspectives on Atmospheric Sciences. Springer Atmospheric Sciences; Karacostas, T., Bais, A., Nastos, P., Eds.; Springer: Cham, Switzerland, 2017. [Google Scholar] [CrossRef]
  11. Panagea, I.S.; Tsanis, I.K.; Koutroulis, A.G.; Grillakis, M.G. Climate Change Impact on Photovoltaic Energy Output: The Case of Greece. Adv. Meteorol. 2014, 2014, 264506. [Google Scholar] [CrossRef]
  12. Kosmopoulos, P.; Dhake, H.; Melita, N.; Tagarakis, K.; Georgakis, A.; Stefas, A.; Vaggelis, O.; Korre, V.; Kashyap, Y. Mul-ti-Layer Cloud Motion Vector Forecasting for Solar Energy Applications. Appl. Energy 2024, 353, 122144. [Google Scholar] [CrossRef]
  13. Sifakis, N.I.; Iossifidis, C.; Kontoes, C.; Keramitsoglou, I. Wildfire Detection and Tracking over Greece Using MSG-SEVIRI Satellite Data. Remote Sens. 2011, 3, 524–538. [Google Scholar] [CrossRef]
  14. Bedka, K.M. Overshooting cloud top detections using MSG SEVIRI infrared brightness temperatures and their relationship to severe weather over Europe. Atmos. Res. 2011, 99, 175–189. [Google Scholar] [CrossRef]
  15. Copernicus Atmosphere Monitoring Service (CAMS). Available online: https://atmosphere.copernicus.eu/global-forecast-plots (accessed on 15 August 2024).
  16. CAMS Radiation Service—SoDa. Available online: https://www.soda-pro.com/web-services/radiation/cams-radiation-service (accessed on 15 August 2024).
  17. CAMS-AOD—SoDa. Available online: https://www.soda-pro.com/web-services/atmosphere/cams-aod (accessed on 15 August 2024).
  18. Eskes, H.; Gaudel, A.; Griesfeller, J.; Jones, L.; Kapsomenakis, J.; Katragkou, E.; Kinne, S.; Langerock, B.; Razinger, M.; Richter, A.; et al. Validation of reactive gases and aerosols in the MACC global analysis and forecast system. Geosci. Model Dev. 2015, 8, 3523–3543. [Google Scholar] [CrossRef]
  19. Derrien, M.; Le Gléau, H. MSG/SEVIRI cloud mask and type from SAFNWC. Int. J. Remote Sens. 2005, 26, 4707–4732. [Google Scholar] [CrossRef]
  20. Roebeling, R.A.; Feijt, A.J.; Stammes, P. Cloud property retrievals for climate monitoring: Implications of differences between Spinning Enhanced Visible and Infrared Imager (SEVIRI) on METEOSAT-8 and Advanced Very High Resolution Radiometer (AVHRR) on NOAA-17. J. Geophys. Res. 2006, 111, D20210. [Google Scholar] [CrossRef]
  21. Kosmopoulos, P.; Dhake, H.; Kartoudi, D.; Tsavalos, A.; Koutsantoni, P.; Katranitsas, A.; Lavdakis, N.; Mengou, E.; Kashyap, Y. Ray-Tracing modeling for urban photovoltaic energy planning and management. Appl. Energy 2024, 369, 123516. [Google Scholar] [CrossRef]
  22. Kosmopoulos, P.; Kouroutsidis, D.; Papachristopoulou, K.; Raptis, P.I.; Masoom, A.; Saint-Drenan, Y.-M.; Blanc, P.; Kontoes, C.; Kazadzis, S. Short-Term Forecasting of Large-Scale Clouds Impact on Downwelling Surface Solar Irradiation. Energies 2020, 13, 6555. [Google Scholar] [CrossRef]
  23. Choudhury, G.; Block, K.; Haghighatnasab, M.; Quaas, J.; Goren, T.; Tesche, M. Pristine oceans are a significant source of uncertainty in quantifying global cloud condensation nuclei, Atmos. Chem. Phys. 2025, 25, 3841–3856. [Google Scholar] [CrossRef]
  24. Block, K.; Haghighatnasab, M.; Partridge, D.G.; Stier, P.; Quaas, J. Cloud condensation nuclei concentrations derived from the CAMS reanalysis. Earth Syst. Sci. Data 2024, 16, 443–470. [Google Scholar] [CrossRef]
  25. Zhang, L.; Wang, X.; Huang, G.; Zhang, S. Comprehensive Assessment and Analysis of the Current Global Aerosol Optical Depth Products. Remote Sens. 2024, 16, 1425. [Google Scholar] [CrossRef]
  26. Garrigues, S.; Remy, S.; Chimot, J.; Ades, M.; Inness, A.; Flemming, J.; Kipling, Z.; Laszlo, I.; Benedetti, A.; Ribas, R.; et al. Monitoring multiple satellite aerosol optical depth (AOD) products within the Copernicus Atmosphere Monitoring Service (CAMS) data assimilation system, Atmos. Chem. Phys. 2022, 22, 14657–14692. [Google Scholar] [CrossRef]
  27. HEDNO, S.A. (Hellenic Electricity Distribution Network Operator S.A.). Available online: https://deddie.gr/en/ (accessed on 11 November 2024).
  28. Pawlowicz, R. M_Map: A Mapping Package for MATLAB, Version 1.4m, [Computer Software]. 2020. Available online: https://www-old.eoas.ubc.ca/~rich/map.html (accessed on 17 October 2024).
  29. Mayer, B.; Kylling, A. Technical note: The libRadtran software package for radiative transfer calculations—Description and examples of use. Atmos. Chem. Phys. 2005, 5, 1855–1877. [Google Scholar] [CrossRef]
  30. Emde, C.; Buras-Schnell, R.; Kylling, A.; Mayer, B.; Gasteiger, J.; Hamann, U.; Kylling, J.; Richter, B.; Pause, C.; Dowling, T.; et al. The libRadtran software package for radiative transfer calculations (version 2.0.1). Geosci. Model Dev. 2016, 9, 1647–1672. [Google Scholar] [CrossRef]
  31. Photovoltaic Geographical Information System. Available online: https://re.jrc.ec.europa.eu/pvg_tools/en/ (accessed on 22 October 2024).
  32. Sethi, D.; Kosmopoulos, P.G. Rooftop Solar Photovoltaic Potential in Polluted Indian Cities: Atmospheric and Urban Impacts, Climate Trends, Societal Gains, and Economic Opportunities. Remote Sens. 2025, 17, 1221. [Google Scholar] [CrossRef]
  33. Dhake, H.; Kosmopoulos, P.; Mantakas, A.; Kashyap, Y.; El-Askary, H.; Elbadawy, O. Climatological Trends and Effects of Aerosols and Clouds on Large Solar Parks: Application Examples in Benban (Egypt) and Al Dhafrah (UAE). Remote Sens. 2024, 16, 4379. [Google Scholar] [CrossRef]
  34. Vigkos, S.; Kosmopoulos, P.G. Photovoltaics Energy Potential in the Largest Greek Cities: Atmospheric and Urban Fabric Effects, Climatic Trends Influences and Socio-Economic Benefits. Energies 2024, 17, 3821. [Google Scholar] [CrossRef]
  35. Kosmopoulos, P.G.; Mechilis, M.T.; Kaoura, P. Solar Energy Production Planning in Antikythera: Adequacy Scenarios and the Effect of the Atmospheric Parameters. Energies 2022, 15, 9406. [Google Scholar] [CrossRef]
  36. Dumka, U.C.; Kosmopoulos, P.G.; Patel, P.N.; Sheoran, R. Can Forest Fires Be an Important Factor in the Reduction in Solar Power Production in India? Remote Sens. 2022, 14, 549. [Google Scholar] [CrossRef]
  37. Dumka, U.C.; Kosmopoulos, P.G.; Ningombam, S.S.; Masoom, A. Impact of Aerosol and Cloud on the Solar Energy Potential over the Central Gangetic Himalayan Region. Remote Sens. 2021, 13, 3248. [Google Scholar] [CrossRef]
  38. Masoom, A.; Kosmopoulos, P.; Kashyap, Y.; Kumar, S.; Bansal, A. Rooftop Photovoltaic Energy Production Management in India Using Earth-Observation Data and Modeling Techniques. Remote Sens. 2020, 12, 1921. [Google Scholar] [CrossRef]
  39. Vigkos, S.; Kosmopoulos, P.G.; Papayannis, A. Solar Photovoltaic Energy Production Conditions in the Urban Environment of Athens, Cairo, Granada and Vienna. Environ. Sci. Proc. 2023, 26, 24. [Google Scholar] [CrossRef]
  40. Vigkos, S.; Kosmopoulos, P.G.; Papayannis, A. Conditions for Producing Solar Photovoltaic Energy in European and North African Cities. In Proceedings of the IGARSS 2024—2024 IEEE International Geoscience and Remote Sensing Symposium, Athens, Greece, 7–12 July 2024; pp. 3845–3849. [Google Scholar] [CrossRef]
  41. Greenhouse Gas Equivalencies Calculator|US EPA. Available online: https://www.epa.gov/energy/greenhouse-gas-equivalencies-calculator (accessed on 22 October 2024).
  42. Bellos, E. A geospatial comparative analysis of solar thermal concentrating power systems in Greece. Cleaner Energy Syst. 2023, 4, 100055. [Google Scholar] [CrossRef]
  43. Climatological Maps of Solar Energy in Greece. Laboratory of Atmospheric Physics of the University of Patras. Available online: https://www.atmosphere-upatras.gr/en/solarmaps (accessed on 28 October 2024).
  44. Global Solar Atlas. Available online: https://globalsolaratlas.info/map?c=38.358888,24.488525,6&r=GRC (accessed on 28 October 2024).
  45. SOLCAST. Solar Irradiance Data for Greece. Available online: https://www.solcast.com/solar-radiation-map/greece (accessed on 28 October 2024).
  46. Solea. Solar Atlas of Greece. Available online: https://solea.gr/solar-atlas-of-greece/ (accessed on 28 October 2024).
  47. Rasvanis, E.; Tselios, V. Do geography and institutions affect entrepreneurs’ future business plans? Insights from Greece. J. Innov. Entrep. 2023, 12, 3. [Google Scholar] [CrossRef]
  48. Katopodis, T.; Markantonis, I.; Politi, N.; Vlachogiannis, D.; Sfetsos, A. High-Resolution Solar Climate Atlas for Greece under Climate Change Using the Weather Research and Forecasting (WRF) Model. Atmosphere 2020, 11, 761. [Google Scholar] [CrossRef]
  49. Nikitidou, E.; Tzoumanikas, P.; Bais, A.F.; Kazantzidis, A. The Effect of Clouds on Surface Solar Irradiance, from an All-Sky Camera, in Thessaloniki, Greece. In Perspectives on Atmospheric Sciences. Springer Atmospheric Sciences; Karacostas, T., Bais, A., Nastos, P., Eds.; Springer: Cham, Switzerland, 2017. [Google Scholar] [CrossRef]
  50. Kouklaki, D.; Papachristopoulou, K.; Fountoulakis, I.; Tsekeri, A.; Raptis, P.-I.; Kazadzis, S.; Eleftheratos, K. Impact of Aerosols on Surface Solar Radiation and Solar Energy in the Mediterranean Basin. Environ. Sci. Proc. 2023, 26, 56. [Google Scholar] [CrossRef]
  51. Natsis, A.; Bais, A.; Meleti, C.; Tourpali, K. Long-term changes surface solar shortwave irradiance at Thessaloniki, Greece under clear- and all-sky conditions. AIP Conf. Proc. 2024, 2988, 060007. [Google Scholar] [CrossRef]
  52. Banias, G.; Lampridi, M.; Pediaditi, K.; Achillas, C.; Sartzetakis, E.; Bochtis, D.; Berruto, R.; Busato, P. Evaluation of environmental impact assessment framework effectiveness. Chem. Eng. Trans. 2017, 58, 805–810. [Google Scholar] [CrossRef]
  53. Cuevas-Agulló, E.; Barriopedro, D.; García, R.D.; Alonso-Pérez, S.; González-Alemán, J.J.; Werner, E.; Suárez, D.; Bustos, J.J.; García-Castrillo, G.; García, O.; et al. Sharp increase in Saharan dust intrusions over the western Euro-Mediterranean in February–March 2020–2022 and associated atmospheric circulation. Atmos. Chem. Phys. 2024, 24, 4083–4104. [Google Scholar] [CrossRef]
  54. Philippopoulos, K.; Deligiorgi, D.; Mavrakou, T.; Cheliotis, J. Winter atmospheric circulation patterns and their relationship with the meteorological conditions in Greece. Meteorol. Atmos. Phys. 2014, 124, 195–204. [Google Scholar] [CrossRef]
  55. Philippopoulos, K.; Tzanis, C.G.; Deligiorgi, D.; Alimissis, A. Climatology of the impact of atmospheric circulation on surface meteorological conditions over Greece. In Proceedings of the 17th International Conference on Environmental Science and Technology, CEST2021_00486, Athens, Greece, 1–4 September 2021. [Google Scholar]
  56. Song, Z.; Wang, M.; Yang, H. Quantification of the Impact of Fine Particulate Matter on Solar Energy Resources and Energy Performance of Different Photovoltaic Technologies. ACS Environ. Au. 2022, 2, 275–286. [Google Scholar] [CrossRef] [PubMed] [PubMed Central]
  57. Yoo, Y.; Cho, S. Analysis of the Impact of Particulate Matter on Net Load and Behind-the-Meter PV Decoupling. Electronics 2022, 11, 2261. [Google Scholar] [CrossRef]
  58. Hajat, S. Health effects of milder winters: A review of evidence from the United Kingdom. Environ. Health 2017, 16 (Suppl. 1), 109. [Google Scholar] [CrossRef]
  59. Kosmopoulos, P.G.; Kazadzis, S.; El-Askary, H.; Taylor, M.; Gkikas, A.; Proestakis, E.; Kontoes, C.; El-Khayat, M.M. Earth-Observation-Based Estimation and Forecasting of Particulate Matter Impact on Solar Energy in Egypt. Remote Sens. 2018, 10, 1870. [Google Scholar] [CrossRef]
  60. Greek Renewable Energy Market Outlook 2023–2024. WATTCROP. Available online: https://wattcrop.com/wp-content/uploads/2024/07/Greek-Renewable-Energy-Market-Outlook-2024.pdf (accessed on 8 November 2024).
  61. What Is the Carbon Footprint of Solar Panels? Solar.com. Available online: https://www.solar.com/learn/what-is-the-carbon-footprint-of-solar-panels/ (accessed on 26 November 2024).
  62. Regions of Greece. From Wikipedia, the Free Encyclopedia. Available online: https://en.wikipedia.org/wiki/Regions_of_Greece (accessed on 15 August 2024).
  63. Kosmopoulos, P.G.; Kazadzis, S.; Taylor, M.; Bais, A.F.; Lagouvardos, K.; Kotroni, V.; Keramitsoglou, I.; Kiranoudis, C. Estimation of the Solar Energy Potential in Greece Using Satellite and Ground-Based Observations. In Perspectives on Atmospheric Sciences. Springer Atmospheric Sciences; Karacostas, T., Bais, A., Nastos, P., Eds.; Springer: Cham, Switzerland, 2017. [Google Scholar] [CrossRef]
  64. Kambezidis, H.D. Annual and Seasonal Trends of Solar Radiation in Athens, Greece. J. Sol. Energy Res. Updates 2018, 5, 14–24. [Google Scholar] [CrossRef]
  65. Kambezidis, H.D. The Solar Radiation Climate of Greece. Climate 2021, 9, 183. [Google Scholar] [CrossRef]
  66. Eleftheratos, K.; Raptis, I.-P.; Kouklaki, D.; Kazadzis, S.; Fountoulakis, I.; Psiloglou, B.E.; Papachristopoulou, K.; Founda, D.; Benetatos, C.; Kazantzidis, A.; et al. The ASPIRE Project: Atmospheric Parameters Affecting Solar Irradiance and Solar Energy in Athens, Greece—Overview and Results. Environ. Sci. Proc. 2023, 26, 46. [Google Scholar] [CrossRef]
  67. Georgopoulou, E.; Mirasgedis, S.; Sarafidis, Y.; Giannakopoulos, C.; Varotsos, K.V.; Gakis, N. Climate Change Impacts on the Energy System of a Climate-Vulnerable Mediterranean Country (Greece). Atmosphere 2024, 15, 286. [Google Scholar] [CrossRef]
  68. Devasthale, A.; Andersson, S.; Engström, E.; Kaspar, F.; Trentmann, J.; Duguay-Tetzlaff, A.; Meirink, J.F.; Kjellström, E.; Landelius, T.; Thomas, M.A.; et al. Leveraging the satellite-based climate data record CLARA-A3 to understand trends and climate regimes relevant for solar energy applications over Europe. EGUsphere 2024. [Google Scholar] [CrossRef]
  69. Surface Radiation Data Set—Heliosat (SARAH)—Edition 3. Available online: https://wui.cmsaf.eu/safira/action/viewDoiDetails?acronym=SARAH_V003 (accessed on 18 May 2025).
  70. Masselot, P.; Mistry, M.N.; Rao, S.; Huber, V.; Monteiro, A.; Samoli, E.; Stafoggia, M.; De’dOnato, F.; Garcia-Leon, D.; Ciscar, J.-C.; et al. Estimating future heat-related and cold-related mortality under climate change, demographic and adaptation scenarios in 854 European cities. Nat. Med. 2025, 31, 1294–1302. [Google Scholar] [CrossRef]
  71. IPCC Sixth Assessment Report. Impacts, Adaptation and Vulnerability. Cross-Chapter Paper 4: Mediterranean Region. Available online: https://www.ipcc.ch/report/ar6/wg2/chapter/ccp4/ (accessed on 10 January 2025).
  72. Greek PV Market Statistics for 2023 (Updated: 19 February 2024). Hellenic Association of Photovoltaic Companies (HELAPCO). Available online: https://helapco.gr/xoorigle/2024/02/pv-stats_greece_2023_eng.pdf (accessed on 28 October 2024).
  73. Greece Adds 1.5 GW of New Solar in January–September Period. pv Magazine. Available online: https://www.pv-magazine.com/2024/09/30/greece-added-1-5-gw-of-new-solar-in-january-september-period/ (accessed on 28 October 2024).
  74. Greece Installs 400 MW of Net-Metered Solar in 2024. pv Magazine—Photovoltaics Markets and Technology. Available online: https://www.pv-magazine.com/2025/01/31/greece-adds-400-mw-of-solar-under-net-metering-in-2024/ (accessed on 10 February 2025).
  75. Capacity of the Largest Solar Photovoltaic Farms in Operation in Greece as of February 2024 (in Megawatts). Statista. Available online: https://www.statista.com/statistics/1454410/solar-energy-farms-by-capacity-greece/ (accessed on 10 February 2025).
  76. Pfeifroth, U.; Drücke, J.; Kothe, S.; Trentmann, J.; Schröder, M.; Hollmann, R. SARAH-3—Satellite-Based Climate Data Records of Surface Solar Radiation. Earth Syst. Sci. Data 2024, 16, 5243–5265. [Google Scholar] [CrossRef]
  77. Kosmopoulos, P.G.; Kazadzis, S.; Taylor, M.; Raptis, P.I.; Keramitsoglou, I.; Kiranoudis, C.; Bais, A.F. Assessment of surface solar irradiance derived from real-time modelling techniques and verification with ground-based measurements. Atmos. Meas. Tech. 2018, 11, 907–924. [Google Scholar] [CrossRef]
  78. Thomas, C.; Wey, E.; Blanc, P.; Wald, L.; Lefevre, M. Validation of HelioClim-3 version 4, HelioClim-3 version 5 and MACC-RAD using 14 BSRN stations. Energy Proced. 2016, 91, 1059–1069. [Google Scholar] [CrossRef]
  79. Liu, B.Y.H.; Jordan, R.C. The Interrelationship and Characteristic Distribution of Direct, Diffuse and Total Solar Radiation. Sol. Energy 1960, 4, 1–19. [Google Scholar] [CrossRef]
  80. Alsuhaibany, Y.; Li, Y. Estimation of Rooftop Solar Photovoltaic (PV) Potential: A Systematic Literature Review and Guidelines for Future Research. Emergent Res. Forum (ERF) Pap. 2017, 301371801, 1–10. [Google Scholar]
  81. Desthieux, G.; Carneiro, C.; Camponovo, R.; Ineichen, P.; Morello, E.; Boulmier, A.; Abdennadher, N.; Dervey, S.; Ellert, C. Solar Energy Potential Assessment on Rooftops and Facades in Large Built Environments Based on LiDAR Data, Image Processing, and Cloud Computing. Methodological Background, Application, and Validation in Geneva (Solar Cadaster). Front. Built Environ. 2018, 4, 14. [Google Scholar] [CrossRef]
  82. Tapia, M.; Ramos, L.; Heinemann, D.; Zondervan, E. Power to the city: Assessing the rooftop solar photovoltaic potential in multiple cities of Ecuador. Phys. Sci. Rev. 2022, 8, 2285–2319. [Google Scholar] [CrossRef]
  83. Elsinga, B.; van Sark, W.; Ramaekers, L. Inverse Photovoltaic Yield Model for Global Horizontal Irradiance Reconstruction. Energy Sci. Eng. 2017, 5, 226–239. [Google Scholar] [CrossRef]
  84. Solar Power Modelling. Available online: https://assessingsolar.org/notebooks/solar_power_modeling.html (accessed on 27 May 2025).
  85. Patel, P.T.; Sukhadiya, R.; Aparnathi, R. A Review of Solar Irradiation Calculation Methods for Solar Power Plant. J. Emerg. Technol. Innov. Res. (JETIR) 2019, 6, 1241–1250. [Google Scholar]
Figure 1. System architecture flowchart of the modified methodology of [12], appropriately adapted for the current climatological study.
Atmosphere 16 00762 g001
Figure 2. Comprehensive overview of research methodology and content flow.
Atmosphere 16 00762 g002
Figure 3. Regions of Greece [42] (left), and the most up-to-date PV power potential map of Greece (right). Optimized tilt refers to the angle at which the solar panels are installed to maximize their exposure to sunlight, thereby increasing their efficiency and energy output. The optimal tilt angle varies depending on the geographical location and the time of year. In Greece, the values range between 32° and 38°.
Atmosphere 16 00762 g003
Figure 4. Twenty-year monthly GHI trends by region in Greece.
Atmosphere 16 00762 g004
Figure 5. Monthly GHI distribution maps of Greece over a 20-year period.
Atmosphere 16 00762 g005
Figure 6. Monthly rate of change in GHI distribution maps of Greece over a 20-year period.
Atmosphere 16 00762 g006
Figure 7. (a) Possible maximum produced energy from PV coverage of a total surface equal to 1% of the total area of each region; and (b) the minimum percentage of required area that must be covered with PV in relation to the total area of each region, in order to achieve full coverage of energy needs.
Atmosphere 16 00762 g007
Table 1. Twenty-year monthly rate of change in GHI by region in Greece.
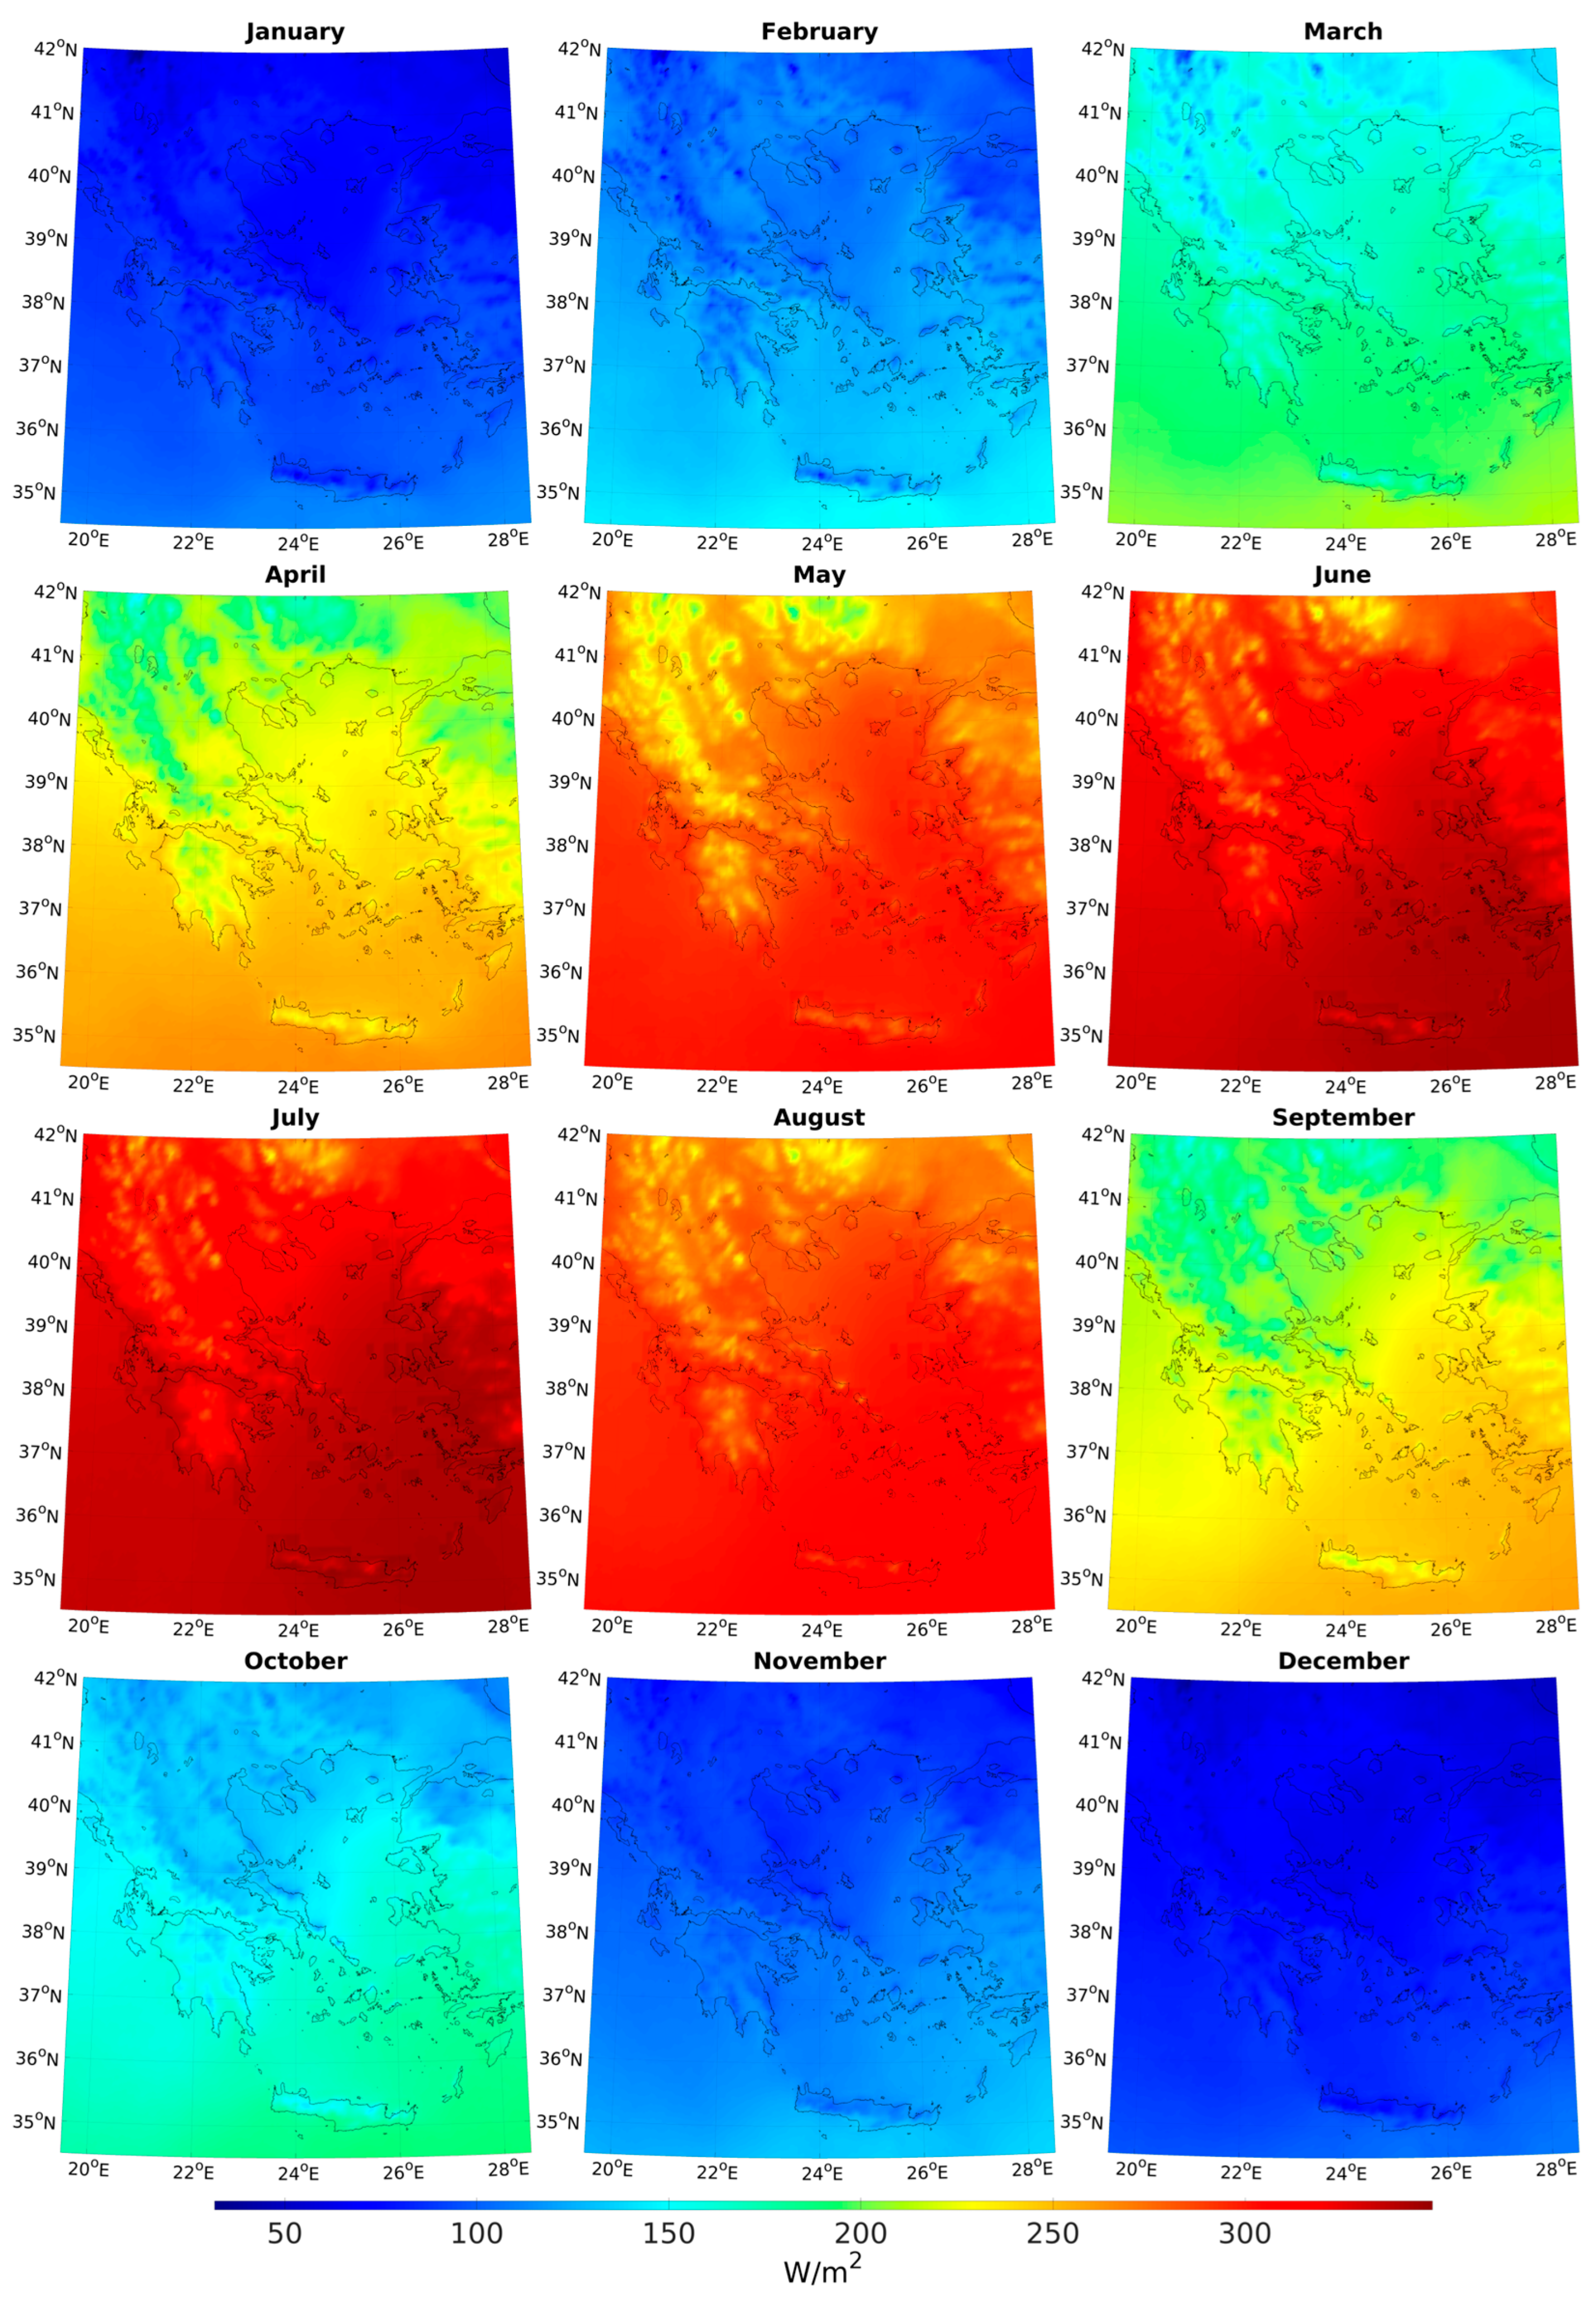
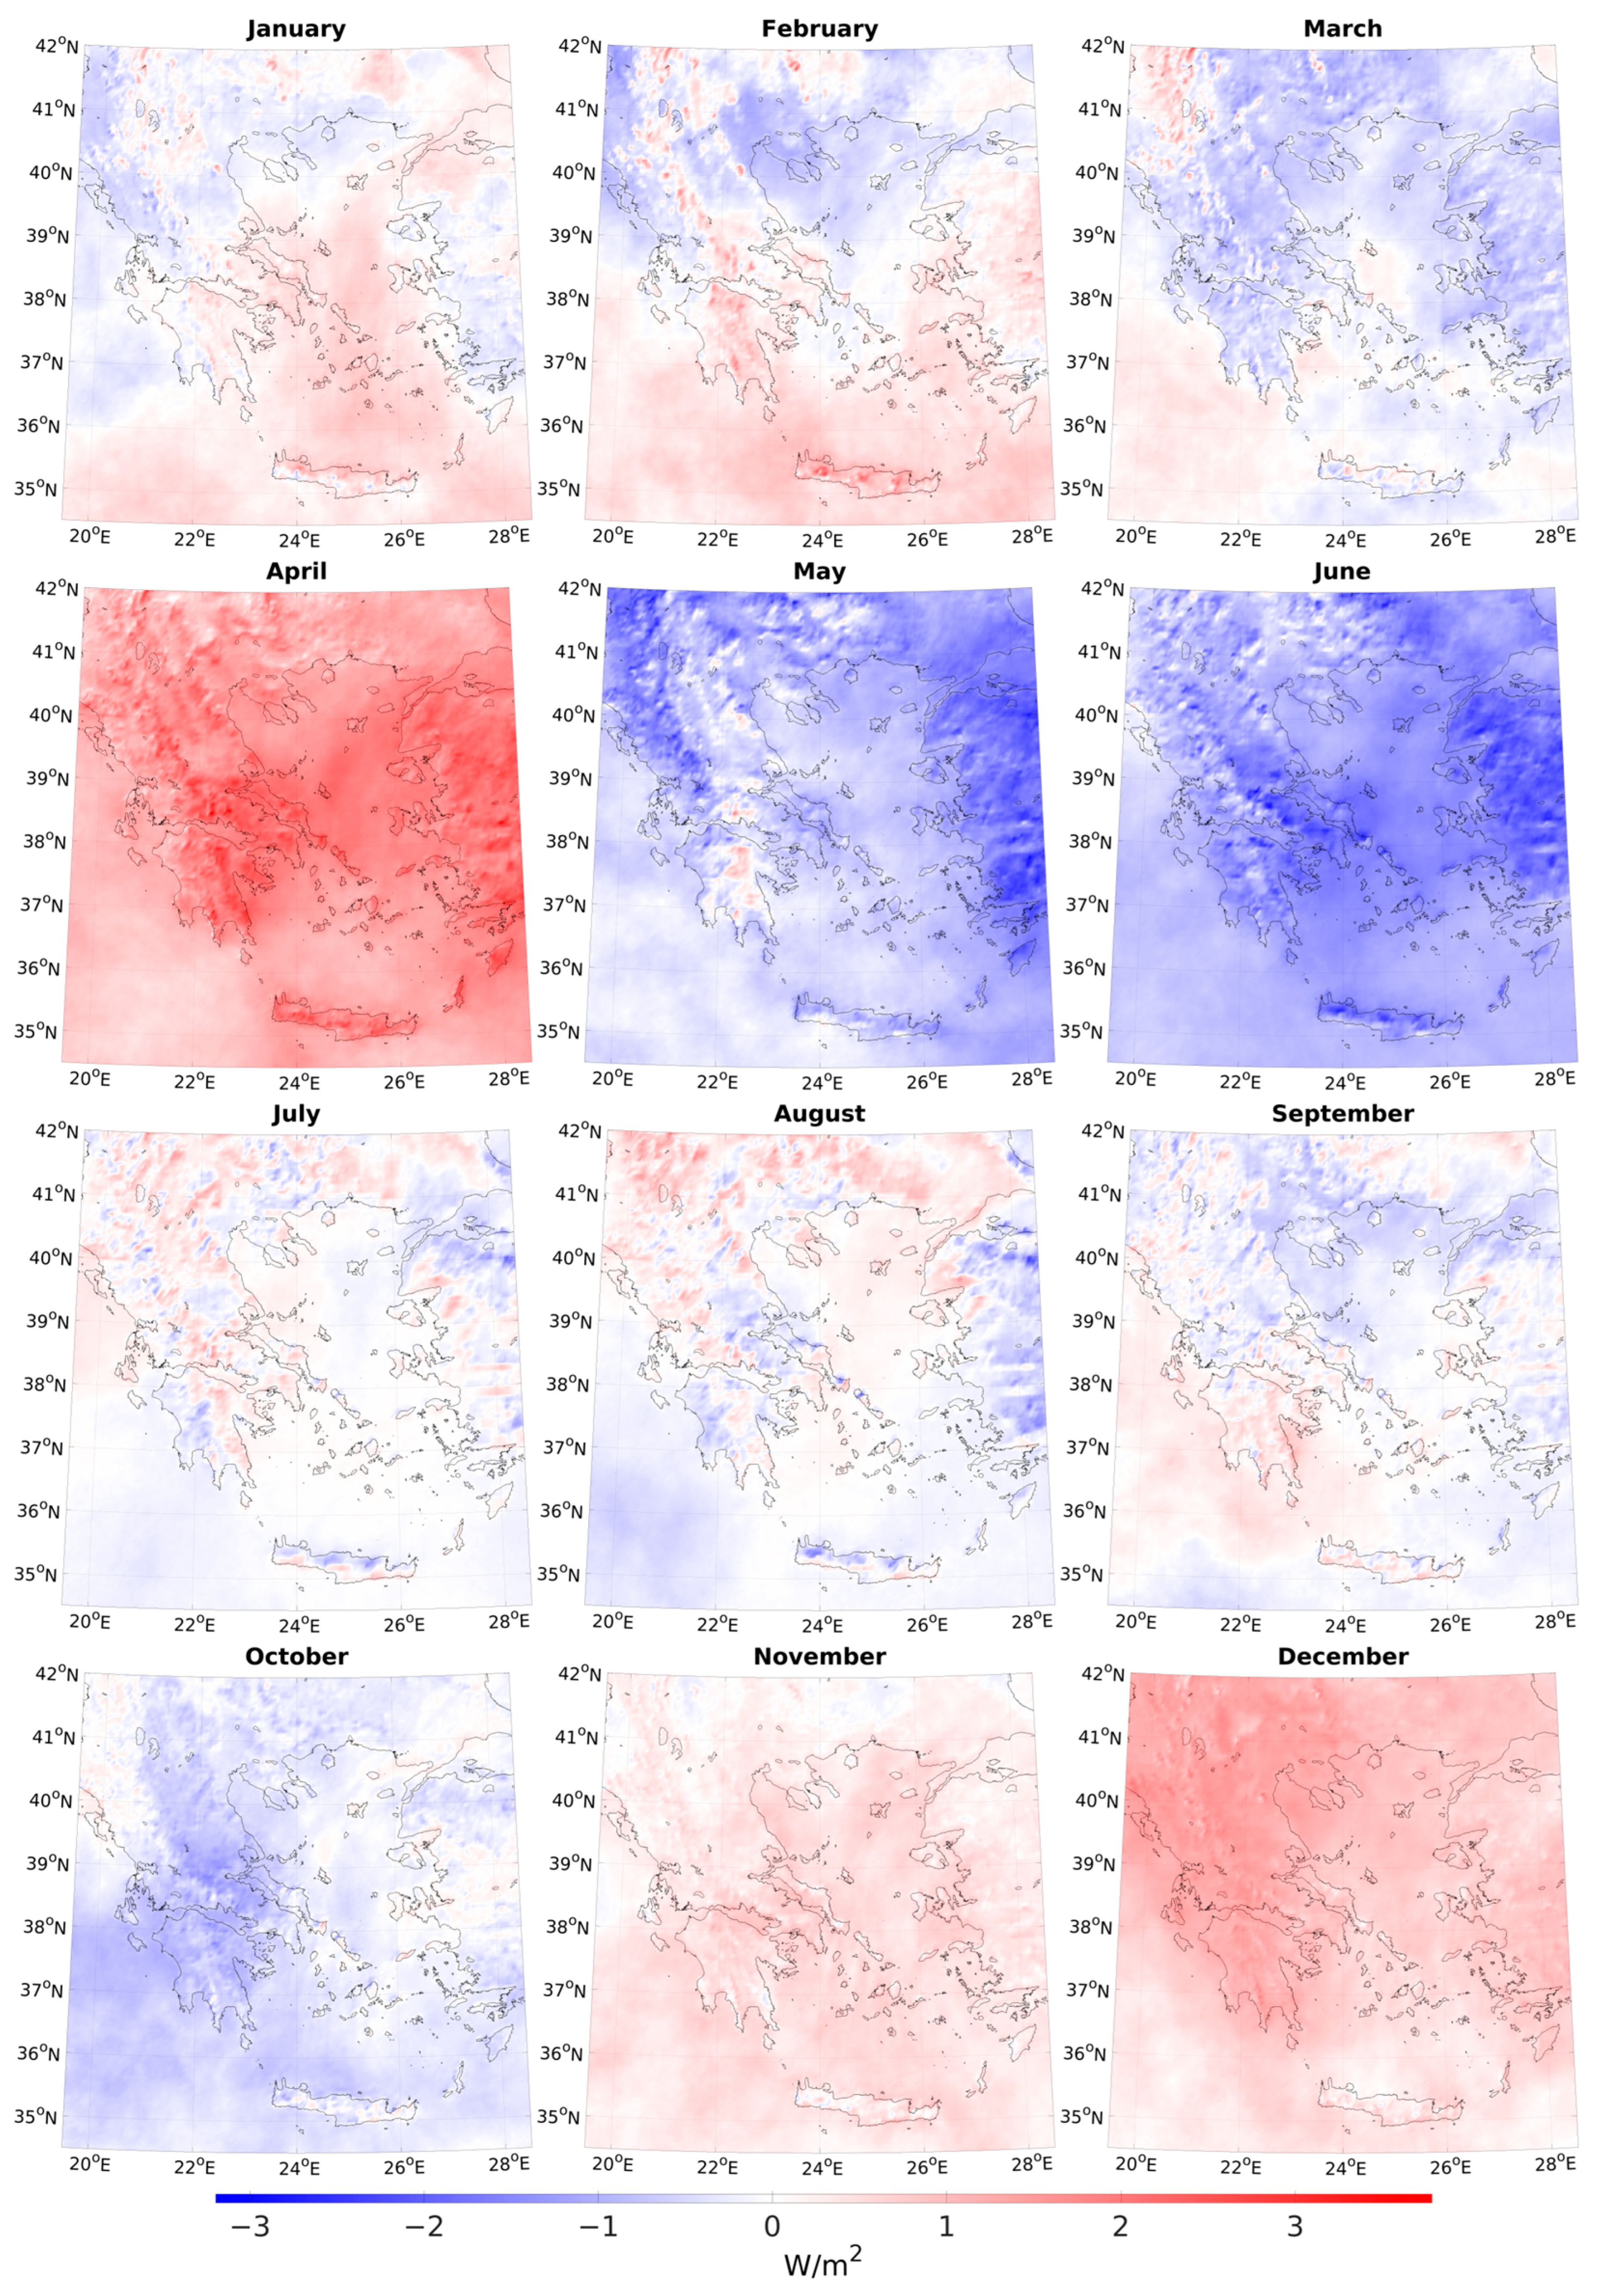
Rate of Change in GHI (W m−2 month−1) per Greek Region
RegionJanFebMarAprMayJunJulAugSepOctNovDec
EastMac&Thrc−0.04−0.30−0.521.31−1.04−1.260.050.24−0.25−0.220.220.95
CentrMac−0.15−0.54−0.601.44−0.79−0.910.050.08−0.38−0.360.271.25
WestMac−0.01−0.26−0.411.64−0.67−1.030.220.10−0.18−0.510.201.39
IonianIslands−0.17−0.31−0.261.15−0.58−0.560.180.010.16−0.290.261.23
Epirus−0.28−0.19−0.361.47−1.14−0.930.080.150.00−0.240.261.37
Thessaly−0.04−0.23−0.511.69−0.57−1.170.11−0.01−0.26−0.560.401.20
WestGR−0.040.10−0.461.52−0.64−1.100.02−0.010.00−0.750.451.26
CentrGR0.240.10−0.322.05−0.62−1.520.13−0.05−0.10−0.630.521.01
Attica0.380.15−0.071.92−0.64−1.650.090.050.12−0.440.570.84
Peloponnese0.120.41−0.211.76−0.30−1.29−0.01−0.100.30−0.670.501.09
NorthAegean0.260.01−0.441.86−0.93−1.51−0.040.08−0.10−0.130.480.73
SouthAegean0.460.23−0.151.59−0.79−1.23−0.01−0.05−0.06−0.250.450.54
Crete0.400.70−0.121.46−0.57−1.14−0.08−0.140.00−0.380.400.39
Table 2. Annual regional GHI and PV-production trends (rates of change), monetary equivalents, and carbon savings.
RegionRoC-GHI
(W m−2 Year−1)
RoC-PV
(kWh Year−1)
Monetary Equivalent (EUR/kWh)CO2 Equivalent (kg)
EastMac&Thrc−0.88−0.96−0.05−0.67
CentrMac−0.67−0.73−0.04−0.51
WestMac0.460.510.030.35
Epirus0.170.180.010.13
IonianIslands0.810.900.050.63
Thessaly0.050.060.000.04
WestGR0.340.370.020.26
CentrGR0.800.880.050.62
Attica1.311.440.081.00
Peloponnese1.591.750.091.20
NorthAegean0.270.290.020.21
SouthAegean0.730.800.040.56
Crete0.921.010.050.71
Table 3. Regional consumption and its trend, energy adequacy percentage for 1% PV coverage, earnings, and metric megatons of CO2 emissions avoided corresponding to the PV-covered area that meets the energy demand of each region.
Region5-Year Average Consumption (TWh)Consumption Trend
(GWh/Year)
Energy Adequacy (%)Earnings (Million EUR)CO2 Avoided (Mt)
EastMac&Thrc2.2−14.2483.3119.51.55
CentrMac7.1−152.0200.1382.44.95
WestMac0.8−22.1848.245.00.58
Epirus1.3−9.4550.767.90.88
IonianIslands1.0+15.6175.254.00.70
Thessaly2.7−83.3388.2147.41.91
WestGR2.3−54.137.8123.01.59
CentrGR2.7−44.0432.4147.61.91
Attica14.6−296.920.0788.810.20
Peloponnese2.4−30.350.0127.41.65
NorthAegean0.6−14.6464.534.40.44
SouthAegean2.0+79.1203.1109.51.42
Crete2.7+27.4235.8148.71.92
Table 4. Integrated assessment of PV performance, energy adequacy, and associated economic and environmental impacts.
RegionRoC-GHI
(W m−2 Year−1)
RoC-PV
(kWh kWp−1 Year−1)
Consumption Trend
(GWh Year−1)
1% PV-Covered Area Energy Adequacy (%)PV-Covered Area Percentage for Fully Meeting Demand (%)Earnings (Million EURCO2 Emissions
Avoided (Mt)
EastMac&Thrc−0.88−0.96−14.2483.30.21119.51.55
CentrMac−0.67−0.73−152.0200.10.50382.44.95
WestMac0.460.51−22.1848.20.1245.00.58
Epirus0.170.18−9.4550.70.1867.90.88
IonianIslands0.810.90+15.6175.20.5754.00.70
Thessaly0.050.06−83.3388.20.26147.41.91
WestGR0.340.37−54.137.82.64123.01.59
CentrGR0.800.88−44.0432.40.23147.61.91
Attica1.311.44−296.920.05.00788.810.20
Peloponnese1.591.75−30.350.01.99127.41.65
NorthAegean0.270.29−14.6464.50.2134.40.44
SouthAegean0.730.80+79.1203.10.49109.51.42
Crete0.921.01+27.4235.80.42148.71.92
Disclaimer/Publisher’s Note: The statements, opinions and data contained in all publications are solely those of the individual author(s) and contributor(s) and not of MDPI and/or the editor(s). MDPI and/or the editor(s) disclaim responsibility for any injury to people or property resulting from any ideas, methods, instructions or products referred to in the content.

